1
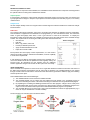
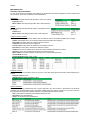
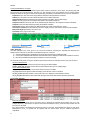
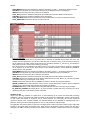
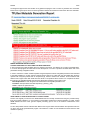
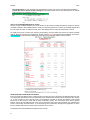
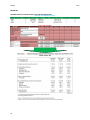
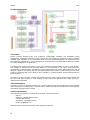
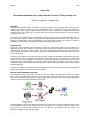
PhUSE 2015 Paper TS08 The Automated Metadata-driven Table Generation Process (TFLGen) at Amgen Inc. Neil Lyon, Amgen Inc., Uxbridge, UK ABSTRACT Every day near-identical programs are written by countless programmers to create similar tables. They have been created in this manner for the last 20+ years, sometimes with macros, sometimes re-using code, but always by ® manually editing SAS programs. Amgen recently developed a suite of single purpose modular SAS macros and wondered if there was a better way to use them rather than having users learn what they do and then manually inserting them into code. The solution is the metadata-driven automated table generation process (TFLGen). By breaking tables down into their components, areas of repetition were identified and metadata then used to describe each component in a single place, simplifying the process and optimizing re-use. Using familiar, intuitive user interfaces to supply this metadata, the time to create and update table producing SAS programs was reduced. INTRODUCTION Amgen has a suite of standard end-to-end macros to produce our most common outputs. They were written over a decade ago and have been modified in the intervening years to add more functionality. These macros have grown rather large and have become hard to maintain. The macro that produces tiered summary tables has 9554 lines of code, a 60 page user manual, requires a user to specify up to 76 input parameters and produces a log that can grow to over 100,000 lines! In response to this problem, all processes required to produce a table were identified and refactored until the lowest common actions were found. SAS macros were written to perform these actions. The macros are then combined and built upon to form a suite of modular macros that can be used to build any table. This generated many macros that would require users to understand and use correctly; not the easiest of tasks. To simplify the use of these macros a WYSIWYG interface was conceived that would allow users to describe the statistics they required using metadata and SAS terminology. This paper will describe how Amgen approached the problem and how the solution was designed and implemented, together with examples of some commonly produced tables. EXISTING TABLE GENERATION PROCESS Every analysis at Amgen has a master list of all TFLs that are required, called the Program Index. The Program Index is an Excel spreadsheet that has one row for every output, storing information such as the output number, titles, footnotes, output and program names alongside details of the programmer, tester and the testing status. When saved the Program Index makes a plaintext version of itself. The SAS programmer writes a SAS program to generate, format and report the necessary statistics (utilizing macros where applicable) to generate the output. When the SAS program is run it reads in the plaintext version of the Program Index and extracts the information from the row that has been identified within the program. This information is added prior to the reporting stage. 1 PhUSE 2015 The screenshot below shows the typical output specific information that is currently stored within the Program Index. REQUIREMENTS Prior to starting work on a solution the high level requirements that would drive the design of the solution were identified: 1) Leverage the new modular macro library that was created to replace the ageing standard macros. 2) Maximize the re-use of information, reducing duplication of effort. 3) Minimize the information that is supplied. 4) Create a tool that is flexible enough to produce as many commonly produced tables as possible. 5) Have a simple to use, intuitive interface. DESIGN The end product of TFLGen is a tabular RTF report. Before developing a product that creates these reports, we required a detailed understanding of the structure of various tables. The first step was to break down a selection of tables into their components. THE ANATOMY OF A TABLE Each table component was analyzed and categorized into distinct types that could be described using metadata. The figure below highlights some commonly occurring components and the categories they were assigned to. Three distinct component types and their metadata were identified: Output specific components, many of which are already stored within the Program Index. Analysis level components that can be repeatedly used by many tables within an analysis. Table shell components that can be used by several outputs in an analysis (or even across analyses), but are combined with different analysis level and output specific metadata (e.g. a demography table repeated for multiple populations). Two distinct table types were identified, tiered tables such as adverse events and concomitant medications and what Amgen call base tables containing non-tiered categorical and univariate type descriptive statistics, such as baseline demography and safety summaries by visit. These table types will be referred to as tiered and base tables respectively. 2 PhUSE 2015 METADATA STORAGE SOLUTIONS Once the types of components were identified, the metadata that would describe each component was designed and the optimal location for storing each metadata item decided. Output specific It was decided to leverage the output specific information that already exists in the Program Index. It is already used by all programmers at Amgen to keep the output specific information separate from the SAS program, so is a widely understood tool. Analysis level As each analysis already has its own Program Index it seemed logical to extend the workbook to include the analysis level information. Table shell The remaining table shell information comes from components that describe the statistics and their presentation. This information is supplied from the statistician to the programmer by a TFL shell Word document. The inset below shows a typical demography table shell, it uses a grid structure to hold all the information. To simplify the transcription of table shell information into metadata we wanted to mimic the shell structure in the metadata storage solution. The requirements for the storing and editing of the table shell information are: Grid structure Edit cells Move, copy, delete, insert rows Provide pre-filled drop-down lists Apply conditional statements to cells Export the contents to XML Excel provides the vast majority of these requirements, so it was used to develop the working prototype. Paired with Visual Basic, it has the capability to cover all the requirements. It was decided to use XML as the transport format for the metadata. It is a much more flexible format than the plaintext that was originally used by the Program Index. By decoupling the user interface from the underlying TFLGen application changes can be made to either part much more easily. USING THE METADATA All the metadata are compiled from each source into a single SAS dataset that reflects the structure and content of the table being produced and describes how the output will be displayed. The metadata dataset is then passed through a series of macros that read the contents and write SAS code to generate the statistics, apply the formatting and then produce the report. This metadata dataset has several advantages: 1) The metadata dataset can be reviewed to validate the table. 2) The metadata dataset can be merged onto the statistics that get derived in the generated program to access the formatting information. This saves hardcoding the information into the generated SAS program. 3) By separating the formatting and labelling elements from the SAS program, changes can be made just to the SAS dataset that will not require a change to the SAS program. However, fundamental changes to the output such as new statistics will require both the SAS dataset and SAS program to be updated. 4) The metadata dataset can be fed through a macro that will validate the contents for appropriateness (e.g. a mean can only be calculated on a numeric variable). The process flow now looks like that in the diagram below. 3 PhUSE 2015 IMPLEMENTATION EXTENDING THE PROGRAM INDEX To store the analysis level metadata, the following new worksheets were added alongside the main worksheet that lists all outputs. These new worksheets are described below. Populations Contains metadata that describes all populations used in the analysis. Population name. Where Clause describing the population with a SAS expression. Subsets Contains metadata that describes all subsets of populations used in the analysis. Subset name. Where Clause describing the subset with a SAS expression. Treatment Column Headers Contains metadata that describes the different sets of treatment colunms used within the tables in an analysis. Header name attributed to a row to describe which treatment header set it belongs to. Span Labels are labels that span multiple treatment columns. Treatment order that columns are to appear in. Column Label to apply above the statistics in the treatment columns. Data Set that can be used to describe the treatment columns. Variable present on the dataset whose values are used to describe the treatment columns. Quantifying value of the variable that describes the treatment columns. Where Clause to describe treatment groups using more complex SAS expressions. Column Width in inches. Column Alignment is left, center or right. Template Locations Contains metadata that describes where the sources of the table shell specific information (table templates) are located. Template Location name. UNIX Directory for each of template location. General Information Contains the remaining metadata that has not been captured in any other location. It describes the file locations needed by the generated SAS program, the subject variable used in the analysis, locations for any macros that may be requried by the programmer and file locations for any dataset libraries that are needed. Item is a keyword that describes the metadata stored in the row. Description of the metadata item. Value to be assigned to the metadata item. 4 PhUSE 2015 Linking the Metadata to an Output The metadata described in the extended Program Index needs to be linked to each output. The primary page that lists all outputs and contains the titles, footnotes, etc. was extended so the new metadata can be selected. Where possible the fields use drop-down lists that are dynamically generated from metadata names in the new worksheets. Population has a drop-down list of all populations described in the Populations worksheet. Subset has a drop-down list of all subsets described in the Subsets worksheet. Numerator Where SAS expressions limit all data reported in the table, does not affect big N. Header has a drop-down list of all headers described in the Headers worksheet. Template Location has a drop-down list of all table template locations in the Template Locations worksheet. Template names the table template providing the statistics metadata. Sort Section lists the sections within the table template that require sorting based on counts. Sort Source Treatment lists the treatment columns to supply counts to sort sections within the table template. Body Font Height specifies the font size to use. Orientation of the page for the output. Allow Code Generation prevents SAS program being inadvertently overwritten. TABLE TEMPLATE The table template is the name given to the new Excel workbook containing the metadata that describes the statistics in the main body of the table. The metadata is split into 3 sections: 1) General metadata that is applicable to the whole table described by the table template. 2) Column label metadata that describes what information will be displayed in leftmost and treatment columns. 3) Main body metadata that describes the statistics and their formatting. As mentioned earlier there are 2 types of table: tiered and base. Below are examples of both, they have the same: General metadata items: sps_generate_module contains the keyword for this type of table template. section_wrap_flag describes whether sections will be allowed to wrap over multiple pages. Column label metadata items: col_width specifies the width in inches of the leftmost column in the table. col_align specifies the alignment (left/center/right) of the leftmost column in the table. col_big_n_label specifies whether or not the big N are to be displayed in the treatment columns. col_n_pct_label specifies the label underneath the big N that shows what statistics are being presented. Tiered Table Template Main body metadata: METADATA uses keywords from a drop-down menu to describe the metadata present within the row. In this example the level_n specifies the tier level for the hierarchical statistics; blank_row shows where a blank row will be inserted in the table. T1 is the text that is to be displayed in the leftmost column in the table. In tiered tables the values for rows where METADATA is level_1 or greater will be replaced with the actual values from the variables specified in VARIABLE. 5 PhUSE 2015 TREATMENTS describes how statistics are displayed, the trailing “x” after a “.” showing the decimal precision. STATISTIC uses keywords from a drop-down list to specify the statistics that are to be displayed. INDENT shows how many times the T1 field is to be indented. DATA_SET specifies the dataset that will provide the variable from which the statistics will be derived. VARIABLE specifies the variable that statistics will be derived from. SORT_SECTION identifies parts of the table that can be sorted based on counts in the treatment columns. SORT_DIRECTION specifies the direction the sort should use. Base Table Template Main body metadata: METADATA uses keywords from a drop-down menu to describe the metadata present within the row. In this example the label specifies the row will have a text label, but no statistics; blank_row shows where a blank row will be inserted in the table; statistic shows that the row will display statistics; by_start and by_end identify the start and end point for a section that contains by-processing. T1 is the text that is to be displayed in the leftmost column in the table. The keyword !BY_DISPLAY_VARIABLE! will be replaced at run-time by the values present in the variable specified in the BY_DISPLAY_VARIABLE, allowing dynamic text generation. TREATMENTS describes how statistics are displayed, the trailing “x” after a “.” showing the decimal precision. STATISTIC uses keywords from a drop-down list to specify the statistics that are to be displayed. INDENT shows how many times the T1 field is to be indented. DATA_SET specifies the dataset that will provide the variable from which the statistics will be derived. VARIABLE specifies the variable from which statistics will be derived or if SPS_META = by_start then it provides the variable that the by-processing will use for sorting. QUANT specifies the particular value of VARIABLE for which to calculate the categorical statistics. WHERE_CLAUSE takes a SAS expression that is used for complex descriptions of data to present categorical statistics for or to limit the data being reported in univariate type statistics. DENOMINATOR takes a SAS expression describing alternative denominators to the big N for percentages. BY_DISPLAY_VARIABLE when SPS_META = by_start it provides a variable that the by-processing can use for displaying in the label on the leftmost column of the table. RUNNING TFLGEN Amgen uses SAS Grid installed on a UNIX server. To take advantage of its concise and robust XML processing ® capabilities, a Groovy application was written that reads the Program Index metadata file, creating a short program for each output that TFLGen is required to run for. These programs run concurrently and for each output will generate a dataset of the compiled metadata. The metadata dataset is then validated for appropriateness and if passed is used to generate the SAS program that, once run, will produce the required output. The application has several options so that users can target specific outputs, all outputs created using a single table template or all outputs within the Program Index. When TFLGen has finished running it provides the user with a message in the UNIX console that informs the user whether it was successful or if there were errors. Error messages 6 PhUSE 2015 are designed to pinpoint the exact location of any problems helping the user to correct any mistakes. The screenshot below shows a typical report with a successful generation followed and another that has issues with some metadata. DESIGN PROBLEMS AND SOLUTIONS TOO MANY NEAR-IDENTICAL TABLE TEMPLATES BEING GENERATED It was found that many table templates were very similar to each other, only differing by a couple of metadata items. In a normal SAS program this would warrant the development of a macro to produce all similar tables with macro parameters allowing changeable values. In order to reduce the number of table templates being developed the idea of changeable parameters was extended to the table templates. If an item could be replaced across versions of a table then the changeable item would be replaced with a keyword prefixed with an ampersand (&), similar to SAS macro variables. A new worksheet was added to the Program Index that would allow the values to be specified. When TFLGen runs it replaces all values that it finds in the metadata dataset that match the parameters specified in the Program Index. Base Output Name on main Program Index worksheet that changeable parameter is for. Parameter name specified in the table template (e.g. &level_0_text). Value to replace the parameter with. Description of the parameter’s purpose. USERS LIMITED TO USING DATASETS DIRECTLY FROM A LIBRARY TFLGen was originally conceived to use ADaM datasets that are normally considered as being one procedure away from the necessary statistics (i.e. no processing or manipulation of data prior to deriving statistics). In reality, several ADaM datasets fall short of this goal and require processing prior to use or the creation of data-driven macro variables. To solve this problem another worksheet was added to the Program Index that would allow user-specified code to be run at the start of the generated SAS program. This allows the creation of work datasets that would have the data needed for reporting. 7 PhUSE 2015 Base Output Name on main Program Index worksheet that custom code is to be used with (allows wildcards). Custom Init Code to Include at Start of Program is field where SAS code can be entered (which can include calls to external user-developed macros). HOW TO QC PROGRAMS GENERATED BY TFLGEN TFLGen is a fully validated software suite whose results can be trusted to reliably generate the numbers as per the metadata compiled in the metadata dataset. Initially we allowed programmers to review the metadata dataset and the RTF output. This was a cumbersome task as the SAS datasets are not always the easiest files to review. To simplify this process, TFLGen now creates a pseudo-table in the same folder that contains an output's metadata data set. Below is a screenshot of a typical file. TFLGen adds the red text that shows what metadata is used and the blue highlighting that shows what metadata has changed since the metadata dataset was last created. DEVELOPING MANY INTERCONNECTED MACROS Due to the interconnectedness of the underlying macros used by TFLGen it was hard for multiple developers to work on modules and make decisions as they could easily have ramifications for parts that other developers were working on. To get a handle on all the moving pieces, one programmer oversaw the primary development, putting initial versions of all the macros in place with all basic functionality present. The connections where data is passed between macros and the XML files that come from the Program Index and the table template were identified and areas of commonality were determined. To avoid tramping macro parameters throughout the application to where they are utilized, data sets were used to pass information across macros. The different areas were distributed amongst the team to finish: 8 PhUSE 2015 Changes to the Program Index and the new table template Groovy application that sets up the area, performs preliminary validation of the Program Index, runs concurrent SAS jobs and generates report of successes and error messages Metadata dataset generation Metadata dataset validation SAS program generation o Data preparation o Statistic derivation o Applying formatting metadata to derived statistics o Reporting Close contact was required amongst all developers to ensure that any changes that could affect another area were disclosed in a timely and efficient manner. TESTING TFGLEN FOR ROBUSTNESS, RELIABILITY AND VALIDITY When creating an application such as TFLGen it is essential that it runs without problems and generates the expected numbers every time. To ensure that the software suite performs as expected every module undergoes an extensive unit test to ensure that its behavior follows the individual requirements and returns the expected results. Once the whole software package was complete, integration testing was performed to prove that the individual elements worked as a whole. This involved creating Program Index and table templates that would test all the functions that are available within TFLGen. The results were dual-programmed for validity. Prior to full production roll-out a limited production roll-out tested TFLGen with a few handpicked studies to iron out any issues. The outputs were dual-programmed to further prove that the generated numbers were correct. TFLGEN COVERAGE Currently TFLGen is expected to produce at least 65% of the tables in an analysis. TFLGen Can Produce TFLGen Cannot Produce Demography Complex statistics o Analysis of variance/covariance Patient Disposition o Regression Analysis Set Inclusion and Exclusion o Binomial statistics Baseline Characteristics o Kaplan-Meier Medical History Treatment differences Protocol Deviations Rates Safety Summaries by Visit (Labs/Vitals/ECG) 1 o Exposure adjusted event rates Adverse Events (n %) 1 o Exposure adjusted subject rates Concomitant Medications 1 ...most tables with n, % or univariate statistics The next release of TFLGen will include these additional analysis types. TFLGen is not expected to be able to produce all tables. SAS is a highly flexible tool and as soon as any simplification of its use is attempted this flexibility is naturally reduced. If TFLGen were designed to produce complex tables such as analysis of covariance, it would require a much more complex and crowded table template, which defeats the requirement of having a simple and intuitive interface. To keep the application easy to use and maintain, TFLGen has been deliberately limited to only attempt production of simpler descriptive statistics. NEXT STEPS TFLGen is not yet an optimized solution for Amgen. There are some outputs that cannot yet be created with the application, but should be possible with some minor changes. We are looking to increase coverage and simplify the process with new features within the Program Index and table templates. There are multiple copies of the Excel table template file across the company. We intend to simplify this by creating a single template editor that will import and export the XML version of the table template to and from itself. This will enable users to always use the latest version of table template without needing to upgrade the table template and will make rolling out of new table templates simpler and more controlled. The functions of the base and tiered templates can be combined into a single table template, enabling more complex tables to be created. Update table template to allow users to declare a variable that will contain the decimal precision such as can exist on the ADaM LB domain. Update table template to generate exposure adjusted event rates and exposure adjusted subject rates. Update table template to allow formats to be defined, removing the need to specify the values to be displayed in the output. 9 PhUSE 2015 EXAMPLES ADVERSE EVENTS BY SYSTEM ORGAN CLASS AND PREFERRED TERM Analysis level metadata (header) Table shell metadata 10 PhUSE 2015 BASELINE DEMOGRAPHICS Analysis level metadata (header) Table shell metadata 11 PhUSE 2015 TFLGEN PROCESS FLOW CONCLUSION TFLGen increases standard macro code consistency, maintainability, reusability, and extensibility through modularization. It eliminates redundancy (and its inherent risk) in specifying input parameters by using centralized metadata. Table templates can be re-used both within and across analyses/studies/TAs. QC requirements have been minimized (metadata QC vs. dual programming). It increases resource portability between teams by providing a consistent framework for TFL production. It is expected that TFLGen can be used to produce >65% of tables for a typical analysis. In a test, a single TFLGen user managed to generate 462 out 697 (66%) tables on a very large study in only 3 days. These tables were produced using 37 table templates. The tables that could not be produced were efficacy tables that TFLGen was not designed to generate. This was the first time these table templates were created. For further analyses on the same product it is anticipated that many of them can be re-used with no or little amendment, further reducing the time to create the tables. Feedback for TFLGen has been overwhelmingly positive with many teams reporting quicker table production and QC, with further gains expected on future analyses as teams have more experience and a larger pool of preconstructed table templates. ACKNOWLEDGMENTS I would like to thank my colleagues Neville Cope, Jack Fuller, Benno Kurch and Chris St Peter for their invaluable help in designing and coding TFLGen. I would also like to thank David Edwards and Mark Stetz for their patience and support in bringing TFLGen to fruition. CONTACT INFORMATION Your comments and questions are valued and encouraged. Contact the author at: Neil Lyon Amgen Inc., Uxbridge Business Park Uxbridge,UB8 1DH, UK Work Phone: +44 (0)1895 525424 Email: [email protected] Brand and product names are trademarks of their respective companies. 12