1
RIGHT. FROM THE START.
RIGHT. FROM THE START.
RIGHT. FROM THE START.
RIGHT. FROM THE START.
RIGHT. FROM THE START.
RIGHT. FROM THE START.
GRAPH Presentation
Graphing System
Reference Manual
RIGHT. FROM THE START.
RIGHT. FROM THE START.
RIGHT. FROM THE START.
RIGHT. FROM THE START.
RIGHT. FROM THE START.
RIGHT. FROM THE START.
RIGHT. FROM THE START.
DSM-00059-01
© 1995 Alpha Microsystems
REVISIONS INCORPORATED
REVISION
DATE
00
August 1988
01
April 1990
GRAPH Reference Manual
To re-order this document, request part number DSO-00059-00.
The information contained in this manual is believed to be accurate and reliable. However, no responsibility
for the accuracy, completeness or use of this information is assumed by Alpha Microsystems.
This document applies to GRAPH Versions 1.2 and later
This document may contain references to products covered under U.S. Patent Number 4,530,048.
The following are registered trademarks of Alpha Microsystems, Santa Ana, CA 92799:
AMIGOS
AlphaBASIC
AlphaFORTRAN 77
AlphaMATE
AlphaWRITE
VIDEOTRAX
AMOS
AlphaCALC
AlphaLAN
AlphaNET
CASELODE
Alpha Micro
AlphaCOBOL
AlphaLEDGER
AlphaPASCAL
OmniBASIC
AlphaACCOUNTING
AlphaDDE
AlphaMAIL
AlphaRJE
VER-A-TEL
The following are trademarks of Alpha Microsystems, Santa Ana, CA 92799:
AlphaBASIC PLUS
DART
inFront/am
AlphaVUE
ESP
AM-PC
MULTI
All other copyrights and trademarks are the property of their respective holders.
ALPHA MICROSYSTEMS
2722 S. Fairview St.
P.O. Box 25059
Santa Ana, CA 92799
AMTEC
inSight/am
Table of Contents
Page i
TABLE OF CONTENTS
CHAPTER 1 - INTRODUCTION
1.1
WHAT IS GRAPH? . . . . . . . . . . . . . . . . . . . . . . . . . . . . . . . . . . . . . . .
1.2
PREREQUISITES . . . . . . . . . . . . . . . . . . . . . . . . . . . . . . . . . . . . . . . .
1.3
INSTALLATION INSTRUCTIONS . . . . . . . . . . . . . . . . . . . . . . . . . . . .
1.4
AUDIENCE . . . . . . . . . . . . . . . . . . . . . . . . . . . . . . . . . . . . . . . . . . . . .
1.5
DOCUMENTATION . . . . . . . . . . . . . . . . . . . . . . . . . . . . . . . . . . . . . . .
1.6
REFERENCE BOOKS . . . . . . . . . . . . . . . . . . . . . . . . . . . . . . . . . . . . .
1.7
HOW THIS BOOK IS ORGANIZED . . . . . . . . . . . . . . . . . . . . . . . . . . .
1.8
PRINTING CONVENTIONS . . . . . . . . . . . . . . . . . . . . . . . . . . . . . . . .
1-1
1-1
1-1
1-1
1-2
1-2
1-3
1-3
CHAPTER 2 - GENERAL CONCEPTS
2.1
OVERVIEW . . . . . . . . . . . . . . . . . . . . . . . . . . . . . . . . . . . . . . . . . . . . .
2.2
DATA TYPES AND ORGANIZATION . . . . . . . . . . . . . . . . . . . . . . . . .
2.3
CHART STYLES . . . . . . . . . . . . . . . . . . . . . . . . . . . . . . . . . . . . . . . . .
2.3.1 Line Chart . . . . . . . . . . . . . . . . . . . . . . . . . . . . . . . . . . . . . . . .
2.3.2 Clustered Bar Chart . . . . . . . . . . . . . . . . . . . . . . . . . . . . . . . . .
2.3.3 Stacked Bar Chart . . . . . . . . . . . . . . . . . . . . . . . . . . . . . . . . . .
2.3.4 Pie Chart . . . . . . . . . . . . . . . . . . . . . . . . . . . . . . . . . . . . . . . . .
2.3.5 Area Chart . . . . . . . . . . . . . . . . . . . . . . . . . . . . . . . . . . . . . . . .
2.3.6 X-Y Chart . . . . . . . . . . . . . . . . . . . . . . . . . . . . . . . . . . . . . . . . .
2.4
CHART OPTIONS . . . . . . . . . . . . . . . . . . . . . . . . . . . . . . . . . . . . . . . .
2.4.1 Axis Scaling . . . . . . . . . . . . . . . . . . . . . . . . . . . . . . . . . . . . . . .
2.4.2 Titles, Legends and Data Labels . . . . . . . . . . . . . . . . . . . . . . .
2.4.3 Text Attributes . . . . . . . . . . . . . . . . . . . . . . . . . . . . . . . . . . . . .
2.4.4 Color . . . . . . . . . . . . . . . . . . . . . . . . . . . . . . . . . . . . . . . . . . . .
2.4.5 Data Point Markers . . . . . . . . . . . . . . . . . . . . . . . . . . . . . . . . .
2.5
CHART STORAGE AND RETRIEVAL . . . . . . . . . . . . . . . . . . . . . . . .
2.5.1 User Text . . . . . . . . . . . . . . . . . . . . . . . . . . . . . . . . . . . . . . . . .
2-1
2-2
2-3
2-4
2-5
2-6
2-7
2-8
2-9
2-10
2-10
2-10
2-10
2-10
2-11
2-11
2-11
CHAPTER 3 - THE GRAPH INTERFACE
3.1
CALL DEFINITIONS . . . . . . . . . . . . . . . . . . . . . . . . . . . . . . . . . . . . . .
3.2
MEMORY REQUIREMENTS AND USAGE . . . . . . . . . . . . . . . . . . . .
3.3
GRAPH PARAMETER STRUCTURE . . . . . . . . . . . . . . . . . . . . . . . . .
3.3.1 GP.TTL - Chart Title . . . . . . . . . . . . . . . . . . . . . . . . . . . . . . . .
3.3.2 GP.ST1 - Subtitle 1 . . . . . . . . . . . . . . . . . . . . . . . . . . . . . . . . .
3-1
3-2
3-2
3-3
3-3
GRAPH Reference Manual, Rev. 01
Page ii
Table of Contents
3.3.3 GP.ST2 - Subtitle 2 . . . . . . . . . . . . . . . . . . . . . . . . . . . . . . . . .
3.3.4 GP.FOT - Footnote . . . . . . . . . . . . . . . . . . . . . . . . . . . . . . . . .
3.3.5 GP.XLB - X-axis Label . . . . . . . . . . . . . . . . . . . . . . . . . . . . . . .
3.3.6 GP.YLB - Y-axis Label . . . . . . . . . . . . . . . . . . . . . . . . . . . . . . .
3.3.7 GP.YST - Y-axis Start Value . . . . . . . . . . . . . . . . . . . . . . . . . .
3.3.8 GP.YEN - Y-axis End Value . . . . . . . . . . . . . . . . . . . . . . . . . .
3.3.9 GP.YIN - Y-axis Increment . . . . . . . . . . . . . . . . . . . . . . . . . . .
3.3.10 GP.YPR - Y-axis Prescale . . . . . . . . . . . . . . . . . . . . . . . . . . . .
3.3.11 GP.XST - X-axis Start Value . . . . . . . . . . . . . . . . . . . . . . . . . .
3.3.12 GP.XEN - X-axis End Value . . . . . . . . . . . . . . . . . . . . . . . . . .
3.3.13 GP.XIN - X-axis Increment . . . . . . . . . . . . . . . . . . . . . . . . . . .
3.3.14 GP.XPR - X-axis Prescale . . . . . . . . . . . . . . . . . . . . . . . . . . . .
3.3.15 GP.TXA - Default Text Attributes . . . . . . . . . . . . . . . . . . . . . . .
3.3.16 GP.FAP - Fill Area Pattern Table . . . . . . . . . . . . . . . . . . . . . . .
3.3.17 GP.TYP - Type of Chart . . . . . . . . . . . . . . . . . . . . . . . . . . . . . .
3.3.18 GP.XTP - X-axis Type . . . . . . . . . . . . . . . . . . . . . . . . . . . . . . .
3.3.19 GP.YTP - Y-axis Type . . . . . . . . . . . . . . . . . . . . . . . . . . . . . . .
3.3.20 GP.XGR - X-axis Grid Type . . . . . . . . . . . . . . . . . . . . . . . . . . .
3.3.21 GP.YGR - Y-axis Grid Type . . . . . . . . . . . . . . . . . . . . . . . . . . .
3.3.22 GP.TCL - Text Color . . . . . . . . . . . . . . . . . . . . . . . . . . . . . . . .
3.3.23 GP.BCL - Background Color . . . . . . . . . . . . . . . . . . . . . . . . . .
GP.LGN - LEGEND TYPE . . . . . . . . . . . . . . . . . . . . . . . . . . . . . . . . . .
3.4.1 GP.MRK - Data Point Marker Type . . . . . . . . . . . . . . . . . . . . .
GRAPH DATA STRUCTURE . . . . . . . . . . . . . . . . . . . . . . . . . . . . . . .
3.5.1 GR.NUM - Data Range Number . . . . . . . . . . . . . . . . . . . . . . .
3.5.2 GR.CNT - Count of Data Points . . . . . . . . . . . . . . . . . . . . . . . .
3.5.3 GR.FLG - Data Range Flag . . . . . . . . . . . . . . . . . . . . . . . . . . .
3.5.4 GR.CLR - Data Range Color . . . . . . . . . . . . . . . . . . . . . . . . . .
3.5.5 GR.LST - Data Range Linestyle . . . . . . . . . . . . . . . . . . . . . . .
3.5.6 GR.TTL - Data Range Title . . . . . . . . . . . . . . . . . . . . . . . . . . .
3.5.7 GR.DAT - Data Offset . . . . . . . . . . . . . . . . . . . . . . . . . . . . . . .
3.5.8 Data Element Structure . . . . . . . . . . . . . . . . . . . . . . . . . . . . . .
GE.FLG
Data Element Flag . . . . . . . . . . . . . . . . . . . . . .
GE.TYP
Data Element Type . . . . . . . . . . . . . . . . . . . . .
GE.DTX
X Data Value . . . . . . . . . . . . . . . . . . . . . . . . . .
GE.DTY
Y Data Value . . . . . . . . . . . . . . . . . . . . . . . . . .
GE.LBL
Data Point Label . . . . . . . . . . . . . . . . . . . . . . .
3-3
3-3
3-4
3-4
3-4
3-4
3-4
3-4
3-5
3-5
3-5
3-5
3-5
3-6
3-6
3-6
3-6
3-6
3-7
3-7
3-7
3-8
3-8
3-8
3-8
3-9
3-9
3-9
3-9
3-10
3-10
3-10
3-10
3-11
3-11
3-11
3-11
CHAPTER 4 - GRAPH FUNCTION CALLS
4.1
GO.IMP - REPORT IMPURE AREA SIZE . . . . . . . . . . . . . . . . . . . . . .
4.2
GO.INI - INITIALIZE IMPURE AREA . . . . . . . . . . . . . . . . . . . . . . . . . .
4.3
GO.DSP - DISPLAY CHART . . . . . . . . . . . . . . . . . . . . . . . . . . . . . . . .
4.4
GO.LOD - LOAD A GRAPH DEFINITION FILE . . . . . . . . . . . . . . . . . .
4.5
GO.SAV - SAVE CURRENT CHART IN GRAPH DEFINITION FILE .
4.6
GO.GGP - GET GRAPH PARAMETERS . . . . . . . . . . . . . . . . . . . . . .
4.7
GO.PGP - PUT GRAPH PARAMETERS . . . . . . . . . . . . . . . . . . . . . . .
4.8
GO.GRD - GET RANGE OF DATA . . . . . . . . . . . . . . . . . . . . . . . . . . .
4.9
GO.PRD - PUT RANGE OF DATA . . . . . . . . . . . . . . . . . . . . . . . . . . .
4.10 GO.CSR - CLEAR SINGLE RANGE OF DATA . . . . . . . . . . . . . . . . . .
4-2
4-4
4-5
4-7
4-9
4-11
4-13
4-15
4-17
4-19
3.4
3.5
GRAPH Reference Manual, Rev. 01
Table of Contents
4.11
4.12
Page iii
GO.CAR - CLEAR ALL RANGES OF DATA . . . . . . . . . . . . . . . . . . . .
GO.SUP - SET USER POINTER . . . . . . . . . . . . . . . . . . . . . . . . . . . .
CHAPTER 5 - GDF FILE KEYWORD DEFINITION
5.1
GRAPH PARAMETER KEYWORDS . . . . . . . . . . . . . . . . . . . . . . . . . .
5.1.1 GTY - Type of graph . . . . . . . . . . . . . . . . . . . . . . . . . . . . . . . .
5.1.2 GYT - Y-axis type . . . . . . . . . . . . . . . . . . . . . . . . . . . . . . . . . .
5.1.3 GYS - Y-axis start . . . . . . . . . . . . . . . . . . . . . . . . . . . . . . . . . .
5.1.4 GYE - Y-axis end . . . . . . . . . . . . . . . . . . . . . . . . . . . . . . . . . . .
5.1.5 GYI - Y-axis increment . . . . . . . . . . . . . . . . . . . . . . . . . . . . . . .
5.1.6 GYP - Y-axis prescale value . . . . . . . . . . . . . . . . . . . . . . . . . .
5.1.7 GYG - Y-axis grid type . . . . . . . . . . . . . . . . . . . . . . . . . . . . . . .
5.1.8 GXT - X-axis type . . . . . . . . . . . . . . . . . . . . . . . . . . . . . . . . . .
5.1.9 GXS - X-axis start . . . . . . . . . . . . . . . . . . . . . . . . . . . . . . . . . .
5.1.10 GXE - X-axis end . . . . . . . . . . . . . . . . . . . . . . . . . . . . . . . . . . .
5.1.11 GXI - X-axis increment . . . . . . . . . . . . . . . . . . . . . . . . . . . . . . .
5.1.12 GXP - X-axis prescale value . . . . . . . . . . . . . . . . . . . . . . . . . .
5.1.13 GXG - X-axis grid type . . . . . . . . . . . . . . . . . . . . . . . . . . . . . . .
5.1.14 GTC - Text color . . . . . . . . . . . . . . . . . . . . . . . . . . . . . . . . . . .
5.1.15 GBC - Background color . . . . . . . . . . . . . . . . . . . . . . . . . . . . .
5.1.16 GMT - Data point marker type . . . . . . . . . . . . . . . . . . . . . . . . .
5.1.17 LGN - Legend enable . . . . . . . . . . . . . . . . . . . . . . . . . . . . . . .
5.1.18 GFP - Fill pattern definition . . . . . . . . . . . . . . . . . . . . . . . . . . .
5.1.19 GTA - Text attributes . . . . . . . . . . . . . . . . . . . . . . . . . . . . . . . .
5.1.20 GUP - User parameter text line . . . . . . . . . . . . . . . . . . . . . . . .
5.1.21 GTL - Title . . . . . . . . . . . . . . . . . . . . . . . . . . . . . . . . . . . . . . . .
5.1.22 GS1 - Subtitle 1 . . . . . . . . . . . . . . . . . . . . . . . . . . . . . . . . . . . .
5.1.23 GS2 - Subtitle 2 . . . . . . . . . . . . . . . . . . . . . . . . . . . . . . . . . . . .
5.1.24 GFN - Footnote . . . . . . . . . . . . . . . . . . . . . . . . . . . . . . . . . . . .
5.1.25 GXL - X-axis label . . . . . . . . . . . . . . . . . . . . . . . . . . . . . . . . . .
5.1.26 GYL - Y-axis label . . . . . . . . . . . . . . . . . . . . . . . . . . . . . . . . . .
5.2
GRAPH DATA KEYWORDS . . . . . . . . . . . . . . . . . . . . . . . . . . . . . . . .
5.2.1 GnC - Range color . . . . . . . . . . . . . . . . . . . . . . . . . . . . . . . . . .
5.2.2 GnS - Range linestyle . . . . . . . . . . . . . . . . . . . . . . . . . . . . . . .
5.2.3 GnT - Range title . . . . . . . . . . . . . . . . . . . . . . . . . . . . . . . . . . .
5.2.4 RnDm - Data element . . . . . . . . . . . . . . . . . . . . . . . . . . . . . . .
5.2.5 RnLm - Data Element Label . . . . . . . . . . . . . . . . . . . . . . . . . .
4-20
4-21
5-1
5-1
5-1
5-2
5-2
5-2
5-2
5-2
5-3
5-3
5-3
5-3
5-3
5-3
5-4
5-4
5-4
5-5
5-5
5-5
5-6
5-6
5-6
5-6
5-6
5-6
5-7
5-7
5-7
5-7
5-8
5-8
5-8
APPENDIX A - ERROR CODES REPORTED BY GRAPH
DOCUMENT HISTORY
INDEX
GRAPH Reference Manual, Rev. 01
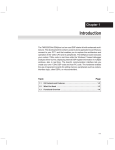
CHAPTER 1
INTRODUCTION
1.1WHAT IS GRAPH?
The GRAPH program and interface described in this document provide a a fully-featured
presentation graphing system for use with the Alpha Micro Graphics Operating System
(AMIGOS). The GRAPH system interface allows incorporation of chart creation, storage,
retrieval, and modification into a program application. For more information regarding
AMIGOS, please see the AMIGOS Reference Manual.
1.2PREREQUISITES
The GRAPH software requires AMOS/L 1.3C or later, or AMOS/32 1.0 or later as the host
operating system and AMIGOS version 1.1 or later for the graphics interface. For
complete compatibility information, see the current AMIGOS Release Notes.
1.3INSTALLATION INSTRUCTIONS
The GRAPH software is a part of the AMIGOS product and as such is contained in the
AMIGOS software media. GRAPH software installation instructions are included in the
AMIGOS Release Notes.
1.4AUDIENCE
This reference manual is intended for application programmers and assumes you are
familiar with the AMIGOS software, the AMOS operating system and the AlphaBASIC,
AlphaC, or Assembler programming languages.
GRAPH Reference Manual, Rev. 01
Page 1-2
Chapter 1
1.5DOCUMENTATION
This document is a part AMIGOS’s documentation library which consists of these books:
AMIGOS Reference Manual - gives a brief introduction to graphics systems in
general and includes detailed information for all AMIGOS functions.
AMIGOS Release Notes - contains all the information you need to get AMIGOS
and GRAPH up and running on your computer.
GRAPH Reference Manual - describes how to use the GRAPH software with
AMIGOS to let your application make, store, retrieve and modify charts.
1.6REFERENCE BOOKS
During development of the AMIGOS and GRAPH software, the books listed below have
proven to be excellent resources for information about graphics.
Computer Graphics. Written by Donald Hearn and M. Pauline Baker. Published in
1986 by Prentice-Hall, Inc.
Principles of Interactive Computer Graphics, second edition. Written by William
M. Newman, Robert F. Sproull. Published in 1979 by McGraw-Hill Book
Company.
Computer Graphics A Programming Approach. Written by Steven Harrington.
Published in 1983 by McGraw-Hill Book Company.
Fundamentals of Interactive Computer Graphics. Written by J. D. Foley and A.
Van Dam. Published in 1982 by Addison-Wesley Publishing Company, Inc.
Raster Graphics Handbook.
1980.
Written and published by Conrac Corporation in
PostScript Language Tutorial and Cookbook. Written by Adobe Systems Incorporated. Published in 1985 by Addison-Wesley Publishing Company, Inc.
PostScript Language Reference Manual. Written by Adobe Systems Incorporated.
Published in 1985 by Addison-Wesley Publishing Company, Inc.
PostScript Language Program Design. Written by Adobe Systems Incorporated.
Published in 1988 by Addison-Wesley Publishing Company, Inc.
Alpha Microsystems documents you may need to refer to are:
AMOS Monitor Calls Reference Manual
GRAPH Reference Manual, Rev. 01
Introduction
Page 1-3
AlphaBASIC User’s Manual
AlphaBASIC PLUS User’s Manual
AlphaBASIC XCALL Subroutine User’s Manual
AMOS Terminal System Programmer’s Manual
1.7HOW THIS BOOK IS ORGANIZED
The GRAPH Reference Manual is organized into five chapters and one appendix.
Chapter2-"General Concepts" introduces you to terms and ideas particular to the
GRAPH software.
Chapter3-"The GRAPH Interface" describes Assembler, AlphaBASIC and AlphaC call
definitions, memory requirements, the GRAPH parameter and data structures.
Chapter4"GRAPH Function Calls" describes the function calls associated with GRAPH.
Chapter 5-"GDF File Keyword Definition" provides the currently supported keywords
defining the graph definition file format.
Appendix A-"Error Codes Reported by GRAPH" lists the error codes, and corresponding
meaning, which are returned by the GRAPH software.
1.8PRINTING CONVENTIONS
Like other Alpha Micro documents, this book uses standard symbols and abbreviations to
make the information easier to read and understand.
SYMBOL
DESCRIPTION
type
This mono-spaced courier type face is used when
illustrating the function format. For example:
CALL GO.IMP(A6)
{}
Optional elements in a function are enclosed within
braces. When these symbols appear in a sample, they
designate elements you may omit from the call.
GRAPH Reference Manual, Rev. 01
CHAPTER 2
GENERAL CONCEPTS
GRAPH is organized as a collection of subroutines which may be used by an application
program to create presentation charts and graphs on a variety of output devices with data
supplied by an application program. GRAPH uses the AMIGOS device-independent graphics
interface to provide flexibility in output options. A chart created on a CRT based display may be
output on a laser printer or plotter without additional change or programming effort.
2.1OVERVIEW
The program GRAPH.SYS is the heart of the GRAPH system. It contains all of the
subroutines required to create and display charts. GRAPH makes use of the AMIGOS
graphics operating system which must be loaded in system memory before GRAPH
may be used. You may load GRAPH.SYS into the user’s partition or it may reside in
system memory.
The file GRFSYM.M68 is used by assembly language programmers to define all of the
calls and data structures provided by GRAPH.
AlphaBASIC programs may access GRAPH.SYS through use of the GRFSBR.SBR
external subroutine. The file GRFSYM.BSI may be INCLUDEd in your AlphaBASIC
program to define the calls and variables used.
The AlphaC program interface to the GRAPH system is provided by the file GRAPH.H
which may be included in your AlphaC program. In addition, the compiled object module
must be linked with the GRFCLB.LIB library file to complete the interface.
The following sequence of events typifies a normal communication session with
GRAPH. The sequence assumes a chart was previously created and resides on disk as
CHART.GDF. Please refer to the AMIGOS Reference Manual for more detailed information regarding AMIGOS functions.
1.Allocate a GCB (graphics control block) and perform an AMIGOS GOPWK (open
workstation) call to initialize the desired output device.
2.Perform an AMIGOS GCLRW (clear workstation) call to clear and initialize the
workstation.
GRAPH Reference Manual, Rev. 01
Page 2-2
Chapter 2
3.Perform a GRAPH GO.IMP call to determine how much impure memory is
required.
4.Allocate the required memory.
5.Perform a GRAPH GO.INI call to initialize the impure memory area.
6.Open the file CHART.GDF for input and perform a GRAPH GO.LOD call to load
the chart into the impure space.
7.Perform various storage and retrieval calls to GRAPH to return and store data
values and/or chart parameters as necessary. This allows your program to modify
chart values without regard to impure area layout.
8.Perform a GRAPH GO.DSP call to display the modified chart on the output device.
9.Open a file for output and perform a GRAPH GO.SAV call to store the modified
chart on disk.
10.Close all files and perform an AMIGOS GCLWK call to close the output
workstation.
It is not necessary to load a chart from an existing file. Your program may perform all
initialization steps and simply provide data and chart parameters for display.
2.2DATA TYPES AND ORGANIZATION
The underlying purpose of the GRAPH system is to present the user’s data in as clear a
manner as possible. This data may be provided to GRAPH from any source the user
wants. All data must be supplied in AMOS compatible 6-byte floating point format.
Each data point on a chart is represented by a corresponding X and Y coordinate pair.
In all charts except X-Y, only the Y portion is used to represent the data value. A group
of data points corresponding to a particular theme is referred to as a "Range" of data.
Up to eight data ranges may be defined and plotted on a single chart. Thus, on a line
chart, eight data ranges would appear as eight separate line plots, one for each range.
GRAPH supports both positive and negative data values within the range of floating
point limits imposed by the system. Certain chart types cannot support negative data
points. These chart types accumulate a total which assumes a total greater than the
previous value. An example is the pie chart where it would be difficult to display a pie
wedge representing a negative percentage of the total.
GRAPH Reference Manual, Rev. 01
General Concepts
Page 2-3
2.3CHART STYLES
GRAPH displays six basic chart styles:
Line Charts
Clustered Bar Charts
Stacked Bar Charts
Pie Charts
Area Charts
X-Y Charts
In the following examples, each chart consists of two data ranges comprised of six data
points each with the following values:
Data
Point
1
2
3
4
5
6
Range 1
X
Y
Range 2
X
2.0
3.5
5.2
7.0
10.3
15.0
4.0
9.0
3.0
6.0
1.2
19.6
1.5
8.0
8.4
11.75
16.0
20.0
GRAPH Reference Manual, Rev. 01
Y
3.0
10.0
7.5
12.0
4.9
7.0
Page 2-4
Chapter 2
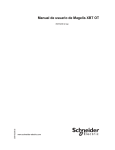
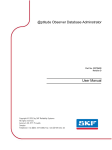
2.3.1Line Chart
Line charts consist of a set of data points connected with a line. You can specify marker
output such that each data point is represented by a symbol, such as a dot, star, plus,
etc. In addition, you can specify a line type of zero to show only the marked data points.
Each data range may be drawn in a different color.
GRAPH Reference Manual, Rev. 01
General Concepts
Page 2-5
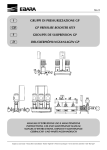
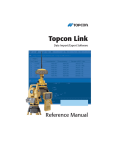
2.3.2Clustered Bar Chart
The clustered bar chart, or simply bar chart, consists of a filled rectangular area to
represent the Y magnitude of the data points. Multiple data ranges are displayed
adjacent to each other for comparison purposes. Each range may be represented by a
variable color.
GRAPH Reference Manual, Rev. 01
Page 2-6
Chapter 2
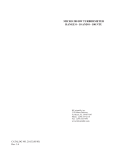
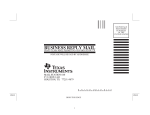
2.3.3Stacked Bar Chart
The stacked bar chart is similar to the clustered bar chart except the Y-data point values
from each range are added and stacked one on top of another to show a cumulative
total.
Positive and negative data values are accumulated separately, with the total of positive
values displayed above the X axis, and the total of all negative values displayed below
the X axis.
GRAPH Reference Manual, Rev. 01
General Concepts
Page 2-7
2.3.4Pie Chart
The pie chart represents a single range of data as a pie-wedge percentage of the range
total. The color of each sector may be selected. Negative data values are ignored in pie
charts.
GRAPH Reference Manual, Rev. 01
Page 2-8
Chapter 2
2.3.5Area Chart
The area chart is similar to the stacked bar chart except that the Y-data values are
linked together in a filled area which tends to more dramatically show trends in the data
pattern.
Positive and negative data values are accumulated separately, with the total of positive
values displayed above the X axis, and the total of all negative values displayed below
the X axis.
GRAPH Reference Manual, Rev. 01
General Concepts
Page 2-9
2.3.6X-Y Chart
The X-Y chart is used for relational plotting of coordinate pairs. The data points are
linked with a line which may be blanked or altered in the same manner as the line chart.
GRAPH Reference Manual, Rev. 01
Page 2-10
Chapter 2
2.4CHART OPTIONS
GRAPH is able to produce a chart from a minimum set of parameters. Many of the chart
features such as axis scaling, headings, subtitles, text color, and legend output are
produced as defaults when displaying a chart. You can alter these parameters to
produce customized charts.
2.4.1Axis Scaling
When given a set of data points to plot, GRAPH calculates the minimum and maximum
range of the data and creates X and Y axes with scales to accommodate the entire data
range. Users need not be concerned with scale values in order to produce an initial
chart. However, in many applications it is necessary to modify the starting and ending
values of an axis. In addition, the data might be more easily understood if the
incremental axis points were user-definable. Perhaps each data value should be
prescaled, or multiplied by a fixed value before display. GRAPH allows all of these
options on both the X and Y axes.
2.4.2Titles, Legends and Data Labels
GRAPH provides a rich set of titles, subtitles, axis labels, and data labels which are user
definable. In addition, each data range label may be used to produce an optional legend
which distinguishes the individual data ranges.
2.4.3Text Attributes
Titles, subtitles, and labels may be defined with individual text attributes. Each text
element is produced using default values for font, character height, color, rotation, and
origin. These attributes may be modified by your program on an individual basis.
2.4.4Color
GRAPH allows users to modify the color output of text, background, and data areas
individually. A pre-defined set of colors is available, or users may specify special colors
if the workstation used supports them. On monochrome workstations, such as laser
printers, the color is represented by varying degrees of gray scale or a specific fill
pattern.
GRAPH Reference Manual, Rev. 01
General Concepts
Page 2-11
2.4.5Data Point Markers
GRAPH allows you to specify optional marker types to represent each data point. Using
these markers, and specifying a zero line type, allows your program to produce scatter
charts when in line or X-Y mode.
2.5CHART STORAGE AND RETRIEVAL
GRAPH provides two calls, GO.LOD and GO.SAV, to allow storage and retrieval of
completed charts. GRAPH stores the chart on disk in a simple keyword text format. This
file is referred to as a Graph Definition File and is generally given an extension of .GDF.
You do not need to access this file directly as all subsequent access may be be
performed by GRAPH. The data in the GDF file is not keyed to a particular program or
output device. It is a universal exchange file which may be used by another program to
display the same chart on a different output device.
2.5.1User Text
It might be convenient for a particular application program to store some additional data
in the GDF file so that it may retrieve that data when loading the chart during a
subsequent session. An example of this requirement might be a program which charts a
column of data from a spreadsheet containing many columns. Upon loading the chart at
a later date, it would be convenient for the program to determine which column the data
came from. In this case, the program would need to store the column number in the
GDF file for later retrieval.
Since many different programs are able to create and modify charts through use of the
GRAPH interface, the information stored in the GDF file by one program must be able to
be discerned from that which was placed there by another program. In addition, all user
information which is not used by the current program must be passed to any new
modified GDF files. These functions are performed by the User Text Pointer System
within GRAPH.
Within the impure area controlled by GRAPH are 100 pointers which are initialized with
a value of zero. Each application program is assigned a unique number in the range of 1
to 99. When a program wishes to store or retrieve information in the GDF file, it
initializes its appropriate pointer with an index to a text buffer which resides in the user’s
memory space. Once this pointer is initialized, any information in the GDF file which
corresponds to that pointer number is loaded or stored from the user’s text buffer. All
other user text in the GDF file is ignored.
Before loading a GDF file, your program initializes its text buffer pointer through use of
the GO.SUP call. If the GDF file is to be updated, your program opens a new file for
output and informs GRAPH that this file is active during the load process. As user text is
retrieved from the GDF file, all text which is not associated with this program’s unique
pointer is passed directly to the output file. In this way, any other program’s unique data
is preserved.
GRAPH Reference Manual, Rev. 01
Page 2-12
Chapter 2
The user text area may be any size you want. It is layed out as a series of text strings,
each terminated with a null. The final string is terminated with a byte of -1 (377 octal) to
indicate the logical end of the buffer. Each string is stored in the GDF file as a separate
line.
GRAPH Reference Manual, Rev. 01
CHAPTER 3
THE GRAPH INTERFACE
The program interface to the GRAPH system is provided by the file GRFSYM.M68 which is
COPYed by an assembly language program to define the call and data structures associated
with the system.
The AlphaBASIC program interface to the GRAPH system is provided by the file GRFSYM.BSI,
which your AlphaBASIC program incorporates via the INCLUDE statement to define the call
and data structures associated with the system. All calls to GRAPH.SYS are performed
through the GRFSBR.SBR external subroutine.
The AlphaC program interface to the GRAPH system is provided by the file GRAPH.H which
you must "include" in your AlphaC program. In addition, the compiled object module must be
linked with the GRFCLB.LIB library file to complete the interface.
3.1CALL DEFINITIONS
At the base of the GRAPH.SYS module, just after the standard program header, are a
series of jumps to specific routines in GRAPH. The offsets are defined in
GRFSYM.M68. The implementation and operation of these calls is described in detail in
Chapter 4, "GRAPH Function Calls." Briefly, the call offsets are:
GO.IMP
Return impure memory size required for operation of GRAPH with
a specified number of data points.
GO.INI
Initialize user allocated impure area.
GO.DSP
Display Chart currently residing in impure area.
GO.LOD
Load a previously saved chart from disk into impure area.
GO.SAV
Save current chart in impure area onto disk.
GO.GGP
Get current graph parameter list from impure area and place in a
user specified area.
GO.PGP
Put a user specified parameter list into the impure parameter list
area.
GRAPH Reference Manual, Rev. 01
Page 3-2
Chapter 3
GO.GRD
Get a range of data from the impure area and place it in a user
specified data area.
GO.PRD
Put a user specified data area into an impure area data range.
GO.CSR
Clear a single range of data in the impure area.
GO.CAR
Clear all data ranges in the impure area.
GO.SUP
Load a user text index pointer in the impure area.
3.2MEMORY REQUIREMENTS AND USAGE
The GRAPH interface was designed to provide flexibility in interface for a variety of
existing software packages. Since many of these programs do not allocate memory
consistently with the standard AMOS memory allocation methods, it was necessary to
define a universal means of providing GRAPH with its necessary impure memory.
When a program uses GRAPH, it must first ask GRAPH how much memory is required.
The user program does this through use of the GO.IMP call. Once GRAPH reports the
required memory size, it is the user program’s responsibility to allocate a contiguous
area of memory in a manner consistent with that program’s operation. Once the area is
allocated, GRAPH is informed of its location through use of the GO.INI call.
Since AlphaBASIC allocates free memory from the top down, AlphaBASIC programs
must pre-allocate the impure area through use of a MAPped unformatted variable. The
size of this area may be determined through use of the GO’IMP call but the impure area
itself may not be dynamically allocated.
The impure memory is not directly accessed or modified by the user program. Instead,
various calls to GRAPH return elements from the area and place elements into the area.
The layout of the impure memory area is not available to the user program. By using
this method, updates and changes to the GRAPH system will not necessitate
recompilation or assembly of programs which use it.
The user program allocates two defined memory areas in order to exchange data and
parameters with the impure area. The definition of each of these areas follows.
3.3GRAPH PARAMETER STRUCTURE
A data structure of size GP.SIZ is used to exchange chart parameters with GRAPH. A
call to GRAPH to get or put this area results in the entire area being moved. The
definition of each element within this area follows.
GRAPH Reference Manual, Rev. 01
The GRAPH Interface
Page 3-3
Each text element is defined with individual text attributes. The format of a text element
is:
0
2
4
6
10
12
14
14+
font
character height
color
rotation
offset x
offset y
text
text size
GRAPH.SYS will normally display all text in a default location using default attributes.
Specifying a non-zero attribute causes the default to be overridden by the new attribute.
In addition, the user is able to preset an overall default set of attributes to be used if
individual attributes are not specified. For more information, see the description of the
parameter text attribute area (GP.TXA) below.
3.3.1GP.TTL - Chart Title
The GP.TTL - chart title may be up to 60 characters in length and must be terminated by
a null byte. The title appears centered at the top of the chart. This is a text element with
individual text attributes as described above.
3.3.2GP.ST1 - Subtitle 1
GP.ST1 - subtitle 1 may be up to 60 characters in length and must be terminated with a
null byte. It appears centered directly below the title. This is a text element with
individual text attributes as described above.
3.3.3GP.ST2 - Subtitle 2
GP.ST2 - subtitle 2 may be up to 60 characters in length and must be terminated with a
null byte. It appears centered directly below subtitle 1. This is a text element with
individual text attributes as described above.
3.3.4GP.FOT - Footnote
The GP.FOT - footnote may be up to 60 characters in length and is terminated with a
null byte. It appears in the lower right corner of the display area. This is a text element
with individual text attributes as described above.
GRAPH Reference Manual, Rev. 01
Page 3-4
Chapter 3
3.3.5GP.XLB - X-axis Label
The X-axis label may be up to 60 characters in length and must be terminated with a
null byte. It appears centered directly below the scale values on the X-axis. This is a
text element with individual text attributes as described above.
3.3.6GP.YLB - Y-axis Label
The Y-axis label may be up to 60 characters in length and must be terminated with a
null byte. It appears centered directly to the left of the scale values on the Y-axis. This is
a text element with individual text attributes as described above.
3.3.7GP.YST - Y-axis Start Value
The GP.YST value is a floating point number specifying the Y-axis starting value. A
value of zero causes GRAPH to default to the lowest Y value determined from the data
to be charted. This value may not appear exactly since GRAPH may select an
increment value which does not cause a stop at the specified value. In this case,
GRAPH selects the closest increment which will display as much data as possible.
3.3.8GP.YEN - Y-axis End Value
GP.YEN is a floating point number specifying the Y-axis ending value. A value of zero
causes GRAPH to default to the highest Y value determined from the data to be
charted. This value may not appear exactly since GRAPH may select an increment
value which does not cause a stop at the specified value. In this case, GRAPH selects
the closest increment which will display as much data as possible.
3.3.9GP.YIN - Y-axis Increment
GP.YIN is a floating point number specifying the increment used between tick marks on
the Y axis. A value of zero will cause GRAPH to select an increment based on the range
and values of the data to be charted.
3.3.10GP.YPR - Y-axis Prescale
This floating point number specifies a constant value to be multiplied by each Y-axis
increment for easier readability. A value of zero or one indicates no prescaling is in
effect.
GRAPH Reference Manual, Rev. 01
The GRAPH Interface
Page 3-5
3.3.11GP.XST - X-axis Start Value
GP.XST is a floating point number specifying the X-axis starting value. A value of zero
causes GRAPH to default to the lowest X value determined from the data to be charted.
This value may not appear exactly since GRAPH may select an increment value which
does not cause a stop at the specified value. In this case, GRAPH selects the closest
increment which will display as much data as possible. This parameter is only effective
in X-Y charts.
3.3.12GP.XEN - X-axis End Value
GP.XEN is a floating point number specifying the X-axis ending value. A value of zero
causes GRAPH to default to the highest X value determined from the data to be
charted. This value may not appear exactly since GRAPH may select an increment
value which does not cause a stop at the specified value. In this case, GRAPH selects
the closest increment which will display as much data as possible. This parameter is
only effective in X-Y charts.
3.3.13GP.XIN - X-axis Increment
GP.XIN is a floating point number specifying the increment used between tick marks on
the X axis. A value of zero will cause GRAPH to select an increment based on the range
and values of the data to be charted. This parameter is only effective in X-Y charts.
3.3.14GP.XPR - X-axis Prescale
GP.XPR is a floating point number specifying a constant value to be multiplied by each
X-axis increment for easier readability. A value of zero or one indicates no prescaling is
in effect. This parameter is only effective in X-Y charts.
3.3.15GP.TXA - Default Text Attributes
GP.TXA stores the default text attributes for subsequent text commands. These
attributes are used if the individual text attributes items are zero. A value of zero in any
field causes GRAPH to use the default attribute for the current operation. This area is
used by the GDF file load routine to track the currently active attributes set through use
of the GTA keyword. The format of this area is:
0
2
4
6
10
12
GRAPH Reference Manual, Rev. 01
font
character height
color
rotation
offset x
offset y
Page 3-6
Chapter 3
3.3.16GP.FAP - Fill Area Pattern Table
GP.FAP stores a list of fill pattern indices to be used in bar, stacked bar, area, and pie
charts. Up to 64 fill patterns may be stored. For bar, stacked bar, and area charts, the
first 8 patterns are used to represent the 8 data ranges allowed.
For pie charts, each successive data element retrieves the next fill pattern from this list.
If over 64 segments are used, the table will start over at location 0 and proceed forward.
A value of zero in any location causes a solid fill in the current color.
On monochrome devices, solid fills are represented by gray scales corresponding to the
desired color. Unlike color devices, fill patterns are always generated at full intensity.
That is, gray scales are not used to represent color within a fill pattern.
3.3.17GP.TYP - Type of Chart
GP.TYP determines the chart type to be displayed as defined by the following list:
1
2
3
4
5
6
Line Chart
Clustered Bar Chart
Stacked Bar Chart
Pie Chart
Area Chart
X-Y Chart
All other values default to type 1.
3.3.18GP.XTP - X-axis Type
The GP.XTP byte defines the X-axis type to be displayed. Currently, only linear axis
scales are allowed and this variable has no effect.
3.3.19GP.YTP - Y-axis Type
The GP.YTP byte defines the Y-axis type to be displayed. Currently, only linear axis
scales are allowed and this variable has no effect.
3.3.20GP.XGR - X-axis Grid Type
The GP.XGR byte defines the type of grid to be displayed on the X-axis as defined by
the following list:
0
1
No grid
Dotted grid
GRAPH Reference Manual, Rev. 01
The GRAPH Interface
Page 3-7
3.3.21GP.YGR - Y-axis Grid Type
The GP.YGR byte defines the type of grid to be displayed on the Y-axis as defined by
the following list:
0
1
No grid
Dotted grid
3.3.22GP.TCL - Text Color
The GP.TXL byte defines the color of all text on the chart as defined by the following list:
0
1
2
3
4
5
6
7
Black
White
Blue
Magenta
Red
Yellow
Green
Cyan
Additional colors may be specified if the workstation in use supports them.
3.3.23GP.BCL - Background Color
The GP.BCL byte defines the color of the chart background as defined by the following
list:
0
1
2
3
4
5
6
7
Black
White
Blue
Magenta
Red
Yellow
Green
Cyan
Additional colors may be specified if the workstation in use supports them.
GRAPH Reference Manual, Rev. 01
Page 3-8
Chapter 3
3.4GP.LGN - LEGEND TYPE
The GP.LGN byte defines the type of legend to be output on the chart. The legend is
keyed to the color of each range and displays the data range title. Legend types are:
0
1
No Legend
Standard Legend
3.4.1GP.MRK - Data Point Marker Type
The GP.MRK byte defines the type of marker to be displayed at each data point in a line
or X-Y type chart. The marker types may be selected from the following list:
0
1
2
3
4
5
No Marker Output
Dot
Plus
Star
circle
cross
3.5GRAPH DATA STRUCTURE
The GRAPH impure area is capable of storing eight ranges of data in a dynamic
manner. Each data range may have a different number of data points, and it is the
responsibility of GRAPH to maintain this data within the impure area. The user program
deals with one range of data at a time.
A range data memory area is allocated by the user program to exchange with the
GRAPH impure area in much the same manner as the parameter area. This area
consists of a fixed area defining the data range characteristics, and a variable length
area containing the data itself.
The following offsets are defined in GRFSYM.M68 pertaining to the data range.
3.5.1GR.NUM - Data Range Number
GR.NUM is a 16-bit value containing the data range number identifying the data area.
This number may be in the range of 0 to 7. Any other value will cause unpredictable
results.
GRAPH Reference Manual, Rev. 01
The GRAPH Interface
Page 3-9
3.5.2GR.CNT - Count of Data Points
GR.CNT is a 16-bit number containing the total count of active data elements following
the fixed portion of the data range area. The user may allocate more memory than
required to contain the data elements. When requesting a data range from the GRAPH
impure area, it is the user’s responsibility to ensure that enough memory has been
allocated to contain all of the data elements.
3.5.3GR.FLG - Data Range Flag
GR.FLG is a 16-bit flag used to define various data range characteristics. This flag
contains the following element:
Bit 0
GR$HDR
When this bit is set (=1), the GO.GRD call will
return the range header only.
3.5.4GR.CLR - Data Range Color
The GR.CLR byte defines the color of lines and fill areas to represent this range of data
on the display device. The color values area defined as follows:
0
1
2
3
4
5
6
7
Black
White
Blue
Magenta
Red
Yellow
Green
Cyan
Additional colors may be specified if the workstation in use supports them.
3.5.5GR.LST - Data Range Linestyle
The GR.LST byte defines the linestyle to be used in line and X-Y type charts to
represent this range of data. The linestyles available are:
0
1
2
3
4
5
6
GRAPH Reference Manual, Rev. 01
No Line Output
Solid Line
Dashed
Dotted
Dash-Dot
Long Dash
Long Dash-Dot
Page 3-10
Chapter 3
3.5.6GR.TTL - Data Range Title
The GR.TTL field may be up to 40 characters in length and must be terminated with a
null byte. It appears in the legend output to title a range of data. If the legend is enabled,
and this field is null, no legend output will occur. This is a text element with individual
text attributes as described above.
3.5.7GR.DAT - Data Offset
The GR.DAT offset defines the size of the preceding fixed area and the location of the
base of the data area. The data elements start at this location and extend as far as
necessary to define all elements. Each data element is composed of the X and Y data
values and several items to define the characteristics of the data.
3.5.8Data Element Structure
Each data element is GE.SIZ bytes in length and contains:
GE.FLG - Data Element Flag
GE.TYP - Data Element Type
GE.DTX - X Data Value
GE.DTY - Y Data Value
GE.LBL - Data Point Label
GE.FLG - Data Element Flag
The GE.FLG byte contains flags describing the data contained in the cell. The
associated flag values are:
GE$XVL
GE$YVL
GE$EXP
GE$PRC
X data is valid
Y data is valid
Explode pie segment
Display percentage on pie segment
GRAPH Reference Manual, Rev. 01
The GRAPH Interface
Page 3-11
GE.TYP - Data Element Type
The GE.TYP byte contains a description of the data type contained in the cell as follows:
0
1
6-byte AMOS floating point
8-byte IEEE floating point (currently unsupported)
GE.DTX - X Data Value
GE.DTX is an 8-byte variable that contains the X data value in floating point.
GE.DTY - Y Data Value
GE.DTY is an 8-byte variable that contains the Y data value in floating point.
GE.LBL - Data Point Label
The GE.LBL variable may be up to 20 characters in length and must be terminated with
a null byte. The data point labels from the first range are used to label the X-axis tick
marks in all charts except Pie and X-Y. This is a text element with individual text
attributes as described above.
GRAPH Reference Manual, Rev. 01
CHAPTER 4
GRAPH FUNCTION CALLS
GRAPH provides twelve function calls which are defined as offsets in GRFSYM.M68. Each
function requires one or more registers to be initialized prior to calling GRAPH. Each function
call returns a status in register D6. A successful return is indicated by the Z flag being set and a
value of zero in D6. If the Z flag is not set, D6 contains an error code. For complete details
regarding error codes, refer to Appendix A, "Error Codes Reported By Graph."
Function calls are performed by initializing any required registers, and performing a subroutine
call from a specific offset from the base of GRAPH.SYS. The following example assumes that
the variable GRFPNT(A5) contains a pointer to the base of GRAPH.SYS in memory.
OK:
MOV
MOV
CALL
BEQ
#100.,D1
GRFPNT(A5),A6
GO.IMP(A6)
OK
perform
error handling
continue
GRAPH Reference Manual, Rev. 01
;
;
;
;
set up maximum data count
get pointer to GRAPH.SYS
call the appropriate routine
all’s well if Z flag set
Page 4-2
Chapter 4
4.1GO.IMP - REPORT IMPURE AREA SIZE
Prior to using GRAPH, it is necessary to allocate an impure memory area for parameter
and data storage. The size of this area is variable depending on the total number of data
elements to be displayed. GRAPH does not allocate this memory, but rather reports to
the user program how much memory is necessary to accommodate the user’s data
requirements. The user may then allocate this impure area in a manner convenient to the
particular application being executed.
Inputs:
D1
Total number of data elements required. This is
equivalent to the number of active data ranges
times the number of data points in each range.
Outputs:
D1
Size in bytes of required impure area.
AlphaBASIC CALLING SEQUENCE
XCALL GRFSBR,GO’IMP,num’el,size,status
where:
num’el
A floating point variable containing the total number of data
elements which the user desires to allocate. This is equivalent to
the number of active data ranges time the number of data points
in each range.
size
A floating point variable which will receive the size of the required
impure zone.
status
A floating point variable which will receive the return status of the
call. Refer to Appendix A for a description of status and error
codes.
GRAPH Reference Manual, Rev. 01
GRAPH Function Calls
Page 4-3
AlphaC CALLING SEQUENCE
goimp(gizsize)
/* get required impure size */
where:
gizsize
A pointer to a long integer variable which will receive the size of
the required impure zone.
Input Parameters:
glong *gizsize;
/* pointer to size variable */
Data Types:
typedef unsigned glong;
GRAPH Reference Manual, Rev. 01
/* 4-byte integer */
Page 4-4
Chapter 4
4.2GO.INI - INITIALIZE IMPURE AREA
Once the user program has allocated the required impure area, it is necessary to inform
GRAPH of its location so that it may be initialized for subsequent use.
Inputs:
A3
D1
Pointer to impure memory area
Size of impure area. (Returned by GO.IMP call)
Outputs:
--
none
AlphaBASIC CALLING SEQUENCE
XCALL GRFSBR,GO’INI,giz,status
where:
giz
An unformatted variable containing the Graph Impure Zone used
as intermediate storage and work space for the GRAPH subroutine.
status
A floating point variable which will receive the return status of the
call. Refer to Appendix A for a description of status and error
codes.
AlphaC CALLING SEQUENCE
goini(giz,size)
/* initialize GIZ */
where:
giz
A pointer to the Graph Impure Zone used as intermediate storage
and work space for GRAPH.
size
A long integer variable which contains the size of the impure area.
Input Parameters:
glong *giz;
glong size;
/* pointer to graph impure zone */
/* size of impure zone */
Data Types:
typedef unsigned glong;
/* 4-byte integer */
GRAPH Reference Manual, Rev. 01
GRAPH Function Calls
Page 4-5
4.3GO.DSP - DISPLAY CHART
GO.DSP causes the chart currently stored in the impure area to be displayed on a
specified output workstation.
Inputs:
A3
A4
Pointer to impure area.
Pointer to Graphics Control Block (GCB) which has
been opened for output for the desired workstation.
Outputs:
--
None
AlphaBASIC CALLING SEQUENCE
XCALL GRFSBR,GO’DSP,giz,gcb,status
where:
giz
An unformatted (type X) variable containing the Graph Impure
Zone used as intermediate storage and work space for the
GRAPH subroutine.
gcb
An unformatted variable containing the Graphics Control Block for
a graphics workstation previously open through the use of the
AMIGOS G’OPWK (open workstation) call. Refer to the AMIGOS
documentation for additional information.
status
A floating point variable which will receive the return status of the
call. Refer to Appendix A for a description of status and error
codes.
GRAPH Reference Manual, Rev. 01
Page 4-6
Chapter 4
AlphaC CALLING SEQUENCE
godsp(giz,gcb)
/* Display graph */
where:
giz
A pointer to the Graph Impure Zone used as intermediate storage
and work space for GRAPH.
gcb
A pointer to the Graphics Control Block for a graphics workstation
previously open through the use of the AMIGOS G’OPWK (open
workstation) call. Refer to the AMIGOS documentation for
additional information.
Input Parameters:
glong *giz;
g_gcb *gcb;
/* pointer to graph impure zone */
/* Graphics Control Block */
Data Types:
typedef struct gcb g_gcb;
typedef unsigned glong;
/* graphics control block */
/* 4-byte integer */
GRAPH Reference Manual, Rev. 01
GRAPH Function Calls
Page 4-7
4.4GO.LOD - LOAD A GRAPH DEFINITION FILE
GO.LOD loads an existing graph definition file into the impure area. Prior to loading the
file, all user text buffer pointers must be initialized through use of the GO.SUP call. User
text buffers which are not to be used by this program may be passed to an output file by
providing an optional output DDB index in the call. See section 2.5.1 for further details on
user text input and output.
Inputs:
Outputs:
A3
A4
A2
Pointer to impure area.
Pointer to GDF file DDB which has been initialized
and open for input.
Pointer to DDB which has been initialized and
open for output if necessary to output unused user
text. This register must contain zero if no output is
required.
--
None
AlphaBASIC CALLING SEQUENCE
XCALL GRFSBR,GO’LOD,giz,in’file,out’file,status
where:
giz
An unformatted variable containing the Graph Impure Zone used
as intermediate storage and work space for the GRAPH subroutine.
in’file
A variable containing a file channel which has been opened for
input. The .GDF file defined by this channel will be input to the
Graph Impure Zone for further processing.
out’
file
A variable containing a file channel which has been opened for
output. This file will be updated with any user text not assigned to
this program through the GO’SUP call. If no output is necessary
during the load process, this variable must be null or zero.
status
A floating point variable which will receive the return status of the
call. Refer to Appendix A for a description of status and error
codes.
GRAPH Reference Manual, Rev. 01
Page 4-8
Chapter 4
AlphaC CALLING SEQUENCE
golod(giz,iddb,oddb)
/* load GDF file */
where:
giz
A pointer to the Graph Impure Zone used as intermediate storage
and work space for GRAPH.
iddb
A pointer to a DDB of a file which has been opened for input. The
.GDF file defined by this variable will be input to the Graph Impure
Zone for further processing.
oddb
A pointer to a DDB of a file which has been opened for output.
This file will be updated with any user text not assigned to this
program through the GO’SUP call. If no output is necessary
during the load process, this variable must be null or zero.
Input Parameters:
glong *giz;
glong *iddb;
glong *oddb;
/* pointer to graph impure zone */
/* pointer to input file ddb */
/* pointer to output file ddb */
Data Types:
typedef unsigned glong;
/* 4-byte integer */
GRAPH Reference Manual, Rev. 01
GRAPH Function Calls
Page 4-9
4.5GO.SAV - SAVE CURRENT CHART IN GRAPH DEFINITION FILE
GO.SAV causes the current impure area contents to be output to a Graph Definition File.
All initialized user pointers will cause output of the associated user text buffers. See
Chapter 2,"General Concepts," for more information about text input and output.
Inputs:
A3
A4
Pointer to impure area.
Pointer to GDF file DDB which has been initialized
and open for output.
Outputs:
--
None
AlphaBASIC CALLING SEQUENCE
XCALL GRFSBR,GO’SAV,giz,out’file,status
where:
giz
An unformatted variable containing the Graph Impure Zone used
as intermediate storage and work space for the GRAPH subroutine.
out’
file
A variable containing a file channel which has been opened for
output. The graph definition currently residing in the Graph
Impure Zone will be output to this file in GDF file format. Refer to
Chapter 5, "GDF File Keyword Definition," for more information on
GDF file format.
status
A floating point variable which will receive the return status of the
call. Refer to Appendix A for a description of status and error
codes.
GRAPH Reference Manual, Rev. 01
Page 4-10
Chapter 4
AlphaC CALLING SEQUENCE
gosav(giz,oddb)
/* save GDF file */
where:
giz
A pointer to the Graph Impure Zone used as intermediate storage
and work space for GRAPH.
oddb
A pointer to a DDB for a file which has been opened for output.
The graph definition currently residing in the Graph Impure Zone
will be output to this file in GDF file format. Refer to Chapter 5,
"GDF File Keyword Definition," for more information on GDF file
format.
Input Parameters:
glong *giz;
glong *oddb;
/* pointer to graph impure zone */
/* pointer to output file ddb */
Data Types:
typedef unsigned glong;
/* 4-byte integer */
GRAPH Reference Manual, Rev. 01
GRAPH Function Calls
Page 4-11
4.6GO.GGP - GET GRAPH PARAMETERS
GO.GGP causes the graph parameter list defined in GRFSYM.M68 to be copied from the
impure area to a user specified location. The parameters copied reflect the current state
of the chart defined in the impure area.
Inputs:
A3
A4
Pointer to impure area.
Pointer to user parameter buffer.
Outputs:
--
None
AlphaBASIC CALLING SEQUENCE
XCALL GRFSBR,GO’GGP,giz,parameter’list,status
where:
giz
An unformatted variable containing the Graph Impure Zone used
as intermediate storage and work space for the GRAPH subroutine.
para
meter’
list
An unformatted (type X) variable which is to receive the current
graph parameters. The format of this area is defined in
GRFSYM.BSI.
status
A floating point variable which will receive the return status of the
call. Refer to Appendix A for a description of status and error
codes.
GRAPH Reference Manual, Rev. 01
Page 4-12
Chapter 4
AlphaC CALLING SEQUENCE
goggp(giz,parmbuff)
/* Get graph Parameters */
where:
giz
A pointer to the Graph Impure Zone used as intermediate storage
and work space for GRAPH.
parmbuff
A pointer to a variable which is to receive the current graph
parameters. The format of this area is defined in GRAPH.H.
Input Parameters:
glong *giz;
glong *parmbuff;
/* pointer to graph impure zone */
/* pointer to parameter buffer */
Data Types:
typedef unsigned glong;
/* 4-byte integer */
GRAPH Reference Manual, Rev. 01
GRAPH Function Calls
Page 4-13
4.7GO.PGP - PUT GRAPH PARAMETERS
GO.PGP causes a parameter list as defined in GRFSYM.M68 to be copied from a user
specified location to the impure area. This results in setting the current charts parameters
to a user specified state.
Inputs:
A3
A4
Pointer to impure area.
Pointer to user parameter buffer.
Outputs:
--
None
AlphaBASIC CALLING SEQUENCE
XCALL GRFSBR,GO’PGP,giz,parameter’list,status
where:
giz
An unformatted variable containing the Graph Impure Zone used
as intermediate storage and work space for the GRAPH subroutine.
para
meter’
list
An unformatted (type X) variable which contains the current graph
parameters to be stored in the Graph Impure Zone. The format of
this area is defined in GRFSYM.BSI.
status
A floating point variable which will receive the return status of the
call. Refer to Appendix A for a description of status and error
codes.
GRAPH Reference Manual, Rev. 01
Page 4-14
Chapter 4
AlphaC CALLING SEQUENCE
gopgp(giz,parmbuff)
/* Put graph Parameters */
where:
giz
A pointer to the Graph Impure Zone used as intermediate storage
and work space for GRAPH.
parmbuff
A pointer to a variable which contains the current graph
parameters to be stored in the Graph Impure Zone. The format of
this area is defined in GRAPH.H.
Input Parameters:
glong *giz;
glong *parmbuff;
/* pointer to graph impure zone */
/* pointer to parameter buffer */
Data Types:
typedef unsigned glong;
/* 4-byte integer */
GRAPH Reference Manual, Rev. 01
GRAPH Function Calls
Page 4-15
4.8GO.GRD - GET RANGE OF DATA
The GO.GRD call causes a specified range of data to be copied from the impure area to
a user specified data area. This area must be formatted as defined in GRFSYM.M68.
Prior to making the call, the user program must set the required data range (0 - 7) in
GR.NUM in the data area. If the range flag is set in GR$HDR, only the range header will
be returned.
Inputs:
A3
A4
Pointer to impure area.
Pointer to user data area.
Outputs:
--
None
AlphaBASIC CALLING SEQUENCE
XCALL GRFSBR,GO’GRD,giz,data’range,status
where:
giz
An unformatted variable containing the Graph Impure Zone used
as intermediate storage and work space for the GRAPH subroutine.
data’
range
unformatted (type X) variable which is to receive a range of data.
The format of this area is defined in GRFSYM.BSI.
status
A floating point variable which will receive the return status of the
call. Refer to Appendix A for a description of status and error
codes.
GRAPH Reference Manual, Rev. 01
Page 4-16
Chapter 4
AlphaC CALLING SEQUENCE
gogrd(giz,range)
/* Get range of data */
where:
giz
A pointer to the Graph Impure Zone used as intermediate storage
and work space for GRAPH.
range
A pointer to a variable which is to receive A range of data. The
format of this area is defined in GRAPH.H.
Input Parameters:
glong *giz;
glong *range;
/* pointer to graph impure zone */
/* pointer to data range buffer */
Data Types:
typedef unsigned glong;
/* 4-byte integer */
GRAPH Reference Manual, Rev. 01
GRAPH Function Calls
Page 4-17
4.9GO.PRD - PUT RANGE OF DATA
GO.PRD causes a user specified data area to be copied to a specified data range in the
impure area. This results in the current chart data for that data range to be changed to the
user data. The data area must conform to the structure defined by GRFSYM.M68. The
variables in the fixed part of the data area must be initialized to the required values prior
to the call.
Inputs:
A3
A4
Pointer to impure area
Pointer to user data area
Outputs:
--
None
AlphaBASIC CALLING SEQUENCE
XCALL GRFSBR,GO’PRD,giz,data’range,status
where:
giz
An unformatted variable containing the Graph Impure Zone used
as intermediate storage and work space for the GRAPH subroutine.
data’
range
An unformatted (type X) variable which contains the range of data
be stored in the Graph Impure Zone. The format of this area is
defined in GRFSYM.BSI.
status
A floating point variable which will receive the return status of the
call. Refer to Appendix A for a description of status and error
codes.
GRAPH Reference Manual, Rev. 01
Page 4-18
Chapter 4
AlphaC CALLING SEQUENCE
goprd(giz,range)
/* Put range of data */
where:
giz
A pointer to the Graph Impure Zone used as intermediate storage
and work space for GRAPH.
range
A pointer to a variable which contains the range of data be stored
in the Graph Impure Zone. The format of this area is defined in
GRAPH.H.
Input Parameters:
glong *giz;
glong *range;
/* pointer to graph impure zone */
/* pointer to data range buffer */
Data Types:
typedef unsigned glong;
/* 4-byte integer */
GRAPH Reference Manual, Rev. 01
GRAPH Function Calls
Page 4-19
4.10GO.CSR - CLEAR SINGLE RANGE OF DATA
GO.CSR cause a user specified data range to be deleted from the impure area.
Inputs:
A3
D1
Pointer to impure area
Data range to clear (0 - 7)
Outputs:
--
None
AlphaBASIC CALLING SEQUENCE
XCALL GRFSBR,GO’CSR,giz,range,status
where:
giz
An unformatted variable containing the Graph Impure Zone used
as intermediate storage and work space for the GRAPH subroutine.
range
A variable containing the range number to be cleared. This
number may be in the range 0 to 7.
status
A floating point variable which will receive the return status of the
call. Refer to Appendix A for a description of status and error
codes.
AlphaC CALLING SEQUENCE
gocsr(giz,range)
/* Clear single range */
where:
giz
A pointer to the Graph Impure Zone used as intermediate storage
and work space for GRAPH.
range
A long integer variable containing the range number to be
cleared. This number may be in the range 0 to 7.
Input Parameters:
glong *giz;
glong range;
/* pointer to graph impure zone */
/* range number */
Data Types:
typedef unsigned glong;
GRAPH Reference Manual, Rev. 01
/* 4-byte integer */
Page 4-20
Chapter 4
4.11GO.CAR - CLEAR ALL RANGES OF DATA
GO.CAR causes all data ranges to be deleted from the impure area.
Inputs:
A3
Pointer to impure area.
Outputs:
--
None
AlphaBASIC CALLING SEQUENCE
XCALL GRFSBR,GO’CAR,giz,status
where:
giz
An unformatted variable containing the Graph Impure Zone used
as intermediate storage and work space for the GRAPH subroutine.
status
A floating point variable which will receive the return status of the
call. Refer to Appendix A for a description of status and error
codes.
AlphaC CALLING SEQUENCE
gocar(giz)
/* clear all data ranges */
where:
A pointer to a the Graph Impure Zone used as intermediate
storage and work space for GRAPH.
giz
Input Parameters:
glong *giz;
/* pointer to graph impure zone */
Data Types:
typedef unsigned glong;
/* 4-byte integer */
GRAPH Reference Manual, Rev. 01
GRAPH Function Calls
Page 4-21
4.12GO.SUP - SET USER POINTER
GO.SUP causes the user supplied text buffer index to be associated with a specified user
number. The user text buffer is cleared by placing a byte of -1 in the first position of the
buffer. For further details on user text input and output, see Chapter 2, "General
Concepts."
Inputs:
A3
A4
D1
Pointer to impure area.
Pointer to user text buffer.
User pointer number. (1 - 99.)
Outputs:
--
None
AlphaBASIC CALLING SEQUENCE
XCALL GRFSBR,GO’SUP,giz,buffer,point’num,status
where:
giz
An unformatted variable containing the Graph Impure Zone used
as intermediate storage and work space for the GRAPH subroutine.
buffer
A string or unformatted variable which will contain the user text.
point’
num
A variable containing the user pointer number (1 to 99) to
associate the text with.
status
A floating point variable which will receive the return status of the
call. Refer to Appendix A for a description of status and error
codes.
GRAPH Reference Manual, Rev. 01
Page 4-22
Chapter 4
AlphaC CALLING SEQUENCE
gosup(giz,textbuff,pointnum)
/* Set user pointer */
where:
giz
A pointer to the Graph Impure Zone used as intermediate storage
and work space for GRAPH.
textbuff
A pointer to a string variable which will contain the user text.
pointnum
A long integer variable containing the user pointer number (1 to
99) to associate the text with.
Input Parameters:
glong *giz;
glong *textbuff;
glong pointnum;
/* pointer to graph impure zone */
/* pointer to text buffer */
/* user pointer number for text */
Data Types:
typedef unsigned glong;
/* 4-byte integer */
GRAPH Reference Manual, Rev. 01
CHAPTER 5
GDF FILE KEYWORD DEFINITION
Graph definition (GDF) files consist of a series of single line definitions that define both the
content and the format of the graph to be generated. Each line of the file contains a keyword
and an argument, separated by a space. Blank lines are ignored.
The following keywords which define the graph format are supported:
5.1GRAPH PARAMETER KEYWORDS
The parameter portion of the graph definition file is made up of keywords which affect
the overall appearance and style of the graph.
5.1.1GTY - Type of graph
GTY allows you to specify the type of graph you wish to have generated. The valid
arguments for this keyword are:
1=
2=
3=
4=
5=
6=
line graph
column chart
stacked column chart
pie chart
area graph
X-Y graph
5.1.2GYT - Y-axis type
The GYT keyword allows you to specify the type of Y-axis that is used. Currently, only
linear axes are supported and a value in this variable has no effect.
GRAPH Reference Manual, Rev. 01
Page 5-2
Chapter 5
5.1.3GYS - Y-axis start
The GYS field allows you to specify a minimum value for the Y-axis. Any data points
that lie below this minimum will be truncated. This allows you to eliminate spurious data
values, preventing the graph from being compressed due to a few points. This keyword
takes a floating point number as an argument. A value of zero is taken as no maximum
specified, causing the maximum to be based on the data to be charted.
5.1.4GYE - Y-axis end
The GYE field allows you to specify a maximum value for the Y-axis. Any data points
that lie beyond this maximum will be truncated. This allows you to eliminate spurious
data values, preventing the graph from being compressed due to a few points. This
keyword takes a floating point number as an argument. A value of zero is taken as no
maximum specified, causing the maximum to be based on the data to be charted.
5.1.5GYI - Y-axis increment
The GYI keyword allows you to specify the increment that will be used between tick
marks along the Y-axis. Specify the value to be used as a floating point number
following the keyword. A value of zero is taken as no increment specified, causing a
system default increment to be chosen based on the data to be charted.
5.1.6GYP - Y-axis prescale value
The GYP keyword allows you to specify a value to be used to prescale all supplied data
values. This value will be used to multiply all data, allowing you to choose the correct
magnitude for displaying the data values. A value of zero is taken as no prescale
specified, causing all supplied data to be used unchanged.
5.1.7GYG - Y-axis grid type
The GYG keyword allows you to specify the type of Y-axis grid (if any) that is to be
displayed within the chart area. A grid can help the viewer determine the precise
position of a data point. The types of grids supported are:
0=
1=
no grid
dotted grid
GRAPH Reference Manual, Rev. 01
GDF File Keyword Definition
Page 5-3
5.1.8GXT - X-axis type
The GXT keyword allows you to specify the type of X-axis that is used. Currently, only
linear axes are supported and a value in this variable has no effect.
5.1.9GXS - X-axis start
The GXS field allows you to specify a minimum value for the X-axis. Any data points
that lie below this minimum will be truncated. This allows you to eliminate spurious data
values, preventing the graph from being compressed due to a few points. This keyword
takes a floating point number as an argument. A value of zero is taken as no maximum
specified, causing the maximum to be based on the data to be charted.
5.1.10GXE - X-axis end
The GXE field allows you to specify a maximum value for the X-axis. Any data points
that lie beyond this maximum will be truncated. This allows you to eliminate spurious
data values, preventing the graph from being compressed due to a few points. This
keyword takes a floating point number as an argument. A value of zero is taken as no
maximum specified, causing the maximum to be based on the data to be charted.
5.1.11GXI - X-axis increment
The GXI keyword allows you to specify the increment that will be used between tick
marks along the X-axis. Specify the value to be used as a floating point number
following the keyword. A value of zero is taken as no increment specified, causing a
system default increment to be chosen based on the data to be charted.
5.1.12GXP - X-axis prescale value
The GXP keyword allows you to specify a value to be used to prescale all supplied data
values. This value will be used to multiply all data, allowing you to choose the correct
magnitude for displaying the data values. A value of zero is taken as no prescale
specified, causing all supplied data to be used unchanged.
5.1.13GXG - X-axis grid type
The GXG keyword allows you to specify the type of X-axis grid (if any) that is to be
displayed within the chart area. A grid can help the viewer determine the precise
position of a data point. The types of grids supported are:
0=
1=
no grid
dotted grid
GRAPH Reference Manual, Rev. 01
Page 5-4
Chapter 5
5.1.14GTC - Text color
The GTC field allows you to specify the color in which all text will be rendered. This
keyword takes a single numeric integer argument specifying the text color. The values
for the colors are shown below. If no GTC command is included in the GDF file, the text
defaults to white.
0=
1=
2=
3=
4=
5=
6=
7=
Black
White
Blue
Magenta
Red
Yellow
Green
Cyan
5.1.15GBC - Background color
The GBC field allows you to specify the color in which the background will be rendered.
This keyword takes a single numeric integer argument specifying the color. The values
for the colors are shown below. If no GBC command is included in the GDF file, the
background defaults to black.
0=
1=
2=
3=
4=
5=
6=
7=
Black
White
Blue
Magenta
Red
Yellow
Green
Cyan
5.1.16GMT - Data point marker type
The GMT keyword allow the definition of a marker type to be placed at each data point
on the graph. The defined marker types are:
0=
1=
2=
3=
4=
5=
>5 =
no marker
dot (.)
plus (+)
star (*)
circle (O)
cross (X)
workstation dependent
GRAPH Reference Manual, Rev. 01
GDF File Keyword Definition
Page 5-5
5.1.17LGN - Legend enable
The LGN keyword allows you to enable and disable the legend area. The legend is used
to differentiate between data ranges when multiple data ranges are in use. This keyword
takes a boolean argument (0 or 1), where 0 disables the legend (the default case) and 1
enables the legend.
5.1.18GFP - Fill pattern definition
The GFP keyword allows the definition of up to 64 fill patterns to be used in filling area,
bar, stacked bar, and pie charts. In pie charts, each data element will use a consecutive
fill pattern from this list, starting at position 0. Bar, stacked bar, and area charts will use
only the first 8 patterns, one for each data range, starting with location 0.
The first argument must be the starting location of the first fill pattern to be defined,
followed by as many fill pattern indices desired. For example, the command:
GFP
12,4,7,9
defines fill location 12 to use pattern index 4, location 13 using pattern 7, and location
14 using pattern 9.
5.1.19GTA - Text attributes
The GTA command loads default text attributes for all subsequent text items. Up to six
arguments may follow the command. If any argument is zero, the current default
attribute associated with its position is used. The order of the arguments is:
FONT, HEIGHT, COLOR, ROTATION, OFFSET-X, OFFSET-Y
FONT is any value font available in the currently active workstation. AMIGOS stroke
fonts 1001 through 1009 are also available.
HEIGHT is the character height in world coordinates. If zero or missing, the default
GRAPH height is used.
COLOR specifies a color index for subsequent text. If zero or missing, the default color
specified by GTC is used.
ROTATION may be specified in 1/10 degree resolution. Internal stroke fonts (1001
through 1009) may be continuously scaled and rotated. Workstation generated fonts
(bitmap fonts) may not be rotatable or may only rotate in 90 degree increments. In this
case, the closest rotation available will be used.
GRAPH Reference Manual, Rev. 01
Page 5-6
Chapter 5
OFFSET-X, and OFFSET-Y are specified in integer world coordinates in the range 0 to
32767 and allow the repositioning of a subsequent text string relative to its default
location. Value of 0 or a missing argument results in the default positioning being used.
5.1.20GUP - User parameter text line
The GUP keyword defines an application specific text element associated with a specific
user parameter number. The first argument is the parameter number in the range 1 to
99. This is followed by a line of text to be store/retrieved from the user parameter buffer.
The following keywords allow you to define textual annotation of the graph. These text
fields can contain any printing ASCII characters, including leading and trailing spaces.
Control characters are not allowed. All text is generated using the current or default text
attributes.
5.1.21GTL - Title
The GTL keyword allows you to specify a title for the chart of up to 60 characters. The
title is displayed at the top of the chart, above the main graph area.
5.1.22GS1 - Subtitle 1
The GS1 keyword allows you to specify an optional subtitle for the chart of up to 60
characters. This subtitle is displayed at the top of the chart, immediately below the title.
5.1.23GS2 - Subtitle 2
The GS2 keyword allows you to specify an additional optional subtitle for the chart of up
to 60 characters. This subtitle is displayed at the top of the chart, immediately below
subtitle number 1.
5.1.24GFN - Footnote
The GFN keyword allows you to specify up to 60 characters as a footnote, which will be
printed at the bottom right of the chart area.
5.1.25GXL - X-axis label
The GXL keyword allows you to place a label below the X-axis of the chart. Up to 60
characters may be specified.
GRAPH Reference Manual, Rev. 01
GDF File Keyword Definition
Page 5-7
5.1.26GYL - Y-axis label
The GYL keyword allows you to place a label alongside the Y-axis of the chart. The text
will be placed along the left side of the chart area. Up to 60 characters may be entered.
GRAPH will attempt to rotate the text by 90 degrees. If the workstation does not support
rotation, the text is placed as a single character per line, one character below the
previous.
5.2GRAPH DATA KEYWORDS
The data portion of the graph definition file is made up of keywords that describe each
data range, as well as keywords that describe the data within each range. Each of these
commands is made up of letters defining the keyword, with embedded numbers defining
the data range ("n") and in some cases the data element number within the range ("m").
5.2.1GnC - Range color
The GnC field allows you to specify the color to be used for displaying data within range
"n". This keyword takes a single numeric integer argument specifying the text color. The
values for the colors are shown below. If no GnC command is included in the GDF file, a
default color assignment will be made automatically.
0=
1=
2=
3=
4=
5=
6=
7=
Black
White
Blue
Magenta
Red
Yellow
Green
Cyan
5.2.2GnS - Range linestyle
The GnS field allows you to specify the linestyle to be used for displaying data within
range "n". This keyword takes a single numeric integer argument specifying the
linestyle. The acceptable values are shown below. If no GnS command is included in
the GDF file, the solid linestyle will be used.
1=
2=
3=
4=
5=
6=
solid
dashed
dotted
dash dot
long dash
long dash-dot
GRAPH Reference Manual, Rev. 01
Page 5-8
Chapter 5
5.2.3GnT - Range title
The GnT keyword allows you to specify up to 40 characters to be used as the title of
data range "n". This title will be used within the legend to identify the range of data.
5.2.4RnDm - Data element
The RnDm keyword allows you to define the value of data element "m" within data
range "n". This keyword may be followed by up to 3 arguments. The first two arguments
are the X and Y data values in floating point ASCII representation. The Y value may be
omitted if this is not an XY chart. In this case, the Y value is equated to the X value. The
third argument is the data element flags value. This is a decimal representation of the
sum of the data element flag bits described in the section describing GE.FLG.
5.2.5RnLm - Data Element Label
The RnLm keyword allows you to specify up to 20 characters to be used as the X-axis
title of data element "m". This title will be used within pie charts to label each pie
segment.
GRAPH Reference Manual, Rev. 01
APPENDIX A
ERROR CODES REPORTED BY GRAPH
Each function call to GRAPH returns a status code in register D6. If this code is non-zero, it
indicates an error condition. The following decimal error codes are defined:
CODE
SYMBOL
MESSAGE
0
1-255
256
257
--GE$GDF
GE$NEG
258
GE$NDF
259
260
261
262
263
GE$AXS
GE$GNF
GE$FUL
GE$PIM
GE$FNO
No error - normal complettion status.
AMOS file system error.
Unrecognized keyword during GDF file load.
Negative data values not allowed in
specified graph type.
Requested data range label has no
associated data point stored.
Axis start value exceeds end value.
GRAPH.SYS not found.
Impure data area full.
Parameter variable not large enough.
File channel not open.
GRAPH Reference Manual, Rev. 01
GRAPH Reference Manual
Page Index-1
INDEX
AlphaBASIC . . . . . . . . . . . . . . . . . . . . . . . .
AlphaBASIC language . . . . . . . . . . . . . . . .
AlphaC language . . . . . . . . . . . . . . . . . . . .
AMIGOS . . . . . . . . . . . . . . . . . . . . . . . . . . .
documentation library . . . . . . . . . . . . . .
functions . . . . . . . . . . . . . . . . . . . . . . . .
software . . . . . . . . . . . . . . . . . . . . . . . . .
AMOS compatibility . . . . . . . . . . . . . . . . . .
Area chart . . . . . . . . . . . . . . . . . . . . . . . . . .
Area fill . . . . . . . . . . . . . . . . . . . . . . . . . . . .
Assembly language . . . . . . . . . . . . . . . . . .
Attributes . . . . . . . . . . . . . . . . . . . . . . . . . . .
Audience . . . . . . . . . . . . . . . . . . . . . . . . . . .
Axis scaling . . . . . . . . . . . . . . . . . . . . . . . . .
3-2
2-1, 3-1
2-1
2-1
1-2
2-1
1-1
1-1
2-3, 2-8, 3-6
3-6
2-1, 3-1
2-10, 3-5
1-1
2-10
Bar chart . . . . . . . . . . . . . . . . . . . . . . . . . . . 2-3, 3-6
Braces (in examples) . . . . . . . . . . . . . . . . . 1-3
Call definitions . . . . . . . . . . . . . . . . . . . . . .
Call format
type face used for . . . . . . . . . . . . . . . . .
Chart
options . . . . . . . . . . . . . . . . . . . . . . . . . .
storage and retrieval . . . . . . . . . . . . . . .
style . . . . . . . . . . . . . . . . . . . . . . . . . . . .
type . . . . . . . . . . . . . . . . . . . . . . . . . . . .
Chart title . . . . . . . . . . . . . . . . . . . . . . . . . .
CHART.GDF . . . . . . . . . . . . . . . . . . . . . . . .
Clustered bar chart . . . . . . . . . . . . . . . . . . .
Color . . . . . . . . . . . . . . . . . . . . . . . . . . . . . .
background . . . . . . . . . . . . . . . . . . . . . .
2-10
2-11
2-3
2-3
3-3
2-2
2-3, 2-5, 3-6
2-4, 2-10, 3-6 to 3-7, 3-9
5-4
Data
element . . . . . . . . . . . . . . . . . . . . . . . . .
element label . . . . . . . . . . . . . . . . . . . . .
label . . . . . . . . . . . . . . . . . . . . . . . . . . . .
point . . . . . . . . . . . . . . . . . . . . . . . . . . . .
point marker type . . . . . . . . . . . . . . . . . .
range maximum . . . . . . . . . . . . . . . . . .
3-10, 5-8
5-8
2-10, 3-11
2-2
5-4
2-2
GRAPH Reference Manual, Rev. 01
3-1
1-3
Page Index-2
structure . . . . . . . . . . . . . . . . . . . . . . . . .
type . . . . . . . . . . . . . . . . . . . . . . . . . . . .
values . . . . . . . . . . . . . . . . . . . . . . . . . .
Definition file extension . . . . . . . . . . . . . . . .
Devices . . . . . . . . . . . . . . . . . . . . . . . . . . . .
Display . . . . . . . . . . . . . . . . . . . . . . . . . . . .
Displaying charts . . . . . . . . . . . . . . . . . . . .
Documentation . . . . . . . . . . . . . . . . . . . . . .
GRAPH Reference Manual
2-1, 3-2, 3-8
2-2, 3-11
2-2
2-11
2-1
4-5
2-2
1-2
Error codes . . . . . . . . . . . . . . . . . . . . . . . . . 4-1, A-1
File
closing . . . . . . . . . . . . . . . . . . . . . . . . . .
opening for output . . . . . . . . . . . . . . . . .
Fill pattern . . . . . . . . . . . . . . . . . . . . . . . . . .
definition . . . . . . . . . . . . . . . . . . . . . . . .
Floating point . . . . . . . . . . . . . . . . . . . . . . .
format . . . . . . . . . . . . . . . . . . . . . . . . . . .
Footnote . . . . . . . . . . . . . . . . . . . . . . . . . . .
Functions . . . . . . . . . . . . . . . . . . . . . . . . . .
2-2
2-2
2-10, 3-6
5-5
3-11
2-2
3-3, 5-6
4-1
GCB . . . . . . . . . . . . . . . . . . . . . . . . . . . . . .
GCLRW . . . . . . . . . . . . . . . . . . . . . . . . . . .
GCLWK . . . . . . . . . . . . . . . . . . . . . . . . . . . .
GDF file . . . . . . . . . . . . . . . . . . . . . . . . . . . .
GE$EXP . . . . . . . . . . . . . . . . . . . . . . . . . . .
GE$PRC . . . . . . . . . . . . . . . . . . . . . . . . . . .
GE$XVL . . . . . . . . . . . . . . . . . . . . . . . . . . .
GE$YVL . . . . . . . . . . . . . . . . . . . . . . . . . . .
GE.DTX . . . . . . . . . . . . . . . . . . . . . . . . . . .
GE.DTY . . . . . . . . . . . . . . . . . . . . . . . . . . .
GE.FLG . . . . . . . . . . . . . . . . . . . . . . . . . . . .
GE.LBL . . . . . . . . . . . . . . . . . . . . . . . . . . . .
GE.SIZ . . . . . . . . . . . . . . . . . . . . . . . . . . . .
GE.TYP . . . . . . . . . . . . . . . . . . . . . . . . . . . .
GO.CAR . . . . . . . . . . . . . . . . . . . . . . . . . . .
GO.CSR . . . . . . . . . . . . . . . . . . . . . . . . . . .
GO.DSP . . . . . . . . . . . . . . . . . . . . . . . . . . .
GO.GGP . . . . . . . . . . . . . . . . . . . . . . . . . . .
GO.GRD . . . . . . . . . . . . . . . . . . . . . . . . . . .
GO.IMP . . . . . . . . . . . . . . . . . . . . . . . . . . . .
GO.INI . . . . . . . . . . . . . . . . . . . . . . . . . . . . .
GO.LOD . . . . . . . . . . . . . . . . . . . . . . . . . . .
GO.PGP . . . . . . . . . . . . . . . . . . . . . . . . . . .
GO.PRD . . . . . . . . . . . . . . . . . . . . . . . . . . .
GO.SAV . . . . . . . . . . . . . . . . . . . . . . . . . . .
GO.SCR . . . . . . . . . . . . . . . . . . . . . . . . . . .
GO.SUP . . . . . . . . . . . . . . . . . . . . . . . . . . .
GOPWK function . . . . . . . . . . . . . . . . . . . .
GP.BCL . . . . . . . . . . . . . . . . . . . . . . . . . . . .
2-1
2-1
2-2
2-11, 4-7, 4-9
3-10
3-10
3-10
3-10
3-11
3-11
3-10
3-11
3-10
3-11
3-2, 4-20
3-2
2-2, 3-1, 4-5
3-1, 4-11
3-2, 4-15
2-2, 3-1 to 3-2, 4-2
2-2, 3-1, 4-4
2-2, 2-11, 3-1, 4-7
3-1, 4-13
3-2, 4-17
2-2, 2-11, 3-1, 4-9
4-19
2-11, 3-2, 4-21
2-1
3-7
GRAPH Reference Manual, Rev. 01
GRAPH Reference Manual
Page Index-3
GP.FAP . . . . . . . . . . . . . . . . . . . . . . . . . . . .
GP.FOT . . . . . . . . . . . . . . . . . . . . . . . . . . .
GP.LGN . . . . . . . . . . . . . . . . . . . . . . . . . . .
GP.MRK . . . . . . . . . . . . . . . . . . . . . . . . . . .
GP.SIZ . . . . . . . . . . . . . . . . . . . . . . . . . . . .
GP.ST1 . . . . . . . . . . . . . . . . . . . . . . . . . . . .
GP.ST2 . . . . . . . . . . . . . . . . . . . . . . . . . . . .
GP.TCL . . . . . . . . . . . . . . . . . . . . . . . . . . . .
GP.TTL . . . . . . . . . . . . . . . . . . . . . . . . . . . .
GP.TXA . . . . . . . . . . . . . . . . . . . . . . . . . . . .
GP.TYP . . . . . . . . . . . . . . . . . . . . . . . . . . . .
GP.XEN . . . . . . . . . . . . . . . . . . . . . . . . . . .
GP.XGR . . . . . . . . . . . . . . . . . . . . . . . . . . .
GP.XIN . . . . . . . . . . . . . . . . . . . . . . . . . . . .
GP.XLB . . . . . . . . . . . . . . . . . . . . . . . . . . . .
GP.XPR . . . . . . . . . . . . . . . . . . . . . . . . . . .
GP.XST . . . . . . . . . . . . . . . . . . . . . . . . . . . .
GP.XTP . . . . . . . . . . . . . . . . . . . . . . . . . . . .
GP.YEN . . . . . . . . . . . . . . . . . . . . . . . . . . .
GP.YGR . . . . . . . . . . . . . . . . . . . . . . . . . . .
GP.YIN . . . . . . . . . . . . . . . . . . . . . . . . . . . .
GP.YLB . . . . . . . . . . . . . . . . . . . . . . . . . . . .
GP.YPR . . . . . . . . . . . . . . . . . . . . . . . . . . .
GP.YST . . . . . . . . . . . . . . . . . . . . . . . . . . . .
GP.YTP . . . . . . . . . . . . . . . . . . . . . . . . . . . .
GR.CLR . . . . . . . . . . . . . . . . . . . . . . . . . . .
GR.CNT . . . . . . . . . . . . . . . . . . . . . . . . . . .
GR.DAT . . . . . . . . . . . . . . . . . . . . . . . . . . .
GR.FLG . . . . . . . . . . . . . . . . . . . . . . . . . . .
GR.LST . . . . . . . . . . . . . . . . . . . . . . . . . . . .
GR.NUM . . . . . . . . . . . . . . . . . . . . . . . . . . .
GR.TTL . . . . . . . . . . . . . . . . . . . . . . . . . . . .
GRAPH . . . . . . . . . . . . . . . . . . . . . . . . . . . .
software . . . . . . . . . . . . . . . . . . . . . . . . .
GRAPH.H . . . . . . . . . . . . . . . . . . . . . . . . . .
GRAPH.SYS . . . . . . . . . . . . . . . . . . . . . . . .
Gray scale . . . . . . . . . . . . . . . . . . . . . . . . . .
GRFCLB.LIB . . . . . . . . . . . . . . . . . . . . . . . .
GRFSBR.SBR . . . . . . . . . . . . . . . . . . . . . .
GRFSYM.BSI . . . . . . . . . . . . . . . . . . . . . . .
GRFSYM.M68 . . . . . . . . . . . . . . . . . . . . . .
GTY keyword
type of graph . . . . . . . . . . . . . . . . . . . . .
GXG . . . . . . . . . . . . . . . . . . . . . . . . . . . . . .
3-6
3-3
3-8
3-8
3-2
3-3
3-3
3-7
3-3
3-3, 3-5
3-6
3-5
3-6
3-5
3-4
3-5
3-5
3-6
3-4
3-7
3-4
3-4
3-4
3-4
3-6
3-9
3-9
3-10
3-9
3-9
3-8
3-10
1-1, 2-1
1-1
2-1, 3-1
2-1, 3-1, 4-1
2-10
2-1
2-1, 3-1
2-1, 3-1
2-1, 3-1, 4-1
Impure area . . . . . . . . . . . . . . . . . . . . . . . .
Impure memory . . . . . . . . . . . . . . . . . . . . . .
loading . . . . . . . . . . . . . . . . . . . . . . . . . .
Initialization . . . . . . . . . . . . . . . . . . . . . . . . .
Initialize
2-11, 3-8
2-2, 3-2, 4-2
2-2
4-4
GRAPH Reference Manual, Rev. 01
5-1
5-3
Page Index-4
GRAPH Reference Manual
impure memory . . . . . . . . . . . . . . . . . . .
output device . . . . . . . . . . . . . . . . . . . . .
workstation . . . . . . . . . . . . . . . . . . . . . . .
Installation . . . . . . . . . . . . . . . . . . . . . . . . . .
2-2
2-1
2-1
1-1
Keyword
GBC . . . . . . . . . . . . . . . . . . . . . . . . . . . .
GFN . . . . . . . . . . . . . . . . . . . . . . . . . . . .
GFP . . . . . . . . . . . . . . . . . . . . . . . . . . . .
GMT . . . . . . . . . . . . . . . . . . . . . . . . . . . .
GnC . . . . . . . . . . . . . . . . . . . . . . . . . . . .
GnS . . . . . . . . . . . . . . . . . . . . . . . . . . . .
GnT . . . . . . . . . . . . . . . . . . . . . . . . . . . .
GS1 . . . . . . . . . . . . . . . . . . . . . . . . . . . .
GS2 . . . . . . . . . . . . . . . . . . . . . . . . . . . .
GTA . . . . . . . . . . . . . . . . . . . . . . . . . . . .
GTC . . . . . . . . . . . . . . . . . . . . . . . . . . . .
GTL . . . . . . . . . . . . . . . . . . . . . . . . . . . .
GUP . . . . . . . . . . . . . . . . . . . . . . . . . . . .
GXE . . . . . . . . . . . . . . . . . . . . . . . . . . . .
GXI . . . . . . . . . . . . . . . . . . . . . . . . . . . . .
GXL . . . . . . . . . . . . . . . . . . . . . . . . . . . .
GXP . . . . . . . . . . . . . . . . . . . . . . . . . . . .
GXS . . . . . . . . . . . . . . . . . . . . . . . . . . . .
GXT . . . . . . . . . . . . . . . . . . . . . . . . . . . .
GYE . . . . . . . . . . . . . . . . . . . . . . . . . . . .
GYG . . . . . . . . . . . . . . . . . . . . . . . . . . . .
GYI . . . . . . . . . . . . . . . . . . . . . . . . . . . . .
GYL . . . . . . . . . . . . . . . . . . . . . . . . . . . .
GYP . . . . . . . . . . . . . . . . . . . . . . . . . . . .
GYS . . . . . . . . . . . . . . . . . . . . . . . . . . . .
GYT . . . . . . . . . . . . . . . . . . . . . . . . . . . .
LGN . . . . . . . . . . . . . . . . . . . . . . . . . . . .
RnDm . . . . . . . . . . . . . . . . . . . . . . . . . . .
RnLm . . . . . . . . . . . . . . . . . . . . . . . . . . .
X-axis grid type . . . . . . . . . . . . . . . . . . .
5-4
5-6
5-5
5-4
5-7
5-7
5-8
5-6
5-6
5-5
5-4
5-6
5-6
5-3
5-3
5-6
5-3
5-3
5-3
5-2
5-2
5-2
5-7
5-2
5-2
5-1
5-5
5-8
5-8
5-3
Label . . . . . . . . . . . . . . . . . . . . . . . . . . . . . .
Legend . . . . . . . . . . . . . . . . . . . . . . . . . . . .
Legend enable . . . . . . . . . . . . . . . . . . . . . .
Line chart . . . . . . . . . . . . . . . . . . . . . . . . . .
Linestyle . . . . . . . . . . . . . . . . . . . . . . . . . . .
3-4, 3-11
2-10, 3-8
5-5
2-3 to 2-4, 3-6
3-9
Marker . . . . . . . . . . . . . . . . . . . . . . . . . . . . .
Memory
allocating . . . . . . . . . . . . . . . . . . . . . . . .
requirements . . . . . . . . . . . . . . . . . . . . .
Monochrome . . . . . . . . . . . . . . . . . . . . . . . .
2-11, 3-8
2-2
3-2, 4-2
2-10, 3-6
Negative data . . . . . . . . . . . . . . . . . . . . . . . 2-2, 2-6 to 2-8
GRAPH Reference Manual, Rev. 01
GRAPH Reference Manual
Page Index-5
Operating system . . . . . . . . . . . . . . . . . . . . 1-1
Options . . . . . . . . . . . . . . . . . . . . . . . . . . . . 2-10
Output . . . . . . . . . . . . . . . . . . . . . . . . . . . . . 2-2
Parameters . . . . . . . . . . . . . . . . . . . . . . . . . 3-2
Pie chart . . . . . . . . . . . . . . . . . . . . . . . . . . . 2-3, 2-7, 3-6
Prerequisites . . . . . . . . . . . . . . . . . . . . . . . . 1-1
Range
color . . . . . . . . . . . . . . . . . . . . . . . . . . . .
linestyle . . . . . . . . . . . . . . . . . . . . . . . . .
of data . . . . . . . . . . . . . . . . . . . . . . . . . .
title . . . . . . . . . . . . . . . . . . . . . . . . . . . . .
Reference books . . . . . . . . . . . . . . . . . . . . .
Registers . . . . . . . . . . . . . . . . . . . . . . . . . . .
Retrieval . . . . . . . . . . . . . . . . . . . . . . . . . . .
calls . . . . . . . . . . . . . . . . . . . . . . . . . . . .
5-7
5-7
2-2, 3-8
5-8
1-2
4-1
2-11
2-2
Scaling . . . . . . . . . . . . . . . . . . . . . . . . . . . .
Scatter chart . . . . . . . . . . . . . . . . . . . . . . . .
Stacked bar chart . . . . . . . . . . . . . . . . . . . .
Status . . . . . . . . . . . . . . . . . . . . . . . . . . . . .
Storage . . . . . . . . . . . . . . . . . . . . . . . . . . . .
calls . . . . . . . . . . . . . . . . . . . . . . . . . . . .
of text in GDF . . . . . . . . . . . . . . . . . . . . .
Subroutines . . . . . . . . . . . . . . . . . . . . . . . . .
Subtitle . . . . . . . . . . . . . . . . . . . . . . . . . . . .
Subtitle 1 . . . . . . . . . . . . . . . . . . . . . . . . . . .
Subtitle 2 . . . . . . . . . . . . . . . . . . . . . . . . . . .
System memory . . . . . . . . . . . . . . . . . . . . .
2-10
2-11
2-3, 2-6, 3-6
4-1
2-2, 2-11
2-2
2-11
2-1
2-10, 3-3
5-6
5-6
2-1
Text . . . . . . . . . . . . . . . . . . . . . . . . . . . . . . .
attributes . . . . . . . . . . . . . . . . . . . . . . . .
color . . . . . . . . . . . . . . . . . . . . . . . . . . . .
Text attributes . . . . . . . . . . . . . . . . . . . . . . .
Title . . . . . . . . . . . . . . . . . . . . . . . . . . . . . . .
Type of graph
keyword . . . . . . . . . . . . . . . . . . . . . . . . .
2-11
5-5
5-4
2-10, 3-5
2-10, 3-3, 3-10, 5-6
5-1
User
memory . . . . . . . . . . . . . . . . . . . . . . . . .
parameter text line . . . . . . . . . . . . . . . . .
pointer . . . . . . . . . . . . . . . . . . . . . . . . . .
text . . . . . . . . . . . . . . . . . . . . . . . . . . . . .
2-1
5-6
4-21
4-21
X-axis
end . . . . . . . . . . . . . . . . . . . . . . . . . . . . .
increment . . . . . . . . . . . . . . . . . . . . . . . .
label . . . . . . . . . . . . . . . . . . . . . . . . . . . .
prescale value . . . . . . . . . . . . . . . . . . . .
5-3
5-3
5-6
5-3
GRAPH Reference Manual, Rev. 01
Page Index-6
start . . . . . . . . . . . . . . . . . . . . . . . . . . . .
type . . . . . . . . . . . . . . . . . . . . . . . . . . . .
X-Y
chart . . . . . . . . . . . . . . . . . . . . . . . . . . . .
coordinate pair . . . . . . . . . . . . . . . . . . . .
Y-axis
end . . . . . . . . . . . . . . . . . . . . . . . . . . . . .
grid type . . . . . . . . . . . . . . . . . . . . . . . . .
increment . . . . . . . . . . . . . . . . . . . . . . . .
label . . . . . . . . . . . . . . . . . . . . . . . . . . . .
prescale value . . . . . . . . . . . . . . . . . . . .
start . . . . . . . . . . . . . . . . . . . . . . . . . . . .
type . . . . . . . . . . . . . . . . . . . . . . . . . . . .
GRAPH Reference Manual
5-3
5-3
2-3, 2-9, 3-6
2-2
5-2
5-2
5-2
5-7
5-2
5-2
5-1
GRAPH Reference Manual, Rev. 01