1
Model 831
Sound Level Meter
Technical Reference Manual
Larson Davis
Model 831
Technical Reference Manual
I831.01 Rev J Supporting Firmware Version 2.1
Copyright
Copyright 2006 - 2011, by PCB Piezotronics, Inc. This manual is copyrighted, with all rights reserved.
The manual may not be copied in whole or in part for any use without prior written consent of PCB
Piezotronics, Inc.
Disclaimer
The following paragraph does not apply in any state or country where such statements are not
agreeable with local law:
Even though PCB Piezotronics, Inc. has reviewed its documentation, PCB Piezotronics Inc. makes no
warranty or representation, either expressed or implied, with respect to this instrument and
documentation, its quality, performance, merchantability, or fitness for a particular purpose. This
documentation is subject to change without notice, and should not be construed as a commitment or
representation by PCB Piezotronics, Inc.
This publication may contain inaccuracies or typographical errors. PCB Piezotronics, Inc. will
periodically update the material for inclusion in new editions. Changes and improvements to the
information described in this manual may be made at any time.
Record of Serial Number and Purchase Date
Model 831
Serial Number: ___________
Preamplifier Model: _________
Serial Number: ___________
Microphone Model: _________
Serial Number: ___________
Recycling
PCB Piezotronics, Inc. is an environmentally friendly organization and encourages our customers to
be environmentally conscious. When this product reaches its end of life, please recycle the product
through a local recycling center or return the product to:
PCB Piezotronics, Inc.
Attn: Recycling Coordinator
1681 West 820 North
Provo, Utah, USA 84601-1341
where it will be accepted for disposal
I831.01 Rev J Supporting Firmware Version 2.1
Table of Contents
Chapter 1 Introduction
1-1
About This Manual................................................ 1-1
Features ............................................................... 1-5
Hardware Features ............................................................. 1-5
Basic Measurements........................................................... 1-6
Basic Operation................................................................... 1-6
Available Options ................................................................ 1-7
Standard Accessories ......................................................... 1-9
Optional Accessories ........................................................ 1-10
Model 831 Components ..................................... 1-16
Chapter 2 First Use .......................................... 2-1
Unpacking and Inspection .................................... 2-1
Connecting the Microphone and Preamplifier ...... 2-2
Connecting the Preamplifier ................................. 2-3
Disconnecting the Preamplifier............................. 2-4
Powering the Model 831....................................... 2-4
Battery Power...................................................................... 2-4
External Power Supply ......................................... 2-7
Hardware Power Switch ....................................... 2-7
Model 831 Power-Up Operation ........................... 2-8
Chapter 3 Overview .......................................... 3-1
Display and Softkeys ............................................ 3-1
Display Sections and Icons .................................. 3-2
Keypad ................................................................. 3-7
ON/OFF Key ....................................................................... 3-7
RESET Key ......................................................................... 3-9
TOOLS Key....................................................................... 3-10
LEFT and RIGHT Keys ..................................................... 3-12
UP and DOWN Keys ......................................................... 3-12
1-1
Model 831 Technical Reference Manual
ENTER Key ....................................................................... 3-12
RUN/PAUSE Key .............................................................. 3-12
STOP/STORE Key ............................................................ 3-12
Screens .............................................................. 3-13
Data Display Screen ......................................................... 3-15
Settings Screen ................................................................. 3-17
Tools Screen ...................................................... 3-19
Data Explorer ....................................................................
Setup Manager..................................................................
System Properties .............................................................
Lock...................................................................................
Communication .................................................................
Calibrate ............................................................................
Voice Recorder .................................................................
About .................................................................................
System Utilities..................................................................
3-20
3-20
3-21
3-21
3-22
3-22
3-22
3-22
3-23
Parameters in a Row.........................................................
Drop Down List..................................................................
Entering Alphanumeric Strings..........................................
Entering Numeric Data ......................................................
3-24
3-25
3-26
3-27
Parameter Selection ........................................... 3-24
Chapter 4
Basic Measurement Setup ............4-1
Settings Screen .................................................... 4-1
Setup Pages ......................................................... 4-2
General Page ...................................................................... 4-3
SLM Page ........................................................................... 4-4
Octave Band Analyzer Page (Optional) .............................. 4-6
Ln Page ............................................................................... 4-8
Control Page ....................................................................... 4-9
Triggers Page.................................................................... 4-11
Day/Night .......................................................................... 4-13
Exiting Settings Screen ...................................... 4-15
Model 831 Technical Reference Manual
1-2
Table of Contents
Setup Manager ................................................... 4-16
Change to LD Default Setup .............................................
Utilizing a User-Defined Setup ..........................................
Modifying the Active Setup................................................
Save Modified Setup .........................................................
User-Defined Setup File Operations .................................
Close Setup Manager .......................................................
4-18
4-20
4-21
4-22
4-24
4-25
Chapter 5 Basic Data Display ......................... 5-1
Data Labels .......................................................... 5-1
Tabbed Page Structure ........................................ 5-1
Live Page.............................................................. 5-2
SLM Display ........................................................................ 5-2
Large Digit Sound Level ...................................................... 5-4
1/1 Octave Band Analyzer (Optional).................................. 5-5
1/3 Octave Band Analyzer (Optional).................................. 5-6
Triggering ............................................................................ 5-7
Preamp Display ................................................................... 5-8
Time, Battery Voltage and Memory................................... 5-11
Overall Page....................................................... 5-12
Leq ....................................................................................
Overall Large Digit Sound Level .......................................
Overall SLM .....................................................................
1/1 Octave Band Analyzer (Optional)................................
1/3 Octave Band Analyzer (Optional)................................
Ln Percentiles ...................................................................
Spectral Ln (Optional) .......................................................
Exceedances.....................................................................
Overloads ..........................................................................
5-12
5-14
5-15
5-16
5-17
5-18
5-19
5-20
5-21
C-A and Impulsivity............................................. 5-22
Industrial Hygiene ............................................................. 5-23
Status Page....................................................................... 5-23
1-3
Model 831 Technical Reference Manual
Session Log Page .............................................. 5-24
Voice Message/Sound Recording Playback ..................... 5-26
Adjust Graph Scale............................................. 5-27
View Spectrum Normalized ................................ 5-28
Live Display ....................................................................... 5-28
Overall Display .................................................................. 5-35
Any Level Display ............................................... 5-40
Live Screen ....................................................................... 5-41
Overall Screen .................................................................. 5-42
Chapter 6 Run Control ..................................... 6-1
Run Control Setup ................................................ 6-1
Run Mode with Measurement History .................. 6-3
Run Modes Without Measurement History........... 6-4
Manual Stop, Timed Stop or Stop When Stable ................. 6-4
Continuous .......................................................................... 6-6
Single Block Time or Daily Timer ........................................ 6-8
Chapter 7 Making a Measurement .................. 7-1
Configuration of the System ................................. 7-1
Switching On the Model 831................................. 7-1
Start-up Period .................................................................... 7-2
Views................................................................................... 7-3
Softkeys .............................................................................. 7-3
Model 831 Setup .................................................. 7-4
Calibrating the Model 831..................................... 7-4
Positioning the Model 831 .................................... 7-4
Observer Position................................................................ 7-4
Microphone Extension Cable .............................................. 7-4
Use of a Windscreen ........................................................... 7-5
Performing the Measurement ............................... 7-6
Starting the Measurement ................................................... 7-6
Model 831 Technical Reference Manual
1-4
Table of Contents
Data Display ........................................................................ 7-7
Measurement Range........................................................... 7-8
Pausing the Measurement .................................................. 7-9
Back Erase ........................................................................ 7-10
Resetting the Measurement .............................................. 7-13
Stopping the Measurement ............................................... 7-14
Storing the Measurement ................................... 7-15
Low Level Sound Fields .................................................... 7-16
Recovery After Improper Shutdown ................... 7-17
Case 1 ............................................................................... 7-17
Case 2 ............................................................................... 7-17
Chapter 8 Industrial Hygiene .......................... 8-1
Measurement Setup ............................................. 8-1
Predefined Setups............................................................... 8-2
Parameters Individually Defined ......................................... 8-3
Data Display ......................................................... 8-5
Sound Exposure.................................................................. 8-5
Dosimeter 1 and 2 ............................................................... 8-6
SEA ..................................................................................... 8-8
Chapter 9 Voice Recording ............................. 9-1
Control Page - Voice Recording ........................... 9-1
Voice Recorder..................................................... 9-2
Record................................................................................. 9-3
Playback.............................................................................. 9-4
Chapter 10 Time History .................................. 10-1
Metrics Logged ................................................... 10-1
Acoustical Metrics ............................................................. 10-2
Non-Acoustical Metrics ..................................................... 10-3
Time History Setup ............................................. 10-4
Set Time History Period .................................................... 10-5
1-5
Model 831 Technical Reference Manual
Select Time History Metrics .............................................. 10-6
Time History Display........................................... 10-9
Single Value Metrics ......................................................... 10-9
Frequency Spectra .......................................................... 10-12
Frequency Band Time History......................................... 10-14
Locate Record Number .................................... 10-16
Link to Measurement History Display ............... 10-17
Markers............................................................. 10-18
Markers Setup ................................................................. 10-18
Using Markers ................................................................. 10-20
Markers on Time History Display .................................... 10-21
Chapter 11 Measurement History ...................11-1
Run Control with Measurement History.............. 11-1
Continuous and Timer Modes ............................ 11-2
Interval Time Sync ............................................................ 11-2
Timed Stop Mode ............................................... 11-3
Manual and Stop When Stable Modes ............... 11-5
Display of Measurement History Data ................ 11-6
Current Page ..................................................................... 11-6
Measurement Page ........................................................... 11-7
Storing a Measurement History ........................ 11-12
Link to Time History.......................................... 11-12
Chapter 12 Event History ................................12-1
Level Based Events............................................ 12-1
Event History Setup............................................ 12-2
Trigger Method ................................................... 12-3
Level Trigger Method ........................................................ 12-4
Dynamic Trigger Method ................................................... 12-5
Event Time History Setup................................. 12-10
Model 831 Technical Reference Manual
1-6
Table of Contents
Period ..............................................................................
Spectral Mode .................................................................
Pre/Post Trigger ..............................................................
Maximum Number of Samples ........................................
12-10
12-11
12-11
12-12
Trigger Status Icons ........................................................
Sound Recording in Progress .........................................
Levels Display .................................................................
1/1 Octave Spectrum Display..........................................
1/3 Octave Spectrum Display..........................................
Event Time History Display .............................................
Event Spectra Time History Display................................
By-Time Event Spectral Time History .............................
12-14
12-15
12-16
12-17
12-18
12-19
12-20
12-22
Event History Display ....................................... 12-13
Link to Time History and Measurement History 12-24
Chapter 13 RT-60
13-1
Accessing RT-60 Mode ...................................... 13-1
Making a Measurement ...................................... 13-4
Measurement State Sequence.......................................... 13-5
Viewing and Analyzing Results .......................... 13-8
Excluding Samples from the Ensemble .......................... 13-15
Manually Controlling the Internal Noise Source 13-17
Hints on Making a Good RT-60 Measurement................ 13-20
Customizing Measurements ............................. 13-22
General Settings .............................................................
RT-60 Settings ................................................................
RT-60 Advanced Menu ...................................................
Source Menu ...................................................................
Storing Data......................................................
Viewing Stored Data.........................................
Quality Indicators..............................................
Accuracy Grade................................................
1-7
13-22
13-23
13-24
13-26
13-28
13-29
13-30
13-32
Model 831 Technical Reference Manual
Return to Sound Level Meter Mode.................. 13-34
Chapter 14 FFT .................................................14-1
Accessing FFT Mode.......................................... 14-1
Configuring a Measurement ............................... 14-3
General Tab ...................................................................... 14-3
FFT Tab ............................................................................ 14-4
Control Tab ....................................................................... 14-6
Viewing and Analyzing Results .......................... 14-9
Changing the Cursor Type .............................................. 14-12
Additional Information ..................................................... 14-15
Storing Data...................................................... 14-17
Viewing Stored Data......................................... 14-17
Return to Sound Level Meter Mode.................. 14-18
Chapter 15 Sound Recording ..........................15-1
Sound Recording Types ..................................... 15-1
Sound Recording Setup ..................................... 15-2
Sample Rate ..................................................................... 15-2
Sound Recording Range ................................................... 15-5
Manual Sound Recording ................................... 15-7
Marker Initiated Recording ............................... 15-10
Markers Setup ................................................................. 15-10
Recording Time Setup .................................................... 15-12
Initiating a Recording ...................................................... 15-13
Event Sound Recording.................................... 15-15
Recording Status Icon ..................................................... 15-19
Measurement History Sound Recording........... 15-19
Recording Status Icon ..................................................... 15-20
Combined Sound Recordings........................... 15-20
Sound Recording Playback .............................. 15-21
Model 831 Technical Reference Manual
1-8
Table of Contents
Playback from Session Log............................................. 15-21
Playback from Data Display Screen................................ 15-23
Measurement Recordings ............................................... 15-24
Chapter 16 Data Explorer ................................ 16-1
Control Panel - Data Explorer............................. 16-1
Data Explorer...................................................... 16-2
Scrolling ............................................................................ 16-3
Menu Softkey .................................................................... 16-4
Chapter 17 System Properties ........................ 17-1
Control Panel - System Properties ..................... 17-1
Device................................................................. 17-2
Time.................................................................... 17-3
Power ................................................................. 17-5
Battery Type ...................................................................... 17-5
Auto-Off Time .................................................................... 17-6
Power-Save Time.............................................................. 17-7
Backlight Time................................................................... 17-9
Backlight............................................................................ 17-9
Display Contrast .............................................................. 17-10
External Shutoff Voltage ................................................. 17-10
Preferences ...................................................... 17-11
Microphone Correction ....................................................
Auto-Store .......................................................................
Jack Function ..................................................................
Reset Prompting .............................................................
Takt Maximal Data ..........................................................
USB Host Port .................................................................
GPS Mode.......................................................................
Time Zone .......................................................................
17-11
17-12
17-13
17-13
17-14
17-14
17-15
17-16
Localization....................................................... 17-17
Languages .................................................................. 17-17
1-9
Model 831 Technical Reference Manual
Decimal Symbol .............................................................. 17-19
Date Format .................................................................... 17-19
Units ................................................................................ 17-19
Displays ............................................................ 17-20
Start................................................................................. 17-21
Selecting Displays to Appear .......................................... 17-21
Options ............................................................. 17-26
Logic I/O ........................................................... 17-28
Logic Out ......................................................................... 17-29
Chapter 18 Non-Acoustical Inputs .................18-1
831-INT............................................................... 18-1
Weather Measurement Using 831-INT............... 18-2
Larson Davis Sensors ....................................................... 18-2
Vaisala Weather Station.................................................... 18-5
Display .............................................................................. 18-8
Location Measurement Using 831-INT............. 18-10
Setup ............................................................................... 18-10
Chapter 19 Communication ............................19-1
Control Panel - Communication.......................... 19-1
Modem Page ...................................................... 19-3
Setup ................................................................................. 19-5
Common Pitfalls in Analog Modem Communication: ........ 19-5
Wireless Page .................................................... 19-6
Setup ................................................................................. 19-7
RS-232 Page ...................................................... 19-8
Required Components ...................................................... 19-8
Setup ................................................................................. 19-9
Troubleshooting................................................ 19-11
Status Page ...................................................... 19-19
Analog ............................................................................. 19-19
Model 831 Technical Reference Manual
1-10
Table of Contents
Wireless ..........................................................................
RS-232 ............................................................................
USB .................................................................................
States ..............................................................................
Communications Watchdog ............................................
19-20
19-21
19-21
19-22
19-24
Chapter 20 Lock/Unlock the Model 831 ......... 20-1
Control Panel - Lock ........................................... 20-1
Lock Modes....................................................................... 20-2
Unlock Code...................................................................... 20-3
Allow Cal When Locked .................................................... 20-4
Fully Locked .......................................................
Locked With Auto-Store......................................
Locked With Manual-Store .................................
Calibration When The Model 831 Is Locked.......
20-5
20-7
20-8
20-9
Chapter 21 Calibration ..................................... 21-1
Calibration Overview .......................................... 21-1
Control Panel - Calibrate .................................... 21-2
Acoustic Calibration............................................ 21-5
Calibrator........................................................................... 21-5
Microphone Selection........................................................ 21-8
Performing the Calibration ................................................ 21-9
Calibration History ........................................................... 21-11
Sensitivity Page ................................................ 21-13
Noise Floor ...................................................................... 21-13
Overload Level ................................................................ 21-14
Under Range Level ......................................................... 21-14
Calibration Without Preamplifier .......................
Certification.......................................................
E.A. Check........................................................
E.A. History.......................................................
1-11
21-15
21-16
21-18
21-20
Model 831 Technical Reference Manual
Chapter 22 About ............................................. 22-1
Control Panel - About ......................................... 22-1
About .................................................................. 22-2
Standards ........................................................... 22-3
Options ............................................................... 22-4
User .................................................................... 22-4
Chapter 23 System Utilities .............................23-1
Control Panel - System Utilities .......................... 23-1
File System......................................................... 23-2
Check File System ............................................................ 23-2
Format ............................................................................... 23-3
Format & Restore Defaults................................................ 23-3
Check/Repair USB ............................................................ 23-3
Format USB ...................................................................... 23-4
Chapter 24 831 Hardware ................................24-1
Components ....................................................... 24-1
Block Diagram .................................................... 24-3
Microphones and Microphone Preamplifier....................... 24-4
Display .............................................................................. 24-4
Keypad .............................................................................. 24-5
Connectors and Interfaces ................................................ 24-8
Batteries ........................................................... 24-10
External Power Supply ..................................... 24-12
USB Port Power .............................................................. 24-12
External Voltage .............................................................. 24-12
Low Voltage Shutdown ................................................... 24-13
Sudden Loss of External Voltage .................................... 24-13
Chapter 25 Parameters Measured ..................25-1
Basic Sound Level Measurements ..................... 25-1
Model 831 Technical Reference Manual
1-12
Table of Contents
Frequency Weighting ........................................................
RMS Averaging .................................................................
Sound Level Metrics Measured.........................................
1/1 and/or 1/3 Octave Frequency Spectra ........................
25-1
25-2
25-2
25-2
Sound Exposure Metrics Measured ................... 25-3
Statistical Metrics Measured............................... 25-4
Broadband Statistics ......................................................... 25-4
Spectral Statistics.............................................................. 25-5
Exceedance Counters ........................................ 25-6
Miscellaneous Parameters ................................. 25-6
S.E.A. ................................................................................ 25-6
Time History (831-LOG Required)...................... 25-6
Measurement History (831-ELA Required) ........ 25-6
Event History (831-ELA Required) ..................... 25-6
Chapter 26 Memory Utilization ........................ 26-1
Out Of Memory Stop........................................... 26-1
Overall Data........................................................ 26-1
Session Log........................................................ 26-1
Measurement History ......................................... 26-2
Time History ....................................................... 26-2
Events................................................................. 26-2
Voice Messages ................................................. 26-3
Sound Recording................................................ 26-3
Bad Flash Blocks................................................ 26-4
Chapter 27 Upgrade Firmware and Options .. 27-1
SLM Utility-G3 .................................................... 27-1
Upgrading Model 831 Firmware ......................... 27-2
Upgrading Options.............................................. 27-7
1-13
Model 831 Technical Reference Manual
Saving an Option Upgrade File ......................................... 27-7
Implementing the Option Upgrade .................................... 27-7
Appendix A Technical Specifications
.. A-1
Standards Met by Model 831............................... A-1
Model 831 Specifications..................................... A-2
Features ............................................................................. A-2
Sound Level Meter Specifications ...................................... A-3
Performance Specifications ............................................... A-4
Physical Characteristics ..................................................... A-8
General Specifications ....................................................... A-8
Resolution Specifications ................................................... A-9
Frequency Weightings ..................................................... A-10
Typical Z-Weight Frequency Response ........................... A-12
AC/DC Output .................................................................. A-14
Min/Max Integration Time................................................. A-15
Time of Day Drift .............................................................. A-16
Time Variations Between Session Log and Overall Start Time.
A-16
Power Supply ................................................................... A-17
CE Information................................................... A-19
1/1 and 1/3 Octave Filters ................................. A-21
1/1 Octave Filter Linearity ................................................ A-23
1/3 Octave Filter Linearity ................................................ A-26
1/3 Octave Filter Summation............................................ A-27
Minimum Residual Filter Decay Time for RT 60 (option 831-RT)
A-29
Position of Instrument and Operator.................. A-30
Effect of Windscreen ........................................................ A-30
Frequency Response ........................................ A-32
Plane Parallel to Display Screen ...................................... A-32
Perpendicular to Plane of Display Screen........................ A-40
Model 831 Technical Reference Manual
1-14
Table of Contents
Directional Characteristics ...............................................
Random Incidence ...........................................................
Noise Levels.....................................................................
Microphone Preamplifier Specifications ...........................
Model PRM831 ................................................................
A-44
A-47
A-48
A-56
A-57
Vibration Sensitivity ........................................... A-62
Vibration Parallel to Microphone Diaphragm.................... A-62
Vibration Perpendicular to Microphone Diaphragm.......... A-62
Appendix B Measuring to IEC61672-1 ........... B-1
Sections 5, 6, 7 and 9 (except 9.3)...................... B-1
Section 9.3 ......................................................................... B-9
Appendix C Integrated Level Calculations .. C-1
Basic Integrated Level Calculations .................... C-1
Equivalent Continuous Sound Level ..................................
Time-Weighted Averages...................................................
Dose and Projected Dose Calculations..............................
Sound Exposure Calculations ............................................
C-1
C-2
C-5
C-7
Community Noise Descriptors ............................. C-9
Appendix D
1-15
Glossary....................................... D-1
Model 831 Technical Reference Manual
CHAPTER
1
Introduction
Welcome to the Larson Davis Model 831. This versatile
instrument, with graphic display, performs the functions
of several instruments. It puts the combined features of a
precision sound level meter and a real-time frequency
analyzer in the palm of your hand.
About This Manual
This manual has 27 chapters and 4 appendices covering the
following topics:
Chapters
Model 831 Technical Reference Manual
•
Chapter 1 - Introduction: Orients the user to the
contents of this user manual and the Model 831 features,
functions and measurement capabilities.
•
Chapter 2 - First Use: Describes the process of
unpacking the Model 831 and preparing for first use.
•
Chapter 3 - Overview: A brief discussion of the
displayed views, the keypad and navigation through the
various functions of the Model 831.
•
Chapter 4 - Basic Measurement Setup: A detailed
description of setting up the Model 831 for the
measurement of basic sound level parameters. Includes a
description of the Setup Manager.
•
Chapter 5 - Basic Data Display: A detailed look at the
various metrics and information presented on these
screens during and following a basic sound level
measurement.
•
Chapter 6 - Run Control: The Model 831 provides a
number of run modes to control the time duration of a
measurement. The most simple are Manual Stop, Timed
Stop and Stop when Stable. More advanced are the
Continuous, Single Block Time and Daily Timer modes
which are available when the optional firmware 831ELA is enabled. These are all described in detail in this
chapter.
Introduction
1-1
1-2
•
Chapter 7 - Making a Measurement: Describes the
important steps in making an accurate sound level
measurement.
•
Chapter 8 - Voice Recording: The user is instructed in
the process of recording, reviewing and saving voice
annotations.
•
Chapter 9 - Industrial Hygiene: Describes the
measurement of noise dose and noise exposure using the
optional firmware 831-IH.
•
Chapter 10 - Time History: Describes the use of the
optional firmware 831-LOG for measuring time history
data.
•
Chapter 11 - Measurement History: Describes the use
of the optional firmware 831-ELA for performing a
sequence of measurements using the same setup, either
manually or automatically.
•
Chapter 12 - Noise Exceedance History: Describes the
use of the optional firmware 831-ELA for measuring
data associated with threshold exceedance-based noise
events.
•
Chapter 13: RT60: Describes the RT60 instrument
mode (831-RT) and making reverberation time
measurements.
•
Chapter 14 - FFT: Describes the FFT instrument mode
(831-FFT) and making FFT measurements.
•
Chapter 15 - Sound Recording: Describes the digital
sound recording features associated with the optional
firmware 831-SR.
•
Chapter 16 - Data Explorer: Learn to use the Data
Explorer to view stored data files, load settings from a
saved data file and other operations.
•
Chapter 17 - System Properties: A discussion of
instrument related functions including date/time,
backlight, language, units and using the USB port.
•
Chapter 18 - Non-Acoustical Inputs: This chapter
discusses the use of external transducers and devices to
provide non-acoustical data to the Model 831. Included
About This Manual
Model 831 Technical Reference Manual
are the following: 831-INT Interface Unit, Weather
(Wind, Temperature and Humidity) and Location using
GPS device
Model 831 Technical Reference Manual
•
Chapter 19- Communication: The Communication
Pages are used to setup communications between the
Model 831 and a PC using dial-up modems, GSM
cellular telephones and RS-232 devices.
•
Chapter 20 - Lock and Unlock The Model 831: A
discussion of the various scenarios to lock or unlock the
Model 831 and the interaction with running a
measurement.
•
Chapter 21- Calibration: Describes the process of
calibrating the Model 831.
•
Chapter 22 - About: A look at basic Model 831 system
related info2mation.
•
Chapter 23 - System Utilities: A description of the
utilities available within the Model 831.
•
Chapter 24 - Model 831 Hardware: Describes the
Model 831 hardware including functionality of front
panel keys, connectors and interfaces.
•
Chapter 25 - Parameters Measured: An overview of
the many parameters measured and recorded by the
Model 831.
•
Chapter 26 - Memory Utilization: Presents formulas to
calculate the amount of memory used by the parameters
which can be stored to internal memory or USB memory.
•
Chapter 27 - Upgrade Firmware: Describes the
procedure for upgrading firmware versions and adding
options to the Model 831.
•
Appendix A - Technical Specifications: Provides a
listing of acoustic, electronic, environmental and
physical characteristics of the Model 831.
•
Appendix B - Measuring to IEC61672-1: Provides
specifications and information specifically required to
appear in the manual by this standard.
•
Appendix C - Integrated Level Calculations: provides
information on TWA, Leq, SEL, Dose and Projected
Dose calculations.
About This Manual
1-3
•
1-4
About This Manual
Appendix D - Glossary: Contains technical definitions
of key acoustic and vibration terms.
Model 831 Technical Reference Manual
Features
Hardware Features
The Larson Davis Model 831 has the following features:
Model 831 Technical Reference Manual
•
Precision integrating sound level meter
•
250 MB unformatted standard data memory
(2 GB optional)
•
160 X 240 graphic LCD display with backlight and
icon-driven user interface
•
Quiet Touch elastomeric keypad
•
Large dynamic range , > 120 dBA
•
RMS Detectors: Slow, Fast & Impulse
•
RMS Frequency Weighting: A, C & Z
•
Peak Frequency Weighting: A, C & Z
•
Any LevelTM: Simultaneous measurement and display
of Max and Min sound pressure levels (Slow, Fast and
Impulse detectors), plus Leq and Peak levels, all with
A, C and Z frequency weighting.
•
Weather Measurements (Wind Speed and Direction,
Temperature and Humidity)
•
Jack for AC/DC output or headset microphone and
speaker
•
Compatible with 61 m (200 ft.) microphone extension
cable (full scale to 20 kHz)
•
4-AA batteries provide greater than 8 hour operating
time
•
Dust tight (IP53) durable plastic case with tripod
mount (tripod not included) and lanyard
•
USB 2.0 full speed host connector for mass storage,
cellular and dial-up modems and future devices.
•
USB 2.0 full speed peripheral connector for control
and data download by a PC.
Features
1-5
•
AUX control connector for USB remote power,
weather transducers and the 831-INT.
•
I/O connector for communicating with peripheral
devices such as weather transducers.
•
Multiple language support: English, French,
German, Italian, Norwegian, Portuguese (pt and br),
Spanish and Swedish.
•
Field-upgradeable firmware
•
SPL, Leq, Lmax, Lmin, Lpeak, Lpeak(max)
•
2 RMS event counters and 3 Peak event counters
•
LN statistics: computed to 0.01% with 0.1 dB
accuracy over the range L0.01 through L99.99, with
display of six on the meter, and Histogram tables.
•
Status Bar and About display
•
Auto-Store with Auto-Reset
•
Run Timer and Stop-When-Stable Control
•
Back-erase
•
Markers to annotate portions of time histories
•
Real-time clock
•
Start time, elapsed time and paused time
•
Time stamping for Lmax, Lmin, Lpeak(max) metrics
•
Session Log
•
Lock functions
•
Calibration with calibration history and list of
calibrators
•
Power management
•
Status bar and About display
•
Names Setup files and Setup Manager
•
Data files and Data Explorer
Basic Measurements
Basic Operation
1-6
Features
Model 831 Technical Reference Manual
•
Automatic data backup to prevent data loss on power
failure
•
Overall measurement
•
Community Noise Measurement
•
Voice Annotation
•
GPS Data
Available Options
The Model 831 is delivered with all firmware options
available at the time of manufacture already installed.
However, only those options which have been purchased
have been enabled. Any of the other firmware options can be
enabled at a later date, following purchase, using a file
delivered from Larson Davis via the internet.
Purchase Required Options
Model 831 Technical Reference Manual
•
Real-time 1/1 & 1/3 Octave Frequency Analysis
(831-OB3)
•
Measurement History for the manual or timed
storage of statistical data (831-ELA)
•
Automatic Data Logging with periods from 20 ms to
24 hour (831-LOG).
•
Fast Spectral Time History Data Logging with
intervals of 2.5, 5.0 or 10 ms (831-FST, requires 831LOG and 831-OB3)
•
Exceedance-based Logging Analysis with Events
(831-ELA). Automatic sound recordings can also be
made when the 831-SR option is also enabled.
•
Industrial Hygiene Measurement (831-IH)
•
Sound Recording (831-SR)
•
2 GB Memory (831-MEM2G)
•
Advanced IP Communication
connectivity (831-COMM)
•
RT60 (831-RT): Instrument mode for measuring
reverberation time.
•
FFT (831-FFT): FFT Instrument mode
Features
for
Cellular
1-7
No Charge Options
The following options are available at no additional charge:
1-8
Features
•
Weather Data: Wind Speed and
Temperature, Humidity (831-WTHR)
Direction,
•
Analog Modem or RS-232 Communication
(831-MDM)
Model 831 Technical Reference Manual
Standard Accessories
Some of these options may not be
provided with systems designed for
specific applications.
The Model 831 is generally delivered with the standard
accessories described below.
Microphone Preamplifier
•
PRM831 (16 to 140 dB measurement range)
•
377B02 1/2” free-field prepolarized microphone,
50 mV/Pa, providing performance conforming to
Class 1 sound level meter standards.
Microphone
or
•
377B20 1/2” random incidence prepolarized
microphone, 50 mV/Pa, providing performance
conforming to Class 1 sound level meter standards.
•
SLM Utility-G3 software for setup, control and high
speed data download. A CBL138 USB cable is
required to utilize the software.
Software CD
Accessory Kit
Included with purchase of 831-FF or
831-RI; not included when Model
831
is
purchased
without
microphone and preamplifier.
831-ACC including:
•
831-CCS Hard Shell Case
•
PSA029 Universal AC Power Adaptor, providing
power from PC via USB port
•
CBL138 USB to mini-B cable, 1.8 m
•
WS001 3 1/2” Windscreen
•
4 Rechargeable AA NiMH batteries
•
Lanyard
Other
Model 831 Technical Reference Manual
Features
1-9
Optional Accessories
Microphones
•
1/2” free-field prepolarized microphone, 50 mV/Pa
•
1/2” random incidence prepolarized microphone,
50 mV/Pa
•
1/4” free-field prepolarized microphone, 4 mV/Pa, for
higher level and/or higher frequency measurements
(ADP043 adaptor required).
•
1/4” pressure prepolarized microphone, 1.6 mV/Pa,
for higher level and/or higher frequency
measurements (ADP043 adaptor required).
•
1/2” ICP Low Noise Microphone Preamplifier
(requires adaptor ADP074)
•
426A12 Outdoor Microphone Preamplifier
•
426A12-NPT: Coupler, 1.5”X27”ISO228-1 to NPT
thread
•
EPS2106-2
Environmental
Shell,
protects
microphone and preamplifier from rain and wind.
Use with tripod TRP003
•
EPS2108-2
Environmental
Shell,
protects
microphone and preamplifier from rain and wind.
Use with tripod TRP002
•
EPS029-831 Weather-proof enclosure for remote
noise monitoring; includes two batteries and
microphone mast.
•
EPS030-831: Weather-proof enclosure for remote
noise monitoring; includes battery.
•
EPS031: Pole mount weather proof fiberglass
enclosure for AC power and mounting to TRO019XX and TRP020-XX series tripods; includes
enclosure, internal brackets and 9AH backup battery.
Microphone Preamplifiers
Environmental Protection
1-10
Features
Model 831 Technical Reference Manual
•
EPS032: Pole mount weather proof fiberglass
enclosure for solar power and mounting to TRP019XX and TRP020-XX series tripods; includes
enclosure, internal brackets and solar charger.
•
EPS033: Steel security band for NMS systems.
•
NMS016: Permanent noise monitoring system with
weather proof enclosure and tilt down pole designed
for AC power; includes Model 831, EPS031, 831-INT,
17' pole, 426A12, 9AH backup battery and fiberglass
enclosure.
•
NMS017: Permanent noise monitoring system with
weather proof enclosure and tilt down pole designed
for solar power.; includes Model 831, EPS032, 831INT, 17’ pole, 425A12, solar charger and fiberglass
enclosure. Optional solar accessories include the
following:
•PSA012-80 80W SOLAR PANEL
•PSA012-50 50W SOLAR PANEL
•BAT012 100AH BATTERY
•
NMS018: Portable Noise monitoring system with
weather proof enclosure and tripod designed for AC
power; includes Model 831, EPS031, 831-INT, heavy
duty tripod (10’, 15’ and 20’ configurable heights),
426A12, 9AH back up battery and fiberglass
enclosure.
•
NMS019: Permanent noise monitoring system with
weather proof enclosure and tripod system designed
for solar power; includes Model 831, EPS032, 831INT, heavy duty tripod (10’, 15’ and 20’ configurable
heights), 426A12, solar charger and fiberglass
enclosure. Optional solar accessories include the
following:
•PSA012-80 80W Solar Panel
•PSA012-50 50W Solar Panel
•BAT012 100AH Battery
•BAT013 2X21AH batteries
Model 831 Technical Reference Manual
Features
1-11
Weather Data Acquisition
•
831-INT: 831 Interface Unit for use with 426A12
Outdoor Microphone Preamplifier and weather
sensors.
•
SEN028: Wind Monitor; Speed and Direction
•
SEN029: Anemometer; Speed and Direction
(Low Cost)
•
SEN030: Sensor; Temperature and Humidity
•
SEN031: Sensor; Vaisala Weather Station
•
MDMUSB-A: Modem V.90 Dial-up with USB
Interface
•
MDMUSB-E: Modem Edge USB Wireless QuadBand GSM
•
DVX008A: USB to RS232, 9 Pin Adaptor
•
CBL117: Serial Null Modem Cable, Connects
DVX008A to PC Serial Port
•
831-INT-ET: 831-INT with integrated Ethernet
capability
•
GPS001: GPS Receiver, USB Magnetic Mount
Communication
GPS
Equivalent Electrical Impedance Adaptor
An equivalent electrical impedance adapter can be used in
place of the microphone when very high impedance
measurements need to be made and the instrument is being
tested electrically. The adapter is simply a series capacitor
with the same capacitance as the microphone it is replacing.
The following adapters will be available for sale. If square
wave pulse measurement is to be performed, then the
adapter must also be used with a 100 kHz, low pass, T filter.
1-12
Features
•
ADP002 6.8pF Adaptor for 1/4 in., 7pF microphone
•
ADP090 12pF for 1/2 in., 12pF microphone
Model 831 Technical Reference Manual
Cables
Direct Input Cable or Adaptor
•
Microphone Extension Cable: EXCXXX (shielded),
where XXX is the length in feet (XXX = 010, 020, 050,
100 and 200 available).
•
USB Cable: CBL138
•
AC/DC Output Cable: CBL139
Cables for Environmental Monitoring
•
CBL152: Cable; 426A12 to 831 Signal, 20’
•
CBL153: Cable; 426A12 to 831-INT Control, 20’
•
CBL154: Cable; 426A12 to Model 831 Control, 20’
•
CBL144: Cable; PRM2100 to 831 Signal, 20’
•
CBL145: Cable; PRM2100 to 831 Control, 20’
•
CBL146: Cable; PRM2100 to 831-INT Control, 20’
Cable for use with PSA027 Universal Input Power
Supply AC Power Adaptor
•
CBL140: Cable; 831 Power, 2.5 mm JACK, 1’
•
PSA027: Universal 90-240 AC Power Adaptor
providing power from electrical outlet, used to power
the Model 831 in conjunction with CBL140, CBL145
or CBL154. 1.25 A, 2.5X5.5X14 mm
Power Supply
Model 831 Technical Reference Manual
Features
1-13
Tripods
•
TRP001: Instrument/Camera Tripod with ADP032
1/2 in. microphone clip. Use with EPS2108-2.
•
TRP002: Microphone Stand with Boom.
•
TRP003: Support Tripod, heavy duty, can be used
with EPS029, EPS030 and EPS2106-2.
•
ADP034: Mounting adapter to attach EPS2106-2 to
TRP003
•
ADP091: Mounting adapter, 426A12 TO TRP003
•
TRP019: Permanent 17' tilt down pole. Use with
EPS031 AND EPS032.
•
TRP020-06:Heavy duty 6' tripod. Use with 426A12,
EPS030-831 AND EPS029-831. Note: EPS031 AND
EPS032 are not for use with this tripod.
•
TRP020-10: Heavy duty 10' tripod. Use with 426A12,
EPS030-831, EPS029-831, EPS031 and EPS032.
•
TRP020-15: Heavy duty 15' tripod. Use with 426A12,
EPS030-831, EPS029-831, EPS031 and EPS032.
•
TRP020-20: Heavy duty 20' tripod. Use with 426A12,
EPS030-831, EPS029-831, EPS031 and EPS032.
•
ACC003: Headset with microphone for voice
recording/playback.
Other Hardware
Calibrators
•
CAL200: Class 1 Sound Level Calibrator,
94/114 dB @ 1 kHz
•
CAL250: Class 1 Sound Level Calibrator,
114 dB @ 250 Hz
Soft Case
•
1-14
Features
CCS032: pouch with belt clip
Model 831 Technical Reference Manual
Software
•
Model 831 Technical Reference Manual
DNA (Data Navigation and Analysis) software
provides setup and remote operation of the Model
831, providing real-time data displays on a PC.
Powerful graphics routines are provided to create
custom data displays ranging from simple time
histories and frequency spectra to spectrograms (level
vs frequency vs time) and annotated data
presentations. A variety of advanced post-processing
tools can be used to extend measured data to
engineering results such as searching time history
data for user-defined events, masking or modifying
portions of measured data and recalculating Leq and
searching spectra for pure tones. DNA will take you
from measured data to a completed project, including
report generation.
Features
1-15
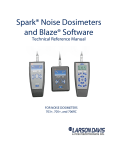
Model 831 Components
Microphone
Preamplifier
LCD Display
Keypad
Connectors
FIGURE 1-1 The Model 831
The Model 831 is a convenient hand-held sound level meter
/ real-time analyzer with a simple user interface.
The standard Model 831 shown in FIGURE 1-1 includes the
following:
1-16
•
1/2 in. diameter condenser microphone
•
PRM831 microphone preamplifier
•
Backlit graphic 160 x 240 pixel LCD display
•
13-key soft rubber backlit keypad
•
AC/DC output, control, USB, and external power
connectors (shown in FIGURE 1-2)
•
True “hand held” instrument with “sure grip” pads
Model 831 Components
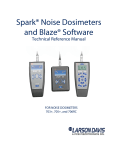
Model 831 Technical Reference Manual
Hardware Power Switch USB Interface
AC/DC Output and Headset
AUX Connector
for USB
I/O Connector for 831-INT, External
Power, Analog and Logic I/O.
FIGURE 1-2 Model 831 Bottom View
Model 831 Technical Reference Manual
Model 831 Components
1-17
1-18
Model 831 Components
Model 831 Technical Reference Manual
CHAPTER
2
First Use
This chapter outlines the steps to unpack the Model 831 and
prepare it for first use. The following topics are covered:
•
Unpacking and Inspection
•
Connecting the microphone and preamplifier
•
Installing 4 AA batteries
•
Using USB power
•
Powering-up the Model 831
You will then be ready to use the Model 831 for actual
measurements.
Unpacking and Inspection
Your Model 831 has been shipped in protective packaging.
Please verify that the package contains the items listed
below. Retain the packaging for safe shipment for
calibration service. Report any damage or shortage
immediately to PCB Piezotronics, Inc. at 888 258-3222 (toll
free) or +1 716- 926-8243.
Included with 831-FF and 831-RI.
Not included when 831 is purchased
without preamplifier and
microphone.
•
Model 831
•
PRM831 Microphone Preamplifier
•
Microphone
•
831-ACC including
•831-CCS Hard Shell Case
•PSA029 Universal AC Power Adaptor
•WS001 3 1/2” Windscreen
•
Lanyard
•
4 - AA NiMH batteries
If you have not already done so, please record the purchase
date, the model and serial numbers for your instrument,
preamplifier and microphone in the spaces provided on the
copyright page "Record of Serial Number and Purchase
Date" on page 1-ii. You will find the instrument’s Model and
Serial numbers printed on the label on the instrument’s back
panel. The microphone model and serial numbers are
Model 831 Technical Reference Manual
First Use
2-1
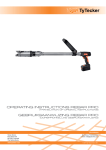
engraved on the outside of the microphone as shown in
FIGURE 2-1 "Microphone" . The preamplifier model and
serial numbers are engraved on the outside surface of the
preamplifier. You may be asked to provide this information
during any future communications with PCB Piezotronics,
Inc.
FIGURE 2-1 Microphone
Connecting the Microphone and Preamplifier
The bottom end of the microphone attaches to the top end of
the preamplifier. The top end of the preamplifier has a single
gold pin and threads on the preamplifier body. The model
and serial number of the microphone are engraved on the
side.
FIGURE 2-2 Microphone-Preamplifier
Carefully place the bottom end of the microphone over the
top end of the preamplifier and gently screw the assembly
together. The microphone body will seat smoothly against
the preamplifier body. DO NOT use excessive force.
When removing the microphone, turn while gripping the
microphone body, not the grid cap, to prevent damage to the
microphone diaphragm.
2-2
Connecting the Microphone and Preamplifier Model 831 Technical Reference Manual
Connecting the Preamplifier
Caution: Do not attempt to unscrew
the collar/ring at the top of the
Model 831 body.
The bottom end of the preamplifier has a 5 pin connector
that fits snugly into the top of the Model 831. Insert the
preamplifier into the mating connector on the Model 831.
The connectors are keyed for correct alignment; there is a
laser engraved line on the preamplifier which should be
aligned with the arrow on the Model 831. Rotate the
preamplifier until the keyways line up. Press the assemblies
together until a small click is heard. The microphone /
preamplifier assembly is now securely attached to the Model
831.
If the Model 831 is ON when the preamplifier is connected
to the Model 831, the Preamp Connected message box will
appear for several seconds.
FIGURE 2-3 Preamplifier Connected
Press the
Model 831 Technical Reference Manual
5 key to clear the message box.
Connecting the Preamplifier
2-3
Disconnecting the Preamplifier
On the front surface of the Model 831, just below the
preamplifier connector, is a small button. Press and hold this
button while pulling the microphone / preamplifier assembly
out of the Model 831.
Preamplifier Release
FIGURE 2-4 Push Button to Release Preamplifier
If the Model 831 is ON when the preamplifier is
disconnected, the Preamp Disconnected message box will
appear for several seconds.
FIGURE 2-5 Disconnect The Preamplifier
Press the
5 key to clear the message box.
Powering the Model 831
Battery Power
For a more detailed description of
powering the Model 831 using
batteries, see the section "Batteries"
on page 24-10.
The Model 831 can be powered using 4 -AA batteries, either
NiMH, Alkaline or 1.5 Volt Lithium cells. Four 2500 mAH
NiMH rechargeable AA cells are delivered with the Model
831.
WARNING:Do not mix Alkaline and NiMH batteries.
2-4
Disconnecting the Preamplifier
Model 831 Technical Reference Manual
WARNING:Do not mix batteries from different
manufacturers
WARNING:Replace all four batteries when installing
fresh cells
WARNING:The correct battery type must be specified,
as described in "Battery Type" on page 17-5, based on
the battery type installed. Otherwise, serious damage,
injury or fire can occur when the battery type is set to
NiMH but Alkaline or Lithium batteries are installed
because the internal charger will be enabled. Alkaline or
Lithium batteries must not be charged.
Inserting Batteries
Note: There are 2 tabs on the bottom
of the battery door that engage the
case of the Model 831
The battery compartment of the Model 831 is located on the
back of the unit. There is a clip on the battery door. To
remove the battery door, place a finger on the clip and push
it downward towards the battery door while pulling away
from the body of the instrument. The battery door will pivot
away from the unit.
FIGURE 2-6 Battery Door
Model 831 Technical Reference Manual
Powering the Model 831
2-5
Insert 4 fresh AA batteries as shown in FIGURE 2-7. Ensure
correct alignment of the batteries + and - terminals as
indicated by diagrams on the bottom of the battery
compartment.
FIGURE 2-7 Insert Batteries
After the batteries are installed, insert the two tabs on the
bottom edge of the battery door into the mating slots in the
case. Close the battery door, allowing the clip to snap in
place on the case.
Selecting Battery Type
The user will set the battery type from the System Properties
page as described in the section "Battery Type" on page 175.
Charging Batteries On-board
When using NiMH batteries and powering the Model 831
from either the computer (via USB port) or from the
PSA029 power supply, or from another external source, the
batteries will be charged inside the instrument. The charge
time to completely recharge the cells is about sixteen hours
when the instrument is powered off. The batteries will be
charged while the instrument is powered on at a reduced rate
as long as the backlight and USB Host features are off.
2-6
Powering the Model 831
Model 831 Technical Reference Manual
Charge Status LED
The charge status is indicated by an LED beneath the power
key as follows:
•
LED continuously lit: Charging
•
LED not lit: Not charging
•
LED flashing at 1/sec: Trickle charging. This is
typically done early in the charging cycle when the
battery is cold, or when the battery has been highly
discharged. The charge rate should increase when these
conditions improve.
External Power Supply
See section "External Power Supply"
on page 24-12 for a detailed
description.
The Model 831 can be powered from a variety of sources
including internal batteries, via the USB port from a
computer, via the USB port from the PSA029 power supply,
from an external +10.8 to +30 Volt battery or from an
external +10.8 to +30 Volt mains power source.
Hardware Power Switch
DO NOT use the hardware power
switch to turn the Model 831 OFF.
This may cause data to be lost and
permanent damage may occur. Press
the 0 key, then the Off soft key to
turn the Model 831 off.
The Hardware Power Switch on the bottom of the Model
831, as shown in FIGURE 1-2 "Model 831 Bottom View”
on page 1-17 and FIGURE 24-5 "Model 831 Bottom Panel”
on page 24-8, disconnects the batteries from the Model 831
hardware. The real-time clock will maintain its value for six
minutes, enough to implement a battery change. This
prevents battery drain when the Model 831 is not in use for
an extended period of time ( weeks) If the Hardware
Power Switch is in the "0" position, the batteries are
disconnected.
After installing batteries be sure to move the switch to the "|"
position. This applies power to all of the Model 831
hardware.
The Hardware Power Switch should not be used to turn the
Model 831 ON and OFF. If the Hardware Power Switch is
used to turn the Model 831 OFF, data may be lost.
See also "ON/OFF Key" on page 3-7
Model 831 Technical Reference Manual
External Power Supply
2-7
Model 831 Power-Up Operation
In order to operate properly the Model 831 needs a sufficient
power source. The power source can be the internal
batteries, USB power or external power (from Mains or
Battery sources).
The instrument will detect, while it is turning on, the
condition of the current power sources and will indicate and
not fully start if a problem is found.
Insufficient Battery Voltage
If the internal battery is powering the instrument, i.e. there is
not USB or external power, and is less than about 4.2 Volts,
the display shown in FIGURE 2-8 will appear with the grey
box inside
FIGURE 2-8 Insufficient Battery Voltage
Insufficient External Voltage
If the external power source is operating the instrument, i.e.
there is no USB or internal battery power available, and is
less than about 10.8 Volts, the display shown in FIGURE 2-9
will appear with the grey box inside the battery symbol
flashing on and off every second.
FIGURE 2-9 Insufficient External Voltage
2-8
Model 831 Power-Up Operation
Model 831 Technical Reference Manual
If the power fault condition is not alleviated within 2
minutes the instrument will power off. If a sufficient power
supply is provided for more than 10 seconds, i.e. USB or
Main power is connected, the instrument will proceed to
turn on.
Model 831 Technical Reference Manual
Model 831 Power-Up Operation
2-9
2-10
Model 831 Power-Up Operation
Model 831 Technical Reference Manual
CHAPTER
3
Overview
Display and Softkeys
When the Model 831 is first switched ON, the Data Display
Screen will appear. When a measurement is in progress, it
will look similar to FIGURE 3-1 "Data Display Screen".
OBA Overload or Input Overload or
Under Range Icon
Under Rang Icon
Run Time
Power Indicator
Measurement
Name
Measurement
Status
Section
Indicator
Tabs
Data Graph
Scroll Bar
Stability
Indicator
Center
Left
Right
Softkeys
FIGURE 3-1 Data Display Screen
Model 831 Technical Reference Manual
Overview
3-1
Display Sections and Icons
Screens
A Screen comprises everything which can be seen on the
display at one time. There are four different screens
available with the Model 831, which are described in more
detail in the section "Screens" on page 3-13.
Tabs
The tabs indicate the active page as well as any other
possible pages available in this view.
Page
This is the main body of the screen. The page contains the
data to be viewed. There may be more than one section for a
page. This is indicated by the position of the scroll bar.
Scroll Bar and Section Indicator
The scroll bar represents the complete page. The section
indicator shows the location on the page you are viewing.
Power Indicator
The presence of one of the following icons indicates the
power source driving the Model 831 and ensures that the
power supplied is sufficient to operate it within
specifications.
Battery Power
The battery icon indicates the state of the battery charge by
the width of the interior shaded portion. The two icons
below indicate a fully charged battery and a nearly
discharged battery.
Full Charge
Low Charge
External Power
The external power connection icon appears when the
Model 831 is powered from an external power supply or via
the USB port.
3-2
Display Sections and Icons
Model 831 Technical Reference
Measurement Name
This is the file name to be used for the data file.
Stability Indicator
Presented in the form of an analog display, this dynamic icon
indicates the trend in the measured overall Leq; is it rising,
decaying or holding stable? .
It appears in the first section of the Live, Overall and
Current displays, and also in a window which appears
during a sound level calibration.
Run Time
This is the amount of time the measurement has been
running.
Input Overload Icon
When a signal from the preamplifier exceeds the calibrated
input range of the Model 831, the Input Overload Icon will
appear. While the overload is present, the icon will flash.
If a measurement is running and an overload occurs, the icon
shown below will flash during the overload.
When the overload has been removed, the icon will still be
present (not flashing) to indicate that an overload has
occurred during the measurement. A reset will clear the icon
from the display.
When using a microphone having a sensitivity of 50 mV/Pa,
the input overload will occur approximately as shown in
Table 3-1.
Input Gain, dB
Overload Level, dB Peak
0
143
20
123
Table 3-1 Input Overload Levels
Model 831 Technical Reference Manual
Display Sections and Icons
3-3
Under Range Icon
When the signal from the preamplifier drops to the point
where the noise level of the instrument and the preamplifier
influence the measurement, an under range condition exists.
When this happens the Under Range Icon will appear.
As long as the under range condition exists, the icon will
flash. When the measured level no longer produces an under
range condition, the icon will be removed from the display.
At any time when a measured parameter is in an under range
condition, it’s numeric display will appear in grey rather
than the usual black, as shown FIGURE 3-2.
Normal Range
Under Range
FIGURE 3-2 Normal vs Under Range
Data Display
OBA Overload Icon
If the input to the Octave Band Analyzer (optional firmware
831-OB3 required) becomes overloaded, the icon shown
will appear to indicate the overload.
This icon operates similar to the Input Overload Icon shown
in the above section "Input Overload Icon".
When the OBA Range property is set to Low, the OBA
Overload Icon will activate at a level 33 dB lower than it
would had the OBA Range been set to Normal.
When using a microphone having a sensitivity of 50 mV/Pa,
the input overload will occur approximately as shown in
Table 3-2.
3-4
Display Sections and Icons
Model 831 Technical Reference
Input Gain, dB
OBA Range
Overload Level, dB
0
Normal
143
20
Normal
123
0
Low
110
20
Low
90
Table 3-2 OBA Overload Levels
OBA Under Range Icon
When the signal from the preamplifier drops to the point
where the noise level of the instrument and the preamplifier
influence the measurement, an under range condition exists.
When all filters of the OBA are "under range" the OBA
Under Range Icon will appear.
As long as this under range condition exists, the icon will
flash. When the measured OBA levels no longer produces
an under range condition, the icon will be removed from the
display.
Like the SLM, when a measured OBA parameter is in an
under range condition, it's numeric display will appear in
grey rather than the usual black, as shown Figure 3-3.
FIGURE 3-3 OBA Under Range Display
Measurement Status
Reset Icon
The Reset Icon indicates that a reset has occurred.
Run Pending Icon
The Run Pending icon appears when the 9 (RUN/
PAUSE) key is pressed and the Model 831 is waiting for
filters and detector initialization to complete. The Model
831 will automatically start the run after the wait or warmup state is completed (less than 10 seconds)
Model 831 Technical Reference Manual
Display Sections and Icons
3-5
Run Icon
The Run Icon moves from left to right to indicate that a
measurement is running.
Pause Icon
The Pause Icon indicates that the present run has been
paused.
Stop Icon
A Stop Icon is displayed when a measurement has been
stopped.
Store Icon
When a data file has been stored, the Store Icon is displayed.
USB Copy Indicator
When a data file is being copied to the USB port, the USB
Copy Indicator Icon is displayed in the upper left corner in
place of the PCB Piezotronics logo.
Power Save Icon
When the Model 831 is in the power save mode, the power
save icon
will be displayed in the location where the measurement
status icons usually appear. For more detail on power save,
see Power-Save Time on page 17-7.
Softkeys
Beneath the display, on the body of the Model 831, there are
three Softkeys as shown at the bottom of FIGURE 3-1
"Data Display Screen". Above each Softkey is a label, which
in this case will look as shown below.
The label indicates the action which will take place when the
key is pressed. Softkeys are so named because the role of
3-6
Display Sections and Icons
Model 831 Technical Reference
each key can change depending upon the screen being
displayed, as indicated by the label.
Changing Views
In the Data Views, the labels of the Left and Right Softkeys
are left and right arrow symbols, respectively. These indicate
that the Left and Right Softkeys are used to scroll the
selection of the tab page being displayed in the
corresponding direction. One press of the Right Softkey will
bring up the Session Log View, and a second press will bring
up the Current Page. Then, sequential presses of the Left
Softkey will bring up the Session Log View, then the Overall
Page.
Keypad
The 9 (RUN/PAUSE) and 7
(STOP/STORE) keys have colored
LEDs behind them, red and green
respectively, which indicate the
measurement status of the Model
831. This functionality is described
in the section "Hardkey LED
Colors" on page 24-6.
The Model 831 has a 13 button keypad. The upper 3 keys
are discussed in the section titled "Softkeys" on page 3-6.
ON/OFF Key
Turning On The Model 831
A check of the internal flash memory
may be performed during boot-up
under certain conditions, as
described in "Disk Check During
Boot-up" on page 7-2.
The 0 (ON/OFF) key is used to turn the Model 831 ON
and OFF. If the instrument is OFF, pressing this key will turn
ON the instrument. There will be a slight delay from
pressing the button until a start up screen is displayed.
Turning Off The Model 831
See Chapter 3 "Power Control View"
on page 3-8.
Model 831 Technical Reference Manual
There are two methods to turn off the Model 831:
•
Method 1: Press the 0 (ON/OFF) key to bring the
Power Control Page into view. Press the Left Softkey,
labeled Off, to turn off the Model 831.
•
Method 2: Press and hold the 0 (ON/OFF) key
Keypad
3-7
Power Control Page
The estimated battery run time is
only shown after running on
batteries for more than one minute,
which permits the battery voltage to
stabilize.
If the Model 831 is ON, pressing the 0 (ON/OFF) key will
bring up the Power Control screen.
FIGURE 3-4 Power Control View
Located on the first section of this screen is the Estimated
Battery Run Time (calculated using the voltage of the
installed batteries), Battery Voltage and the USB Power
voltage.
The Backlight and Display Contrast
can also be adjusted from the Power
Page as described in the section
Power on page 17-5
In the next section of this display, Backlight Mode and
Display Contrast are adjusted using the 4 6 8 and
2 keys. There are 3 choices for Backlight Mode: Off,
Dim and Bright which are adjusted using the 4 and 6 keys.
The Display Contrast has a range of -9 to 9 which is adjusted
using the 8 and 2 keys
The units of the temperature display
are user-selectable, as described in
"Units" on page 17-19.
The last section displays the Model 831 internal temperature
that is used to automatically adjust the contrast of the display
to compensate for temperature changes.
Press the Left Softkey, labeled Off, to turn Off the Model
831.
Pressing the Right Softkey, labeled Setup, takes you to the
System Properties Device Page. See Chapter 17 "System
Properties" on page 17-1
3-8
Keypad
Model 831 Technical Reference Manual
The Center Softkey provides an exit,
escape or cancel function as well as
the function displayed above it on
the display.
Pressing the Center Softkey, labeled Close, will close this
screen and return to the Data View screens.
RESET Key
If desired, the Model 831 can be set
to display a Reset Prompt menu
prior to the completion of a reset
operation, as described in "Reset
Prompting" on page 17-13.
To reset a measurement in progress, press the 1 (RESET)
key. This will erase all data previously measured and reset
the run time clock to zero. A reset will not reset stored data
files.
A reset can be initiated when the Model 831 is running,
paused or stopped. However, it must be stopped for the reset
operation to be performed.
Resetting When Running or Paused
If it is running or paused when the 1 (RESET) key is
pressed, a Stop Required Menu will be displayed as shown
in FIGURE 3-5.
FIGURE 3-5 Stop Required Prompt
The OK response will already be highlighted, so simply
press the 5 (ENTER) key to continue.
Otherwise, press the 6 key to highlight Cancel and then the
5 (ENTER) key to cancel both the Stop and the Reset
operations.
After selecting to Stop the measurement, the Save File
Menu, shown in FIGURE 7-14 "Save File Menu” on page 715, will appear to provide a choice of saving the measured
data prior to the reset or not as described in "Storing the
Measurement" on page 7-15.
Resetting When Stopped
If the Model 831 is stopped when the 1 (RESET) key is
pressed, the Stop Required Menu will not appear, but the
Save File Menu will appear to provide a choice of saving the
measured data prior to the reset or not.
Model 831 Technical Reference Manual
Keypad
3-9
After the reset has been performed, the 7 (STOP/STORE)
key will produce a steady red light to indicate the
measurement state as Stopped, Reset.
Resetting When Reset
If the Model 831 has already been reset when the 1
(RESET) key is pressed, the filters will be reset and a run
can begin after a short delay (less than 10 seconds).
Starting a New Measurement
The 9 key (RUN/PAUSE) key must be pressed to start a
new measurement. 3
TOOLS Key
Note that there are three more icons,
Lock,
System
Utilities
and
Communication, which do not
appear in FIGURE 3-6. It is
necessary to scroll down below the
System Properties and About icons
in order to see them.
Pressing the 3 (TOOLS) key will bring you to the Control
Panel screen.
FIGURE 3-6 Control Panel: View One
3-10
Keypad
Model 831 Technical Reference Manual
Scroll down to see the three icons not visible in FIGURE 3-6
FIGURE 3-7 Control Panel: View Two
Table 3-3 indicates the chapter or section in which each of
these functions is described.
Function
Description
Data Explorer
Chapter 16 on Page 16-1
Calibrate
Chapter 21 on Page 21-1
Setup Manager
Setup Manager on page 4-16
Voice Recorder
Chapter 9 on Page 9-1
System Properties
Chapter 17 on Page 17-1
About
Chapter 22 on Page 22-1
Lock
Chapter 20 on Page 20-1
System Utilities
Chapter 23 on Page 23-1
Communication
Chapter 19 on Page 19-1
Note that the Communication
Icon will be disabled unless the
USB Host Port is On, as
described in "USB Host Port"
on page 17-14.
Table 3-3 Chapters Describing Functions
From the Control Panel
Model 831 Technical Reference Manual
Keypad
3-11
The Left and Right Softkeys and the 8 2 4 and
6 keys allow selection of the desired function. To activate
the desired function, press the
key. Pressing the Center
Softkey labeled Close will return to the Data View.
5
LEFT and RIGHT Keys
The 4 and 6 keys are used for moving horizontally on a
screen. This includes moving the highlight from one
property to the next.
UP and DOWN Keys
The 8 and 2 keys are used for moving vertically on a
screen. This includes moving the highlight from one
property to the next and to move to a previous or next data
page section.
These keys are also used for character entry by scrolling
through a list of characters in a text box.
ENTER Key
5
The
key is typically used for completing an action or
accepting a value.
RUN/PAUSE Key
The 9 (RUN/PAUSE) key will initiate a run. If a
measurement is running, this key will pause the run. It will
not end the run; the 7 (STOP/STORE) key is used for
that. Pressing the 9 (RUN/PAUSE) key, when the unit is
PAUSED, will continue the run. This key is only active on a
Data View screen.
This key has a green LED behind it which can be
illuminated to indicate the measurements status of the Model
831. For more details, see Hardkey LED Colors on page 246.
STOP/STORE Key
Note: Pressing the 9 (RUN/
PAUSE) key when the unit is in
STOP mode, will continue the
previous run.
3-12
The 7 (STOP/STORE) key will end a run. Pressing the
key a second time will store the data in a file. This key is
only active on a Data View screen.
Keypad
Model 831 Technical Reference Manual
When the Spectral Ln mode has been set to On in the OBA
setup, the stop action can take awhile longer due to the large
amount of data which must be saved to memory.
This key has a red LED behind it which can be illuminated
to indicate the measurements status of the Model 831. For
more details, see Hardkey LED Colors on page 24-6
Screens
There are four different screens available on the Model 831:
Model 831 Technical Reference Manual
•
Data Display Screen: used to display measured data.
•
Settings Screen: used to set the parameters for a
measurement.
•
Tools Screen: used to set non-measurement related
parameters and to implement calibration.
•
Power Control Screen: used to check battery power,
control the contrast and backlight of the display and
other features.
Screens
3-13
The diagram shown in FIGURE 3-8 "Main View Block
Diagram" illustrates the manner in which the user can move
between these four screens.
0
Data Display
Screen
Close
Softkey
Menu
Softkey
Menu
(Settings, Mark Sound Type,
Adjust Graph, ANY LEVEL)
Close
Softkey
3
Tools Screen
OFF
Softkey
Power Control
Screen
Close
Softkey
FIGURE 3-8 Main View Block Diagram
Data Display Screen
When the 0 (ON/OFF) key is pressed to switch ON the
Model 831, the Data Display Screen appears.
Menu
From the Data Display Screen, pressing the Center Softkey,
labeled Menu, will bring up the Menu.
When in the Menu, pressing the Center Softkey, now labeled
Close, will bring back the Data Display Screen.
3-14
Screens
Model 831 Technical Reference Manual
Tools Screen
The Tools Screen is accessed by pressing the 3 (TOOLS)
key at the lower right of the Model 831 front panel. To exit
from the Tools Screen and return to the Data Display Screen,
press the 3 (TOOLS) a second time or press the Center
Softkey, now labeled Close.
Power Control Screen
The Power Control Screen is opened by pressing the 0
(ON / OFF) key while in a Data View screen. To exit from
the Power Control screen, press the 0 (ON / OFF) key a
second time or press the Center Softkey, labeled Close.
Data Display Screen
Note: This description of the Data
Display Screen corresponds to the
LD default setup used when the
Model 831 is delivered from the
factory. These display screens can be
modified extensively as described in
"Displays" on page 17-20.
There are seven Data Views in the Data Display Screen,
identified by their titles on the tabs at the top of the screen as
follows:
For a more detailed description of
the Data Display Screen and its
associated Views, see Chapter 5
"Basic Data Display" on page 5-1
•
Live Data View: Data is continuously displayed in this
view whether there is a measurement in progress or not.
Note that pressing the Pause key
does NOT pause the elapsed time
indicator.
•
Overall Data View: The data displayed in this view
represents data measured and averaged beginning from
the time the measurement was started by pressing the
Run key until the elapsed time indicated above the
display. If the Stop key is pressed, the elapsed time will
be stopped. However, pressing the Run key again will
continue this overall measurement as shown by the
elapsed time restarting from the time when it had
previously been paused or stopped. As long as there is no
reset, the same measurement is continued.
•
Session Log: The Session Log is a record of data
accumulation actions. Resetting and storing data will
clear the session record. A time-stamped record is made
for every Run, Pause, Resume, Stop, Voice Message and
Sound Recording action. The source responsible for each
action is also recorded
Model 831 Technical Reference Manual
Screens
3-15
•
Current Data View: Unless Measurement History has
been enabled in the Run Control setup, the Current View
display is similar to the Overall View. The difference is
that while the Overall View displays data measured since
the last pressing the Run key following a reset, the
Current View displays data measured since the last press
of the key sequence Stop/Run. For example, suppose a
measurement was begun at a time T1 and then the key
sequence Stop/Run was pressed at a later time T2. The
data presented in the Overall View would represent the
measurement since T1 while the Current View would
represent the measurement since T2.
With measurement history enabled, a series of separate
measurements are made based on either manual key
presses or time intervals, depending on the setup used.
The current view will display the data corresponding to
the measurement currently in progress. When that
measurement is complete, the data are transferred to the
measurement view. The current measurement is then
reset and the subsequent measurement begun, at which
time the data for this new measurement is displayed.
•
Measurement Data View: With Measurement History
enabled, the measurement view can display all the
separate measurements made from the beginning to the
end of the total measurement period.
Note that the 831-ELA firmware
option must be enabled for this
screen to appear.
•
Events Data View: Basic data associated with
measurements initiated by the trigger criteria are
displayed in the view. When there have been multiple
measurements, these data can be viewed separately.
Note that the 831-LOG firmware
option must be enabled for this
screen to appear
•
Time History View: This view displays data measured
using the time history measurement feature.
3-16
Screens
Model 831 Technical Reference Manual
Softkey Selection of Views
Live
Overall
9 sections
17 sections
Live
Average
Large Digit
Large Digit
1/1 OBA*
Overall SLM
1/3 OBA*
1/1 OBA*
1/1 OBA*
1/1 OBA*
Triggering
1/3 OBA*
1/3 OBA*
1/3 OBA*
Weather
Ln Percentiles
Ln Percentiles
Ln Percentiles
1/3 Oct Leq,
Lmax
Preamp/
Power
Spectral Ln
Spectral Ln
Spectral Ln
Time History*
Events
Events
Events
Overloads
Overloads
Overloads
1/1 Oct
ByTime*
Community
Noise
C-A/Impulsivity
C-A/Impulsivity
Sound
Exposure*
Sound
Exposure*
Dosimeter 1*
Dosimeter 1*
GPS*
Status
Session Log
Current*
15 sections
Average
Window
scrolls to view Enforcement
all records
Overall SLM
C-A/Impulsivity
Measurement
15 sections
Events*
Time History*
7 sections
3 sections
History
Event Status
Average
Sound
Levels*
Overall SLM
BroadBand
History
1/1 or 1/3 Oct
History
1/1 Oct Leq,
Lmax
Sound
Exposure*
Dosimeter 2*
Dosimeter 2*
Dosimeter 1*
SEA*
SEA*
Dosimeter 2*
Weather
Weather
1/1 or 1/3 Oct
Time History
1/3 Oct
ByTime*
Use 2
and 8
Scrolling
Sections
Keys for
Between
SEA*
* Optional Feature
Weather
Status
FIGURE 3-9 Data Display Screens
Changing Data Pages
To switch between tab pages, use the Left and Right
Softkeys.
Scrolling Between Sections
To display different sections Data Views, use the
2 keys.
8 and
Settings Screen
From any data display, press the Menu softkey, highlight
Settings and press the
key to open the settings screen
for the current measurement.
5
Model 831 Technical Reference Manual
Screens
3-17
Note that the screen is not wide
enough to show the tabs for all
fou13rteen setup pages at the same
time. Use the Right and Left Softkeys
to scroll the view to the right or left
respectively.
There are fourteen pages in the Settings Screen, identified
by their titles on the tabs at the top of the page as follows:
•
General: used to create a file name and a measurement
description
For a more detailed description of
the Settings Screen and its
associated pages, see Chapter 4
"Basic Measurement Setup" on
page 4-1.
•
SLM: used to setup the parameters for the measurement
of sound levels
•
OBA (optional): used to setup the real-time octave band
frequency analysis
•
Dosimeter 1 (optional): used to setup the parameters for
the measurement of sound exposure and noise dose
•
Dosimeter 2 (optional): used to setup the parameters for
the measurement of sound exposure and noise dose
•
Ln: used to define the parameters for the measurement
of Ln statistics
•
Control: used to setup the mode of measurement timing
and the storage of measurement history records
•
Time History (optional): used to setup the timing and
select the metrics that are stored in the time history
•
Triggers: used to setup the triggers which define noise
exceedance events
•
Event History (optional): used to setup the timing and
options for event details
•
Markers: used to define the marker names and enable
sound recorder options
•
Day/Night: used to define the time periods and level
penalties for community noise metrics
•
Sound (optional): used to set the quality of sound
recording and enable its usage
•
Weather: used to setup external transducers for the
measurement of wind speed, wind direction, temperature
and humidity
3-18
Screens
Model 831 Technical Reference Manual
Changing Setup Pages
As indicated in the diagram, to switch between setup pages,
use the Left and Right Softkeys. Since each page has only
one section, vertical scrolling is not required.
Tools Screen
For a detailed description of the
Tools Screen, see "Control Panel System Properties" on page 17-1.
The Tools Screen uses icons to represent the different
functions available, as shown in FIGURE 3-10 "Tools
Screen".
FIGURE 3-10 Tools Screen
Selection of an item is done by highlighting the icon
representing the desired function, and pressing the
key.
5
Model 831 Technical Reference Manual
Tools Screen
3-19
To highlight a particular icon, the Left and Right Softkeys
and the 4 6 8 and 2 keys are used as indicated
by the arrows in FIGURE 3-11 "Highlighting a Tools Icon".
8 and 2 Keys or
Left and Right Softkeys
4 and 6 Keys
FIGURE 3-11 Highlighting a Tools Icon
Data Explorer
For a detailed description of the
Data Explorer, see Chapter 16 "Data
Explorer" on page 16-1.
The Data Explorer is used to examine stored data. It is also
used to manage stored measurements such as rename or
delete files.
Setup Manager
For a detailed description of the
Setup
Manager,
see
"Setup
Manager" on page 4-16.
3-20
The Setup Manager permits the user to create and store a
number of user-defined measurement setups for easy recall,
editing and use.
Tools Screen
Model 831 Technical Reference Manual
System Properties
System Property Pages are used for general instrument
bookkeeping. Functions such as setting the instrument date
and time, display contrast adjustment, date format, etc. are
located here. These are single section pages.
For a detailed description of the
System Properties Pages, see
Chapter 17 "System Properties" on
page 17-1.
There are seven System Property Pages:
•
Device: instrument identification is entered here
•
Time: the date and time are set on this page
•
Power: controls that affect power consumption are
located here
•
Preferences: Many items related to the functioning of
the Model 831 are set here, including Autostore and USB
Storage.
•
Localization: Language, Decimal Symbol, Date Format
and Units are selected here
•
Displays: Customization of Displays is done here
•
Logic I/O:
Softkey Selection of Systems Property Pages
Device
Time
Power
Preferences
Localization
Displays Logic I/O
FIGURE 3-12 System Property Pages
The Right and Left Softkeys are used to scroll between
System Property Pages.
Lock
For a detailed description of the
Lock feature, see Chapter 20 "Lock/
Unlock the Model 831" on page 201.
Model 831 Technical Reference Manual
Lock permits the Model 831 to be configured such that
certain keys are locked so their functionality cannot be
utilized.
Tools Screen
3-21
Communication
For a detailed description of the
Communication Pages, see Chapter
19 "Communication" on page 19-1.
The Communication Pages are used to setup and monitor
communications between the Model 831 and a PC using a
dial-up modem, wireless EDGE modem or RS-232
interface.
There are four Communication Pages:
•
Modem: Setup a dial-up modem
•
Wireless: Setup a wireless modem
•
RS-232: Setup an RS-232 interface
•
Status: Display status of Analog and Wireless modems,
RS-232 and USB channels.
Calibrate
For a detailed description of the
calibration procedure, see Chapter
21 "Calibration" on page 21-1.
Calibrate is used to verify and adjust the calibration of the
Model 831 prior to a measurement.
Voice Recorder
For a detailed description of the
voice recording feature, see Chapter
9 "Voice Recording" on page 9-1.
A method to allow voice annotation of the data is described
in Chapter 9 "Voice Recording" on page 9-1.
About
For a detailed description of the
About Pages, see Chapter 22
"About" on page 22-1.
The About Pages provide the user with information specific
to this instrument such as serial number, options, etc. These
are single section pages.
There are four About Pages:
3-22
•
About: shows information such as serial number and
firmware revision
•
Standards: lists the standards that the Model 831 meets
•
Options: shows the options that are available in this
instrument
Tools Screen
Model 831 Technical Reference Manual
•
User: user entered instrument identification
Softkey Selection of About Pages
About
Standards
Options
User
FIGURE 3-13 Softkey Selection of About Pages
The Right and Left Softkeys are used to scroll between the
About Pages.
System Utilities
For a detailed description of the
System Utilities, see Chapter 23
"System Utilities" on page 23-1.
Model 831 Technical Reference Manual
The System Utilities provides routines to work with the
internal files systems and the USB. Routines are provided to
implement the following activities:
•
Check File System
•
Format
•
Format/Restore Defaults
•
Check/Repair USB
•
Format USB
Tools Screen
3-23
Parameter Selection
When operating the Model 831, you will frequently be
required to define a parameter by selecting from a list which
may appear on the display either as a row of parameters with
a radio button to the left of each, or as a vertical list in a drop
down menu.
Parameters in a Row
These may appear as a single row or, when there are
numerous parameters to define, as multiple rows as shown
in FIGURE 3-14
FIGURE 3-14 Parameters with Radio Buttons
Use the 2 and 8 keys to highlight the parameter
(Frequency Weighting, Detector, etc.), then the 6 and 4
keys to highlight the desired selection for that parameter.
Press the 5 key to make the selection and fill in the radio
button associated with that parameter.
3-24
Parameter Selection Model 831 Technical Reference Manual
Drop Down List
Parameters of this type are associated with a parameter name
followed by a data field indicating the present selection for
that parameter. There may be a single parameter to be
defined, or multiple parameters as shown in FIGURE 3-15.
FIGURE 3-15 Parameter Data Field
Use the 2 and 8 keys to highlight data field of the
parameter to be defined (Battery Type highlighted above)
and press the 5 key to open the drop down menu listing the
permitted choices as shown in FIGURE 3-16
FIGURE 3-16 Drop Down Menu
Use the 2 and 8 keys to highlight the desired item in
the list and press the 5 key to make the selection and close
the menu.
Model 831 Technical Reference Manual
Parameter Selection
3-25
Entering Alphanumeric Strings
In some instances you will be called upon to enter
alphanumeric strings, such as creating a name or entering
text information. Parameters of this type are associated with
a parameter name and a data field as shown in FIGURE 317.
FIGURE 3-17 Alphanumeric Data Field
The data field may be blank, as in the Measurement
Description above, or it may contain a default name, as in
the Default Data File field. Use the 2 and 8 keys to
highlight the desired data field and press the 5 key to bring
up a cursor in the data field as shown in
FIGURE 3-18 Cursor in Data Field
The 6 and 4 keys are used to move the cursor right or left,
respectively. At any cursor position, the 8 and 2 keys
are used to scroll the alphanumeric character appearing in
that position through a defined sequence.
Repeated presses of the 8 key will produce the following
sequence of characters:
•
3-26
Capital letters A through Z
Parameter Selection Model 831 Technical Reference Manual
•
Lower case letters a through z
•
Characters ! @ # $ * ( ) - + = [ ] < > .
•
Numbers 0 through 9
•
Space
Repeated presses of the 2 key will produce the same
sequence in reverse order.
When the desired alphanumeric field has been entered, press
the 5 key to accept it and remove the cursor.
Entering Numeric Data
FIGURE 3-19 Entering Numeric Data
When a purely numeric parameter is being entered, the same
procedure is followed as for alphanumeric parameters. In
this case, repeated presses of the 8 and 2 keys will
scroll upward or downward, respectively, through the
numeric sequence 0 through 9 only.
Model 831 Technical Reference Manual
Parameter Selection
3-27
3-28
Parameter Selection Model 831 Technical Reference Manual
CHAPTER
4
Basic Measurement Setup
This chapter describes the setup of the Model 831 to
perform basic sound level measurements. These
measurements may include the following:
•
Leq, Lmax, Lmin corresponding to user-selected
values of frequency weighting and detector
•
Lpeak and Lpeak(max) corresponding to a userselected value of frequency weighting
•
1/1 and/or 1/3 Octave real-time spectra
(831-OB3 required)
•
Six values of Ln based on six user-selected values of
the percentage parameter n
•
Count of the number of times the levels (SPL and
Peak) exceeded user-selected threshold values
•
Sound exposure and sound exposure level data
Settings Screen
Accessing the Settings Screen
For a more detailed description of
the Settings Screen, see "Settings
Screen” on page 3-17.
The parameters defining a measurement are set from the
Settings Screen.
This screen can be accessed from any of the Data Views.
Press the Center Softkey labeled Menu, highlight Settings,
and press the
key. The Settings Screen will now be
displayed with the page selected that is most appropriate for
the data display from which it was activated.
5
The settings can also be edited using the Setup Manager,
described in "Setup Manager” on page 4-16.
Model 831 Technical Reference Manual
Basic Measurement Setup
4-1
Settings In Use Message
If the Model 831 is not connected to
a computer running SLM Utility-G3
software, ignore this section.
If the SLM Utility-G3 software is connected to the Model
831 when attempting to access the Settings Screen, the
display shown in FIGURE 4-1 will appear.
FIGURE 4-1 Settings In Use By 831
Utility Message
This message warns the user that accessing the Settings
Screen will cause setup changes which had been made using
the 831 Utility during this session to be lost. It also indicates
that changes made in the instrument may be lost when the
settings in use by the PC are uploaded.
To continue and access the Settings Screen, highlight Yes
and press the
key.
5
Setup Pages
Only a few of these horizontally
arranged tab pages (three in Figure
4-2) can be seen at one time. To see
those off-screen to the right use the
Right Softkey beneath the display. To
scroll back to the left, use the Left
Softkey beneath the display.
Depending on the firmware options loaded in the Model
831, there may be as many as fourteen different setup pages
in the Settings Screen, each identified by a title on a tab at
the top as shown in Figure 4-2.
FIGURE 4-2 Tabbed Setup Pages
For basic measurements, we will only be concerned with the
following pages:
4-2
•
General
•
SLM
•
OBA
Setup Pages
Model 831 Technical Reference Manual
•
Ln
•
Control
•
Triggers
•
Day/Night
The Right and Left Softkeys are used to scroll through the
available pages, to the right and left, respectively, in the
order they are listed above.
Each of these is described in detail in the sections which
follow.
General Page
FIGURE 4-3 General Page
Note: The 831 Utility Software can
be used to easily enter both the file
name
and
the
measurement
description.
The General Page is used to enter a file name and a
measurement description for the measurement being
defined. Upon opening, the Default File Name “831_Data”
may appear in the file name field.
To enter a new file name, highlight the Default File Name
text box and press the
key. Enter a new name and press
the
key.
5
Model 831 Technical Reference Manual
Setup Pages
5
4-3
SLM Page
Note that the default values for these
parameters are as shown in
FIGURE 4-4.
FIGURE 4-4 SLM Page
Selections of Frequency Weighting, Detector, Peak
Weighting and Integration Method are made one-at-a-time.
Click to highlight the desired section prior to making the
selection.
Use the arrow keys to highlight the appropriate item for the
selected parameter and press the
key to make the
selection.
5
Frequency Weighting
A, C and Z frequency weightings are provided for the SPL
and peak detectors. These are selected separately.
Time Weighting
Available time weightings for the SPL detector are: Slow,
Fast and Impulse.
4-4
Setup Pages
Model 831 Technical Reference Manual
Integration Method
Note that the Model 831 can be set to
run for a preset integration time as
described in "Manual Stop, Timed
Stop or Stop When Stable" on page
6-4
Two Integration methods are available: Linear and
Exponential.
Exponential Integration
Exponential integration is provided mainly to provide
compatibility with older instruments. Exponential detectors
have a tendency to hide small events in the long decay of a
loud impulsive event.
Note that when performing time history measurements using
time increments 10 ms or less, the integration method must
be linear. If exponential integration has been selected at the
time of setup, this will be changed as described in "Linear
Integration Only” on page 10-6.
Linear Integration
Linear integration integrates only energy that occurs during
a given time period and therefore does not exhibit the decay
slope of a Fast, Slow or Impulse exponential detector.
The value of the integrated level is displayed immediately
following the end of the integration time.
For long duration measurements both integration methods
report the same value in that they both have equivalent
“energy under the curve”, although short term metrics may
vary.
20 dB Gain
See FIGURE 24-3 "Block Diagram
of Model 831” on page 24-3 for
further information.
When measuring low level sounds, when the sound level is
approaching the background noise level of the instrument, it
is recommended to increase the gain by 20 dB. This is done
by using the 2 key to highlight this section and pressing
the
key to insert a check. Press the
key again to
remove the check and set the gain back to 0 dB
5
5
The effect of the gain on the noise level is shown in
FIGURE A-28 "Noise of Model 831 with 377B02: 0 dB
Gain, Low Range” on page A-48, FIGURE A-29 "Noise of
Model 831 with 377B02: 0 dB Gain, Normal Range” on
page A-49, FIGURE A-30 "Noise of Model 831 with
377B02: 20 dB Gain, Low Range” on page A-50 and
Model 831 Technical Reference Manual
Setup Pages
4-5
FIGURE A-31 "Noise of Model 831 with 377B02: 20 dB
Gain, Normal Range” on page A-51.
The effect on the A-Weighted linearity range is shown in the
section "e) Linear Operating Range” on page B-10.
Octave Band Analyzer Page (Optional)
The default values
parameters are as
FIGURE 4-5.
for these
shown in
This page will only appear when the Model 831 has the
optional 831-OB3 firmware enabled.
FIGURE 4-5 OBA Page
OBA Parameter Selection
The OBA parameters are selected as shown in FIGURE 4-6.
4-6
Setup Pages
Model 831 Technical Reference Manual
Highlight and Press
Key to Select
5
FIGURE 4-6 OBA Parameter Selection
OBA Range Setting
In the Low range, the full scale level is reduced by 33 dB on
the display. The default display ranges will be as follows:
•
Normal Range: 20 to 140 dB
•
Low Range: -10 to 110 dB
However, the graph scaling range can be modified by the
user as described in "Adjust Graph Scale” on page 5-27.
OBA Bandwidth Setting
The user can select to utilize a single 1/1 Octave analysis
module, a single 1/3 Octave analysis module or both
simultaneously.
Select Off to have no real-time analysis module active.
OBA Frequency Weighting
The user can select that the 1/1 and/or 1/3 Octave frequency
analysis modules process data from the A, C or Z weighting
filters.
See "Spectral Statistics” on page 255 for a more detailed description of
spectral Ln measurements.
Spectral Ln Mode
Spectral Ln values can be measured using either 1/1 or 1/3
octave bandwidths, depending on the OBA bandwidth
selected, as shown below.
•
Model 831 Technical Reference Manual
OBA = 1/1 Octave: Spectral Ln Mode is 1/1 Octave
Setup Pages
4-7
•
OBA = 1/3 Octave or 1/1, 1/3 Octave: Spectral Ln
Mode is 1/3 Octave
Setting the spectral mode Off will reduce the memory used
for data storage.
Ln Page
The Ln value is the measured sound level which was
exceeded n% of the measurement time. For example, a value
of L90 = 35 dB means that the measured sound level was
above 35 dB for 90% of the measurement period. These
statistical values are commonly used to describe the
characteristics of non-steady sound such as environmental
noise.
In order to be able to calculate Ln values, the Model 831
creates an amplitude distribution table over the range 0 to
200 dB, in amplitude increments of 0.1 dB. These data
permit the calculation of Ln values for any value of n in the
range 00.01 to 99.99%.
Selection of Ln Values
The default values
parameters are as
FIGURE 4-7.
for these
shown in
The Model 831 displays six Ln values at a time, using userselected values of n. These are set from the Ln Page, shown
in FIGURE 4-7.
FIGURE 4-7 Ln Page
4-8
Setup Pages
Model 831 Technical Reference Manual
Modifying Ln Values During a Measurement
While a measurement is running, it is possible to return to
the Ln display of the Settings Screen, shown in FIGURE 4-7
and change any or all of the six Ln values. This will change
the display of Ln values, shown in FIGURE 5-18 "Ln
Percentiles: Overall Page Section 6” on page 5-18.
Control Page
FIGURE 4-8 Control Page
A detailed description of the Run
Mode is presented in Chapter 6 "Run
Control” on page 6-1.
Model 831 Technical Reference Manual
The Control Page is used to set the Run Mode for the
measurement to be performed. There are six modes of
measurement duration available. In this chapter we will
address only the first three.
•
Manual Stop: The measurement is initiated manually by
pressing the 9 (Run/Pause) key and it stopped upon
pressing the 7 (Stop/Store) key.
•
Timed Stop: The measurement is initiated manually by
pressing the 9 (Run/Pause) key and will be stopped
automatically after a user-defined time period.
•
Run Until Level Stable: The measurement is initiated
manually by pressing the 9 (Run/Pause) key. The
measurement will stop when the measured level has
remained within a user-defined range and the
measurement has run for a user-defined time period.
Setup Pages
4-9
The selection of the Run Mode and the associated
parameters is shown in FIGURE 4-9. The Measurement
History feature is not discussed in this chapter. For further
information on that, see Chapter 11 "Measurement History”
on page 11-1
FIGURE 4-9 Run Mode Parameter Selections
Measurement History
For a detailed description of
Measurement History, see Chapter
11 "Measurement History” on
page 11-1.
In FIGURE 4-9, an item entitled Enable Measurement
History appears for each Run Mode. Measurement History is
a measurement option provided when the optional firmware
831-ELA is enabled. Since this chapter is concerned only
with basic measurements, we do not address Measurement
History here. Thus, in the following sections when we refer
to parameters, this does not include Measurement History.
Manual Stop Mode
The Manual Stop Mode has no parameters.
Timed Stop Mode
Timed Stop has two parameters, Time and Enable
Measurement History. It also adds Measurement Counter if
4-10
Setup Pages
Model 831 Technical Reference Manual
one minute or more.The range of time values which can be
entered is 00:00:01 to 99:59:59 in the format hh:mm:ss.
Stop When Stable Mode
The Stop When Stable Run Mode has two parameters: Delta
and Time.
Delta
The Delta level is the maximum allowed change in Current
average level (i.e. LAeq) permitted during the time interval
defined below. The minimum level that can be set is 0 and
the maximum is 5.0 dB. The default is 0.2 dB.
Time
The Time is the minimum interval that the measurement
must run. The measurement will run for the interval
specified and then continue until the stability condition is
met. The smallest value that can be entered is 20 seconds
and the largest is 99:59:59 (h:m:s), The default is 20
seconds.
Triggers Page
Note that the default values for these
parameters are as shown in
FIGURE 4-10.
FIGURE 4-10 Triggers Page
The Triggers Page is used to define trigger levels associated
with exceedance events; instances where the measured
Model 831 Technical Reference Manual
Setup Pages
4-11
sound level (SPL or Peak) exceeds one of the user-defined
trigger levels. The variation of sound level during a typical
event might look as shown in FIGURE 4-11 "Exceedance
Event Example" .
dB
Event Begins
Event Ends
2 dB
Time
FIGURE 4-11 Exceedance Event Example
For exceedance counters a noise event is initiated when the
sound level rises above the event trigger level. A noise event
ends when the sound level drops 2 dB below the trigger
level. This hysteresis is introduced to avoid the creation of
multiple events when the sound level is fluctuating about the
threshold level.
SPL Trigger Levels
There are two threshold levels, SPL Trigger Levels 1 and 2,
which can be set to initiate an exceedance event when the
measured SPL (Slow, Fast or Impulse) exceeds either of
these thresholds.
Peak Trigger Level
Three different Peak Trigger Levels can be set
independently from the SPL trigger levels. Since the peak
detector has a very fast response time compared to the SPL
detectors, exceedance events based on the peak trigger level
can identify impulsive noises produced by blasts and gun
fire which would not ordinarily produce an exceedance of
the SPL trigger levels.
4-12
Setup Pages
Model 831 Technical Reference Manual
Basic Exceedance Event Data
Note that hysteresis is only utilized
to define the conclusion of a noise
event for basic event counting as
described in this section. It is not
used in conjunction with the
acquisition of noise event history
data.
The following exceedance event data are provided for each
of the five threshold levels:
•
The number of exceedances of each threshold level.
•
The sum total of the time the measured level was
exceeded the threshold level.
Noise Event History Data
When the Model 831 has the optional 831-ELA firmware
loaded, detailed sound level data associated with exceedance
events are measured and stored. For details, see Chapter 12
"Event History” on page 12-1
Sound Recording of Exceedances
If the optional 831-SR firmware has been enabled, automatic
sound recordings of each exceedance can be made. See
"Event Sound Recording” on page 15-15.
Day/Night
Note that the default values for these
parameters are as shown in
FIGURE 4-12.
Among the parameters measured and displayed as part of a
basic sound level measurement are the community noise
descriptors LDN and LDEN. The Day/Night page is used to
define the times and penalties to be used.
FIGURE 4-12 Day/Evening/Night Definition
Model 831 Technical Reference Manual
Setup Pages
4-13
LDN
The default day-night level LDN is defined by the following formula:
1
L
= 10Log ----dn
10
24
0700
0000
2200
10
L + 10 10
i
+
2400
10
0700
L 10
i
+
10
L + 10 10
i
2200
LDEN
The default day-evening-night level LDEN is defined by the
following formula:
Lday
Levening 5
Lnight 10
1
8 * 10 10
L DEN = 10 lg 12 *10 10 4 *10 10
24
In the default form, the day has twelve hours, the evening
has four hours and the night has eight hours, as can be seen
in the equation. The default times for these periods are as
follows
•
Day: 07.00 to 19.00
•
Evening: 19.00 to 23.00
•
Night: 23.00 to 07.00
Lday, Levening and Lnight are A-weighted long-term
average sound levels measured during the day, evening and
night, respectively.
To account for the increased impact of environmental noise
during the evening and night, penalties are added to the
measured level; 5 dB for evening and 10 dB for night, as can
be seen in the equation.
The Directive 2002/49/EC of the European Parliament and
of the Council of 25 June 2002, relating to the assessment of
environmental noise permits member states to shorten the
evening period by one or two hours and lengthen the day
4-14
Setup Pages
Model 831 Technical Reference Manual
and/or the night accordingly and also to choose the time for
the start of the day.
To accommodate these and other possible modifications, the
Day/Night page permits the user to modify the times for the
beginning of the Day, Evening and Night periods and the
penalties to be utilized when calculating 24-hour integrated
values.
CNEL
In the state of California, a commonly used community
noise descriptor is Community Noise Equivalent Level
(CNEL), defined by the following formula:
1
CNEL = 10log10 ----- 24
0700
1900
10
0000
L + 10 10
i
+
0700
2200
10
L 10
i
+
2400
10
L + 5 10
i
1900
+
10
L + 10 10
i
2200
This is essentially the same as the LDEN using default
values, with the exception that the evening period begins at
22.00 instead of 23.00. Thus, by making this change in the
LDEN settings, the measured value will represent CNEL.
Exiting Settings Screen
To exit the Settings Screen, press the Center Softkey labeled
Close.
If any setup parameters have been changed, the “Apply
Changes” message box will be displayed as shown in
FIGURE 4-13.
FIGURE 4-13 Apply Changes
Model 831 Technical Reference Manual
Exiting Settings Screen
4-15
At this point the parameter changes made from the Settings
Screen have not yet been implemented in the instrument.
Select either Yes or No, and press the
key to
implement the changes or cancel the changes, respectively.
This will return the Data Display Screen to the display.
5
Setup Manager
Due to the need to assign names to
user-defined setups, it is much easier
to create and save these using the
SLM Utility-G3 program.
The Setup Manager permits the user to create and store a
number of user-defined measurement setups for easy recall
and use.
To activate the Setup Managers, press the 3 (TOOLS) key.
to open the Control Panel. Highlight the Setup Manager
icon, as shown in FIGURE 4-14
FIGURE 4-14 Control Panel
4-16
Setup Manager
Model 831 Technical Reference Manual
5
Press the
key to open the Setup Manager, shown in
FIGURE 4-15.
FIGURE 4-15 Setup Manager
If no user-defined setups have been created and saved, the
display will list two setups:
•
LD Active: the setup presently active in the Model
831
•
LD default: the factory default setup as originally
shipped from Larson Davis
If we have created a setup using the Setup Screen, as
described earlier in this chapter, the LD Active setup is listed
as just “LD Active”. If we then highlight it and press the 5
key, it will be listed as LD Active-default”, indicating that it
is still using the default name for it.
Model 831 Technical Reference Manual
Setup Manager
4-17
Note: Setup names are limited to
twelve characters.
When user-defined setups have been added, the Setup
Manager might look like FIGURE 4-16.
FIGURE 4-16 Setup Manager:
User-defined Setups Added
Change to LD Default Setup
If you wish to return all settings in the Model 831 to the
default settings which were active when the instrument was
delivered from the factory, highlight LD default and press
the 5 key. If there is an unsaved measurement in the
instrument, the message shown in FIGURE 4-17 will appear.
FIGURE 4-17 Reset Prompt
4-18
Setup Manager
Model 831 Technical Reference Manual
If you do not wish to save this measurement, highlight Yes
and press the 5 key, which will bring to the display the
message shown in FIGURE 4-18.
FIGURE 4-18 Apply Changes Prompt
Highlight Yes and press the 5 key to return settings in the
Model 831 to the factory defaults. Otherwise, highlight No
and press the 5 key to cancel the settings change.
If you wish to save the measurement prior to returning the
settings to the defaults, highlight No in the Reset Prompt
shown in FIGURE 4-17 and press the 5 key to cancel the
reset operation. Save the measurement in the usual manner,
by pressing the 7 (Stop/Store key) once (if already
stopped) or twice (if not already stopped) before again
initiating the return
Model 831 Technical Reference Manual
Setup Manager
4-19
Utilizing a User-Defined Setup
To utilize a user-defined setup, from the display shown in
FIGURE 4-16 highlight the desired user-defined setup and
press the 5 key. The display will then indicate that the LD
Active setup utilizes the parameters of the selected userdefined setup, in this case EnvMeas, as shown in FIGURE
4-19.
FIGURE 4-19 User-Defined Setup Made Active
4-20
Setup Manager
Model 831 Technical Reference Manual
Modifying the Active Setup
When working with the Setup Manager, to modify the active
setup, highlight the setup LD Active and press the right
software button labeled Menu to bring up the display shown
in FIGURE 4-20.
FIGURE 4-20 Modify Active Setup Menu
Highlight Edit and press the 5 key to bring up the Setup
Screen, as shown in FIGURE 4-21
FIGURE 4-21 Setup Screen
Use this setup screen to make all desired modifications to
the Active setup. When done, press the softkey labeled
Close, which will open the menu shown in FIGURE 4-22
FIGURE 4-22 Apply Changes to Active Setup
Model 831 Technical Reference Manual
Setup Manager
4-21
Note: If the present Active setup has
been derived from a user-defined
setup, as described in “Utilizing a
User-Defined Setup” on page -20,
applying changes will implement the
same changes in the original userdefined setup file.
Select Yes to accept the changes, or No to cancel the
operation.
Save Modified Setup
To save the modified setup, press the right softkey labeled
Menu to obtain the display shown above in FIGURE 4-20.
Define Name
Note that the name must contain no
more than eight characters and that
a space cannot be used as a
delimiter.
Highlight Save As and press the
display shown in FIGURE 4-23.
5 key to obtain the
FIGURE 4-23 Save File Menu
Note that it is much easier to input
names when saving setups by using
the SLM Utility-G3 software.
Highlight the name field, presently showing “Active” and
press the 5 key to modify it. This will produce a cursor as
shown in FIGURE 4-24
FIGURE 4-24 Save File Menu: Cursor
Active
Enter the name and press the 5 key to accept the name.
Highlight the Yes box and press the 5 key to save the setup
under that name. To cancel the save operation, highlight No
and press the 5 key.
4-22
Setup Manager
Model 831 Technical Reference Manual
Overwrite an Existing Setup File
If, rather than use a new name you wish to use the modified
Active setup file to replace an existing setup file, instead of
pressing the Yes box shown in FIGURE 4-24, highlight the
box labeled Browes and press the 5 key. This will open a
display listing all the user-defined files as shown in FIGURE
4-25.
FIGURE 4-25 User-Defined Setup Files
Highlight the name of the setup file to overwrite and press
the 5 key. The Save File menu will now appear with the
name of that file in the name field, as shown in FIGURE 426
FIGURE 4-26 Overwrite File Menu
To complete the overwrite operation, highlight Yes and press
the 5 key. To cancel the overwrite operation, highlight No
and press the 5 key. To select a different file name,
highlight the box labeled ... and press the 5 key to repeat
the file selection process.
Model 831 Technical Reference Manual
Setup Manager
4-23
User-Defined Setup File Operations
A number of operations can be performed using the userdefined setup files by highlighting any one and pressing the
5 key to obtain the display shown in
FIGURE 4-27 User-Defined File Operations
Highlight the desired operation and press the
implement it.
5 key to
Load Settings
Load Settings loads the settings from the selected file into
the Model 831.
Edit
Edit permits the user to modify the settings in the selected
file, in the same manner as used for modifying the Active
setup, described in "Modifying the Active Setup” on page 421.
Rename
The name must contain no more than
twelve characters and that a space
cannot be used as a delimiter.
Rename permits the user to define a new name for the
selected file. The menu shown in FIGURE 4-28 will appear
to implement the renaming process.
FIGURE 4-28 Rename Setup File
Work with this menu as you would for the Save File menu,
described in "Save Modified Setup” on page 4-22.
4-24
Setup Manager
Model 831 Technical Reference Manual
Delete
Delete permits the deletion of the selected file. A
confirmation display will appear as shown in FIGURE 4-29.
Save As
Note that the name must contain no
more than twelve characters and
that a space cannot be used as a
delimiter.
FIGURE 4-29 Delete Setup File
Save As permits the selected to be saved under a different
name, or to overwrite an existing user-defined file. Follow
the procedure described in "Save Modified Setup” on
page 4-22.
Refresh List
Refresh List updates the setup list in the Setup Manager
display.
Close Setup Manager
Press the center softkey labeled Close to close the Setup
Manager.
Model 831 Technical Reference Manual
Setup Manager
4-25
4-26
Setup Manager
Model 831 Technical Reference Manual
CHAPTER
5
Basic Data Display
In the previous chapter, the setup procedure for a basic
sound level measurement was described. This chapter
describes how this data would be displayed during or
following a measurement sequence.
The Model 831 can measure many additional sound
parameters simultaneously with these basic sound
measurements as described in other sections of this
manual. It can also measure a variety of non-acoustical
parameters, as described in Chapter 18 "Non-Acoustical
Inputs” on page 18-1 and the section "Non-Acoustical
Metrics" on page 10-3.
Data Labels
The labels for sound metrics in the Model 831 are
designated by international standards. For many displayed
values, the frequency and time weighting are indicated in the
name of the metric. Example: LAS is the A-weighted sound
pressure level measured using the Slow detector. Sound
pressure level is often referred to as SPL.
Tabbed Page Structure
Only a few of these horizontally
arranged tab pages (three in Figure
5-1) can be seen at one time. To see
those off-screen to the right use the
Right Softkey beneath the display. To
scroll back to the left, use the Left
Softkey beneath the display.
Measured data are displayed using a number of tabbed pages
arranged horizontally across the screen, as shown in Figure
5-1. Depending on the firmware options loaded in the Model
831, there may be as many as seven different data display
pages in the Data Display Screen, each identified by a title
on a tab at the top.
FIGURE 5-1 Tabbed Page Structure
Model 831 Technical Reference Manual
Basic Data Display
5-1
Live Page
The Live Page may not appear as
described here if the displays have
been customized. For a detailed
description of display customization,
see the section "Displays" on
page 17-20
When the Model 831 is turned ON, the user is generally
presented with the Live Page. The measurements displayed
on the Live Page are always active, real-time measurements.
The displayed values are not controlled by the 9 (RUN/
PAUSE) key. This allows you to view the current SPL
without disrupting any overall data. For example, suppose
you are making a measurement and an unwanted event takes
place, causing you to stop the measurement. With the
measurement stopped, you can monitor the actual level on
the Live Page to be certain that the residue effects of the
unwanted event have died down before beginning a new
measurement.
Note that from any of the displays
described in this section, the user
can also access the Any Level
Display, described in "Any Level
Display" on page 5-40.
Considering only displays related to basic sound
measurements, there are seven sections to the Live Page. To
scroll between sections use the 8 or 2 keys. The
Right and Left Softkeys beneath the display scroll between
pages.
SLM Display
Leq, 1 second averaging, using
frequency
weighting
and
detector selected in setup
User-selected SLM parameter
Lpeak using frequency
weighting selected in setup
FIGURE 5-2 Sound Level Profile: Live Page, Section 1
Section one presents a recent history of Leq calculated for
each second. The graph presents the last 120 seconds of the
measurement.
5-2
Live Page
Model 831 Technical Reference Manual
The 1st numerical level displayed, LAeq(1s) in this example,
is the most recently graphed 1 second value. The frequency
weighting, and possibly the detector, will correspond to
those selected in setup for the RMS value.
The 2nd numerical level display, LAS in this example,
corresponds to a user-selected parameter. The default value
is LAS. The selection of this value is described in "UserSelected SLM Parameter" on page 5-3.
The 3rd numerical level displayed, LZpeak in this example, is
the current measurement from the 1 s. peak detector. The
frequency weighting will correspond to that selected in setup
for the peak value.
The time at the bottom of the page is the date and time the
measurement was started.
User-Selected SLM Parameter
To select which sound level parameter is to be utilized for
the 2nd numerical value displayed, press the 5 key to open
the menu shown in FIGURE 5-3
FIGURE 5-3 Menu for User-Selected
SLM Parameter
Highlight the desired parameter and press the
make the selection.
Model 831 Technical Reference Manual
Live Page
5 key to
5-3
Large Digit Sound Level
The second section display is provided to make it easier for
the user to observe both the instantaneous sound level and
along with the value of the user-selected SPL1 Trigger
Level.
Current Value of Leq using Frequency
Weighting and Detector from Setup, Updated
Once per Second
SPL1 Trigger Level
Indication of Current Exceedance of SPL1
Trigger Level. When instantaneous level is
under range, the digital display appears
greyed out
Run Time and Pause Time
FIGURE 5-4 Large Digit: Live Page, Section 2
In addition to displaying the current value of Leq, this
display uses a check mark to indicate a current exceedance
of the SPL1 trigger level, which is user-defined as described
in section "Triggers Page" on page 4-17.
5-4
Live Page
Model 831 Technical Reference Manual
1/1 Octave Band Analyzer (Optional)
The 1/1 Octave Band Analyzer
display appears only when the
instrument is loaded with the
optional 831-OB3 firmware.
Frequency Spectrum Bandwidth
Frequency
weighting
Detector for Sound
Measurement
and
Level
Frequency Band Level at Cursor Position
Sound Pressure Level, Frequency Weighting
and Averaging as Indicted by Subscripts
FIGURE 5-5 1/1 Octave Spectrum: Live Page, Section 3
Section three shows a bar graph of sound level in 1/1 octave
frequency bands. The right most bar on the graph is the LAS.
Note that the spectrum frequency
weighting is selected independently
from that of the sound level
measurement, as described in "OBA
Frequency Weighting" on page 4-7.
The detector is the same as that of
the sound level measurement.
It is indicated beneath the graph that it is in 1/1 octave
bands. On the graph, the vertical bar for the selected octave
band is highlighted. The frequency of the octave band for
which data is being displayed, the sound pressure level
frequency weighting (A weight) and the detector response
(Slow) are also shown.
Note that the graph scaling can be
modified as described in section
"Adjust Graph Scale" on page 5-27
and the display normalized to
another spectrum, as described in
section "View Spectrum Normalized"
on page 5-28.
L(1.00kHz)S indicates the sound level in the 1 kHz band with a
Slow detector setting.
LAS is the A weighted, Slow detector response sound level.
Cursor
Use the 4 and 6 keys to move the cursor left and right,
respectively.
Model 831 Technical Reference Manual
Live Page
5-5
1/3 Octave Band Analyzer (Optional)
The 1/3 Octave Band Analyzer
display appears only when the
instrument is loaded with the
optional 831-OB3 firmware.
FIGURE 5-6 1/3 Octave Spectrum: Live Page,
Section 4
Note that the graph scaling can be
modified as described in section
"Adjust Graph Scale" on page 5-27
and the display normalized to
another spectrum, as described in
section "View Spectrum Normalized"
on page 5-28.
5-6
Section four is similar to FIGURE 5-5. The graph and data
are presented for 1/3 octave bands.
Live Page
Model 831 Technical Reference Manual
Triggering
For a detailed description of
triggering, see "Triggers Page" on
page 4-11.
FIGURE 5-7 Triggering: Live Page, Section 5
Section five displays the instantaneous sound level and
instantaneous peak level with their associated trigger points.
Exceedances of these trigger points will be indicated by a
check mark appearing to the right of each. The check mark
will appear only as long as the measured level remains
above the trigger point.
Model 831 Technical Reference Manual
Live Page
5-7
Preamp Display
The purpose of the Preamp Display is to validate proper
operation of the system. It shows information regarding the
preamplifier currently connected; specifically the
preamplifier type, the SPL and DC voltage at the input to the
Model 831 (for diagnostic purposes).
FIGURE 5-8 Preamp: Live Page, Section 6
Using 426A12
The information provided by the Preamp Display is
particularly important when used with the 831-INT System
Interface Unit and the 426A12 Outdoor Preamplifier and
Power Supply. It shows information regarding the control
signals of the control port that connects the 831-INT;
specifically the Overload logic input (indicates a hardware
detected overload condition in the 426A12), the logic input
state, the logic output state, the settings regarding the logic
in and out line, and the status of the Mains Power logic input
(indicates the status of mains power to the 831-INT).
5-8
Live Page
Model 831 Technical Reference Manual
FIGURE 5-9 426A12 Preamp, E.A. On
In FIGURE 5-9 we see the display includes the serial
number and the current internal temperature, humidity and
dew point. The temperature, humidity and dew point metrics
permit desiccant maintenance information to be gathered
regularly and stored with the data. This can also be done
remotely without having to perform an in-field service call.
The electrostatic actuator can be activated when stopped by
pressing the
key to toggle the E.A. calibrator On and
Off. The SPL displays the measured E.A. level.
5
Model 831 Technical Reference Manual
Live Page
5-9
Using ICP Preamplifier
When using an ICP power preamplifier, additional
information can be displayed as shown in FIGURE 5-10
FIGURE 5-10 ICP Preamp Displays
Here we can see how the DC voltage measured at the input
of the Model 831 is useful in diagnosing problems with the
input signal. The Fault:Open indicator is shown if the
voltage is too high (34.3 Vdc) and the Fault:Shorted
indicator is shown if the voltage is too low (0.0 Vdc). The
nominal voltage (10.9 Vdc) when there is no fault is also
helpful in verifying that the unit is biased properly and that
the maximum signal excursion is possible.
5-10
Live Page
Model 831 Technical Reference Manual
Time, Battery Voltage and Memory
FIGURE 5-11 Time, Battery, Memory: Live Page
Section 7
In section seven, the status view indicates the current date
and time, the run time for the measurement, battery voltage,
calculated run time and memory usage.
Battery
Note that it takes approximately one
minute to obtain an accurate
measure of battery parameters.
During this time, the display will
indicate - -.
When running on battery power, this will indicate the battery
voltage and remaining time instrument will operate.
Memory
The Memory section indicates the amount of memory
available as a percentage and in number of kBytes. The
number of stored data files is also indicated.
Model 831 Technical Reference Manual
Live Page
5-11
Overall Page
Considering only displays related to basic sound
measurements, the Overall Page may have as many as
thirteen sections. To scroll between sections use the 8 or
2 keys. Use the Right and Left Softkeys to scroll
between pages.
Note that from any of the displays
described in this section, the user
can also access the Any Level
Display, described in "Any Level
Display" on page 5-40.
In this section we only address those sections of the Overall
Page associated with basic sound level measurements. Other
pages associated with data provided by optional firmware
may also appear. Although the 1/1 and 1/3 octave spectra
require optional firmware (831-OB3), we do include the
display of this data in this chapter.
Leq
Leq value using frequency
weighting and detector from
setup
User-selected SLM parameter
FIGURE 5-12 Sound Level Profile: Overall Page, Section 1
From this display the user can also
access the Any Level Display,
described in "Any Level Display" on
page 5-40.
The graph in section one depicts the profile of sound levels
measured throughout the overall measurement. The left side
of the graph is the very beginning and the right side is the
very end of the overall measurement. The run time for the
average calculation is shown at the top of the screen. The
graph display is updated approximately four times per
second.
The 1st numerical value displayed, LAeq in this example, is
the equivalent sound level based on the run time of the
5-12
Overall Page
Model 831 Technical Reference Manual
measurement. The frequency weighting and detector
correspond to those used in the setup.
The 2nd numerical value displayed is LApeak in this
example, is a user-selected value. The selection of this value
is described in “User-Selected SLM Parameter” below.
The time at the bottom of the page is the date and time the
measurement was started.
User-Selected SLM Parameter
To select which sound level parameter is to be utilized for
the 2nd numerical value displayed, press the 5 key to open
the menu shown in FIGURE 5-13
FIGURE 5-13 Menu for User-Selected
SLM Parameter
There are twenty-four possible
selections; scroll down to see more
than shown in FIGURE 5-13.
Model 831 Technical Reference Manual
Highlight the desired parameter and press the
make the selection.
Overall Page
5 key to
5-13
Overall Large Digit Sound Level
Leq
using
Frequency
Weighting and Detector
from Setup
Percent Of Measurement
Time Above SPL1 Trigger
Level
SPL1 Trigger Level
Maximum
Level
using
Frequency Weighting and
Detector from Setup
Peak Level using Frequency
Weighting from Setup
Run Time
Pause Time
FIGURE 5-14 Large Digit Display: Overall Page, Section 2
Note that the graph scaling can be
modified as described in section
"Adjust Graph Scale" on page 5-27.
5-14
The graph in section two presents a data compressed profile
of the sound level for the run time of the measurement. The
large digit display is updated along with the calculation of
the average sound level approximately four times per
second. The process is continuous throughout the run time.
The Pause Time indicator shows the amount of time the
current measurement was paused.
Overall Page
Model 831 Technical Reference Manual
Overall SLM
FIGURE 5-15 Overall SLM: Overall Page,
Section 3
LAS represents the live sound
pressure level for the active
frequency and time weightings and
the LZpeak represents the live
instantaneousness peak level. They
are displayed here to allow the user
to see these live metrics and their
effect on the overall maximum,
minimum and equivalent levels.
See Chapter 3 "RESET Key” on
page 3-9.
LASeq and the LAS are also shown in section three of the
Overall Page.
The LZpeak (Z frequency weighting) is the live reading of the
peak detector.
The LZpeak(max) is the highest level the peak detector has
measured during the run time of the measurement. A date
and time of occurrence is recorded with this event.
The LZpeak(max) is also considered the peak hold. Whenever
data is reset, this parameter is cleared. To reset data, press
the 1 (RESET) key.
The LASmax is the highest level the SPL detector has
measured during the run time of the measurement. A date
and time of occurrence is recorded with this event.
The LASmax is also considered the max hold. Whenever data
is reset, this parameter is cleared. To reset data, press the 1
(RESET) key.
Model 831 Technical Reference Manual
Overall Page
5-15
The LASmin is the lowest level the SPL detector has
measured during the run time of the measurement. A date
and time of occurrence is recorded with this event.
1/1 Octave Band Analyzer (Optional)
The 1/1 Octave Band Analyzer
display appears only when the
optional firmware 831-OB3 has been
enabled and this measurement mode
has been selected in the setup.
Lmax Values
Leq Values
Lmin Values
Frequency Spectrum Bandwidth
Spectral Measurements: Leq, Lmax and Lmin,
with frequency weighting and averaging
indicated
FIGURE 5-16 1/1 Octave Spectrum: Overall Page, Section 4
Note that the graph scaling can be
modified as described in section
"Adjust Graph Scale" on page 5-27
and the display normalized to
another spectrum, as described in
section "View Spectrum Normalized"
on page 5-28.
The data displayed in section four shows Leq, Lmax and
Lmin sound levels in 1/1 octave frequency bands calculated
for the duration of the measurement. The right most bar on
the graph is the sum of the Leq values for the total spectrum.
The bar for the displayed frequency band is highlighted. The
highlight can be moved using the 4 and 6 keys.
Leq
Leq is the energy average sound level of the highlighted
frequency band for the duration of the measurement.
Lmin
Lmin is the minimum sound level of the highlighted
frequency band for the duration of the measurement. Since
individual frequency bands may reach their minimum levels
at different times, this spectrum might be one which never
occurred at any instant during the measurement period.
5-16
Overall Page
Model 831 Technical Reference Manual
Lmax
Lmax is the maximum sound level of the highlighted
frequency band. The maximum spectrum is determined by
the Max Spec setting.
Bin Max
When set to Bin Max, it is the maximum value which
occurred during the entire measurement for that frequency
band. Since individual frequency bands may reach their
maximum levels at different times, this spectrum might be
one which never occurred at any instant during the
measurement period.
At Max
When set to At Lmax, it is the instantaneous spectrum at the
moment when the broadband maximum occurred (such as
LASmax).
1/3 Octave Band Analyzer (Optional)
The 1/3 Octave Band Analyzer
display appears only when the
instrument is loaded with the
optional 831-OB3 firmware and this
measurement mode has been
selected in the setup.
FIGURE 5-17 1/3 Octave Spectrum: Overall Page
Section 5
Model 831 Technical Reference Manual
Overall Page
5-17
Note that the graph scaling can be
modified as described in section
"Adjust Graph Scale" on page 5-27
and the display normalized to
another spectrum, as described in
section "View Spectrum Normalized"
on page 5-28.
The data displayed in section five is similar to that displayed
for a 1/1 octave spectrum measurement, described in "1/1
Octave Band Analyzer (Optional)" on page 5-16, except that
it represents 1/3 octave data.
Ln Percentiles
FIGURE 5-18 Ln Percentiles: Overall Page
Section 6
Section six displays the Ln statistics for the measurement
based on the run time. Also shown are the maximum and
minimum sound levels measured. An Ln is the level that was
exceeded “n” percent of the time.
The values of Ln are calculated from an amplitude
distribution table, ranging from 0 to 200 dB, in 0.1 dB steps.
As a result, it is possible to calculate Ln values from values
of n ranging from 00.01% to 99.99%. The values shown in
FIGURE 5-18 represent the six values which were selected
for display during setup. At any time during a measurement,
any or all of these Ln values can be changed, as described in
"Modifying Ln Values During a Measurement” on page 4-9,
so that Ln values corresponding to different values of n may
be displayed.
5-18
Overall Page
Model 831 Technical Reference Manual
Spectral Ln (Optional)
The Spectral Ln display appears
only when the optional 831-OB3
firmware has been enabled and the
Spectral Ln Mode set for 1/1 or 1/3
octave measurements, as described
in "Spectral Ln Mode" on page 4-7.
Ln as a function of frequency for
six user-selected values of n
Frequency at cursor position
Ln values at cursor position
FIGURE 5-19 Spectral Ln: Overall Page, Section 7
The graph shown in FIGURE 5-19 overlays curves of Ln as
a function of frequency for the six values of n defined in the
setup, as described in "Ln Page" on page 4-8. These are the
same n values used in the display of overall Ln in "Ln
Percentiles: Overall Page Section 6" on page 5-18.
Note that the graph scaling can be
modified as described in section
"Adjust Graph Scale" on page 5-27.
Numerical values of Ln for the six user-selected values of n
at the frequency corresponding to the cursor position are
displayed as indicated in FIGURE 5-19. Use the 4 and 6
keys to move the cursor left and right, respectively, along the
frequency axis.
See "Spectral Statistics" on page 25-5 for a more detailed
description of spectral Ln measurements.
Model 831 Technical Reference Manual
Overall Page
5-19
Exceedances
For a detailed description of noise
events
based
on
threshold
exceedances, see "Triggers Page" on
page 4-11.
FIGURE 5-20 Exceedances: Overall Page
Section 8
Section eight shows the number of exceedances that have
occurred during the measurement and the total duration of
exceedances. Exceedances are shown for two threshold
levels of the SPL detector and three for the peak detector.
5-20
Overall Page
Model 831 Technical Reference Manual
Overloads
OBA Overload
SLM Overload
FIGURE 5-21 Overloads: Overall Page, Section 9
Section nine shows the number of times, the percent of time
and the amount of time that the Sound Level Meter and the
OBA have been overloaded. Community Noise
FIGURE 5-22 Community Noise: Overall Page
Section 10
Model 831 Technical Reference Manual
Overall Page
5-21
Since community noise metrics are
based upon full day measurements,
they do not present valid data for
measurements less than 24 hours
duration.
Section ten displays the parameters LDN, LDEN, LCeq and
LAeq, commonly used to evaluate community noise, and
LCeq-LAeq, used to describe the low frequency content of a
sound and also as a parameter in the selection of hearing
protection devices. The parameter LAFTM5 will appear when
“Takt Maximal Data“has been selected on the Preferences
Page as shown in "Takt Maximal Data" on page 17-14. The
definition is shown in "Taktmaximal-5" on page D-21.
LDEN
Although the standard ISO 1996-2:2007 specifies default
values for the parameters used in the calculation of LDEN, in
practice the time values defining the day, evening and night
periods may be changed, as permitted by Directive 2002/49/
EC of the European Parliament and of the Council of 25
June 2002 relating to the assessment and management of
environmental noise. It is important to verify prior to
measurement that the parameters have been properly defined
for your purposes. See Chapter 4 "Day/Night” on page 4-13
for a detailed description of the setup procedure.
C-A and Impulsivity
FIGURE 5-23 C-A Level and Impulsivity: Overall
Page, Section 11
5-22
C-A and Impulsivity Model 831 Technical Reference Manual
The “C minus A” metric provides an indication of the low
frequency content of noise measured by subtracting the Aweighted equivalent level from the C-weighted equivalent
level.
The integrated levels for LAeq are always calculated using
the linear detector, regardless of the value selected in the
SLM Setup. The LAIeq value is from the impulse detector.
Industrial Hygiene
If the optional Industrial Hygiene firmware is enabled, a
display for sound exposure, two displays for noise dose and
a display for SEA will appear between the Community
Noise and the Number of Measurement screens. These are
discussed in Chapter 8 "Industrial Hygiene” on page 8-1.
Status Page
FIGURE 5-24 Number of Measurements:
Overall Page, Section 12
Section twelve displays the number of session log entries,
the quantity of each type of measurement which has been
made, the number of sound recording made and also the
memory status for the current measurement session.
The number of sound recordings includes the following:
•
Model 831 Technical Reference Manual
Manually Initiated Recordings
C-A and Impulsivity
5-23
•
Marker Initiated Recordings
•
Event Recordings
•
Measurement Recordings
Session Log Page
Calibrate Icon
Run Icon
Voice Message/Sound Recording Icon
Pause Icon
Resume
Stop Icon
FIGURE 5-25 Session Log Page
The Session Log is a record of data accumulation actions.
Resetting and storing data will clear the session record.
A time-stamped record is made for every Calibrate, Run,
Pause, Resume, Stop, Voice Message and Sound Recording
etc. action. The source responsible for each action is also
recorded which may be any of the following:
5-24
•
Key press
•
Measurement (Sound Recording)
•
Event (Sound Recording)
•
Marker (Sound Recording)
•
USB command
•
Run timer complete
•
GPS Time Sync
•
Low battery
•
Out of memory
•
Preamplifier disconnect
Session Log Page
Model 831 Technical Reference Manual
GPS
Marker
Stable Level
Measurement
Event
Out-of-Memory
Power
Run
Stop
Pause
Resume from Pause
Voice Message
Sound Recording
Calibration Check
Time Synchronized
Marker (1 to 10)
Timer
Action:
I/O Command
Key Press
Cause:
Preamp Disconnected
FIGURE 5-26 presents a list of all actions and the valid
causes for each of them.
FIGURE 5-26 Session Log Actions and Causes
The Measurement Status Icons are
described in "Measurement Status"
on page 3-5.
The icons in the left column of the display indicate the
action: Run, Pause, Voice Recording, etc. The date and time
of the action is displayed next to the icon.
Each measurement segment (from Run to Stop) is
numbered, as is each voice message and sound recording.
The user may scroll the list and expand each item. In the
upper right corner of the expanded item the number
indicates which item is being viewed out of how many total
items are in the list.
GPS Time Sync
The GPS Time Sync icon and the time sync data are shown
in FIGURE 5-27.
Time of day after
correction
GPS Time Sync Correction
FIGURE 5-27 GPS Time Sync
Model 831 Technical Reference Manual
Session Log Page
5-25
The correction is the number of seconds that the internal
clock was adjusted. A negative number represents the clock
being set backwards in time. For further detail on the setup
of a GPS device, see "Location Measurement Using 831INT" on page 18-10.
Voice Message/Sound Recording Playback
Note that voice messages, which are
recorded using the Voice Recorder
Page of the Control Panel, can also
be played back from there. For more
detail, see Chapter 9 "Voice
Recording” on page 9-1. There are a
number of alternative ways to
playback sound recordings. See
"Sound Recording Playback" on
page 15-21 for more detail.
Voice messages and sound recordings can be played back
from the Session Log tab page. Highlight the desired voice
message or sound recording, indicated by the Voice
Message/Sound Recording Icon shown in FIGURE 525 "Session Log Page” on page 5-24. A highlighted voice
message or sound recording will appear as shown in
FIGURE 5-28.
FIGURE 5-28 Highlighted Voice Message,
Session Log
To play back the highlighted voice message, press the 5
key or select the Play menu item, shown in FIGURE 5-29.
FIGURE 5-29 Voice Recording Play Menu
5-26
Session Log Page
Model 831 Technical Reference Manual
Adjust Graph Scale
The default amplitude (dB) settings for the graphic display
of sound pressure level versus time and frequency spectra
(1/1 and 1/3 octave) are as indicated below:
•
Level vs Time Graph: 20 dB to 140 dB
•
Frequency Spectra, Normal Range: 20 dB to 140 dB
•
Frequency Spectra, Low Range: -10 dB to 110 dB
To change the scaling of any one of these graphs, press the
Menu softkey to obtain the display shown in FIGURE 5-30.
FIGURE 5-30 Menu
Use the 2 key to highlight Adjust Graph and press the
5 key to obtain the Adjust Graph menu shown in FIGURE
5-31
FIGURE 5-31 Adjust Graph Menu
Note that when the OBA Range for
frequency spectra has been set to
Low, the value actually used for the
baseline of the display will be 30 dB
less than the number indicated for
Bottom in the Adjust Graph menu.
Model 831 Technical Reference Manual
Use the 4 and 6 keys to change the baseline level and the
8 and 2 keys to adjust the height (range between the
baseline and the top of the display). Press the 5 key to
implement the change.
Once one or more graphic displays have had their scaling
changed, they will remain that way until changed again or
until the defaults settings are restored, as described in
"Format & Restore Defaults" on page 23-3.
Adjust Graph Scale
5-27
View Spectrum Normalized
Note that the Live Spectrum will
continue to change in time following
the normalization, whereas the
Reference spectrum will remain the
same.
The default 1/1 and 1/3 octave spectrum displays present the
amplitude versus frequency of the measured spectrum as
shown in FIGURE 5-5 and FIGURE 5-6.
The View Normalized function permits the display of the
difference between two spectra by subtracting a userselected reference spectrum from the measured spectrum.
This function can be used with both 1/1 and 1/3 octave
spectra, although the measured spectrum and the reference
spectrum must have the same bandwidth; 1/1 or 1/3 octave.
A and C frequency weighting curves can also be used for the
reference, as described in "Normalizing using Frequency
Weighting" on page 5-32.
Live Display
A standard spectrum displayed on the Live Page will appear
as shown in FIGURE 5-32.
FIGURE 5-32 Standard Live Spectrum Display
To access the View Normalized display, press the center
software Menu to display the menu shown in FIGURE 5-32.
FIGURE 5-33 Menu
5-28
View Spectrum Normalized
Model 831 Technical Reference
Highlight View Normalized and press the 5 key to make
the selection. This will display the spectrum in the
normalized view, as shown in FIGURE 5-34.
Selected Spectrum Type (only SPL
for Live Spectrum)
Selected Reference
FIGURE 5-34 Normalized Live Spectrum Display: No Reference Selected
Since a reference spectrum has not yet been defined, the
spectrum shown will be the same as the Live Spectrum. If it
does not, there has probably been a reference spectrum
defined previously.
Selecting the Spectrum Type
Since only the SPL spectrum is displayed in the Live
Spectrum view, it is not necessary to select a spectrum type
since only SPL will appear if that menu is opened.
Selecting the Reference Spectrum
Highlight the Ref: data field and press the 5 key to open
the Reference Menu, shown in FIGURE 5-35.
FIGURE 5-35 View Normalized Reference Menu
Model 831 Technical Reference Manual
View Spectrum Normalized
5-29
The items listed in this menu are as follows:
•
1
•
2
•
3
•
4
•
A
•
C
•
-A
•
-C
The first four items permit the user to define four reference
spectra based on the spectrum being displayed. Since the
Live spectrum only displays SPL, there is little need for
multiple reference spectra.
The last four items permit the user to use positive or
negative A or C frequency weightings as reference spectra.
See "Normalizing using Frequency Weighting" on page 532.
Highlight the desired reference spectrum and press the
key to make a selection.
5
Once the reference spectrum has been selected, press the left
softkey SET to display the Live Spectrum in the normalized
view.
5-30
View Spectrum Normalized
Model 831 Technical Reference
Normalized Using The Measured Spectrum
When the displayed spectrum has been normalized using the
measured spectrum, and the sound being measured is not
much different than it was previously, the display will
resemble FIGURE 5-36.
Frequency and Level
at Cursor Position
FIGURE 5-36 Normalized Spectrum Display:
Similar Sound Field
The display scaling can be adjusted
to show lower level and negative
values as described in "Adjusting
Graph Display" on page 5-32.
We can see that at 1 kHz, the cursor position, the measured
level is 1.3 dB above that of the reference spectrum, but this
is not visible on this graph because the bottom of the scale is
~ 20 dB.
If the display were more like that shown in FIGURE 5-37,
this would indicate that the levels in the 1kHz and 2 kHz
bands were approximately 42 dB higher than for the
reference spectrum.
FIGURE 5-37 Normalized Spectrum Display:
Higher Levels at 1 kHz and 2 kHz
Model 831 Technical Reference Manual
View Spectrum Normalized
5-31
Adjusting Graph Display
Because some of the frequency components in the
normalized view may be small or negative, the Adjust Graph
function described in "Adjust Graph Scale" on page 5-27
can be used to obtain a graph having both positive and
negative amplitude values. The Adjust Graph function can
only be implemented from the source graph, so in this case
return to the Live spectrum display, adjust the graph as
desired, then return to the normalized view for which the
same adjustment will be in effect.
Normalizing using Frequency Weighting
When normalizing using positively signed A and C, this
normalization subtracts a spectrum which is the inverse of
the spectrum representing the corrections. Thus, by selecting
A (or C), this will negate the frequency weighting effect on
spectra which had originally been measured using A (or C)
frequency weighting. To obtain an A (or C) weighted
spectrum when the measurement had been made without
frequency weighting, select -A (or -C) for the reference. For
example, when the measured spectrum is similar to FIGURE
5-32, by selecting -A the normalized view displays an Aweighted version of this spectrum, as shown in FIGURE 538.
FIGURE 5-38 Spectrum From
5-32
View Spectrum Normalized
Model 831 Technical Reference
Note that the scale in FIGURE 5-38 was adjusted as
described in "Adjusting Graph Display" on page 5-32 in
order to display the low level and negative amplitudes.
Normalizing using User-Defined Spectrum
The user can also define their own reference spectrum by
pressing the Edit softkey as shown in FIGURE 5-39.
Edit
User-Defined
Reference Spectrum
FIGURE 5-39 Edit Softkey for User-Defined
Reference Spectrum
This will produce the display shown in FIGURE 5-40.
Input Amplitude
Name Reference
Spectrum
FIGURE 5-40 Creating User-Defined
Reference Spectrum
Creating a User-Defined Reference Spectrum
The user-defined spectrum is created one band at a time. Use
the 4 and 6 keys to move the cursor to the frequency band
whose amplitude is to be changed, highlight the input
amplitude field shown FIGURE 5-40. Press the 5 key, use
Model 831 Technical Reference Manual
View Spectrum Normalized
5-33
the 4 6 8 and 2 keys to input a numerical value and
press the 5 key to complete the process. In this example
the cursor is on the 1 kHz frequency band, so if the
amplitude were entered to be 50 dB, the result would be as
shown in FIGURE 5-41
Name Reference
Spectrum
Reference Spectrum
Levels to the 1kHz
level
FIGURE 5-41 Example User-Defined Reference
Spectrum; 50 dB @ 1 kHz
Continue this procedure band-by-band until the desired
reference spectrum has been defined.
Saving a User-Defined Reference Spectrum
When the desired spectrum has been defined, highlight the
Name Reference Spectrum field as shown in FIGURE 541, press the 5 key, use the 4 6 8 and 2 keys to
input a name and press the 5 key again to save this as a
user-defined spectrum under this name.
Offset Reference Spectrum to 1kHz band level
Pressing the Re.1kHz softkey, as shown in FIGURE 5-41,
will change all of the band levels to be offset relative to the
level at 1 kHz (the level at 1 kHz will be subtracted from all
band level values in the reference spectrum and the level in
the 1 kHz band will be 0.0 dB).
5-34
View Spectrum Normalized
Model 831 Technical Reference
Overall Display
In general, obtaining a normalized display of 1/1 and 1/3
octave spectra appearing on the Overall Page is the same as
for Live Displays, described in "Live Display" on page 5-28.
The major difference is that spectra appearing on the Overall
Page display Leq, Lmax and Lmin data simultaneously, as
shown in FIGURE 5-42.
Lmax Spectrum
Leq Spectrum
Lmin Spectrum
FIGURE 5-42 Overall Spectrum
As a result, when setting up for View Normalized, if no
normalization spectrum has been selected, the display will
look as shown in FIGURE 5-43.
Leq Spectrum Displayed
FIGURE 5-43 Normalized Overall Spectrum:
No Reference Selected
The Leq in the data field shown highlighted above indicates
that the spectrum being displayed is Leq. With this data field
highlighted, press the 5 key to open the menu shown in
FIGURE 5-44.
Model 831 Technical Reference Manual
View Spectrum Normalized
5-35
FIGURE 5-44 Spectrum Type Menu
Using this menu, the user can select from the three spectrum
types; Leq, Lmax and Lmin. Highlight the desired parameter
and press the 5 key to make a selection.
If no reference spectrum has yet been defined, the displayed
spectrum will correspond to the selected parameter.
Normalized using a Previously Measured Spectrum
Provided with a choice of spectrum types, the user can
create a spectrum display where one type of spectrum is
normalized by another. For example, let us use the spectrum
type data field to select Lmin, then as a reference select 1.
Press the left softkey SET to make the Lmin spectrum the
reference spectrum for reference 1. The resulting spectrum
will look likeFIGURE 5-44.
Selected Spectrum Type
FIGURE 5-45 Lmin Spectrum Normalized to Lmin Spectrum
This display now shows the Lmin spectrum presently being
measured, normalized by the Lmin spectrum which which
existed at the time the normalization was performed.
If the Model 831 has not been not running since the
normalization was performed, and we then change the
selected spectrum type to Lmax, the display will show a
spectrum whose amplitudes represent (Lmax - Lmin) of
original spectrum, as shown in FIGURE 5-46.
5-36
View Spectrum Normalized
Model 831 Technical Reference
FIGURE 5-46 Lmax - Lmin Spectrum
If the Model 831 were still running, the Lmax would
continue changing but the reference spectrum, based on the
Lmin spectrum measured previously, would remain the
same.
Model 831 Technical Reference Manual
View Spectrum Normalized
5-37
Normalizing using Frequency Weighting
When using frequency weighting for normalization, the
display will be similar to that for Live Spectra, described in
"Normalizing using Frequency Weighting" on page 5-32,
except that the use will have the option of displaying any of
the three spectra types, Leq, Lmax and Lmin, normalized by
the frequency weighting used for the normalization, as
shown in FIGURE 5-47.
FIGURE 5-47 Leq Spectrum Normalized by - A
5-38
View Spectrum Normalized
Model 831 Technical Reference
Normalizing using User-Defined Spectrum
The creation and use of user-defined reference spectra for
the Overall Display are the same as for the Live Display,
described in the section "Normalizing using User-Defined
Spectrum" on page 5-33.
Graph Relative
When the Graph Relative has been enabled by placing a
check in the Graph Relative check box, the graph is
presented using a plus and minus about a vertically centered
zero Y axis, as shown in FIGURE 5-48.
FIGURE 5-48 Normalized Spectrum:
Graphed Relative
Model 831 Technical Reference Manual
View Spectrum Normalized
5-39
Any Level Display
In the displays shown in the above sections, the sound level
values which appear are for the user-selected values of
frequency weighting, detector and peak weighting.
However, the Model 831 is simultaneously calculating
sound level values for all possible selections of frequency
weighting (A, C and Z), detector (Slow, Fast and Impulse)
and peak weighting (A, C and Z).
The Any Level Display can also be
accessed from the Current and
Measurement Display tab pages,
which are used to display
Measurement History data; see
Chapter 11 "Measurement History”
on page 11-1.
To obtain the Any Level Display from either the Live or
Overall screen, press Menu to open the menu shown in
FIGURE 5-49.
FIGURE 5-49 Menu
Highlight ANY LEVEL and press the 5 key to obtain the
Any Level Display. The data displayed will depend upon
whether the Any Level Display was initiated from the Live
or the Overall screen, as described in the following sections.
5-40
Any Level Display
Model 831 Technical Reference Manual
Live Screen
When initiated from the Live Screen, the Any Level Display
will appear as shown in FIGURE 5-50
Leq is based on one second
integration time
FIGURE 5-50 Any Level Display, Live Screen
These show the instantaneous sound levels using Slow, Fast
and Impulse detectors and the Peak sound level, all using A,
C and Z weighting. The displayed value of Leq is based on a
one second integration time. Because they are instantaneous
values, their numerical values will change rapidly in
response to a change in sound level at the microphone.
Close Display
Note that the instrument keypad is
not operational when the Any Level
Display is being displayed. As a
result, the run state cannot be
changed until that display has been
closed.
Model 831 Technical Reference Manual
To close the Any Level Display, press the Close softkey.
Any Level Display
5-41
Overall Screen
When initiated from the Overall Screen, the Any Level
Display will appear as shown in FIGURE 5-51
Leq is based on the run time
FIGURE 5-51 Any Level Display, Overall Screen
These data present an overview of the measurement
performed over the run time, giving Leq, Maximum and
Minimum levels corresponding to Fast, Slow, Impulse and
Peak detection using A, C and Z weighting. .
Close Display
To close the Any Level Display, press the Close softkey.
5-42
Any Level Display
Model 831 Technical Reference Manual
CHAPTER
6
Run Control
The Model 831 provides a number of run modes to
control the time duration of a measurement. The most
simple are Manual Stop, Timed Stop and Stop when
Stable. More advanced are the Continuous, Single Block
Time and Daily Timer modes. When combined with the
Measurement History feature, these modes produce a
sequence of measurements made and stored at regular
time intervals. In this chapter the setup of run modes
without the Measurement History are discussed in detail.
The description of the setup and use of run modes with
Measurement History enabled is continued in Chapter
11 "Measurement History" on page 11-1.
Run Control Setup
The Run Control is setup from the Control Page of the
Measurement Setting Screen, as shown in Figure 6-1.
FIGURE 6-1 Control Page
The Control Page is used to set the Run Mode for the
measurement to be performed.
Model 831 Technical Reference Manual
Run Control
6-1
There are six modes of measurement duration available.
•
Manual Stop
•
Timed Stop
•
Stop When Stable
•
Continuous
•
Single Block Time
•
Daily Time
A brief description of each is presented in the following
sections.
Manual Stop
The Stop key will stop a
measurement while in any of the run
modes
When using Manual Stop, the measurement is initiated
manually by pressing the 9 (Run/Pause) key and is
manually stopped by pressing the 7 (Stop) key. The setup
procedure is described in ‘Manual Stop, Timed Stop or Stop
When Stable” on page 6-4.
Timed Stop
The Stop key will stop a
measurement while in any of the run
modes
When using Time Stop, the measurement is initiated
manually by pressing the 9 (Run/Pause) key and is
stopped automatically after a user-defined time period. The
setup procedure is described in ‘Manual Stop, Timed Stop or
Stop When Stable” on page 6-4.
Stop When Stable
The Stop key will stop a
measurement while in any of the run
modes
When using Stop When Stable, the measurement is initiated
manually by pressing the 9 (Run/Pause) key. The
measurement will stop when the measured level has
remained within a user-defined range and the measurement
has run for a user-defined time period. The setup procedure
is described in ‘Manual Stop, Timed Stop or Stop When
Stable” on page 6-4.
Continuous
When using Continuous, the Model 831 begins running
whenever the Run key is pressed and when the power is
turned on. A session log entry of type “Run” with a cause of
“Power” is created at the same time. It is stopped by
pressing the 7 (Stop) key. Measurements are made
continuously from the time of power-on to stop. The setup
procedure is described in ‘Continuous” on page 6-6.
6-2
Run Control Setup
Model 831 Technical Reference Manual
The ability to restart when power is
restored following a power failure,
with documentation in the session
log, is a valuable feature for longterm remote noise monitoring
applications
If the unit stops due to a power failure, the session log is
labeled as a type of “Stop” with a cause of “Power”. If,
following a loss of power, the power is restored, the Model
831 will automatically begin running again.
If the unit is paused it will resume automatically after 5
minutes. This prevents loss of data due to an inadvertent
pause, whether done manually or when the preamplifier
cable is removed.
Single Block Timer
Using Single Block Timer, a single measurement is made for
the time interval defined by the single block timer settings.
The measurement may also be started or interrupted
manually by pressing the 9 (Run/Pause) key or the 7
(Stop) key. The Single Block Timer mode is often used to
make a measurement for a period of one week. The setup
procedure is described in ‘Single Block Time or Daily
Timer” on page 6-8.
Daily Timer
Using Daily Timer, the measurement is initiated for one or
more blocks of time every day within the programmed date
range as set by the Daily Timer settings. The measurement
may also be initiated or interrupted manually pressing the
9 (Run/Pause) key or the 7 (Stop) key. The Daily
Timer mode is often used to make a work area survey that
follows a worker’s daily schedule for an entire work week.
The setup procedure is described in ‘Single Block Time or
Daily Timer” on page 6-8.
Run Mode with Measurement History
This chapter does not address Run
Modes with Measurement History.
Model 831 Technical Reference Manual
There are many applications where it is desirable to measure
and store a sequence of measurements using the same setup,
either manually or automatically. With the Model 831 this is
facilitated using the Measurement History feature, which is
described in detail in Chapter 11 "Measurement History" on
page 11-1.
Run Mode with Measurement History
6-3
Run Modes Without Measurement History
All of the six Run Modes have a check box to enable the
Measurement History feature, as is shown in the figures
appearing in the sections which follow. The setup
descriptions presented in the following sections are for
setups without the Measurement History enabled.
When Measurement History is not enabled, at the conclusion
of the measurement there will be a single measurement
which must be manually stored.
Manual Stop, Timed Stop or Stop When Stable
When the run mode used is Manual, Timed Stop or Stop
When Stable, a measurement is started by pressing the Run
key and ends when Stop is pressed, when the timer expires
or when the signal is stable within a deviation. The selection
and setting of appropriate parameters for these run modes is
shown in FIGURE 6-2.
FIGURE 6-2 Setup of Manual Stop, Timed Stop and Stop When Stable Run
ModesManual Stop
The measurement is manually stopped by pressing the 7
(Stop) key.
6-4
Run Modes Without Measurement History Model 831 Technical Reference
Timed Stop
The time at which the measurement is to stop is entered
manually into the Time data field.
Stop When Stable
Suggestion: Press RUN after the
noise source is on and in the desired
condition. Starting a measurement
prior to activating the noise source
of interest may reduce the level
measured and take longer than
normal to stabilize.
The Stop When Stable feature is used to automatically end a
measurement when the time average level has stabilized. It
is often used in environments that have a rather continuous
or repetitive noise source such as machinery. The stable
condition is defined as when the Current measurement's
average level (i.e. LAeq) does not vary from maximum to
minimum by more than the entered Delta Level during the
entered Time interval. To be stable, the total of all variations
of the Current average level must also be less than two times
the entered Delta Level; this condition detects amplitude
modulation in the averaged level and prevents a premature
stop. Shorter measurement times, though with less accurate
results, are obtained by increasing the Delta Level or
shortening the Time. Longer measurements, that are more
representative of the true level, will be made with smaller
Delta Levels and a longer Time entries.
Entering Delta Level
The Delta level is the maximum allowed change in Current
average level (i.e. LAeq) permitted during the time interval
defined below. The minimum level that can be set is 0 and
the maximum is 5.0 dB. The default is 0.2 dB.
Entering Time
Note that the Stable Time interval
used for determining the stable
condition is limited to 100s
maximum. If time>100s, it will run
for the time set and then stop when
variations in the Current average
level over the last 100s are less than
the Delta Level
Model 831 Technical Reference Manual
The Time is the minimum interval that the measurement
must run. The measurement will run for the interval
specified and then continue until the stability condition was
met. The smallest value that can be entered is 20 seconds
and the largest is 99:59:59 (h:m:s). The default is 20
seconds.
For each, use highlight the desired data field and press the
5 key. Enter the desired values and press the 5 key.
Run Modes Without Measurement History
6-5
Continuous
Daily
Status
Auto-Store
FIGURE 6-3 Setup of Continuous Run Mode
When using the Continuous Run mode, the measurement is
initiated manually by pressing the 9 (Run/Pause) key and
is manually stopped by pressing the 7 (Stop) key.
Daily Reports
There are two daily reports available with the Continuous
Run mode.
•
Daily Auto-Store
•
Daily Cal-Check
Daily Auto-Store
When Daily Auto-Store is set to
“Never”, as shown in FIGURE 6-3,
the Continuous Run mode is
essential the same as the Manual
Run mode, with the exception that in
Continuous it automatically begins
running,
thus
measuring
continuously even when interrupted.
6-6
Daily Auto-Store permits the automatic storage of daily
measurement reports for 24-hour time periods, beginning at
a user-specified time. Each report can be configured to
represent the complete 24-hour time period or to include
data corresponding to 2 4 or 6 equal time periods
within the 24-hours.
Run Modes Without Measurement History Model 831 Technical Reference
Highlight the Daily Auto-Store field and press the
to obtain the menu shown in FIGURE 6-4.
5 key
FIGURE 6-4 Daily Auto-Store Menu
Use the 2 and 8 arrow keys to select the desired
number of measurements per day and press the
key.
5
When any option other than “Never” is selected, a Time data
field will appear as shown in FIGURE 6-5 to define the start
time for the 24-hour time period to be used for the report.
FIGURE 6-5 Auto-Store Report Start Time
5
Highlight each data field, press the
key and use the
arrow keys to set the parameters as desired. Press the
key again to complete the selection.
5
Effect of a Noise Event
If a noise event, described in Chapter 12 "Event History" on
page 12-1, occurs during the daily autostore, the storage
operation is delayed. This delay would be implemented
whether the status is Triggered or Valid. The autostore
would be processed one minute past the normal autostore
time or right when the event ends (not including the
continuation process), whichever comes first.
Daily Cal-Check
When the Model 831 is used with one of the Larson Davis
outdoor microphone preamplifiers, 426A12 or PRM2100K,
which are equipped with electrostatic actuators, the user can
program an automatic once per day calibration check of the
system.
Model 831 Technical Reference Manual
Run Modes Without Measurement History
6-7
5
Highlight the Cal-Check field and press the
key, which
will place a check in the Cal-Check check box and open the
menu shown in FIGURE 6-6.
FIGURE 6-6 Cal-Check Menu
5
Highlight the Time data field, press the
key and use the
arrow keys to set the time at which the calibration check is to
take place. Press the
key again to complete the
selection.
5
The calibration check information will be provided with in
the Daily Report.
Single Block Time or Daily Timer
When the run mode is Single Block Timer or Daily Timer,
this each measurement will consist of data measured over
different blocks of time between the start date and time and
the end date and time.
6-8
Run Modes Without Measurement History Model 831 Technical Reference
The selection and setting of appropriate parameters for the
Continuer, Single Block Time and Daily Timer run modes is
shown in FIGURE 6-7.
Click to open data
fields for blocks 2
and 3
FIGURE 6-7 Setup of Single Block Timer and Daily Timer Run Modes
Measurements are initiated for one of more time blocks
within the selected Start Date and End Date.
5
Highlight each data field individually, press the
key
and use the arrow keys to set the parameters as desired.
Press the
key again to complete the selection. The
following
example
illustrates
several
important
considerations in setting up these Timer modes.
5
Model 831 Technical Reference Manual
Run Modes Without Measurement History
6-9
Example
As an example, suppose we have begun a daily timer setup
as shown in FIGURE 6-8.
FIGURE 6-8 Daily Time Setup Example
The selected blocks cannot overlap. For example, if the End
Time 1 is set to 00:00:04, then the Start Time 2 should be
greater than 00:00:05 and it should not be greater than Start
Time 1.
A measurement block can span over midnight. So, in the
example, these measurements would be recorded.
1.
2.
3.
23:59:00 pm 6/23/2008 to 00:00:04 on 06/24/2008
23:59:00 pm 6/24/2008 to 00:00:04 on 06/25/2008
23:59:00 pm 6/25/2008 to 00:00:04 on 06/26/2008
This means that even though our date selected range is
between 23rd and 25th, the stop time can be past the date
range. Hence, the selected date range controls only the time
of initiation of the measurement.
All the measurements made between the date ranges would
be part of a single file unless there has been a manual
intervention. irrespective of the way the auto-store
preference is set. It would behave as if it was set to None.
If a measurement is manually stopped in the middle of a
block, no measurement would be initiated until the next
valid start time.
If a measurement is manually started, the measurement
would stop automatically at the next valid stop time.
6-10
Run Modes Without Measurement History Model 831 Technical Reference
Model 831 Technical Reference Manual
Run Modes Without Measurement History
6-11
6-12
Run Modes Without Measurement History Model 831 Technical Reference
CHAPTER
7
Making a Measurement
In this chapter we describe how to make and store an
accurate sound level measurement. Before doing this,
make sure that the Model 831 has been setup to meet the
requirements for the measurement as described in
Chapter 4 "Basic Measurement Setup” on page 4-1.
Configuration of the System
The System Model 831 should be configured as shown in
FIGURE 1-1 on page 1-16 with the preamplifier connected
to the front of the instrument and the microphone connected
to the end of the preamplifier.
Switching On the Model 831
DO NOT use the hardware power
switch to turn the Model 831 OFF.
This may cause data to be lost. See
"Hardware Power Switch” on
page 2-7 for additional information
on the use of the hardware power
switch.
Model 831 Technical Reference Manual
With fresh batteries installed, press the 0 (ON/OFF) key,
shown in ‘ON/OFF Key” on page 3-7, to switch on the
Model 831.
Making a Measurement
7-1
Start-up Period
With standard memory, the start-up period will be less than
two minutes. With the optional 2 GB memory, the startup
period can be several minutes for the first boot-up. As the
instrument is starting up, the display will show the following
screen.
FIGURE 7-1 Boot Graphic
Disk Check During Boot-up
The Model 831 will check the internal flash memory during
boot-up when any of the following conditions occur:
Data View and Data Display screen
refer to Live, Overall and Session
Log Pages.
7-2
•
The Model 831 was improperly shutdown. For example,
a shutdown due to lockup or lack of power
•
If the Model 831 has been rebooted 29 times since the
last memory check
•
If the Model 831 has been more than 180 days since the
last memory check
When the Model 831 is fully started, the Data Display
Screen will appear as shown in FIGURE 7-2 “Data Display
Screen, Live Page"
Switching On the Model 831 Model 831 Technical Reference
Power Indicator
Run Time
Measurement
Status
Tabs
Section
indicator
Live Page
Scroll Bar
Stability
Indicator
FIGURE 7-2 Data Display Screen, Live Page
The 7 (STOP/STORE) key will produce a steady red light
to indicate that the Model 831 is in the stopped state with no
data yet measured.
Views
In this screen, there are three tabs labeled “Live”, “Overall”
and “Session Log”, each of which is associated with a page.
Because the Live Tab is selected, the Live Page is seen in
FIGURE 7-2. The Left and Right Softkeys, defined below,
are used to select these tab pages.
Softkeys
There are three buttons beneath the display, aligned with the
left arrow, Menu and right arrow keys as shown in
FIGURE 7-3 “Softkeys" .
FIGURE 7-3 Softkeys
These buttons are called softkeys because pressing any one
will invoke the action associated with the text or symbol
directly above it on the screen. In this instance, pressing the
Model 831 Technical Reference Manual
Switching On the Model 831
7-3
Left or Right Softkey will display the tab page to the left or
right, respectively, of the tab page presently displayed. The
Center Softkey will open a menu associated with this screen.
These are context-sensitive, meaning that the text or symbol
above each Softkey, and the associated action, can change
depending upon the page appearing at that time. See Chapter
3 "Softkeys” on page 3-6.
Model 831 Setup
Set the measurement parameters of the Model 831 as
described in Chapter 4 "Basic Measurement Setup” on
page 4-1.
Calibrating the Model 831
The Model 831 must be calibrated using a sound level
calibrator prior to performing a measurement. The procedure
for calibration is described in Chapter 21 "Calibration” on
page 21-1.
Positioning the Model 831
Observer Position
The meter will be either mounted upon a tripod or held in the
hand. In order to avoid the effect of sound reflections from
the body of the operator interfering with the measurement,
the meter should be located as far as possible from the body.
Thus, when actually performing the measurement, the
operator should place himself at a distance behind the
tripod-mounted meter, or extend the hand-held meter as far
from the body as is comfortable.
Microphone Extension Cable
Note that the electromagnetic
emissions compliance testing was
performed using only a 10 ft.
EXC010 extension cable, as
described in ‘CE Information” on
page A-19
7-4
If desired, a shielded microphone extension cable may be
placed between the meter and the preamplifier/microphone.
No correction is required when using Larson Davis Model
EXCXXX microphone extension cables in combined
lengths up to 200 feet. XXX is the length in feet (XXX =
010, 020, 025, 035, 050, 060, 100 and 200 available).
Model 831 Setup
Model 831 Technical Reference Manual
When doing so, take care that the preamplifier/microphone
is held or mounted in such a way to minimize the effect of
reflections on the sound field near the microphone.
Use of a Windscreen
Wind blowing across the microphone generates pressure
fluctuations on the microphone diaphragm which can
produce errors in the measurement. As a result, when
performing measurements in the presence of low level
airflows, it is recommended that a windscreen be placed
over the microphone. Larson Davis provides the WS001
windscreen, a 3 1/2” diameter ball made of open cell foam
which can be placed over the microphone and preamplifier
as shown in FIGURE 7-4.
FIGURE 7-4 Position of Windscreen
To install the windscreen, hold the meter in one hand and the
windscreen in the other. Insert the microphone/preamplifier
assembly into the opening in the windscreen as shown in
FIGURE 7-5 and slide the windscreen completely down
over the preamplifier.
FIGURE 7-5 Placement of Windscreen
Prior to beginning the measurement, select the Live View.
You can now see a live display of the instantaneously
measured data.
Model 831 Technical Reference Manual
Positioning the Model 831
7-5
The position of the vertical scroll bar
on the right side of the display
indicates the page being displayed
relative to the available pages; first
page at the top, last page at the
bottom.
The data available for display from the Live View is
distributed over three pages (four or five pages with the
optional OBA feature). Use the 8 and 2 keys to
change pages.
Take a minute or so to examine these different displays
before continuing with this example.
Use the softkeys to select the Overall View. Note that the
measurement and display of data has not yet begun and that
the measurement run time displayed at the very top of the
screen indicates 00:00:00:0.
Performing the Measurement
Starting the Measurement
The Model 831 uses a single range
for sound level measurements, so
there is no need to select a range as
part of making a measurement.
Select the Overall Display in order
to observe the measurement results
or accumulation in progress.
For detailed information on the
measurement state of the Model 831
as indicated by the red and green
LEDs behind the 7 (STOP/
STORE) and 9 (RUN/PAUSE)
keys, respectively, see the section
"Hardkey LED Colors" on page 246.
7-6
The Live Display provides a running sound level
measurement whether or not the 831 is actually performing a
measurement while the Overall Display provides the
measurement actually being made. Select the Overall
Display in order to observe the measurement in progress.
Press the 9 (RUN/PAUSE) key to start the measurement,
which will start the run clock and initiate the measurement
and display of overall data.
When the measurement is in progress, the
PAUSE) key will produce a steady green light.
9 (RUN/
Performing the Measurement Model 831 Technical Reference
Data Display
See "Overall Page" on page 5-12.
The measured data are available for display from the Overall
View. These data are distributed over thirteen sections (with
the 831-IH and 831-OB3 options). Use the 8 and 2
keys to change sections. The first two sections from the top
present basic sound level parameters as shown in FIGURE
7-6 and FIGURE 7-7.
Measurement Duration
Date and Time of Initiation
of Measurement
FIGURE 7-6 Leq and Running SPL
The two digital displays present the frequency weighted Leq
value (LAeq = 74.9 dB) and the frequency weighted Lpeak
value (LApeak = 89.9 dB). Both of these were measured
using A-weighting as indicated by the A. The duration of the
measurement is indicated at the top of the display and the
data and time that the measurement was initiated are
indicated at the bottom of the display. The graph represents
the profile of the Leq as a function of time during the entire
measurement period.
Model 831 Technical Reference Manual
Performing the Measurement
7-7
Measurement Duration
Leq
Running SPL
Running Lpeak
Maximum Lpeak with data
and time of occurrence
Maximum RMS Value
with date and time of
occurrence
Minimum RMS Value
with date and time of
occurrence
FIGURE 7-7 Multiple Sound Level Parameters
Measurement Range
The measurement ranges over which the Model 831 meets
the standards, which depend upon the selected frequency
weighting, as shown in ‘Performance Specifications” on
page A-4. Measurements which include levels outside this
range should not be considered accurate. An overload
indication will appear when levels above the range appear.
However, the user should take care not to rely on
measurements whose levels are below the lower limit of the
specified range.
Overload/Under Range Levels
For further detail on determination
of overload level and under range
levels, see "Sensitivity Page" on
page 21-13.
As part of the calibration procedure, an overload level (dB
Peak) and under range sound pressure levels for A, C and Zweighting are determined for the instrument setup and
microphone/preamplifier combination being used. These are
displayed on the Microphone Page as shown in FIGURE 2111 "Sensitivity Page” on page 21-13.
Overload Indication
When a signal from the preamplifier exceeds the calibrated
input range of the Model 831, the Input Overload Icon will
appear at the top of the display.
7-8
Performing the Measurement Model 831 Technical Reference
While the overload is present, the icon will flash on and off.
If an overload occurs while running the overload icon will
latch on and will not be removed from the display. A reset
will clear the icon.
Under Range Indication
When the signal from the preamplifier drops to the point
where the noise level of the instrument and the preamplifier
influence the measurement, an under range condition exists.
When this happens the Under Range Icon will appear.
As long as the under range condition exists, the icon will
flash. When the measured level no longer produces an under
range condition, the icon will be removed from the display.
At any time when a measured parameter is in an under range
condition, it’s numeric display will appear in grey rather
than the usual black, as shown FIGURE 7-8.
Normal Range
Under Range
FIGURE 7-8 Normal vs Under Range Data Display
Pausing the Measurement
At any time the measurement of overall data can be
temporarily suspended by pressing the 9 (RUN/PAUSE)
key. Note that the run clock will not pause. However,
instantaneous data will continue to be displayed in the Live
View.
When paused, the
flashing red light.
Note that a measurement may be
paused and then run again multiple
times.
Model 831 Technical Reference Manual
7 (STOP/STORE) key will produce a
Pressing 9 (RUN/PAUSE) key one more time will cause
the measurement to begin again. The 9 (RUN/PAUSE)
key will produce a steady green light, and overall data will
continue to be accumulated. The overall data will not be
affected by any acoustic events occurring during the time
period that the Model 831 was paused.
Performing the Measurement
7-9
Back Erase
The back erase function permits the user to rapidly delete
from the measurement the effects of acoustical events which
have occurred during the previous five or ten seconds.
Back Erase Disabled
The back erase feature is unavailable when any of the
following have been enabled:
•
Measurement History, described in ‘Measurement
History” on page 11-1.
•
Event History, described in ‘Event History” on page 121.
•
Spectral Ln, described in ‘Spectral Ln Mode” on page 47.
•
Event Sound Recording,
Recording” on page 15-22
‘Noise
Event
Sound
Back Erase Implementation
The back erase is implemented when the measurement is
paused, as described in the preceding section. When the
measurement is paused, the center softkey will be labeled
Back-5s, as shown in FIGURE 7-9.
5 Second Back Erase Label
FIGURE 7-9 Five Second Back Erase Label
7-10
Performing the Measurement Model 831 Technical Reference
Press the center softkey to implement the five second back
erase.
Note that the Back-5s label does not
indicate the state of the instrument
but that an action can now be taken
to delete the last five second
segment.
< Ten Seconds Since Last Stop or Pause
After pressing the center softkey, if the measurement
duration since the last Stop or Pause has been less the ten
seconds, the center softkey will be labeled Undo as shown
in FIGURE 7-10.
Back Erase Undo Indication
FIGURE 7-10 Back Erase Undo Indication
The user can take one of the following actions:
Model 831 Technical Reference Manual
•
Press the 9 (RUN/PAUSE) key to continue the
measurement with the five second segment removed.
•
Press the center softkey to implement the Undo action
and then press the 9 (RUN/PAUSE) key to resume the
measurement without removing the previous five second
time segment.
Performing the Measurement
7-11
> Ten Seconds Since Last Stop or Pause
After pressing the center softkey to implement a five second
back erase, if the measurement duration since the last Stop
or Pause has been more then ten seconds, the center softkey
will then be labeled Back-10s, as shown in FIGURE 7-10.
Ten Second Back Erase Label
FIGURE 7-11 Ten Second Back Erase Label
Note that the Back-10 label does not
indicate the state of the instrument
but that an action can now be taken
to delete the last ten second segment.
Now the user can take one of the following actions:
•
Press the 9 (RUN/PAUSE) key to accept the five
second back erase and continue the measurement.
•
Press the center softkey to extend the back erase to ten
seconds. The center softkey will then be labeled Undo as
shown in FIGURE 7-10.
The user can then take one of the following actions:
7-12
•
Press the 9 (RUN/PAUSE) key to accept the ten
second back erase and continue the measurement.
•
Press the center softkey to implement the undo action
and the press the 9 (RUN/PAUSE) key to continue the
measurement without removing the previous ten second
time segment.
Performing the Measurement Model 831 Technical Reference
Modified Profile Graph
After a back erase operation has been performed, the sound
level profile graph will be modified to indicate the erase
operation as shown in FIGURE 7-12.
Erased Portion
of Profile
FIGURE 7-12 Modified Profile Graph
Time History Records
The time history records from the point data were restored
from to the last record will be marked as back erase records.
Resetting the Measurement
A measurement is most often reset
when a noise event which is not
typical of the measurement desired
takes place. For example, an aircraft
passing overhead when attempting
to measure the background noise in
a normally quiet area.
To reset a measurement in progress, press the 1 (RESET)
key. This will erase all data previously measured and reset
the run time clock to zero. A reset will not reset stored data
files. A reset can be initiated when the Model 831 is running,
paused or stopped. However, it must be stopped for the reset
operation to be performed.
Resetting When Running or Paused
If it is running or paused when the 1 (RESET) key is
pressed, a Stop Required Menu will be displayed as shown
in FIGURE 7-13.
FIGURE 7-13 Stop Required Prompt
Model 831 Technical Reference Manual
Performing the Measurement
7-13
The OK response will already be highlighted, so simply
press the 5 (ENTER) key to continue.
Otherwise, highlight Cancel and then the 5 (ENTER) key
to cancel both the Stop and the Reset operations.
After selecting to Stop the measurement, the Save File
Menu, shown in FIGURE 7-14, will appear to provide a
choice of saving the measured data prior to the reset or not
as described in ‘Storing the Measurement” on page 7-15.
Resetting When Stopped
If the Model 831 is stopped when the 1 (RESET) key is
pressed, the Stop Required Menu will not appear, but the
Save File Menu will appear to provide a choice of saving the
measured data prior to the reset or not.
After the reset has been performed, the 7 (STOP/STORE)
key will produce a steady red light to indicate the
measurement state as Stopped, Reset.
Starting a New Measurement
The 9 key (RUN/PAUSE) key must be pressed to start a
new measurement.
Stopping the Measurement
Note that the Model 831 can be
stopped when either running or
paused.
Press the 7 (STOP/STORE) key to suspend the overall
measurement, which will also stop the run clock. Stopping
the measurement with data not yet stored will cause the 7
(STOP/STORE) key to flash red every 3.2 seconds.
Pressing the 9 key (RUN/PAUSE) key afterwards will
continue the overall measurement which had been stopped.
The run clock will also begin again from the time indicated
when the stop had occurred. This will also cause the 9
(RUN/PAUSE) to produce a steady green light.
7-14
Performing the Measurement Model 831 Technical Reference
Storing the Measurement
Note: a measurement can only be
stored when the measurement has
been stopped.
To store the measurement, press the 7 (STOP/STORE)
key one more time while stopped. The Save File menu will
then be displayed, as shown in FIGURE 7-14.
FIGURE 7-14 Save File Menu
Note that when the Spectral Ln Mode
is On, as described in "Spectral Ln
Mode” on page 4-7, the entire Ln
distribution table is stored. This may
take several seconds. During this
time a run cannot be initiated, but
data can be viewed.
The data file name will be set to the name defined in the
section "General Page" on page 4-3 (831_Data.003 in
FIGURE 7-14) along with a file number. The file number
automatically begins at 001 for the first measurement stored
and will index so that whenever a measurement is stored the
file number assigned will be the next in sequence.
The data file name can be changed by highlighting it with
the up arrow key, press the
key, make changes as
desired, and press the
key to save the changes.
5
After a file has been successfully
stored, the Model 831 will
automatically reset when the 9
(RUN/PAUSE) key is pressed to
begin another measurement.
5
To continue with the save operation, highlight Yes and press
the
key. The 7 (STOP/STORE) key will produce a
steady red light to indicate the measurement state as
Stopped, Stored.
5
To abort the save operation, highlight No and press the
key.
5
Overwriting a Saved File
If you wish to use this data to replace a data file already
saved in the Model 831, instead of highlighting Yes or No,
highlight the box with the title “...” and press the
key.
This will open a window listing all the data files already
saved in the Model 831, as shown in FIGURE 7-15.
5
FIGURE 7-15 Saved Data Files
Model 831 Technical Reference Manual
Storing the Measurement
7-15
Highlight the file which is to be overwritten and press the
key. This will replace the file name and number which
previously appeared with this one, as shown in FIGURE 716.
5
FIGURE 7-16 Overwriting a Saved File
To continue with the overwrite operation, highlight Yes and
press the
key.
5
To abort the overwrite operation, highlight No and press the
key.
5
To select a different previously saved file to overwrite,
highlight the box with the title “...” and press the
key
to repeat the overwrite procedure.
5
Low Level Sound Fields
As long as the sound level being measured is within the
measurement range shown in ‘Performance Specifications”
on page A-4, inherent (self-generated) noise and linearity
problems can be ignored.
It is possible to manually correct the measured RMS sound
pressure levels for the typical inherent noise levels (see the
noise floor specifications in ‘Performance Specifications”
on page A-4) as long as the difference between the measured
sound level and the inherent noise level is greater than 3 dB.
This is done by subtracting the inherent sound level from the
total sound level using the following formula.
Lcorr = 10 log 10
Lmeas 10
– 10
Linh 10
where
Lcorr = corrected sound level
Lmeas = measured sound level
Linh = inherent noise level
7-16
Storing the Measurement Model 831 Technical Reference Man-
Recovery After Improper Shutdown
NOTE: There is a risk of file-system
corruption when power to the system
is unexpectedly shut off. To minimize
this risk, always follow proper shutdown procedures.
When the Model 831 has been shutdown improperly, for
example a loss of power during a measurement, the
procedure for handling data depends upon the setup being
used at the time.
Case 1
If the Run Mode is:
Continuous
or
Single Block Timer
or
Daily
and
Daily Autostore is enabled
Normal Operation
Under normal operation the stored data files will be stored
with the following name format:
yymmdd00.LD0
where yymmdd is the date the measurement was started.
Improper Shutdown
When the instrument is powered up following an improper
shutdown, the data is automatically stored in the following
name format:
yymmddxx.RC0
where yymmdd is the date the measurement was started and
xx is a sequence number that will prevent the new filename
from conflicting with a previously stored file.
Case 2
This case covers all setups other than those described in
Case 1.
Improper Shutdown
Following an improper shutdown, when the instrument is
next turned On:
Step 1
The user is prompted to save the data.
•If the user responds by selecting to store the data, the
data is stored and the instrument is reset
Model 831 Technical Reference Manual
Recovery After Improper Shutdown
7-17
•If the user responds by selecting not to store the data, the
sequence moves to Step 2.
Step 2
When the user is present, he/she
must eventually select to store the
data, reset the instrument, or take no
action, in which case the instrument
will be automatically reset.
The user is prompted to reset the instrument
•
If the user responds by selecting to reset the instrument,
the instrument is reset.
•
If there is no user response to the prompt within ten
seconds, the instrument is reset.
•
If the user responds by selecting not to reset the
instrument, the sequence moves back to Step 1.
This sequence is diagramed below
Yes
Data Saved
Save Data prompt
No
Reset Instrument prompt
No
Yes
No Response for 10 seconds
Instrument Reset
FIGURE 7-17 Improper Shutdown Sequence, Case 2
7-18
Recovery After Improper Shutdown Model 831 Technical Ref-
Model 831 Technical Reference Manual
Recovery After Improper Shutdown
7-19
7-20
Recovery After Improper Shutdown Model 831 Technical Ref-
CHAPTER
8
Industrial Hygiene
This chapter describes the measurement features
associated with the Industrial Hygiene optional firmware
831-IH.
Measurement Setup
The Industrial Hygiene measurement features are setup from
the Settings Screen, in the same manner as the basic
measurement parameters are setup as described in Chapter 4
"Basic Measurement Setup” on page 4-1.
When this firmware is loaded in the instrument, two tabbed
pages named Dosimeter 1 and Dosimeter 2 will appear
which were not described in that chapter. The Dosimeter 1
and Dosimeter 2 Pages are provided to permit the evaluation
of two independent noise dose data sets. Other than being on
separate pages, they are identical. Note that the default
values for Dosimeter 1 parameters are as shown in FIGURE
8-1.
FIGURE 8-1 Dosimeter 1
Model 831 Technical Reference Manual
Industrial Hygiene
8-1
Predefined Setups
In most cases, measurements of this type are setup to
conform to a specific standard. The Model 831 permits the
user to create such a setup in a single step by simply
selecting the applicable standard. The standards addressed
by the Model 831 and the corresponding parameters are as
shown in Table 8-1 'Predefined Noise Dosimeter Setups'.
Standard
Exchange
Threshold
Rate
Criterion
Level
Hours
OSHA-1
5
90
90
8
OSHA-2
5
80
90
8
ACGIH
3
80
85
8
NIOSH
3
80
85
8
IEC
3
Not Enabled 85
8
Table 8-1 Predefined Noise Dosimeter Setups
The Name field will already be
highlighted when the Dosimeter 1 or
Dosimeter 2 sections are opened. If
this has been changed, use the 8 key
to move the highlight back to the
Name field.
The names of the predefined setups can be accessed from the
Name field at the top of the display. Press the
key to
drop down a list of predefined setups by name as shown in
FIGURE 8-2.
5
FIGURE 8-2 Predefined Dose Setups
5
Highlight the name of the desired setup and press the
key to make the selection. The name of this setup will now
appear in the Name field and all parameters will be set
according to the setup selected, as shown in FIGURE 8-3.
8-2
Measurement Setup Model 831 Technical Reference Manual
FIGURE 8-3 IEC Setup
Parameters Individually Defined
In the Dosimeter Page there are two fields (Name and
Exchange Rate) and two sections (Threshold and Criterion).
Name Field
If a predefined setup has been
selected and any of the preset
parameters are modified, the user
should consider changing the name
of the setup.
The Name field is optional, although many users will enter
text associated with the measurement to be performed such
as a specific company Dose standard (“My Dose”) or the
name of a standard not in the list. To enter a name, use the
8 and 2 keys to highlight the Name field. Use the 4
key to highlight the name portion of the highlighted box;
then press the
key. Use the 4 6 8 and 2 keys
to enter the desired characters. Press the
key to
complete your entry.
5
5
Parameter Fields
The titles of the second field (Exchange Rate) and the two
sections at the lower portion of the display (Threshold and
Criterion) correspond to the three parameters we wish to set.
Within each is a numeric field into which the user can enter
the value desired. Highlight the desired section and proceed
as described below.
Model 831 Technical Reference Manual
Measurement Setup
8-3
Exchange Rate
To set the exchange rate, highlight the data field and press
the
key to open a drop down list of values, as shown in
FIGURE 8-4 "Exchange Rate List" .
5
FIGURE 8-4 Exchange Rate List
Highlight the desired value and press the
the selection.
5 key to make
Threshold and Criterion
Note that when setting the Threshold
value, the Enabled check box must
be checked before data can be
entered into the numeric field. Use
the Left Softkey to highlight the box
and press the
key.
To set these parameters, highlight the appropriate section,
press the
key, enter the numeric value desired, then
press the
key.
5
5
5
Auto-Calculate
As described above, the Criterion Level and Time are set
independently. However, in the standards there is a linear
relationship between the Criterion Level and the Time.
When Auto-Calculate is activated, by checking the check
box to the left, then only one of these need be entered and
the other will be automatically set to follow the standard.
8-4
Measurement Setup Model 831 Technical Reference Manual
Data Display
The Industrial Hygiene measurement data are displayed on
the Overall Page of the Data Display View, as are the results
of the basic sound level measurements as described in
Chapter 5 "Basic Data Display” on page 5-1.
Four sections will appear: Sound Exposure, Dosimeter 1,
Dosimeter 2 and SEA. The two dosimeter displays will be
identical except for the measurement values (if they had
been setup with different measurement parameters). These
four sections will be found just before the last section of the
Overall Page.
Sound Exposure
FIGURE 8-5 Overall Page, Section 10
Section 10 shows the Sound Exposure metrics (in this
instance for A-weighted). LAE is the sound exposure level
(previously known as SEL). The Sound Exposure metrics
indicate the actual and extrapolated (8 and 40 hours)
exposure accumulated in terms of hours and seconds. These
are discussed in "Sound Exposure (SE)" on page D-16 and
"Sound Exposure Level (SEL, LE)" on page D-17.
Model 831 Technical Reference Manual
Data Display
8-5
Dosimeter 1 and 2
FIGURE 8-6 Dosimeter 1 Display
In this example, we can see that the measurement parameters
correspond to the setup named “OSHA-1”.
TWA(8.0)
The value of TWA(8.0) (Time Weighted Average for 8
hours) is based on data measured during the run time and
calculated for the user-defined Criterion Time, in this case 8
hours. The value of Criterion Time is set by selecting a
predefined setup as described in "Predefined Setups" on
page 8-2 or by entering a numerical value as described in
"Threshold and Criterion" on page 8-4.
As an example, suppose a measurement was performed over
a time period of ten minutes. The value of TWA(8.0) would
be the same as the TWA measured over an eight hour period
if there had been no sound exposure other than that which
occurred during that ten minute period.
ProjTWA
The ProjTWA (Projected Time Weighted Average) is
calculated from data measured during the measurement run
8-6
Data Display
Model 831 Technical Reference Manual
time and calculated without regard to the criterion time.
Continuing with the example in the above paragraph, the
ProjTWA for that ten minute measurement represents the
value of TWA which would be measured if the noise
measured during the ten minute period had continued for
eight hours.
Lep,d
The Daily Personal Noise Exposure, Lep,d is calculated from
data measured during the run time of the measurement.
DOSE
Dose is based on data measured during the run time
calculated for the user-defined Criterion Time and Criterion
Level (100% definition). As an example, suppose a
measurement was performed over a time period of ten
minutes. The value of Dose would be the same as the Dose
measured over an eight hour period if there had been no
other sound exposure other than that which occurred during
that ten minute period.
ProjDOSE
Projected Dose is based on data measured during the run
time and calculated without regard to the criterion time.
Continuing with the example in the above paragraph, the
Projected Dose for that ten minute measurement represents
the value of Dose which would be measured if the noise
measured during the ten minute period had continued for
eight hours.
The remainder of the display shows the parameters used for
the measurement: Frequency Weighting, Exchange Rate,
Threshold and Criterion (time and level).
Model 831 Technical Reference Manual
Data Display
8-7
SEA
The SEA parameter is used primarily
in the Canadian province of Quebec.
FIGURE 8-7 SEA Display
SEA is an integration of 1 second peaks that exceeded 120
dB. Both the SEA value and the frequency weighting used
for the measurement are displayed.
8-8
Data Display
Model 831 Technical Reference Manual
Model 831 Technical Reference Manual
Data Display
8-9
8-10
Data Display
Model 831 Technical Reference Manual
CHAPTER
9
Voice Recording
Control Page - Voice Recording
Voice recordings are recorded using a sample rate of 8 kHz.
To activate the Voice Recorder Page, press the 3 (TOOLS)
key and highlight the Voice Recorder icon as shown below.
FIGURE 9-1 Control Panel
Press the
5 key to open the Voice Recorder Page.
Press the Close Softkey to exit from this page.
With Headset
When using a headset, the Jack
Function must to set to Headset as
described in the section "Jack
Function" on page 17-13.
Model 831 Technical Reference Manual
By connecting a headset to the headset jack on the bottom of
the Model 831, voice records may be recorded using the
headset microphone. Voice records may be played back
through the headset speaker.
Voice Recording
9-1
Without Headset
With no headset plugged in, a record may be made of the
sound arriving at the measurement microphone.
Voice Recorder
FIGURE 9-2 Voice Recorder Page
The 5 key can also be used to play
the highlighted voice record.
9-2
The Voice Recorder Page will present a list of existing voice
records. Highlight a specific voice record and press the
Right Softkey to play it back through a headset speaker.
When measurement data are stored, all voice records that are
shown on the list will be stored in the data file. The voice
records list will then be empty.
Voice Recorder
Model 831 Technical Reference Manual
Record
To begin a recording from the Voice Recorder Page, press
the Left Softkey, just beneath the Record Icon.
Record Icon
The microphone level can be
adjusted with the three position
microphone switch found on the
headset (ACC003).
The Recording message box will appear. The meter indicates
the relative signal level from the recording microphone and
the progress bar shows the elapsed time of the measurement.
The progress bar length represents 25.6 seconds, which is
the maximum time for a voice recording.
FIGURE 9-3 Recording
5
Press the
key to stop recording if 25.6 seconds has not
elapsed. At the end of 25.6 seconds, recording will stop
automatically.
Save Prompt
When the recording has been stopped, the Save Prompt
shown in FIGURE 9-4 will appear.
FIGURE 9-4 Save Recording Prompt
Select Yes to save the recording or No to close the recording
session without saving the recording.
Model 831 Technical Reference Manual
Voice Recorder
9-3
Playback
The 5 key can also be used to play
the highlighted voice record.
To playback a highlighted voice record, press the Right
Softkey beneath the Playback Icon.
Playback Icon
Use the volume control on the
headset (ACC003) to adjust the
playback level.
With a headset attached to the headset jack on the bottom of
the case, you will hear the voice recording in the headset
speaker.
FIGURE 9-5 Playback
The meter indicates the relative amplitude of the recorded
sound.
The progress bar indicates the elapsed time of the playback
of the recording. The progress bar length represents the
actual recording time.
Press the
5 key to stop the playback.
At the end of the voice record, the playback will stop
automatically.
Session Log Page
Voice recordings can also be played back from the Session
Log Page, as described in "Voice Message/Sound Recording
Playback" on page 5-26.
9-4
Voice Recorder
Model 831 Technical Reference Manual
Model 831 Technical Reference Manual
Voice Recorder
9-5
9-6
Voice Recorder
Model 831 Technical Reference Manual
CHAPTER
10
Time History
This chapter describes the measurement features
associated with the optional data logging firmware 831LOG and 831-FST.
Metrics Logged
Using the Time History mode, the Model 831 can
automatically log a large number of metrics, or parameters,
both acoustic and non-acoustic, at equal time intervals.
Available Time Intervals
831-LOG
When the Model 831 has the optional firmware 831-LOG
enabled, the available range of intervals is from 20
milliseconds to 24 hours.
831-LOG and 831-FST
When the Model 831 has both the optional firmware 831LOG and 831-FST enabled, the available range of intervals
is from 2.5 milliseconds to 24 hours. For more detailed
information, see "Increased Time Resolution” on page 10-2.
Available Metrics
Interval
When the user-selected time interval is 00 milliseconds,
any or all of the metrics listed in the following sections will
be measured and stored for each time increment.
When the user-selected time interval is 50 milliseconds,
the only metrics which can be measured and stored are those
shown in bold in the following sections.
Model 831 Technical Reference Manual
Time History
10-1
Acoustical Metrics
Time Interval Values
These are integrated (Leq), maximum (Lpeak, LSmax, LFmax,
LImax) and minimum (LSmin, LFmin, LImin) values evaluated
for the time interval since the preceding sample. Separate
values are determined for A, C and Z frequency weightings.
LAeq, LApeak, LASmax, LAFmax, LAImax, LASmin, LAFmin,
LAImin
LCeq, LCpeak, LCSmax, LCFmax, LCImax, LCSmin, LCFmin,
LCImin
LZeq, LZpeak, LZSmax, LZFmax, LZImax, LZSmin, LZFmin,
LZImin
Instantaneous Values
These are continuously varying sound levels, based on Slow
(S), Fast (F) and Impulse (I) detectors and A, C and Z
frequency weighting, measured at the each time interval.
LAS, LAF, LAI
LCS, LCF, LCI
LZS, LZF, LZI
Specialized Acoustic Metrics
LAFTtm5: Taktmaximal 5 (utilized in Germany) using Aweighting and Fast detector. This also requires selection
from the Preferences page, "Takt Maximal Data” on
page 17-14. The definition is shown in "Taktmaximal-5" on
page D-21.
C-A weighted average level
Impulsivity (LAIeq-LAeq).
The optional firmware 831-IH is
required for these metrics to be
measured.
(LCeq-LAeq)
and
Ltwa1 and Ltwa2: time-weighted averages associated with
Dose 1 and Dose 2 exchange rates and thresholds. See
"Dosimeter 1 and 2” on page 8-6.
Increased Time Resolution
Tms Resolution
When the time history interval has been selected to be 500
ms or less, the user has the option of implementing increased
time resolution, which will cause the time value to be
10-2
Metrics Logged
Model 831 Technical Reference Manual
measured and saved with millisecond resolution. This is
described in more detail in the section "Select Time History
Metrics" on page 10-6.
1/1 and 1/3 Octave Spectra
The optional firmware 831-OB3 is
required for these metrics to be
measured.
When 1/1 and/or 1/3 octave analysis has been enabled in the
setup, Instantaneous Level, Leq, Lmax and Lmin for 1/1
and 1/3 octave frequency bands will also be measured.
The time history Lmax will be a Bin Max when the time
history period is less than 1 minute regardless of the Max
Spectrum setting being set for At Max.
Non-Acoustical Metrics
From Model 831
Battery Level
External Power
Internal Temperature
From 426A12 Outdoor Microphone System
426A12 Outdoor Microphone System
required.
Internal Temperature
Internal Humidity
From External Transducers via the 831-INT Interface Unit
Wind Speed
Wind Gust Speed
Wind Direction
ADC1: Average, Max and Min Levels
ADC2: Average, Max and Min Levels
Model 831 Technical Reference Manual
Metrics Logged
10-3
Time History Setup
Time History is setup using the Time History tab page of the
Measurement Setup View, as shown in Figure 10-1.
FIGURE 10-1 Time History Setup Menu
10-4
Time History Setup
Model 831 Technical Reference Manual
5
Press
key to enable the Time History functionality and
to place a check in the Enable Time History check box. This
will add additional items to the Time History setup menu, as
shown in FIGURE 10-2. Note that the default values for
these parameters are as shown in FIGURE 10-2.
FIGURE 10-2 Time History Setup Menu:
Enabled
Set Time History Period
To set the Time History Period, use the 2 key to highlight
the Period data field and press the
key to list all the
available values of time, as shown (partially) in Figure 10-3.
5
FIGURE 10-3 Time History Period Menu
The following values are available for selection as time
increment for the Time History:
Model 831 Technical Reference Manual
Time History Setup
10-5
Milliseconds
Note that the values 2.5 ms, 5 ms and
10 ms will only appear when the
optional firmware 831-FST has been
enabled. As you scroll downwards,
when the highlight reaches the
bottom of the window, the list will
scroll upwards to reveal additional
values.
2.5, 5, 10, 20, 50, 100, 200, 500
Seconds
1, 2, 5, 10, 15, 20, 30
Minutes
1, 2, 5, 10, 15, 20, 30
Hours
1, 24
Highlight the desired increment of time and press the
key to make the selection.
5
Interval Time Sync
The interval time sync feature ensures that all measurement
records, except the first, will begin at a time of day equal to a
multiple of the measurement time selected. For example, if
the measurement time is five minutes, and the measurement
begins at 08:14:00 (h:m:s format), the first measurement
will be cut short such that the subsequent measurements will
begin at 08:15, 08:20, 08:25, etc.
The setup to implement Interval Time
Sync for both Time History and
Measurement History is described in
the section "Interval Time Sync” on
page 11-2.
Linear Integration Only
When the time history interval has been selected to be 10 ms
or less, the integration method must be linear. If it is set to
exponential when the time interval is set to one of these
lower values, the message “Settings Conflict. Fix
Automatically?” will appear. Reply Yes to change to linear
and continue the setup process.
Select Time History Metrics
The metrics available for selection
are described in "Metrics Logged”
on page 10-1.
10-6
The Time History Options Menu is used to select, one-byone, the metrics to be measured for each time increment.
Highlight the Time History Options window and press the
key.
5
Time History Setup
Model 831 Technical Reference Manual
Time History Increment > 10 ms
When the time increment selected is > 10 ms, the list of
available metrics will appear as shown in Figure 10-4, with
the first item in the options list highlighted.
FIGURE 10-4 Time History Options Window:
Time Increment > 10 ms
Tms Resolution
When 20 ms Time Increment 500 ms has been selected,
the parameter Tms used to implement increased time
resolution will appear at the bottom of the options list shown
in FIGURE 10-4.
Note that spectrum metrics will only
appear in the list when 1/1 octave
and/or 1/3 octave have been
selected. See "OBA Bandwidth
Setting” on page 4-7 for details.
Highlight down or up, respectively, and use the 4 or 6 key
to select an option and place a check in the check box. Use
the same keys to deselect a box already checked.
Exiting Time History Options
When the options have been designated as desired, press the
key to exit from the Time History Options Menu. You
will then be able to display other pages of the Measurement
Setup Menu or exit from the Measurement Setup Menu by
pressing the center softkey labeled Close.
5
Model 831 Technical Reference Manual
Time History Setup
10-7
Time History Increment 10 ms
When the selected time increment is 10 ms, the time
history options window will appear as shown in FIGURE
10-5 .
FIGURE 10-5 Time History Options Window:
Time Increment 10 ms
When using such short time increments, the only parameters
which can be stored are time history and Leq spectra.
However, with this we can implement millisecond “display
action”,Tms, which will time stamp the data with
millisecond resolution.
To enable this feature, highlight the Time History Options
section, press the
key, highlight the Tms box and press
4 or 6 key to place a check mark and press the
key
once more.
5
5
When data is exported, the Tms data will appear in another
column, separate from the normal time stamp data, allowing
the use of Excel time and date formatting
10-8
Time History Setup
Model 831 Technical Reference Manual
Time History Display
Single Value Metrics
When the Model 831 is not equipped
with the optional firmware 831-OB3,
or if it is equipped with this option
but the measurement of 1/1 and 1/3
octave spectra has been set to Off in
the measurement setup, all measured
parameters will be single value
parameters.
In this section we discuss the time history graph which
appears for single value metrics such as sound levels and
non-acoustic parameters.
Time History data is displayed on the Time History tab page
of the Data Display View as shown in Figure 10-6.
Time History Graph
Date and time of
keypress beginning the
measurement
FIGURE 10-6 Time History Display: First Point; Keypress
Note that the graph scaling can be
modified as described in section
"Adjust Graph Scale” on page 5-27.
Model 831 Technical Reference Manual
When first entering the time history page, a time history
graph appears on-screen. This graph shows only 120 items
from the time history at one time. There is no zoom in or out
feature. Note that the cursor is located to the left of the graph
and that there is no data digitally displayed. The label Run
indicates that the cursor is not yet on a time point of the data
set.
Time History Display
10-9
Data Display at Cursor Position
Holding down the left or right arrow
keys will move the cursor faster as
the key is held down longer. Holding
the key accelerates movement
through the time history.
The 6 and 4 keys are used to move the cursor right or left,
respectively, in increments equal to the time history period.
Press the 6 key once to move the cursor to the location of
the first time interval of the time history.
Time History Graph:
Leq(x) where x is the time
history interval
Leq(x), calculated using
the
selected
time
interval,
at
cursor
position
Cursor
position,
in
multiples of time history
period
1st Time History
Parameter at cursor
position (LApeak in
this instance)
Total number of data
points measured
Date and time at
cursor position
FIGURE 10-7 Measured Data at Cursor Position, First Parameter
Left/Right Arrow Keys
For the display shown in FIGURE 10-7, the 4 and 6 keys
have dual roles as listed below. Use the 5 key to toggle
between them:
•
Change Record
•
Change Metrics (Measurement Parameters)
At any time, the role of the left and right arrow keys, as well
as the means to change it, are indicated in the lower portion
of the display, as shown in FIGURE 10-8.
10-10
Time History Display Model 831 Technical Reference Manual
Left and Right Arrow keys
Change Records
Left and Right Arrow keys
Change Metrics
5
5
Switch role of left/right arrow keys Switch role of left/right arrow keys
from
“Change
Records”
to from “Change Metrics” to “Change
Records”
“Change Metrics”
FIGURE 10-8 Role of Left/Right Arrow Keys: Time History Display
Locate Record Number
To jump to a specific record number, rather than step
through the range of record numbers using the cursor, utilize
the Locate Record Number feature, described in "Locate
Record Number" on page 10-16
The time history graphs for Leq(x) and the selected time
history parameter are overlaid on the display.
Change Metrics
As explained in section "Metrics Logged” on page 10-1, the
user can select to log up to sixteen different parameters, or
metrics, as a function of time, setup as described in section
"Select Time History Metrics” on page 10-6. The default
value is the first parameter selected during the setup
procedure.
When repeatedly pressing the 6 key, the logged metric
values will be displayed in the same sequence as they
appeared in the list when selected, as described in "Select
Time History Metrics” on page 10-6.
Model 831 Technical Reference Manual
Time History Display
10-11
By pressing the 6 and 4 keys, the value displayed can be
shifted to represent a metric one later or earlier, respectively,
in sequence in the user-created list of metrics to log.
For example, in FIGURE 10-9 we have pressed the 6 key to
select LASmax, the next metric in the selection sequence, at
the same cursor position used to graph and display Leq in
FIGURE 10-7.
Selected
Parameter
Display, LApeak
Time History Graph:
Leq(x) where x is the time
history interval
Selected Metric
FIGURE 10-9 Time History Graph and Value of LASmax at Same Time
Frequency Spectra
When the Model 831 is equipped
with the optional firmware 831-OB3
and either the 1/1 octave spectra or
the 1/3 octave spectra, or both, have
been selected for the measurement,
then frequency spectra will appear
in the list of metrics which can be
logged.
10-12
When frequency spectra have been included in the list of
metrics to be measured in the setup, as described in "1/1 and
1/3 Octave Spectra” on page 10-3, there will be additional
displays as follows:
•
One additional display if all frequency spectra
metrics are either 1/1 or 1/3 octave spectra. Press the
2 key to show the spectrum display as shown in
FIGURE 10-10.
•
Two additional displays if frequency spectra metrics
include both 1/1 and 1/3 octave spectra. Press the 2
key once to display metrics having the 1/1 octave
format and press it a second time to display metrics
having the 1/3 octave format
Time History Display Model 831 Technical Reference Manual
Except for the bandwidth, these displays are identical, so we
will use a 1/1octave spectrum as an example.
Cursor Position
Frequency
at
Cursor Position
Leq, Lmax and Lmin
Values at Cursor Position
Data and time at
cursor position
Total Number of Records
Measured
Record Number at
Cursor Position
FIGURE 10-10 Time History Display: Spectra Metrics, Section 2 and 3
Left/Right Arrow Keys
For the display shown in FIGURE 10-10, the 4 and 6 keys
have dual roles as listed below. Use the 5 key to toggle
between them:
•
Change Record:
•
Change Frequency
At any time, the role of the left and right arrow keys, as well
as the means to change it, are indicated by the icon
in the lower portion of the display, as shown in FIGURE 1011.
Model 831 Technical Reference Manual
Time History Display
10-13
Left and Right Arrow keys
Change Record
Left and Right Arrow keys
Change Frequency
5
5
Switch role of left/right arrow keys
from “Change Record” to “Change
Frequency”
Switch role of left/right arrow keys
from “Change Frequency” to
“Change Record”
FIGURE 10-11 Role of Left/Right Arrow Keys: Frequency Spectra Display
Frequency Band Time History
From the frequency spectra display, press the 2 key to
obtain the Frequency Band Time History display shown in
FIGURE 10-12
FIGURE 10-12 Frequency Band Time History Display
10-14
Time History Display Model 831 Technical Reference Manual
In this display, the time history of the LZeq level is shown at
1.00 kHz, the frequency of the cursor position used in
frequency spectrum display shown in FIGURE 10-10 when
changing to this display. Use the 4 and 6 keys to change the
record number (time value).
Left/Right Arrow Keys
For the display shown in FIGURE 10-12, the 4 and 6 keys
can have several roles as listed below. Use the 5 key to
toggle between them:
•
Change Record
•
Change Frequency
•
Change Metrics (Measurement Parameters)
At any time, the role of the left and right arrow keys, as well
as the means to change it, are indicated in the lower portion
of the display, as shown in.FIGURE 10-13.
Left and Right Arrow keys Left and Right Arrow keys
Change Record
Change Frequency
5
Left and Right Arrow keys
Change Metrics
5
5
Switch role of left/right
arrow
keys
from
“Change Record” to
“Change Frequency”
Switch role of left/right arrow keys
from “Change Frequency” to
“Change Metrics”
Switch role of left/right
arrow keys from “Change
Metrics”
to
“Change
Record”
FIGURE 10-13 Role of Left/Right Arrow Keys: Frequency Band Time History
Model 831 Technical Reference Manual
Time History Display
10-15
Locate Record Number
To rapidly change the record number, rather than use the
cursor to step through the range of records, press the Menu
softkey which will produce the display shown in FIGURE
10-17.
FIGURE 10-14 Locate Record Number
Highlight Locate and press the 5 key to open the Locate
Record Menu, shown in FIGURE 10-15.
Jump Back Ten Records
Jump Ahead Ten Records
FIGURE 10-15 Locate Record Menu
Jump to First or Last Record
To jump to the first or last of the record numbers, highlight
First or Last, respectively, and press the 5 key.
Jump 10 Records Back or Ahead
To jump back or ahead ten records, highlight Record
Number and press the left or right softkey, respectively, as
indicated in FIGURE 10-15.
10-16
Locate Record Number Model 831 Technical Reference Manual
Locate a Specific Record
To locate a specific record, highlight the Record Number
field and press the 5 key to add a cursor to the Record
Number field, as shown in FIGURE 10-16.
FIGURE 10-16 Record Number Cursor
Enter the desired record number using the 4 and 6 keys to
move the cursor and the 8 and 2 keys to change the
digits, then press the 5 key to change the display to that
record number.
Link to Measurement History Display
The major purpose of the Link to Measurement History is to
locate the Measurement History record that applies to the
same point in time as the current time history record. The
inverse is also true; from the Measurement history you can
Link to Time history, which will locate the Time History
record with the time nearest the Measurement Time History.
To rapidly switch from a Time History display to a
Measurement History display, press the Menu softkey which
will produce the display shown in FIGURE 10-17.
FIGURE 10-17 Link to Measurement History
Highlight Link-Measurement History and press the
key.
Model 831 Technical Reference Manual
Link to Measurement History Display
5
10-17
Markers
Markers are used to annotate portions of the time history,
especially for the purpose of identifying sound sources as
they become dominant in the measurement. The Model 831
offers ten separate user-definable markers.
Markers Setup
Note that the default values for these
parameters are as shown in
FIGURE 10-18.
Markers are setup using the Markers tab page of the
Measurement Setup View, as shown in Figure 10-18.
FIGURE 10-18 Markers Setup Window,
Markers 1 - 5
There are five markers with names predefined for
convenience shown in this figure. Any of these names can
be changed by the user. To view markers 6 -10, highlight the
6 - 10 text line and radio buttons and press the
key to
obtain the display shown in Figure 10-19.
5
10-18
Markers
Model 831 Technical Reference Manual
FIGURE 10-19 Markers Setup Window,
Markers 6 - 10
Naming a Marker
The process of naming markers is
simplified by using the 831 Utility
software.
Highlight the field of the marker to be named and press the
5 key. This will produce a cursor which can be moved
left and right to different digit positions in the data field
using the 4 and 6 keys, as shown in Figure 10-20.
FIGURE 10-20 Marker Name Field
Enter a marker name and press the
process.
5 key to conclude the
Record with a Marker
The Record check box is available when the optional
firmware 831-SR has been enabled. This will permit a sound
recording snapshot to be made whenever the associated
marker is activated. See "Marker Initiated Recording” on
page 15-10 for more details.
Model 831 Technical Reference Manual
Markers
10-19
Using Markers
The Time History page of the Data Display View is used to
display the data, as shown in FIGURE 10-6 “Time History
Display: First Point; Keypress" .
After the measurement is begun, press the Menu key to
bring up the display shown in Figure 10-21.
FIGURE 10-21 Menu Options
Mark Sound Type is also available
from the Live Profile and the
Session Log display menus
5
Highlight Mark Sound Type and press the
key, which
will bring up the Mark Sound Type dialog box as shown in
Figure 10-22.
FIGURE 10-22 Time History Display
with Markers
Setting Markers On/Off
At any time during a measurement, any of the markers can
be set On or Off. The best way to enable or disable a marker
is to press the
key. The 4 and 6 keys will turn the
marker On/Off as well.
5
10-20
Markers
Model 831 Technical Reference Manual
Setting All Markers Off
To set all markers to Off, press the right softkey labeled
None.
Close Marker Control Window
Press the center softkey labeled Close to close the marker
control window and return the display to the standard Time
History display.
Markers on Time History Display
When any type of marker has been active during a time
history measurement, this will be indicated by a solid
horizontal line at the top of the screen as shown in "Marker
Indication on Time History Display" on page 10-21.
Marker Indicator
FIGURE 10-23 Marker Indication on
Time History Display
The 831 Utility software provided with the Model 831 will
show the names of the markers along with the time history
data when the data is exported. See the 831 Utility User
Manual for details.
Model 831 Technical Reference Manual
Markers
10-21
10-22
Markers
Model 831 Technical Reference Manual
CHAPTER
11
Measurement History
Measurement History is used to perform a sequence of
measurements using the same setup, either manually or
automatically, which provide the same data as is obtained
from the basic measurement, described in Chapter 5 "Basic
Data Display” on page 5-1. The optional firmware 831-ELA
must be enabled to obtain the measurement history
capability. This chapter presents a detailed description of the
setup and use of the Measurement History feature and the
data displays which it provides.
Run Control with Measurement History
It is recommended that the user
become familiar with the setup of
Run Modes, described in Chapter 6
"Run Control” on page 6-1, before
beginning to work with the
Measurement History.
Measurement History is implemented from the Control Page
of the Measurement Settings Screen by placing a check in
the “Enable Measurement History” check box. When the
Run Mode has been set to Continuous, this will produce a
display as shown in FIGURE 11-1
FIGURE 11-1 Measurement History Setup
Model 831 Manual
Measurement History
11-1
Continuous and Timer Modes
For these run modes, when the Measurement History is
enabled, a series of measurements will be performed and
stored automatically, each running for a user-defined time
interval. At the time the check mark is placed in the
Measurement History check box to enable it, a window such
as shown in Figure 11-2, will appear to define a time
duration for each measurement.
FIGURE 11-2 Measurement Time Menu
Note that the actual measurement
duration may be shorter due to a
manual stop, a timer stop or an
autostore action.
5
Highlight the Time data field and press the
key. Enter
the desired value of time and press the
key to conclude
the process.The minimum permitted Interval Time is one
minute; if a zero value is entered, the following message will
appear.
5
Interval Time Sync
The interval time sync feature ensures that all measurement
records, except the first, will begin at a time of day equal to a
multiple of the measurement time selected. For example, if
the measurement time is five minutes, and the measurement
begins at 08:14:00 (h:m:s format), the first measurement
will be cut short such that the subsequent measurements will
begin at 08:15, 08:20, 08:25, etc.
11-2
Continuous and Timer Modes
Model 831 Technical Reference Manual
Valid Measurement Times
When other values are selected, the
interval time sync will still function,
but the time for which the first
measurement is cut short will be
different. See "Other Measurement
Times" below for further detail.
The interval time sync function is intended to be used with
the following measurement time values:
•
1, 5, 10, 20 or 30 minutes
•
1 hour
When the interval time sync function is used, each hour is
divided into a number of equal time segments, based on the
number of time intervals contained within one hour. For
example, when the time interval is five minutes, there will
be twelve segments within any one hour period beginning at
xx:00:00, xx:05:00, xx:10:00, etc.
The instrument will begin the first measurement when the 3
(Run/Pause) key is pressed. Regardless of the start time,
when the clock of each instrument reaches the time
corresponding to the beginning of the next segment, the
measurement in progress will be stopped and stored, and a
new measurement will be started.
Other Measurement Times
When values of measurement other than those listed above
are used, the clock time at which the first measurement is cut
short is based solely on the units of the measurement time;
seconds, minutes or hours. For example, suppose the
measurement time is set to three minutes. Based on the unit
of minutes, the time intervals per hour are xx:00:00,
xx:01:00, xx:02:00, etc. If the measurement were begun at
08:14:23, the first measurement would be cut short at the
next measurement interval, so subsequent measurements
would be started at 08:15:00, 08:18:00, 08:21:00, etc.
Timed Stop Mode
The Time Stop Mode with Measurement History has a
feature not included for the other run modes; the ability to
automatically measure and store a user-defined number of
records, then stop. Subsequent runs, each manually initiated,
will produce the same number of stored measurements.
Model 831 Technical Reference Manual
Timed Stop Mode
11-3
Measurement Counter
When the Time is set to one minute or more for the Time
Stop Mode, the Measurement Counter field will appear as
shown in Figure 11-3.
FIGURE 11-3 Measurement Counter
Measurement Counter is used to set the number of
measurements to be made during each manually initiated
measurement sequence.
Note that the measurement counter
will be set to one and the selection
field disabled when the measurement
time has been set to less than one
minute.
To enter the a value into the Measurement Counter field,
time, highlight the Measurement Counter data field and
press the
key. Enter the desired value and press the
key to conclude the process.
5
5
Example
The Continuous Mode, described in
"Continuous and Timer Modes" on
page 11-2, can be used to make an
automatic
Time
History
Measurement of a number of
records, but the measurement
process would need to be stopped
manually when the desired number
of records have been measured.
An example of the use of this would be when the user wishes
to make a fixed number of separate measurements, each for
the same run time, then stop. By setting the measurement
counter to 4, for example, pressing the 9 (Run/Pause)
key would initiate a measurement sequence which would
conclude when four measurements have been completed,
each using the value of Run Time set as described in
"Manual Stop, Timed Stop or Stop When Stable" on page 64.
This data is displayed on the Measurement History tab page,
as described in "Measurement Page" on page 11-7, and can
be saved by pressing the 7 key.
11-4
Timed Stop Mode
Model 831 Technical Reference Manual
Manual and Stop When Stable Modes
For these run modes, the
Measurement History does not
automate the measurement and
storage of data as it does for the
Continuous, Single Block Timer and
Daily Timer modes. However, it does
simplify the number of key presses
required when making multiple
measurements.
Model 831 Technical Reference Manual
For these run modes, at the conclusion of a measurement,
the data must be manually saved. Checking the “Enable
Measurement History” checkbox does not add additional
parameter fields to the display as it does with Continuous,
Single Block Timer and Daily Timer modes.
With the Measurement History enabled, sequentially
pressing the 7 (Stop) and 9 (Run/Pause) keys will store
the measurement and initiate another measurement,
eliminating the need to perform a separate data store
operation.
Manual and Stop When Stable Modes
11-5
Display of Measurement History Data
Note that the ANY LEVEL display of
sound levels measured using all
combinations of frequency weighting
and time averaging can also be
accessed from both the Current Page
and the Measurement Page. See
"Any Level Display" on page 5-40.
There are two pages in the Data Display View which are
used to display the data measured with the Measurement
History; the Current Page and the Measurement Page. These
pages are located to the right of the Session Log Page.
Current Page
When the first measurement is in progress, the data will
appear on the Current Page, the first section of which is
shown in FIGURE 11-4.
Leq using Frequency Weighting
and Detector from Setup
User-selected
Sound
Level Parameter
FIGURE 11-4 Time History Display: Current Page, Section 1
When that measurement is complete, its data will then be
available for display on the Measurement Page. The Current
Page is then reset and begins displaying data for the next
measurement in progress. As a result, at any time the
Current Page displays the measurement in progress.
The Current page can display as many as fourteen different
data displays depending on the firmware options enabled
and the setup used. Use the 8 and 2 keys to page
sequentially through these different data displays. With the
exception of the first display, these displays are similar to
those displayed on the Measurement Page as described in
the next section. The main difference is that there is no
reference to a record number.
11-6
Display of Measurement History Data Model 831 Technical Reference Man-
In the first display, shown in FIGURE 11-4, the 1st
numerical value displayed is Leq using the frequency
weighting and detector from the setup. The 2nd numerical
value displayed, LAF in this example, is a user-selected
parameter. This parameter is selected the same as for the
Live SLM Display, described in "User-Selected SLM
Parameter" on page 5-3.
Measurement Page
The Measurement Page can display data for any one of the
previously completed measurements. These measurement
records are numbered in sequence from the first to the last.
The data displayed in the first section of the Measurement
Page is shown in Figure 11-5.
Selected Measurement History
Record Number (Cursor Position)
Number of Records
Measured
Measurement
Duration
Date and Time
of Measurement
Graph of Leq Values for each
Record, in sequence by time
Leq and Max Values at
Cursor Position
FIGURE 11-5 Measurement Record Display: Measurement Page, Section One
During the first measurement, the
same data will appear on the Overall
Page and Current Pages. After that,
the overall measurement will
continue
while
new
current
measurements will be made as the
measurement sequence proceeds.
Model 831 Technical Reference Manual
Figure 11-5 shows the first, or section one, data display
appearing on the Measurement Page. There are as many as
fifteen different data displays which might appear on that
page, as shown in Figure 11-6 on page 11-10, depending on
the firmware options enabled and the setup used. Use the
8 and 2 keys to page sequentially through these
different data displays. TABLE 11-1 lists these displays by
name and indicates the position of that display in FIGURE
11-6.
Display of Measurement History Data
11-7
Section
Display Type
Location in
FIGURE 11-6
Comments
1
Measurement Record Display Row 1
Column 1
See Figure 11-5 for detailed view.
2
Large Digit Display
3
Records Profile Display with Row 1
Leq, LSmax and LSmin
Column 3
4
Max, Min and Peak Levels
Row 1
Column 4
5
1/1 Octave Spectrum
Row 1
Column 4
Option 831-OB3 Required
6
1/3 Octave Spectrum
Row 2
Column 1
Option 831-OB3 Required
7
Ln Percentiles
Row 2
Column 2
If the user were to manually change
the Ln values to be displayed during a
measurement, as described in
"Modifying Ln Values During a Measurement” on page 4-9, it should be
noted that the Ln data presented for
each record will correspond to the values selected at the time that record
ends.
8
Spectral Ln
Row 2
Column 3
Option 831-OB3 Required
9
Exceedances
Row 2
Column 4
Option 831-ELA Required
10
Overloads
Row 2
Column 5
11
Equivalent Levels
Row 3
Column 1
See Figure 11-8.
12
Sound Exposure
Row 3
Column 2
Option 831-IH Required
13
Dose 1
Row 3
Column 3
Option 831-IH Required
14
Dose 2
Row 3
Column 4
Option 831-IH Required
Row 1
Column 2
See Figure 11-7 for detailed view
TABLE 11-1Examples of Displays on Measurement Page
11-8
Display of Measurement History Data Model 831 Technical Reference Man-
Section
Display Type
Location in
FIGURE 11-6
Comments
15
GPS
Row 3
Column 5
Option 831-GPS Required
16
Weather
Row 4
Column 1
Option 831-WTHR Required
TABLE 11-1Examples of Displays on Measurement Page
Model 831 Technical Reference Manual
Display of Measurement History Data
11-9
FIGURE 11-6 Measurement History Displays
11-10
Display of Measurement History Data Model 831 Technical Reference Man-
Record Profile Display
Note that there is no cursor on this
graph nor a numerical display of
amplitude or time.
The third section on the Measurement Page presents a
Profile (Level versus Time) for the selected measurement
record, as shown in FIGURE 11-7
Level versus Time Graph
for the Selected Record
Leq
and
Maximum
and
Minimum Levels for the Selected
Measurement Record
Selected Record Number
FIGURE 11-7 Profile Display: Measurement Page, Section 2
Equivalent Level Display
The Equivalent Level Display, shown in Figure 11-8, is a
condensed version of the Community Noise display shown
in Figure 5-22; the Lden and Ldn data do not appear in this
display.
FIGURE 11-8 Equivalent Levels:
Measurement Page, Section 10
Changing Displayed Record
For the Measurement Record Display, shown in Figure 11-5
on page 11-7, the selected record number for which data is
being displayed in indicated at the upper right. For all other
displays, the selected record number is indicated below the
graph as shown in Figure 11-7 on page 11-11.
Model 831 Technical Reference Manual
Display of Measurement History Data
11-11
Non-Specta Displays
With the exception of frequency spectra displays, the 6 and
4 keys are used to step the selected measurement record
number up or down, respectively.
Frequency Spectra Displays
When a frequency spectrum is displayed, the 6 and 4 keys
are used to move the cursor to the right and left, respectively,
so that the levels can be displayed for different frequency
bands. To change the displayed record, shift to a nonspectrum display to make the change then return to the
frequency spectrum display.
Storing a Measurement History
Although the measurement history data can be displayed
during a measurement and after it has been stopped, the data
has not been stored to memory. To store the data, press the
7 (Stop/Store) key.
Link to Time History
When Time History has also been enabled, a link is provided
to make a rapid transition from any of the Measurement
History displays to the same point in time of the Time
History display. To implement this link, press the Menu
softkey which will produce the display shown in FIGURE
11-9.
FIGURE 11-9 Link to Time History Display
Highlight Link-Time History and press the 5 key to obtain
the display shown in FIGURE 11-10.
11-12
Storing a Measurement History
Model 831 Technical Reference Manual
FIGURE 11-10 Time History Display
Model 831 Technical Reference Manual
Link to Time History
11-13
11-14
Link to Time History
Model 831 Technical Reference Manual
CHAPTER
12
Event History
The optional firmware module 831-ELA is required in
order to measure and store the metrics associated with
exceedance events.
Level Based Events
It is recommended that the section
‘Triggers Page” on page 4-11 be
read prior to working with the Event
History module.
An event of this type is initiated when the measured sound
level (SPL or Peak) exceeds one of the user-defined
threshold levels.
Basic Measurement Data
When the basic measurement capability of the Model 831 is
utilized, as described in the section ‘Triggering” on page 57, only a very limited set of data are saved for each of the
five threshold levels:
•
The number of exceedances for each threshold level.
•
The sum total of the time the measured level was above
each threshold.
Event History Data
The Event History provides a detailed record for each noise
event including metrics such as:
Model 831 Technical Reference Manual
•
Date and time
•
Duration
•
Equivalent level (Leq)
•
Maximum RMS and Peak levels
•
1/1 or 1/3 Octave Leq and max spectra (optional 831OB3 firmware required)
Event History
12-1
Event History Setup
The Event History is setup using the Event History tab page
in the Measurement Settings Screen. If this is not already
enabled, there will be nothing except an unchecked Event
History check box.
Note that the default values for these
parameters are as shown in
FIGURE 12-1.
5
Press the
key to place a check mark in the Event
History check box and to enable the Event History. This will
change the display to that shown in Figure 12-1.
FIGURE 12-1 Event History Setup
Minimum Duration
Note that shorter duration noise
events will still be counted as part of
the basic measurement described in
‘Triggers Page” on page 4-11, even
though Event History data are not
stored for them.
In situations where only noise events lasting longer than a
certain time interval are of interest, the user can select a
minimum duration requirement for the storage of noise
events data. To set the minimum duration, highlight the
Minimum Duration data field and press the
key. Enter
the desired values and press the
key.
5
5
Note that the maximum permitted value of Minimum
Duration is 9.9 seconds.
Continuation Period
Since each noise event is initiated when the sound level
(SPL or Peak) exceeds a threshold level, one might define
the end of the sound event at the instant both the SLM and
12-2
Event History Setup
Model 831 Technical Reference Manual
Peak levels drop below their threshold values. However,
there may be situations where the sound level drops below
the threshold for a short period of time before rising above it
again, in which case the user may prefer to consider this a
continuation of the event rather than the conclusion of the
event and the beginning of another. This possibility is
included by providing a user-defined Continuation Period.
Beginning when the levels both drop below their thresholds,
if neither level rises above its respective threshold over a
time interval equal to the continuation period, the noise
event is considered complete. If, however, there is an
exceedance of a threshold during the continuation period,
the event is considered to be continued as if there had been
no level drop below a threshold.
To set the Continuation Period, highlight the Continuation
Period data field and press the
key. Enter the desired
value and press the
key.
5
5
Trigger Method
There are two Trigger Methods provided.
Model 831 Technical Reference Manual
•
Level: in which an event is triggered when the measured
sound level exceeds user-defined trigger levels.
•
Dynamic: in which a single trigger level is utilized
which tracks the background noise level.
Trigger Method
12-3
Level Trigger Method
In the section ‘Triggers Page” on page 4-11, it is explained
how the Triggers Menu, shown in Figure 12-2, is used to set
the parameters defining exceedance events.
FIGURE 12-2 Triggers Menu
An exceedance event for which Event History data is
measured and stored is initiated when either of the following
occur:
•
The SPL level (Fast, Slow or Impulse detector) exceeds
the user-defined SPL 1 level
•
The Peak level (Peak detector) exceeds the user-defined
Peak 1 level
When the SPL level also exceeds the SPL 2 level, this is
noted in the Events display of the Overall Page, as shown in
FIGURE 5-20 "Exceedances: Overall Page Section 8” on
page 5-20.
When the Peak level also exceeds the Peak 2 level or the
Peak 3 level (which should be higher than the Peak 2 level),
this is noted in the Events display of the Overall Page, as
shown in FIGURE 5-20 "Exceedances: Overall Page
Section 8” on page 5-20.
12-4
Trigger Method
Model 831 Technical Reference Manual
To select the Level Trigger Method, highlight the Trigger
Method field and press the
key to open the Trigger
Method menu, shown inFIGURE 12-3.
5
FIGURE 12-3 Trigger Method Menu
Highlight Level and press the
selection.
5 key to implement the
Dynamic Trigger Method
Dynamic triggering is a technique in which event triggering
tracks the background level. This is implemented by making
the event trigger levels equal to the background level plus an
offset. The following example illustrates the value of this
feature.
Barking Dog Example
During the day the sound of a barking dog may be masked
by background noises such as passing cars, lawn mowers,
etc. whereas during the night, when the background noise is
lower, this would more likely be perceived as an annoyance.
Fixed Level Trigger
When performing unattended noise monitoring on a 24-hour
basis using a fixed trigger level which is appropriate for
capturing the higher level events, the dog barks would be
missed since they are below the trigger level, as shown in
FIGURE 12-4.
Model 831 Technical Reference Manual
Trigger Method
12-5
Noise Events Captured
Fixed Trigger Level
Dog Bark
Captured
Events
Not
FIGURE 12-4 Fixed Level Trigger; Lower Level Events Missed
Dynamic Trigger
Using the dynamic trigger method, we can select to track the
L90 level (background noise) and trigger a noise event when
the measured level exceeds the L90 level plus an offset,
which in this example we set to 15 dB. This permits the
capture of lower level noise events which occur during
periods of low background noise, as shown in FIGURE 125.
12-6
Trigger Method
Model 831 Technical Reference Manual
Dynamic Trigger
L90 + 15 dB
Level:
FIGURE 12-5 Dynamic Trigger: Lower Level Events Captured During
Low Background Noise Periods
To select the Dynamic Trigger Method, highlight the Trigger
Method field and press the
key to open the Trigger
Method menu, shown in FIGURE 12-6
5
FIGURE 12-6 Trigger Method Menu
Highlight Dynamic and press the
selection.
Model 831 Technical Reference Manual
Trigger Method
5 key to implement the
12-7
Dynamic Trigger Parameters
After selecting the Dynamic Trigger Method, it is necessary
to return to the Triggers Page, shown in FIGURE 12-7, by
pressing the left softkey
Dynamic Trigger
Parameters
FIGURE 12-7 Triggers Menu: Dynamic Triggering
The Triggers Page now includes the dynamic triggering
parameter fields Dynamic Trigger and Dynamic Response,
which did not appear when Level Triggering had been
selected, as seen in FIGURE 12-2.
When dynamic triggering is used, an event will be initiated
when the measured sound level exceeds the Dynamic
Trigger Offset plus the background level and it will conclude
when the level drops below the Dynamic Trigger Offset plus
the background level.
Dynamic Trigger Offset
To set the Dynamic Trigger Offset, highlight the Dynamic
Trigger Offset data field and press the 5 key.
Enter the desired values and press the 5 key.
Dynamic Response
The background sound level used with dynamic triggering is
a user-selected Ln level, calculated using an algorithm
which includes the rise rate in dB per minute. There are five
12-8
Trigger Method
Model 831 Technical Reference Manual
options available, having the characteristics presented in
TABLE 12-1.
Setting
Number
Tracking Ln
Percentile
Rise Rate, dB/
minute
Description
1
95%
0.5
Lower Tracking Level
2
90%
1/3
Slower
3
90%
0.5
Default, Normal Operation
4
90%
1
Faster
5
85%
1
Faster and Higher Tracking Level
TABLE 12-1 Dynamic Response: Dynamic Triggering
To set the Dynamic Response, highlight the Dynamic
Response data field and press the
key. Set the digit to a
value between 1 and 5 and press the
key.
5
5
Dynamic Trigger Example
Suppose the dynamic trigger was set with the following
parameters:
Dynamic Trigger Offset: 20 dB
Dynamic Response: 3 (Tracking Ln Percentile = 90% and
Rise Rate = 0.5 dB/minute)
Further, suppose that when the measurement is first begun,
the calculated value of L90 is 40 dB. In this situation, the
event trigger level would then be 40 + 20 = 60 dB.
If the background noise were to increase such that Ln = 50
dB, the event trigger level would then be 50 + 20 = 70 dB.
The limitation to this increase in the event trigger level
would be that the rate of increase in the value of Ln used to
determine the event trigger level would be limited to a
maximum of 0.5 dB/second. Thus, a rapid change in the
value of calculated Ln of say several dB would not produce
an immediate change in the event trigger level.
Model 831 Technical Reference Manual
Trigger Method
12-9
Event Time History Setup
When Event Time History has been enabled, time history
data will be measured as a part of each event history.
Note that the default values for these
parameters are as shown in
FIGURE 12-8.
Highlight the Event Time History check box and press the
5 key to enable it and place a check in the check box.
This will produce the Event Time History Setup menu
shown in FIGURE 12-8.
FIGURE 12-8 Event Time History Setup Menu
Period
Period defines the time period of each time history sample,
which is the inverse of the sample rate. Highlight the Period
data field and press the
key to obtain the Period menu,
shown in FIGURE 12-9.
5
FIGURE 12-9 Event Time History Period Menu
The available choices are as follows:
12-10
Event Time History Setup
Model 831 Technical Reference Manual
Milliseconds
20, 50, 100, 200, 500
Seconds
1, 2, 5, 10
Highlight the desired Period value and press the
make a selection.
5 key to
Spectral Mode
A Spectral Time History can be measured for each event by
setting Spectral Mode to On. The bandwidth of the Spectral
Time History is either 1/1 or 1/3 octave, depending on the
OBA bandwidth selected, as shown below.
•
1/1 Octave: Spectral Mode is 1/1 Octave
•
1/3 Octave or 1/1, 1/3 Octave: Spectral Mode is 1/3
Octave
5
Highlight the Spectral Mode data field and press the
key to obtain the Spectral Mode menu, shown in FIGURE
12-10.
FIGURE 12-10 Event Time History
Spectral Mode Menu
5
Highlight On or Off and press the
key to make a
selection. Setting the spectral mode Off will reduce the
memory used for data storage.
Pre/Post Trigger
Pre-trigger is used when it is desired that the event time
history include samples which occurred prior to the event
threshold exceedance triggering the event and post-trigger is
used when it is desired that the event time history include
samples which occurred after the end of the event. Both can
be enabled at the same time.
Model 831 Technical Reference Manual
Event Time History Setup
12-11
Pre-trigger
To set the number of pre-trigger samples, highlight the Pretrigger data field and press the
key. Enter the desired
value and press the
key.
5
5
Post-trigger
To set the number of post-trigger samples, highlight the
Post-trigger data field and press the
key. Enter the
desired value and press the
key.
5
5
Maximum Number of Samples
To limit the amount of memory used by event time histories,
the user can specify the maximum number of samples to be
measured for each event. The permitted range for this
parameter is 10 to 9,999, with the default value being 1,000.
This does not include pre-trigger samples, so the actual
number of samples stored will equal the maximum number
of samples plus the number of pre-trigger samples.
12-12
Event Time History Setup
Model 831 Technical Reference Manual
Event History Display
Event History data are displayed on the Events tab page of
the Data Display View. There can be as many as six different
sections to the Event History Display, depending upon the
instrument setup. Use the 2 and 8 keys to page downwards
or upwards, respectively, through these displays. The first
section is the Event Trigger Status Display, shown in
FIGURE 12-11.
Grey Bar Indicates Triggered
< Minimum Duration
Sound Recording in
Progress Icon
Black Bar Indicates Valid
Event
Level for Current
Frequency Weighting
and Detector used for
Triggering
Trigger Status Icon
Live Event Level
Trigger Level; Fixed
or Dynamic
Indicates Triggered
FIGURE 12-11 Event Trigger Status Display, Section 1
Model 831 Technical Reference Manual
Event History Display
12-13
Trigger Status Icons
The Model 831 begins sampling data as soon as the 9
(Run/Pause) key is pressed. The trigger status is indicated by
one of five Trigger Status icons as described below.
Pre-Trigger
Pre-trigger is being collected but there are fewer samples
than the pre-trigger samples setting. When enough samples
have been collected the Ready state is activated. It is
possible to transition to the Triggered state before the pretrigger buffer is full.
Ready
The Ready state has all the pre-trigger samples needed and is
waiting for an event to occur.
Triggered
When the level exceeds the trigger level the triggered state is
entered.
Valid
When the level has exceeded the trigger level for longer than
the minimum duration the Valid state is entered. At this
point we have a valid event record.
12-14
Event History Display
Model 831 Technical Reference Manual
Continuation
When the level no longer exceeds the trigger level we enter
the Cont? state where we wait for the continuation time in
preparation to end the event. We continue processing event
data and transition back to the Valid state if the level exceeds
the trigger level during the continuation time.
Typical Icon Sequence
In a typical measurement, these icons will appear
sequentially in the order presented above as the event
measurement proceeds from the period prior to an event to
the conclusion of the event.
dB
Minimum
Duration
Pre-Trigger
Time
TIME
Run
Threshold Exceedance
Drops Below Threshold
FIGURE 12-12 Typical Icon Sequence
Sound Recording in Progress
When automatic event sound recording has been enabled, as
described in "Event Sound Recording" on page 15-15, the
Sound Recording in Progress icon will be illuminated
whenever a sound recording is being made. This icon is
greyed out when no recording is taking place.
Model 831 Technical Reference Manual
Event History Display
12-15
Levels Display
The second section is the Levels Display, which is shown in
Figure 12-13.
Record Being Displayed
Number of Records Stored
Use Left and Right Arrow
Keys to Change Event
Record
Duration of Displayed
Event
Leq of Displayed Event
Peak and
Levels for
Record
Date and Time
Displayed Event
Maximum
Displayed
of
Sound Exposure Level and Sound
Exposure for Displayed Record
FIGURE 12-13 Event History: Levels Display, Section 2
Changing the Displayed Event Record
Event history records are stored sequentially in time,
beginning with record 1. The Levels Display shown above
presents data for the 1st of 4 events. Use the 4 and 6 keys to
page backward or forward, respectively, through the stored
records.
12-16
Event History Display
Model 831 Technical Reference Manual
1/1 Octave Spectrum Display
With all possibilities included, the 3nd display would be a
1/1 octave spectrum for the displayed event, as shown in
FIGURE 12-14
Frequency and Levels (Leq
and Lmax) at Cursor
Position
Cursor Position
1/1 Octave Spectrum Graph
Event Being Displayed
Number
Measured
of
Events
FIGURE 12-14 Event History: 1/1 Octave Display, Section 3
Left/Right Arrow Keys
For the display shown in FIGURE 12-14, the 4 and 6 arrow
keys can serve three different purposes as listed below. Use
the
key to toggle between them:
5
•
Change Frequency
•
Toggle between display of LZSmax and LAE
•
Change Event
At any time, the role of the left and right arrow keys is
indicated by the left/right arrow icon
5
and the action of the
key to change their role is
indicated in the lower portions of the display, as shown in
FIGURE 12-15.
Model 831 Technical Reference Manual
Event History Display
12-17
Left and Right Arrow keys Left and Right Arrow keys
Change Frequency
Toggle Between Display of
LZSmax and LAE
5
Left and Right Arrow keys
Change Event
5
5
Switch role of left/right
arrow
keys
from
“Change Frequency” to
“Change Metrics”
Switch role of left/right arrow keys
from “Toggling Between Display of
LZSmax and LAE” to “Change
Event”
Switch role of left/right
arrow keys from Change
Event”
to
“Change
Frequency”
FIGURE 12-15 Role of Left/Right Arrow Keys: 1/1 Octave Spectrum
1/3 Octave Spectrum Display
With all possibilities included, the fourth display would
be a 1/3 octave spectrum for the displayed event, as
shown in FIGURE 12-16.
FIGURE 12-16 Event History: 1/3 Octave
Display, Section 4
12-18
Event History Display
Model 831 Technical Reference Manual
Except for the difference in frequency resolution, the data
displayed and the use of the left and right arrow keys to
control the cursor position and to step through the events are
the same as for the 1/1 Octave display described in ‘1/1
Octave Spectrum Display” on page 12-17
Event Time History Display
With all possibilities included, the fifth display would be a
Time History for the displayed event, as shown in FIGURE
12-17.
Cursor Position
Time History Record
Being Displayed
Number of Time History
Records Measured
Event Being Displayed
Leq
at
Cursor
Position,
Integration Time Equal to UserSelected Period in Setup
Number of
Measured
Events
FIGURE 12-17 Event Time History Display, Section 5
Left/Right Arrow Keys
For the display shown in FIGURE 12-17, the 4 and 6 arrow
keys have dual roles as listed below. Use the
key to
toggle between them:
5
•
Change Record
•
Change Event
At any time, the role of the left and right arrow keys is
indicated by the left/right arrow icon
5
and the action of the
key to change their role is
indicated in the lower portions of the display, as shown in
FIGURE 12-15.
Model 831 Technical Reference Manual
Event History Display
12-19
Left and Right Arrow keys Left and Right Arrow keys
Change Event
Change Record
5
5
Switch role of left/right arrow keys
from “Change Record” to “Change
Event”
Switch role of left/right arrow keys
from “Change Event” to “Change
Record”
FIGURE 12-18 Role of Left/Right Arrow Keys: Event Time History
Event Spectra Time History Display
With all possibilities included, the sixth display would be a
Spectra Time History for the displayed event, as shown in
FIGURE 12-19.
Frequency Spectrum for
Selected Record and Event
Frequency and Level at
Cursor Position
Number of Time History
Records Measured
Time History Record
Whose Spectrum is Being
Displayed
Number of
Measured
Events
Event Being Displayed
FIGURE 12-19 Event Spectra Time History Display, Section 6
12-20
Event History Display
Model 831 Technical Reference Manual
Left/Right Arrow Keys
For the display shown in FIGURE 12-19, the 4 and 6 arrow
keys have three roles as listed below. Use the
key to
step through them:
5
•
Change Frequency
•
Change Record
•
Change Event
At any time, the role of the left and right arrow keys is
indicated by the left/right arrow icon
5
and the action of the
key to change their role is
indicated in the lower portions of the display, as shown in
FIGURE 12-15.
Left and Right Arrow keys
Change Event
Left and Right Arrow keys Left and Right Arrow keys
Change Frequency
Change Record
5
5
5
Switch role of left/right
arrow
keys
from
“Change Frequency” to
“Change Record”
Switch role of left/right arrow keys
from “Change Record” to “Change
Event”
Switch role of left/right
arrow keys from “Change
Event”
to
“Change
Frequency”
FIGURE 12-20 Role of Left/Right Arrow Keys: Event Spectra Time History
Model 831 Technical Reference Manual
Event History Display
12-21
By-Time Event Spectral Time History
With all possibilities included, the seventh display would be
a By-Time Event Spectral Time History for the displayed
event, as shown in FIGURE 12-19.
Time History Graph
Selected Frequency Band
of
Frequency of Time History
Graph being Displayed and
Leq value for that Time
History.
Number of Time History
Records Measured
Record Being Displayed
Number of
Measured
Event Being Displayed
Events
FIGURE 12-21 By-Time Event Spectral Time History Display, Section 7
Left/Right Arrow Keys
For the display shown in FIGURE 12-21, the 4 and 6 arrow
keys have three roles as listed below. Use the
key to
step through them:
5
•
Change Frequency
•
Change Record
•
Change Event
At any time, the role of the left and right arrow keys is
indicated by the left/right arrow icon
5
and the action of the
key to change their role is
indicated in the lower portions of the display, as shown in
FIGURE 12-15.
12-22
Event History Display
Model 831 Technical Reference Manual
Left and Right Arrow keys Left and Right Arrow keys Left and Right Arrow keys
Change Frequency
Change Record
Change Event
5
5
5
Switch role of left/right
arrow
keys
from
“Change Frequency” to
“Change Record”
Switch role of left/right arrow keys
from “Change Record” to “Change
Event”
Switch role of left/right
arrow keys from “Change
Event”
to
“Change
Frequency”
FIGURE 12-22 Role of Left/Right Arrow Keys: By-Time Event Spectral Time History
Model 831 Technical Reference Manual
Event History Display
12-23
Link to Time History and Measurement History
When Time History and/or Measurement History have also
been enabled, a link is provided to make a rapid transition
from any of the Event History displays to the same point in
time of the Time History and/or Measurement History
display.
Suppose, for example, we are displaying the Time History of
the 1 kHz frequency band associated with the 15th record of
the 2nd event, as shown in
FIGURE 12-23 By-Time Event Spectral Time
History
To implement a link, press the Menu softkey which will
produce the display shown in FIGURE 12-24.
FIGURE 12-24 Link to Time History and
Measurement History Displays
12-24
Link to Time History and Measurement History Model 831 Technical Reference Manual
5
Highlight the desired display and press the
key to
switch to that display, as shown in the following figures.
FIGURE 12-25 Time History Display
FIGURE 12-26 Measurement History Display
Model 831 Technical Reference Manual
Link to Time History and Measurement History12-25
12-26
Link to Time History and Measurement History Model 831 Technical Reference Manual
CHAPTER
13
RT-60
This chapter describes the measurement features
associated with the RT-60 optional firmware 831-RT.
Accessing RT-60 Mode
There are two ways to activate RT-60 measurement mode.
One way is to select the RT-60 icon on the Control Panel and
the other is to recall an RT-60 setup using Setup Manager.
Using the RT-60 Icon
A shortcut is to press the 3
(TOOLS) key and then the Up Arrow
key twice to highlight the RT-60 icon.
To access the RT-60 mode, press the 3 (TOOLS) key to
open the Control Panel, select the RT-60 icon as shown in
FIGURE 13-1.
Changing modes using the icon on the control panel will
load the setup that was previously in use for that mode.
Note: The RT-60 icon is replaced by
the Room Acoustics icon if the 831RA option is installed.
FIGURE 13-1 RT-60 Icon
Model 831 Technical Reference Manual
RT-60
13-1
Press the 5 (ENTER) key to open the RT-60 mode tabs as
shown in FIGURE 13-2.
FIGURE 13-2 RT-60 Pages
Using the Setup Manager
To load a setup file via the Setup Manager, press the 3
(TOOLS) key to open the Control Panel. Select the Setup
Manager icon as shown in FIGURE 13-3.
FIGURE 13-3 Setup Manager Icon
13-2
Accessing RT-60 Mode
Model 831 Technical Reference Manual
Open the Setup Manager to display the available setups as
shown in FIGURE 13-4. Note that the instrument mode
associated with each setup file is indicated in the right-hand
column. RA indicates RT-60 (Room Acoustics) mode.
FIGURE 13-4 RT60 Setups in Setup Manager
If you have created and saved your
own RT-60 setups, these will also
appear in the list and can be
similarly selected.
As a “quick start”, several predefined RT-60 setups are
provided (see the ‘Making a Measurement’ on page 13-4’):
•
•
•
RT60impl -Impulse method
RT60pink - Interrupted Noise method using pink noise
via the internal noise source
ASTM2235 - Specific to ASTM E2235 using the
internal noise source
Any setting changes made while one of these setups is active
will become permanent. Refer to the Setup Manager section
in Chapter 4 for information on creating custom setup files.
Model 831 Technical Reference Manual
Accessing RT-60 Mode
13-3
Making a Measurement
Selecting the Method
There are two methods
reverberation time:
available
for
measuring
•
Impulse Method (using Schroeder reverse integration)
•
Interrupted Noise Method
In many instances, RT60 measurements can be made using
the predefined setup files provided.
Impulse Method
Step 1
Recall RT60impl from the Setup Manager.
Step 2 Make a measurement using a starter pistol or
balloon burst (operator is in room).
Step 3 Move microphone or source position and repeat as
desired.
Interrupted Noise Method
Step 1
Recall RT60pink from the Setup Manager.
Step 2 If using the internal noise generator, connect the
AC output of the Model 831 to an amplifier/speaker system.
If using an external generator, set the RT-60 noise type to
"OFF" (see the ‘Customizing Measurements’ on page 1322’) and generate noise externally.
Step 3 Make a measurement (operator exits room until
the desired number of decays is obtained). A trial
measurement may be needed to ensure the noise source is
sufficiently loud and the trigger level is exceeded.
Step 4 Move microphone or source position and repeat
the number of times needed for desired accuracy grade (see
‘Accuracy Grade’ on page 13-32).
13-4
Making a Measurement
Model 831 Technical Reference Manual
Measurement State Sequence
This section presents the sequence of Model 831 screen
displays and actions taking place during an a measurement.
Trigger Level
Trigger Level - 45 dB
FIGURE 13-5 RT-60 Status Screen
Initiate Measurement
Initiate a measurement by pressing the 9 (RUN/PAUSE)
key, at which time the icon shown in FIGURE 13-6 will
appear in the lower left corner of the screen. This lasts as
long as the configured Exit Time. No data is taken while this
icon is shown.
FIGURE 13-6 Exit Prompt
Background Noise Measurement
After the Exit Time has passed, the background noise is
measured, as indicated by the icon shown in FIGURE 13-7.
The background noise level is measured for 5 seconds and is
then used for determining signal-to-noise ratio on successive
decays. The background noise level is measured for every
position, i.e., every time "Run" is pressed.
Model 831 Technical Reference Manual
Making a Measurement
13-5
T20 uses data from -5 dB to -25 dB and requires a signal to
noise ratio of at least 35 dB. T30 uses data from -5 dB to -35
dB and requires a signal to noise ratio of at least 45 dB.
FIGURE 13-7 Background Measurement Display
Filling Pre-trigger Buffer
When the background measurement has completed, the pretrigger buffer fills as indicated by the icon shown in
FIGURE 13-8.
FIGURE 13-8 Pre-Trigger Buffer Display
Ready For Excitation Signal
When the pre-trigger buffer is full, the “Ready” icon shown
in FIGURE 13-9 will appear in the lower left corner of the
screen, and the 7 (STOP/STORE) key will flash red to
indicate that the source within the room should be activated.
If using the internal noise source, it will start automatically.
FIGURE 13-9 Ready Display
Valid (Interrupted Method Only)
The Valid display will not appear
when using the Impulse Method.
When using the Interrupted Noise method, the “Valid” icon
shown in FIGURE 13-10 indicates that the room has been
successfully energized. This occurs when the trigger level is
exceeded for at least as long as the configured Build Time. If
using an external noise source, do not stop the noise output
until this icon is displayed. The 7 (STOP/STORE) key
will stop flashing to indicate that an external noise source
should be turned off. If using the internal noise source, it
will stop automatically.
FIGURE 13-10 Valid Display
13-6
Making a Measurement
Model 831 Technical Reference Manual
Triggered
When the measurement has been triggered, the “Triggered”
icon shown in FIGURE 13-11 will appear in the lower left
corner of the screen.
FIGURE 13-11 Triggered Display
Measurement Complete
When the measurement has completed, the display shown in
FIGURE 13-12 will appear. The icon in the lower left of the
screen indicates a successful measurement, and the position
count has been incremented.The spectrum graph displayed is
for the last excitation.
FIGURE 13-12 Measurement Completed
Repeat Measurement
The operator can now move the microphone and/or noise
source and press the 9 (RUN/PAUSE) key to initiate
another measurement sequence.
Model 831 Technical Reference Manual
Making a Measurement
13-7
Viewing and Analyzing Results
The data displays are the same regardless of the method used
for the measurement.
Following a measurement, the data can be viewed on the RT60 tab pages as follow:
•
•
•
•
•
•
•
RT-60 Status
RT-60 Spectra
RT-60 Decay Curve
Excitation Levels
Quality Summary (two pages for 1/3 octave data)
Quality Detail
Accuracy Grade
RT-60 Status
The RT-60 Status display shows the previously described
measurement states. After the measurement is complete, it
also shows the Lmax, Leq, and background level for each
frequency, as well as the Z-weighted Leq value.
FIGURE 13-13 RT-60 Status
13-8
Viewing and Analyzing Results
Model 831 Technical Reference Manual
RT-60 Spectra
The RT-60 Spectra display shows a graph of the
reverberation times for each frequency of the ensemble
average or an individual decay. Both T30 (black line) and
T20 (grey line) data are displayed.
FIGURE 13-14 RT-60 Spectra
Note: The navigation described here
applies to most of the pages on the
RT-60 tab.
When viewing information for the ensemble average,
pressing the 5 (ENTER) key will toggle the role of the
left/right arrow keys between changing ensemble/decay and
changing frequency.
A prompt near the bottom of the
display ("Enter-> Change Data" in
figure 13-4) indicated where the
focus of the left/right arrows will go
when the 5 (ENTER) key is pressed.
When viewing information for an individual decay, pressing
the 5 (ENTER) key will toggle the role of the left/right
arrow keys between changing ensemble/decay, frequency,
and decay number. See FIGURE 13-5.
Model 831 Technical Reference Manual
Viewing and Analyzing Results
13-9
5 (ENTER)
(RIGHT)
5 (ENTER)
FIGURE 13-15 Navigation
13-10
Viewing and Analyzing Results
Model 831 Technical Reference Manual
RT-60 Decay Curve
The RT-60 Decay Curve display shows the time domain
ensemble or individual decay curve.
Note: In the upper right corner of the
display is a t=1.98s. This value
represents the time duration of the
data being displayed
Reverse Integration
Background
Level
Linear Regression
Time shown
on x-axis
FIGURE 13-16 RT-60 Decay Curve
The linear regression line on the graph is usually associated
with the T30. However, if the T30 decay time was
undetermined, the T20 data is used. When the Impulse
method is used, the reverse integration curve is also shown
on the graph.
Model 831 Technical Reference Manual
Viewing and Analyzing Results
13-11
Excitation Levels
The Excitation Levels display shows the equivalent,
maximum, and background levels for all frequency bands of
the ensemble average or for an individual decay. From this it
can be determined which frequencies were sufficiently
energized for a desired decay range.
FIGURE 13-17 Excitation Levels
LZeq is computed as the Leq between the initial exceedance
of the trigger level to when the signal falls below the trigger
level minus 5 dB.
LZmax is the maximum value of the time history.
LZbk is the background level measured for this frequency at
this position.
13-12
Viewing and Analyzing Results
Model 831 Technical Reference Manual
Quality Summary
The left/right arrows keys will toggle
between T20 and T30.
This display provides a summary of the quality indicators
for all frequencies between the configured highest and
lowest filters. For 1/3 octave measurements, this display
may span two pages. For more information about the quality
indicators, see the‘Quality Indicators’ on page 13-30.
=Good
=Fair
=Poor
Note: If a decay time could not be
determined, the quality indicator
icon will not be present.
FIGURE 13-18 Quality Summary
Model 831 Technical Reference Manual
Viewing and Analyzing Results
13-13
Quality Detail
The left/right arrow keys will scroll
through the frequencies.
This display provides details about the quality indicators for
the selected frequency. If a metric is determined to be "Fair"
or "Poor", the criteria that failed is shown in the right-hand
column as shown in FIGURE 13-19.
FIGURE 13-19 Quality Detail
Accuracy Grade
See definitions on page 13-29
FIGURE 13-20 Accuracy Grade
13-14
Viewing and Analyzing Results
Model 831 Technical Reference Manual
Excluding Samples from the Ensemble
Excluding a decay will exclude all
frequencies for the selected decay.
When the display is showing data for an individual decay,
the operator has the option of excluding the current decay
from the ensemble average. Excluding decays from the
ensemble is useful when one or more are corrupt, as is
evident in FIGURE 13-21. In this case, the operator coughed
during a measurement.
Note: Once the data has been stored,
it cannot be edited in the Model 831;
therefore individual decays cannot
be included or excluded from the
ensemble.
FIGURE 13-21 Ensemble Before and After
Excluding a Corrupt Decay
Model 831 Technical Reference Manual
Viewing and Analyzing Results
13-15
To exclude a decay, press the Center Softkey labeled Menu,
highlight Exclude, press the 5 key. An "X" will appear
next to the sample number to indicate it is excluded..
FIGURE 13-22 Steps to Exclude a Measurement
To re-include a decay that has been excluded, follow the
same steps except highlight Include on the menu.
13-16
Viewing and Analyzing Results
Model 831 Technical Reference Manual
Manually Controlling the Internal Noise Source
When operating in the Room Acoustics instrument mode,
the Model 831 provides an internal noise generator capable
of outputting white or pink noise via the AC output jack.
The noise source is controllable from the Source display as
follows:
•
The 4 and 6 keys control the noise type.
•
The 8 and 2 keys control the attenuation, which
adjusts in 3dB steps.
•
The 5 key toggles the mute on and off.
Trigger Source
Trigger Level
Trigger Level - 45 dB
Indicates changes here
affect RT-60 Noise Settings
Noise Type
(46 to change).
Noise Source Attenuation
(82 to change).
Mute State
(5 to change).
FIGURE 13-23 Source Display Summary
Model 831 Technical Reference Manual
Manually Controlling the Internal Noise Source
13-17
When the measurement method is set to Impulse or the Link
to Source Display control is unchecked, the source is
controllable independent of the RT-60 measurement.
FIGURE 13-24 No Link to Source Display
FIGURE 13-25 Independant Controls
13-18
Manually Controlling the Internal Noise Source Model 831 Technical Reference
When the measurement method is set to Interrupted Noise
and the Link to Source Display control is checked,
adjustments made on the display are reflected in the RT-60
Noise controls. In this case there is a notification under the
graph and the trigger level and trigger source are shown.
FIGURE 13-26 Link to Source Display
Note: If the trigger source is set to Z
or Mid Band, a cursor will not be
shown.
FIGURE 13-27 Linked Controls
Model 831 Technical Reference Manual
Manually Controlling the Internal Noise Source
13-19
Hints on Making a Good RT-60 Measurement
13-20
•
Make sure the exit time is long enough to allow egress
and any residual noise to die down
•
Turn off your cell phone and remove other possible
sources of sound contamination.
•
Be quiet during the background level measurement
(between the exit period and filling the pre-trigger buffer.
See the ‘Measurement State Sequence’ on page 13-5’.
•
Minimize the ambient noise in the room by turning off
the mechanical equipment (i.e., HVAC units).
•
Close doors, windows, and partitions to reduce
reverberant energy from adjoining areas.
•
Use a sound source with repeatable amplitude and
spectral content.
•
Use the exclude feature when something goes wrong. It
is a good idea to configure the instrument to take a few
more decays than what is required just in case.
•
Trigger near the maximum level. For interrupted noise
method measurements, a few trial runs may be required
to determine a good trigger point due to the requirement
that the noise source level be above the trigger level for a
specific duration (Build Time).
•
Energize the room sufficiently. It may take multiple
sound sources and measurements to characterize the
decay times over the full desired spectrum.
•
Make measurements at many different sourcemicrophone combinations to improve the ensemble
uncertainty. See the “Accuracy Grade section on page
13-28 for more information.
•
Minimize what is in the room (see ISO 3382-2:2008(E)
Section 4.1).
Manually Controlling the Internal Noise Source Model 831 Technical Reference
•
ASTM E2235 requires working with a diffuse field
(random incidence) microphone. You can select the
correction FF->RI to adapt your microphone
characteristics if needed.
FIGURE 13-28 Microphone Correction
Model 831 Technical Reference Manual
Manually Controlling the Internal Noise Source
13-21
Customizing Measurements
From any of the pages on the RT-60 tab, press the Center
Softkey labeled Menu, highlight Settings, press the 5 key
to display the settings tabs shown below. These pages are
used to modify the measurement parameters. The active
parameter values shown represent the default values.
General Settings
Impulse and Interrupted Methods
Character Entry
FIGURE 13-29 General Settings
Lowest and Highest Filters define the frequency range over
which the measurement will be made.
The Exit Time is set to give the operator enough time to exit
the room and to allow any residual noise to decay before
starting a measurement and can range from 0 to 99 seconds.
13-22
Customizing Measurements
Model 831 Technical Reference Manual
RT-60 Settings
Select Bandwidth
Select Impuse or
Interrupted Noise
See ‘RT-60 Advanced
Menu” on page 13-20
FIGURE 13-30 RT-60 Settings: Impulse Method
Method can be either Impulse or Interrupted Noise.
Trigger Source allows the user to select which filter output
to use as the trigger source to when making a measurement
and can be:
Note: Trigger Source will also be
limited to be between the Lowest and
Highest filters (inclusive) as set in
the General Tab page shown in
FIGURE 13-29.
•
Z-weighted
•
Mid-Band: using the energy from the filters between 500
Hz and 2 kHz
•
1/1 or 1/3 octave filters, based on the bandwidth selected
Trigger Level is the signal level at which a reverberation
time measurement is triggered. When using the Impulse
method, data acquisition is triggered when the rising sound
level exceeds the configured Trigger Level. When using the
Interrupted Noise method, data acquisition is triggered when
the decaying sound level drops to 5 dB below the configured
Trigger Level.
Decays indicates the number of successive reverberation
time measurements to take at a location. Once the
measurement is started by pressing 9 (RUN/PAUSE), the
Model 831 Technical Reference Manual
Customizing Measurements
13-23
Model 831 will begin making the measurement and
automatically stop when the configured decay count has
been reached.
RT-60 Advanced Menu
The advanced menu provides additional options that can be
used to fine tune a measurement.
Enter to Select
Return to RT-60 Menu
FIGURE 13-31 RT-60 Advanced Settings: Impulse
Method
13-24
Customizing Measurements
Model 831 Technical Reference Manual
Sample Period sets the time interval between samples of the
sound decay curves.
Max Run Time is used to set the post trigger run time. The
maximum value is dependant upon the Sample Period as
indicated by ‘Max Run Time vs Sample Period’ on page 1325.
Sample Period (ms)
Max Run Time (s)
20
19
10
18
5
9
2.5
4
Table 13 - 1 Max Run Time vs Sample Period
Care must be taken to ensure the decays are sampled
adequately and this can be evaluated using some simple
math. Consider that we have a reverberation time of 420 ms
for a 60 dB decay. 20 dB is 1/3 of 60 dB, so for T20, we
have 420 / 3 = 140 ms. Sampling at 5 ms gives us 140 / 5 =
28 data points. For T30 we have 210 ms or 42 data points.
Build Time is available when the method is set to
Interrupted Noise. The Build Time is the time the noise level
must be above the configured Trigger Level to sufficiently
energize the room. For example, if the Build Time is set to
five seconds, the sound source will be on for five seconds
plus the time it takes for the sound level to reach the trigger
level.
Use +20 dB gain only for Interrupted Noise since impulses
quickly exceed 120 dBZ.
Model 831 Technical Reference Manual
Customizing Measurements
13-25
Source Menu
Impulse Method
The RT-60 noise controls are
unavailable when using the Impulse
method.
FIGURE 13-32 Source Setting: Impulse Method
The impulse signal is generated externally, i.e., with a starter
pistol, a balloon, etc.; there is nothing to configure on this
page.
13-26
Customizing Measurements
Model 831 Technical Reference Manual
Interrupted Noise Method
Whether using an external source or the internal source, the
Model 831 is designed to automate and simplify the process
by making measurements based upon triggers.
Select White or Pink
Enter to Select
FIGURE 13-33 Source Settings: Interrupted Noise
Method
The signal used to energize the room can be generated by an
external sound source or using the internal noise source of
the Model 831. If using an external source, select "Off". If
using the internal noise source, select "White" or "Pink"
noise.
The Model 831 outputs the noise signal via the AC output
connector. An external amplifier and speaker system are
needed to sufficiently energize a room.
Attenuation is used to reduce the output signal from the
Model 831 in instances where the level might overload the
amplifier input.
The Link to Source Display check box, when checked, will
allow the user to control these settings in real-time from the
source display.
Model 831 Technical Reference Manual
Customizing Measurements
13-27
Storing Data
Press the 7 (STOP/STORE) key to store data.
FIGURE 13-34 File Save Dialog
13-28
Storing Data
Model 831 Technical Reference Manual
Viewing Stored Data
The stored data displays are the
same regardless of the method used
for the measurement.
Following a measurement, the stored data can be viewed on
the RT-60 tab pages as follow:
Note: The Data Explorer only shows
files from the current instrument
mode.
Use the Data Explorer utility to view stored measurements
on the 831. Data Explorer is opened by pressing the 3
(TOOLS) key and then selecting the icon labeled "Data
Explorer". When this utility opens, it will display the saved
files. To open one of the files, highlight the file and press the
5 (ENTER) key. The data can now be viewed just as was
outlined in the "Viewing and Analyzing Results" section.
One exception is that the data cannot be edited, therefore
individual decays cannot be included or excluded from the
ensemble.
Model 831 Technical Reference Manual
•
•
•
•
•
•
RT-60 Spectra
RT-60 Decay Curve
Excitation Levels
Quality Summary (two pages for 1/3 octave data)
Quality Detail
Accuracy Grade
Viewing Stored Data
13-29
Quality Indicators
The Model 831 provides a variety of measurement “quality
indicators” using criteria described in ISO 3382-2:2008(E).
For more information, including the equations used to
calculate each metric, please refer to ISO 3382-2:2008(E).
Each quality indicator is described below, and Table 3-2
shows the criteria for being considered “Good”, “Fair”, or
“Poor”.
=Good
BT
BK
>16
≥ 35 dB (T20)
NL
Cu
≥ 45 dB (T30)
≤ 5‰
0%≤ Cu ≤ 5%
SD
≤ 5%
NA = Not Applicable
=Fair
NA
NA
5‰ < NL ≤ 10‰
5% < Cu ≤ 10%
-5% < Cu < 0%
5% < SD ≤ 10%
=Poor
≤ 16
< 35 dB (T20)
< 45 dB (T30)
> 10‰
> 10%
≤ -5%
> 10%
Table 13 - 2 Quality Indicator Criteria
BT – BT is the product of the filter bandwidth and the T20
or T30 decay time for that frequency. BT is used to
determine if the measured reverberation time may have been
influenced by the filter response time. See ISO 33822:2008(E) Section 7.3 equation 4.
BK – BK is a measure of the dynamic range between the
excitation signal and the background noise level. BK is
calculated from LZmax when using the Impulse method, and
from LZeq when using the Interrupted Noise method. See
ISO 3382-2:2008(E), Sections 5.2.1 and 5.3.2.
NL – NL is the degree of non-linearity of the T20 or T30
portion of the decay curve, and is reported as permillage
(parts per thousand) deviation from perfect linearity. See
ISO 3382-2:2008(E), Annex B.2.
13-30
Quality Indicators
Model 831 Technical Reference Manual
Cu – Cu is the degree of curvature, and is a comparison of
the T20 and T30. Cu is expressed as the percentage
deviation from being perfectly in-line. See ISO 33822:2008(E), Annex B.3.
SD – SD is the standard deviation of the measurement
results for the T30 or the T20 decay times. See equations 2
and 3 in ISO 3382-2:2008(E), Sections 7.1. For impulsive
excitation, n = 10 is used as defined in section 7.2
Model 831 Technical Reference Manual
Quality Indicators
13-31
Accuracy Grade
ISO 3382-2:2008(E) describes three methods of differing
measurement uncertainty as follows:
Survey Method
The survey method is appropriate for the assessment of the
amount of sound absorption for noise control purposes, and
survey measurements of the airborne and impact sound
insulation. It should be used for measurements in ISO
10052. Survey measurements are made in octave bands only.
The nominal accuracy is assumed to be better than 10% for
octave bands.
Make measurements of the reverberation time for at least
one source position. Find the average of results from at least
two source-microphone combinations, see Table 13 - 3.
Engineering Method
The engineering method is appropriate for verification of
building performance for comparison with specification of
reverberation time or room absorption. It should be used for
measurements in ISO 140 (all parts) with remarks to
reverberation time measurements. The nominal accuracy is
assumed to be better than 5% in octave bands and better than
10% in one-third octave bands. See Table 13 - 3.
Measure reverberation time two or more times for each
source-microphone combination. At least six independent
source-microphone combinations are required, see Table 13
- 3 'Minimum Number of Positions and Measurements'.
Precision Method
The precision method is appropriate where high
measurement accuracy is required. The nominal accuracy is
assumed to be better than 2.5% in octave bands and better
than 5% in one-third-octave bands.
Measure reverberation time three or more times for each
source-microphone combination. At least twelve
independent source-microphone combinations are required,
see Table 13 - 3 'Minimum Number of Positions and
Measurements'.
13-32
Accuracy Grade
Model 831 Technical Reference Manual
Source-microphone combinations
Source-positions
Microphone-positions
No. decays in each position
(interrupted noise method)
Method
Filter bandwidth
Frequency Range (minimum)
Standards
Survey
Engineering
Precision
2
6
12
1
2
2
2
3
1
2
3
Impulse or
Interrupted
Interrupted
Interrupted
1/1
1/1 or 1/3
1/1 or 1/3
250 Hz to 2 kHz
ISO 10052
125 Hz to 4 kHz (1/1)
100 Hz to 5 kHz (1/3)
ISO 140
Table 13 - 3 Minimum Number of Positions and Measurements
Model 831 Technical Reference Manual
Accuracy Grade
13-33
Return to Sound Level Meter Mode
A shortcut is to press the 3
(TOOLS) key and then the 8 key
to select the SLM icon.
When the RT-60 mode is active, the SLM icon is available in
the Control Panel as shown in FIGURE 13-35 SLM Icon.
To return to the Sound Level Meter mode, press the 3
(TOOLS) key to open the Control Panel, select the SLM
icon and press the
(ENTER) key.
5
Changing modes using the icon on
the control panel will load the setup
that was previously in use for that
mode.
FIGURE 13-35 SLM Icon
13-34
Return to Sound Level Meter Mode
Model 831 Technical Reference Manual
Model 831 Technical Reference Manual
Return to Sound Level Meter Mode
13-35
CHAPTER
14
FFT
NOTE: FFT functionality is only
available on DSP Rev 0.5 or higher.
DSP Rev is shown on the "About"
display described in Chapter 20.
The optional FFT mode (831-FFT) is used for signal
analysis using the Fast Fourier Transform (FFT). The
FFT provides an amplitude spectrum with linear
frequency resolution and is used to determine the
frequency content of sound or vibrations.
Accessing FFT Mode
A shortcut is to press the 3
(TOOLS) key and then the Up Arrow
key to highlight the FFT icon.
There are two ways to activate the FFT instrument mode on
the Model 831. One way is to select the FFT icon on the
Control Panel and the other is to recall an FFT setup using
Setup Manager as described in Chapter 4.
To access FFT mode, press the 3 (TOOLS) key to open the
Control Panel, select the FFT icon as shown in FIGURE 14-1.
Changing modes from the control panel will load the settings
that were previously in use for the mode you are changing to.
FIGURE 14-1 FFT Icon
Model 831 Technical Reference Manual
Accessing FFT Mode
14-1
Press the 5 (ENTER) key to open the FFT mode tabs as
shown in FIGURE 14-2.
FIGURE 14-2 FFT Pages
Note: The Setup Manager
described in Chapter 4.
is
In the Setup Manager, the instrument mode associated with
each setup file is indicated in the right-hand column as
shown in FIGURE 14-3. It is possible to load any setup file
without regard to the current instrument mode.
FIGURE 14-3 FFT Setup Manager
14-2
Accessing FFT Mode
Model 831 Technical Reference Manual
Configuring a Measurement
To access the measurement settings, press the Softkey labeled
Menu, highlight Settings, and press the 5 (ENTER) key to
display the settings tabs shown below. The active parameter
values shown in this section represent the default values.
General Tab
The General setting tab, shown in FIGURE 14-4, provides a
default filename and measurement description text field to
annotate the measurement. These are similar to those for the
other instrument modes. Use the Setup Manager and these
fields to organize and document your measurement projects.
FIGURE 14-4 General Tab
Default Data File
The Default Data File text field is used to customize the file
name for FFT data files. This file name can be used to
indicate the type of data that was taken or the project the
data is from. This name can be up to 8 characters long and
contain letters, numbers and certain symbols.
Model 831 Technical Reference Manual Configuring a Measurement
14-3
Measurement Description
The Measurement Description is used to annotate a
measurement and can be up to 63 characters in length.
FFT Tab
FIGURE 14-5 FFT Tab
Frequency Span
The Frequency Span setting is used to determine the upper
end of frequency response. The choices are:
14-4
•
20 kHz
•
10 kHz
•
5 kHz
•
2 kHz
•
1 kHz
•
500 Hz
•
200 Hz
•
100 Hz
Configuring a Measurement
Model 831 Technical Reference Manual
Lines
The Lines setting selects the number of discrete frequency
bands or bins.
The choices are:
Number of Lines
Note: The frequency resolution is
rounded to at most 2 decimal places
on the Model 831.
•
6400
•
3200
•
1600
•
800
•
400
The frequency resolution and bandwidth of each bin is
determined by the Frequency Span and the number of lines
as shown in Table 14-1.
100
200
Frequency Span (Hz)
500
1000
2000
5000
10000
20000
400
0.25
0.5
1.25
2.5
5
12.5
25
50
800
0.125
0.25
0.625
1.25
2.5
6.25
12.5
25
1600
0.0625
0.125
0.3125
0.625
1.25
3.125
6.25
12.5
3200
0.03125
0.0625
0.15625
0.3125
0.625
1.5625
3.125
6.25
6400
0.015625
0.03125
0.078125
0.15625
0.3125
0.78125
1.5625
3.125
Table 14-1 Frequency Resolution (Hz)
Window
There is a wealth of information
about window functions available
online and in print, and detailed
descriptions are beyond the scope of
this document.
Three Window options are available in the Model 831 to
provide emphasis or balance between frequency selectivity
and amplitude ripple as the signal frequency varies from one
bin to another. The choices are:
•
Rectangular
•
Hanning
•
Flat Top
Frequency Weighting
The Frequency Weighting setting selects a broadband A, C
or Z pre-filter. A broadband Leq and peak level is measured
using this weighting in addition to the weighting being
applied to the FFT spectrum.
Model 831 Technical Reference Manual Configuring a Measurement
14-5
Control Tab
FIGURE 14-6 Control Page
Run Mode
The Run Mode setting controls how a measurement is
terminated and how history records are accumulated. The
three run modes are described in Table 14-2 below.
Manual Stop A Manual Stop measurement begins with a press of the 9 (RUN) key and
ends with a press of the 7 (STOP) key. If measurement history is enabled, a
history record will be created with each stop. As many runs as desired can be
made and the overall data will include all samples from each FFT record.
Count Stop
A Count Stop measurement begins with a press of the 9 (RUN) key and ends
when the number of discrete FFT records equals the Count setting value. If
measurement history is enabled, a history record will be created. A measurement may be terminated early by pressing 7 (STOP) .
Timed Stop
A Timed Stop measurement begins with a press of the 9 (RUN) key and ends
when the run time for this measurement equals the Time setting value. If measurement history is enabled, a history record will be created when the number of
FFT records equals the Count setting value. A measurement may be terminated
early by pressing 7 (STOP)
Table 14-2 FFT Run Modes
14-6
Configuring a Measurement
Model 831 Technical Reference Manual
Time
The Time setting is used to determine the run time for the
Timed Stop mode as described in Table 14-2 above.
A history record is an average of
FFT records. The number of FFT
records in each history record is
controlled by the Count and/or Run
Mode as described in Table 14-2.
Enable Measurement History
The Enable Measurement History setting will enable the
storing of history records. The measurement history is
helpful as an automatic notebook to save each manual
measurement for tonal or THD analysis, or it can store a
time history for a waterfall graph or to illustrate a machine
run-up or run-down cycle to evaluate modes.
Range
The Range setting, in conjunction with the Gain setting,
determines the amplitude measurement range of the FFT as
illustrated in the Table 14-3 below.
+20 dB Gain
The +20 dB Gain setting, in conjunction with the Range
setting, determines the amplitude measurement range of the
FFT as illustrated in Table 14-3 below.
The maximum input levels shown are
for a typical microphone sensitivity
of 50mV/Pa
+20 dB Gain Off
+20 dB Gain On
Normal 143 dB peak maximum 123 dB peak maximum
Low
110 dB peak maximum 90 dB peak maximum
Table 14-3 Maximum Input for Range and Gain
Count
The Count setting is used with the Count Stop and the
Timed Stop modes to generate a "count average"
measurement as described in Table 14-2 located above.
The minimum required count value is determined by the
Frequency Span settings as illustrated in Table 14-4 located
below. The minimum count prevents data being gathered
faster than it can be stored into flash memory.
Model 831 Technical Reference Manual Configuring a Measurement
14-7
Frequency
Span
Minimum
Count
20 kHz
20
10 kHz
10
5 kHz
5
2 kHz
2
1 kHz
1
500 Hz
1
200 Hz
1
100 Hz
1
Table 14-4 Minimum Count
Resolution = Span / Lines
FFT Time = 1 / Resolution
Narrow frequency resolutions take longer to gather, so the
response will be slower. For example, when configured for
100 Hz span and 6400 lines, each FFT record will be 64
seconds long. Using 67% overlap allows subsequent
frequency spectrum updates to occur at approximately 1/3
the time of the initial update. These nominal times are given
Table 14-5.
Lines
It is important to note that the actual amount of overlap can
vary based on processor load. Varying the amount of
overlap allows the Model-831 to process all incoming sound
samples even when the processor is busy (i.e., storing a file).
Variations in the amount of overlap will be evident as
variations in the duration of individual FFT records in a
history record.
Frequency Span (Hz)
1000
2000
100
200
500
5000
10000
20000
400
1.32
0.66
0.264
0.132
0.066
0.0264
0.0132
0.0066
800
2.64
1.32
0.528
0.264
0.132
0.0528
0.0264
0.0132
1600
5.28
2.64
1.06
0.528
0.264
0.1056
0.0528
0.0264
3200
10.56
5.28
2.11
1.06
0.528
0.2112
0.1056
0.0528
6400
21.12
10.56
4.22
2.11
1.06
0.4224
0.2112
0.1056
Table 14-5 Nominal Calculation Time (seconds) with 67% Overlap
14-8
Configuring a Measurement
Model 831 Technical Reference Manual
Viewing and Analyzing Results
The Model 831 can measure FFT spectra with up to 6400
lines of resolution. Because of the limited resolution of the
display, every line displayed on the graph may contain more
than one measured value. The amplitude and frequency
displayed for the cursor position is determined by the
maximum value of the underlying FFT lines.
Frequency range shown
on the display
Live Data
Zoom level and relative
position indicator
Indicates the 82 (UP/
DOWN)
keys
control
zooming
Frequency range at
cursor
Indicates the 46
(LEFT/RIGHT) keys
control the cursor
Maximum value at cursor
Indicates the level given is
the maximum of the lines at
the cursor
Frequency of the max
value at the cursor
FIGURE 14-7 FFT Live
Model 831 Technical Reference ManualViewing and Analyzing Results
14-9
Maximum value of the
data in the average
Indicates the level given is the
maximum level at the cursor
position in the average data
Average Data
Indicates the level given is
the maximum level at the
cursor position in the max
data
Total number of FFT
records
FIGURE 14-8 FFT Overall
Indicates pressing ENTER
changes the functionality of
the 82 (UP/DOWN)
keys (zooming to changing
records and back)
Indicates the current record
number and the total number
of records
FIGURE 14-9 FFT History
14-10
Viewing and Analyzing Results
Model 831 Technical Reference Manual
Zooming In/out
The Model 831 provides a graphical zoom function that
displays a narrower frequency range and the spectrum on the
graph is displayed at a higher frequency resolution. This is
useful if you want to take a closer look at an area of interest.
The Model 831 allows zooming from
the configured number of lines up to
a
one-to-one
correspondence
between displayed lines and FFT
lines. When zoomed in one-to one,
the level indicator changes to
indicate that the displayed level is no
longer the max of lines, but rather
the value of the line at the cursor
(see FIGURE 14-10).
To zoom in, press the 8 (UP) key and press the 2
(DOWN) key to zoom out. Notice that the bar underneath
the graph indicates the zoom level and relative position of
the displayed data within the overall dataset. Additionally,
the frequency range currently displayed on the graph is
shown in the top-right corner.
FIGURE 14-10 FFT Live Tab
Model 831 Technical Reference ManualViewing and Analyzing Results
14-11
Changing the Cursor Type
The Model 831 provides both manual cursor control and a
max-tracking cursor, both of which can be displayed with or
without harmonic cursors. To change the cursor type press
the Menu soft-key, highlight Cursor Type as shown in
FIGURE 14-11 and press 5 ENTER.
FIGURE 14-11 Cursor Menu
The cursor control dialog shown in FIGURE 14-12 will
appear at the bottom of the display.
FIGURE 14-12 Cursors Type
Cursor Type
Select either Manual or Max-Tracking cursor with the 6
(RIGHT) and 4 (LEFT) keys.
With the cursor type set to Manual the frequency cursor is
controlled manually using the 6 (RIGHT) and 4 (LEFT)
keys.
With the cursor type set to Max-Tracking the cursor will be
set automatically to the frequency band that has the highest
amplitude.
14-12
Viewing and Analyzing Results
Model 831 Technical Reference Manual
Harmonic Cursors
The number of harmonic cursors can be set from zero to
twenty-four in increments of four using the 8 (UP) and
2 (DOWN) keys. Depending on the frequency of the
primary cursor, all of the harmonic cursors may not be
shown. For example, with a frequency span of 20kHz and a
fundamental frequency of 5kHz only three harmonic cursors
are within the frequency range and shown. FIGURE 14-13
illustrates this example.
FIGURE 14-13 Harmonic Cursors
Model 831 Technical Reference ManualViewing and Analyzing Results
14-13
Max-Tracking Cursor
With the cursor type set to Max-Tracking, the cursor will be
set automatically to the frequency band that has the highest
amplitude. When zoomed in, if the maximum is not in the
display window, the window will move to center over the
max. The max-tracking state and the relative position of the
display window are indicated on the display as shown in
FIGURE 14-14.
FIGURE 14-14 Max-Tracking Cursors
14-14
Viewing and Analyzing Results
Model 831 Technical Reference Manual
Additional Information
When the cursor is on a line less than 3 Hz, (-3 dB), the
displayed values will be grey as shown in FIGURE 14-15.
FIGURE 14-15 Below 3Hz
Model 831 Technical Reference ManualViewing and Analyzing Results
14-15
The scaling of the y-axis can be adjusted as described in the
Adjust Graph Scale section of Chapter 5. The FFT graphs
on the FFT Live, Overall, and History tabs can be adjusted
independently of the sound pressure level graph on the Live
tab as show in FIGURE 14-6.
FIGURE 14-16 Dual Range Displays
14-16
Viewing and Analyzing Results
Model 831 Technical Reference Manual
Storing Data
Press the 7 (STOP/STORE) key to store data. As shown
in FIGURE 14-17, the suggested filename is what was
configured on the General settings tab.
FIGURE 14-17 Saving Files
Viewing Stored Data
Note: The Data Explorer only shows
files for the current instrument mode.
Model 831 Technical Reference Manual
Use the Data Explorer utility to view stored measurements on
the Model 831. Data Explorer is opened by pressing the 3
(TOOLS) key and then selecting the icon labeled "Data
Explorer". When this utility opens, it will display saved files.
To open one of the files, highlight the file and press the 5
(ENTER) key. The data can now be viewed as outlined in the
"Viewing and Analyzing Results" section with the exception
that the Cursor Type and Adjust Graph controls are not
available. These settings will follow the configuration used
when viewing live data.
Storing Data
14-17
Return to Sound Level Meter Mode
When the FFT mode is active, the SLM icon is available in
the Control Panel as shown in FIGURE 14-18. To return to
the Sound Level Meter mode, press the 3 (TOOLS) key to
open the Control Panel, select the SLM icon and press the
5 (ENTER) key.
Changing modes using the icon on
the control panel will load the setup
that was previously in use for that
mode.
FIGURE 14-18 SLM Icon
14-18
Return to Sound Level Meter Mode
Model 831 Technical Reference Manual
Model 831 Technical Reference ManualReturn to Sound Level Meter Mode
14-19
CHAPTER
15
Sound Recording
This chapter describes the digital sound recording
features associated with the optional firmware 831-SR.
This feature is not intended for recordings over extended
time periods, such as “all day” recordings. We
recommend the use of an external recorder connected to
the Model 831 AC output for these types of applications.
Sound Recording Types
There are four types of sound recordings described in this
chapter:
•
Manual Sound Recording: described in "Manual
Sound Recording" on page 15-7
•
Marker Initiated Sound Recordings: described in
"Marker Initiated Recording" on page 15-10
•
Event Sound Recordings (Option 831-ELA required):
described in "Event Sound Recording" on page 15-15
•
Measurement Sound Recordings (Option 831-ELA
required): described in "Measurement History Sound
Recording" on page 15-19:
The main difference between them is how the recordings are
initiated. With manual and marker initiated recordings, the
user must initiate each recording. With event recording, the
exceedance of a threshold sound level automatically initiates
the recording. With measurement recording, a segment at the
beginning of each measurement history record is
automatically recorded. Note that both event and
measurement sound recordings can be enabled at the same
time.
Model 831 Manual
Sound Recording
15-1
Sound Recording Setup
The Sound Recording feature of the Model 831 implements
the digital recording of the sound signal output from the
measurement microphone. Regardless of the sound
recording type(s) to be utilized, the basic recording
parameters are set as described in this section.
Note that the default values for these
parameters are as shown in
FIGURE 15-1.
Sound Recording is setup using the Sound tab page of the
Measurement Setup View, as shown in Figure 15-1.
FIGURE 15-1 Sound Recording Setup Menu
Sample Rate
The Sound Recorder feature of the Model 831 is a powerful
tool for source identification and for advanced analysis. The
sample rates used for source identification are 8k, and 16k
sps (samples per second) and the sample rates used for
advanced analysis are 24k and 48k sps.
Sample Rate Selection
The Sample Rate data field is used to select the sample rate
for the digital data recording. Highlight this field and press
15-2
Sound Recording Setup
Model 831 Technical Reference Manual
5
the
key to open the Sample Rate Menu shown in
Figure 15-2
FIGURE 15-2 Sample Rate Menu
Highlight the desired sample rate and press the
make a selection.
5 key to
Source Identification Setup
Sample rates above 16k sps are not
available for source identification
recording (see Restrictions below)
The 8k sps setting is generally sufficient for a quality sound
recording that can be used for source identification and
provides the lowest memory consumption. The sound
recording can be recorded automatically by enabling the
Event Recorder (see “Event Sound Recording” on page -15),
Measurement History (see “Measurement History Sound
Recording” on page -19) or manually by enabling Markers
sound recording and then activating a marker (see “Manual
Sound Recording” on page -7).
Advanced Analysis
Be sure to disable the Time History,
Event History or Marker Sound
Record options in order to use the
sound recorder at 24k and 48k sps
(see restrictions below).
To record sound information for advanced analysis, enable
the Measurement History and the Measurement Sound
Recorder settings (see “Measurement History Sound
Recording” on page -19). The sample rate can be 8k, 16k,
24k or 48k sps, with 48k sps offering the highest frequency
bandwidth.
When a measurement is performed by pressing the Run key
(or at a programmed interval), a sound recording file will be
created for the duration specified (unless stopped manually
prior to a complete duration). The resulting sound recording
file can then be downloaded and exported with SLM UtilityG3. The exported wave file can be analyzed with a software
package such as MatLab.
Restrictions
It is not possible to use the sound recorder at 24k and 48k at
the same time as the Time History, Event History or Marker
Sound Recording options. When any of these features are
activated while the sample rate is set to 24k or 48k, the
Model 831 Technical Reference Manual
Sound Recording Setup
15-3
Setting Conflict message shown in FIGURE 15-3 will
appear.
FIGURE 15-3 Setting Conflict Message
The Sound Recorder Sample Rate will be automatically set
to 8k sps if Yes is chosen, or, the feature will not be enabled
if No is chosen.
If any of the History, Event History or Marker Sound Record
options are enabled, the list of sound recorder Sample Rate
options will be 8k and 16k sps, as shown in the next image,
and sound record is enable for source identification.
Effect of Sample Rate
A formula for calculating the
memory size of sound recordings is
given in the section "Sound
Recording" on page 26-3.
A general rule of thumb is that the playback of a digital
sound recording will provide accurate reproduction of
frequency content up to 0.48 times the recording sample
rate. Thus, a 48 kHz sample rate would provide a recording
having good fidelity over the complete human hearing
range. The drawback is that the size of the recording data
block is proportional to the sample rate. If the upper
frequency content of the signal is known, the sample rate
can be reduced to match it. For example, in terms of
comprehension, human speech would be satisfactorily
reproduced using a sample rate of 8 kHz.
Range
There are two amplitude ranges used for sound recording:
The following section provides
guidance in the selection of range
setting.
15-4
•
Low (default value)
•
High
These have a 33 dB gain difference between them. They are
similar to the two ranges available for use with the 1/1 and 1/
3 octave band filters, described in "OBA Range Setting" on
page 4-7. See FIGURE 24-3 "Block Diagram of Model 831”
on page 24-3 to see how these two ranges are implemented
in the Model 831. To select the range, highlight the Range
Sound Recording Setup
Model 831 Technical Reference Manual
field and press the
in Figure 15-4.
5 key to open the Range Menu shown
FIGURE 15-4 Range Menu
Highlight the desired sample rate and press the
make a selection.
5 key to
Sound Recording Range
A/D Convertor
The 16-bit A/D convertor used for sound recording provides
a measurement range of approximately 90 dB. This means
that it is capable of recording sound signals whose
amplitudes are no more than 90 dB below the level at which
the instrument will overload. When the overload level is
expressed in terms of peak level and the signal level as rootmean-square (rms), this range is actually 93 dB. Note,
however, that in practice this lower limit can be limited by
the internal noise floor of the instrument.
Peak Overload/Noise Level
In the section "Sensitivity Page" on page 21-13, it is shown
how the Microphone Page of the Calibration Menu can be
used to determine the peak overload level and the Zweighted noise level of the Model 831 for a specific
instrument setup using a microphone having a given
sensitivity. Since the Model 831 can be setup to have a gain
of either 0 or 20 dB, as described in "20 dB Gain" on page 45, there are two possible values of peak overload level and
noise level for a given microphone.
Sound Recording Range Calculation
When the peak sound level and noise level values have been
determined for the Model 831 using a specific microphone,
the useful sound recording range can now be determined as
shown in Table 15-15-1. In this example, the peak sound
levels and noise levels correspond to a microphone having a
nominal sensitivity of 50 mV/Pa.
Model 831 Technical Reference Manual
Sound Recording Setup
15-5
Step 1 For each combination of Instrument Gain (0 or 20
dB) and (Low or High), enter the peak overload level values
in the 3rd row. For the High range use the values determined
as described in "Peak Overload/Noise Level" on page 15-5.
For the Low Range, subtract 33 dB from the High range
value.
Step 2 For each column, subtract 93 dB from each peak
overload level to obtain the lower level of A/D range and
enter this in the 4th row.
Step 3 For each column, enter the value of noise floor in
the 5th row.
Step 4 For each column, determine the sound recording
range. The lower limit will be the larger of the lower level of
A/D range and the instrument noise floor. The upper limit
will be the peak overload level
Instrument Gain
0 dB
0 dB
20 dB
20 dB
Range
High
Low
High
Low
Peak Overload Level
143 dB
110 dB
123 dB
90 dB
Lower Level of A/D
Range
50 dB
17 dB
30 dB
-7 dB
Instrument Noise Floor
23 dB
23 dB
21 dB
21 dB
23 - 110 dB
30 - 123 dB 21 - 90 dB
Sound Recording Range 50 - 143 dB
Table 15-1 Sound Recording Range Calculation: Microphone Sensitivity
of 50 mV/Pa
The quality of a sound recording will depend upon the levels
of sound being recorded and the choice of instrument gain
and range used in the instrument setup. Should the sound
level exceed the peak overload level, there will be clipping
of the signal which will introduce distortion into the
playback. If the sound level drops below the lower limit of
the sound recording range, its signal will be lost in noise
during playback. Thus, the selection of instrument gain and
recording range should be made to meet the characteristics
of the sounds being recorded.
When measuring very loud noise levels (gun blasts, sonic
booms, space shuttle lift off) use the High range. When
15-6
Sound Recording Setup
Model 831 Technical Reference Manual
trying to identify quiet noise sources (crickets, airplanes
flying at 30000', national park soundscape studies, people
talking in the vicinity of the microphone) and don't mind the
very loud noises being clipped (distorted), use the Low
range. The low range is like turning up the volume on a tape
recorder input; if the sound gets too loud it will clip and
distort the recording but you will be able to hear the quiet
noises more clearly. Turning the volume control down may
drop the quiet sounds below the background noise and make
them inaudible, but the louder sounds will be heard with
greater fidelity.
Manual Sound Recording
Note that sound recordings can only
be made when the instrument is
running. If the unit is stopped, the
Rec softkey will not appear.
A manually initiated sound recording can be made from any
of the following screens, as illustrated in
•
Profile Page of the Live tab
•
Session Log tab (while running)
•
Time History tab (while running)
FIGURE 15-5 Screens for Initiating a Manual Sound Recording
Model 831 Technical Reference Manual
Manual Sound Recording
15-7
5
Highlight Mark Sound Type and
key to obtain the
Markers Setup Menu shown in FIGURE 15-6.
Sound Recording
Status Icon
FIGURE 15-6 Markers Setup Menu
Initiate a Manual Sound Recording
When a recording is in progress, the
Recording Status Icon, shown greyed
out in Figure 15-6, will become
active, as shown in Figure 15-7.
Press the Rec softkey to initiate a sound recording. The
recording will continue until the recording is manually
stopped.
When the recording has begun, the Rec softkey will be
replaced by a Stop softkey, as shown in FIGURE 15-7
FIGURE 15-7 Markers Setup Menu, Sound
Recording in Progress
15-8
Manual Sound Recording
Model 831 Technical Reference Manual
Stop a Manual Recording
Pressing any of the following keys will stop the sound
recording:
The sound recording will also stop
when the memory is full. Note that if
left recording, the memory will fill
and create very large files that will
be time consuming to download and
playback.
Model 831 Technical Reference Manual
•
Stop softkey
•
None softkey
•
Close softkey
•
7 (STOP/STORE) key
Manual Sound Recording
15-9
Marker Initiated Recording
Markers are also with Time History
measurements, described in Chapter
10 "Time History” on page 10-1,
which requires the optional firmware
831-LOG.
In order to identify the source or some other characteristic of
a sound being recorded, the user can define up to ten
markers and attach one or more marker(s) to a sound
recording. These markers can then be used to initiate sound
recordings from the markers setup menu.
Markers Setup
Note that the default values for these
parameters are as shown in
FIGURE 15-8.
Markers are setup using the Markers tab page of the
Measurement Setup View, as shown in Figure 15-8.
FIGURE 15-8 Markers Setup Window,
Markers 1 - 5
There are five markers with names predefined for
convenience shown in this figure. Any of these names can
be changed by the user. To view markers 6 -10, highlight the
6 - 10 text line and radio buttons and press the
key to
obtain the display shown in Figure 15-9.
5
15-10
Marker Initiated Recording Model 831 Technical Reference Manual
FIGURE 15-9 Markers Setup Window,
Markers 6 - 10
Naming a Marker
Note that the process of naming
markers is simplified by using the
831 Utility software.
Highlight the field of the marker to be named and press the
5 key. This will produce a cursor which can be moved
left and right to different digit positions in the data field
using the 4 and 6 keys, as shown in Figure 15-10.
FIGURE 15-10 Marker Name Field
Enter a marker name and press the
process.
5 key to conclude the
Setting a Marker to Record
In order to utilize one or more markers to initiate a sound
recording, we set each of the markers we would like to use
to initiate a recording to Record. This is done by
highlighting the marker and pressing the
key. In
FIGURE 15-11, we have created a setup whereby a
recording can be initiated by either the Truck marker or the
Motorcycle marker
5
Model 831 Technical Reference Manual
Marker Initiated Recording
15-11
FIGURE 15-11 Two Markers Set To Record
Recording Time Setup
Sound recordings initiated by markers will record for a userdefined recording time following the initiation of the
recording. In addition, the user can select to have each
recording also include the sound signal which existed for a
user-defined time period prior to the initiation of the
recording, called the pre-trigger time.
Pre-trigger Time
The range of the manual recording
pre-trigger time is 0 to 9 seconds.
If it is desired that the recorded signal include a segment of
sound which occurred prior to the initiation of the recording,
set the Pre-trigger to the length of that time segment.
To enter the Pre-trigger Time, highlight the Pre-trigger data
field and press the
key to open the Pre-trigger Time
data field and cursor shown in Figure 15-12.
5
FIGURE 15-12 Entering Pre-trigger Time for
Event Sound Recording
Enter the desired value and press the
the process.
15-12
5 key to conclude
Marker Initiated Recording Model 831 Technical Reference Manual
Recording Time
Note that the maximum value of
Recording Time which can be
entered is 9,999 seconds. However,
the maximum time of an actual
recording may be limited by the
sample rate and the memory size.
The Recording Time is the duration of each recording. To
enter the Recording Time, highlight the Recording Time
data field and press the
key to open the Recording
Time data field and cursor shown in FIGURE 15-13.
5
FIGURE 15-13 Entering Recording Time for
Sound Recording
Enter the desired value and press the
the process.
5 key to conclude
Initiating a Recording
A marker initiated sound recording is started using the same
menu used to initiate a manual recording. Follow the same
procedure described in "Manual Sound Recording" on page
15-7 to open the menu shown in FIGURE 15-14.
FIGURE 15-14 Markers Setup Menu
Set Marker to On
To initiate a sound recording, set On any marker which had
been designated Record, as described in "Setting a Marker
to Record" on page 15-11. To do this, highlight the name of
the desired marker and press the
key to place a check
5
Model 831 Technical Reference Manual
Marker Initiated Recording
15-13
in the check box to the left of the name, as shown in
FIGURE 15-15.
FIGURE 15-15 Marker Set to On
Press the Close softkey, shown in FIGURE 15-14, to
complete the process of setting the Marker to On and to exit
from the Mark Sound Type Menu. This will initiate the
recording.
When a recording is in progress, the
Recording Status Icon, shown greyed
out in Figure 15-6, will become
active.
The recording will continue for the programmed Recording
Time, even if the maker is set Off before that amount of time
has passed.
Once one or more markers have been set to On and the
recording initiated, they should all then be set to Off so that
a subsequent recording may be initiated at a later time.
Set Markers to Off
To set all markers to Off, repeat the steps used to open the
Mark Sound Type Menu, shown in FIGURE 15-14. Press
the None softkey to set all Markers to Off and press the
Close softkey.
All markers will also be set to Off if the measurement is
stopped by pressing the 7 (STOP/STORE) key
15-14
Marker Initiated Recording Model 831 Technical Reference Manual
Event Sound Recording
Sound recordings can be made
automatically upon exceedance of
the event threshold levels (see
"Triggers Page" on page 4-11)
without the optional 831-ELA
firmware enabled. However, to have
data stored for these exceedance
events (see Chapter 12 "Event
History” on page 12-1) the 831-ELA
firmware must be enabled.
Event Sound Recording is used to automatically make a
sound recording for each exceedance-based event. Highlight
the Save Snapshot text field in the Event Sound Recording
section of the display (Figure 15-1 on page 15-2) and press
the
key to place a check in the check box. This will is
modify the Event Sound Recording section of the Sound
Recording Setup Menu as shown in Figure 15-17
5
FIGURE 15-16 Event Sound Recording Menu
Snapshot Time
Note that the maximum value of
Snapshot Time which can be entered
is 999 seconds. However, the
maximum time of an actual
recording may be limited by the
sample rate and the memory size.
The Snapshot Time is the duration of each Event Sound
Recording. To enter the Snapshot Time, highlight the
Snapshot data field and press the
key to open the
Snapshot Time data field and cursor shown in Figure 15-17.
5
FIGURE 15-17 Entering Snapshot Time for
Event Sound Recording
Note that the snapshot time must be
greater than the event minimum
duration, as set in "Minimum
Duration" on page 12-2, in order for
a recording to be made.
Enter the desired value and press the
the process.
5 key to conclude
Pre-trigger Time
If it is desired that the recorded signal include a segment of
time which occurred prior to the exceedance-based trigger,
set the Pre-trigger Time to that value. Highlight the Pretrigger data field and press the
key to open the Pretrigger Time data field and cursor shown in Figure 15-18.
5
FIGURE 15-18 Entering Pre-triggerTime for
Event Sound Recording
Model 831 Technical Reference Manual
Event Sound Recording
15-15
5
Enter the desired value and press the
key to conclude
the process.
Note that the maximum value of Pre-trigger Time is 9
seconds.
Additional Considerations
The implementation of event sound recordings involves the
interaction of parameters from both the Event History Page
and the Sound Page as follows:
Event Time History Setup
•
Minimum Duration
•
Continuation Period
Sound Setup
•
Snapshot Time
•
Pre-Trigger Time
Several examples of how these parameters effect the length
of the sound recording are presented in the following
diagrams.
Snapshot Time
Pre-Trigger
Time
Minimum
Duration
Threshold
Exceedance
No Recording: Level Drops
Below Threshold Before
Minimum Duration
FIGURE 15-19 Less Than Minimum Duration: No Event/No Recording
15-16
Event Sound Recording
Model 831 Technical Reference Manual
Recording Time
Snapshot Time
Pre-Trigger
Time
Minimum
Duration
Threshold Exceedance
Drops Below Threshold
FIGURE 15-20 Stops When Level Drops Below Threshold: Valid
Event/Recording
Recording Time
Snapshot Time
Pre-Trigger
Time
Minimum
Duration
Threshold Exceedance
Drops Below Threshold
Below Threshold Less Than Continuation
Period; Event Continues
FIGURE 15-21 Stops When Level Drops Below Threshold After
Continuation: Valid Event/Recording
Model 831 Technical Reference Manual
Event Sound Recording
15-17
Recording Time
Snapsot Time
Pre-Trigger
Time
Minimum
Duration
Stops Recording When
Snapshot Time is Reached
Threshold Exceedance
FIGURE 15-22 Stops When Reaches Snapshot Time: Valid Event/
Recording:
Recording Time
Snapshot Time
Pre-Trigger
Time
Minimum
Duration
Stops Recording When
Snapshot Time is
Reached
Threshold Exceedance
Below Threshold Less Than
Continuation Period; Event
Continues
FIGURE 15-23 Stops When Reaches Snapshot Time After Continuation:
Valid Event/Recording:
15-18
Event Sound Recording
Model 831 Technical Reference Manual
Pre-trigger Time/Minimum Duration Criterion
Due to the manner in which the data are stored, the event
pre-trigger time plus the minimum event duration must be
less than the criterion time shown in Table 15-16, which is a
function of the selected sample rate.
Sample Rate, kHz
Criterion Time, s
48
10
24
18.9
16
18.9
8
18.9
Table 14-16 Pre-trigger Time/Min Duration Criterion
Recording Status Icon
When a recording is in progress, the Recording Status Icon,
shown greyed out in Figure 15-6, will become active. The
icon does not show when the pre-trigger buffer is being
filled, only when the level is over the defined exceedance
trigger level,
Measurement History Sound Recording
The optional firmware 831-ELA
must be enabled for Measurement
Sound Recording.
Highlight the Save Snapshot text field in the Measurement
Sound Recording section of the display and press the
key to place a check in the check box. This will modify the
Measurement Sound Recording section of the Sound
Recording Setup Menu as shown in Figure 15-24
5
FIGURE 15-24 Measurement Sound
Recording Menu
Model 831 Technical Reference Manual
Measurement History Sound Recording
15-19
Snapshot Time
Note that the maximum value of
Snapshot Time which can be entered
is 9,999 seconds. However, the
maximum time of an actual
recording may be limited by the
sample rate and the memory size.
The Snapshot Time is the duration each Measurement Sound
Recording. To enter the Snapshot Time, highlight the
Snapshot data field and press the
key. This will
produce a cursor which can be moved left and right to
different digit positions in the data field using the 4 and 6
keys, as shown in Figure 15-17.
5
FIGURE 15-25 Entering Snapshot Time for
Measurement Sound
Recording
Enter the desired value and press the
the process.
5 key to conclude
5
Press
key to enable the Time History functionality and
to place a check in the Enable Time History check box. This
will add additional items to the Time History setup menu, as
shown in
Recording Status Icon
When a recording is in progress, the Recording Status Icon,
shown greyed out in Figure 15-6, will become active.
Combined Sound Recordings
Only one sound recording can be made at a time. As a result,
should a sound recording be initiated, manually or
automatically, while a sound recording is already in
progress, the original sound recording will continue.
However, should the parameters for the second recording
call for that recording to be concluded at a time later than
that defined by the parameters of the first recording, the
original recording would continue until the parameters of the
second recording are satisfied.
More generally, when a sound recording is initiated, a
counter is begun to define when that recording should stop.
If during that recording one or more additional recordings
are initiated, a counter will be begun for each, even though
the same recording is continued rather than a series of
separate recordings. The original recording will then stop
when the counters of all recordings have counted down to
15-20
Combined Sound Recordings Model 831 Technical Reference Manual
zero, indicating that the time interval of that recording
encompasses all the data which would have been recorded
by those separate recordings.
Sound Recording Playback
When using the SLM Utility-G3
software, sound recordings can be
played back through the computer
speakers and saved as Windows .wav
files.
In this section we present several methods for playing back
sound recordings from the Model 831 and listening to them
using headphones connected to the AC/DC Output and
Headset Jack.
Playback from Session Log
All sound and voice recordings are listed in order of
recording time on the Session Log Page, as shown in
FIGURE 15-13.
FIGURE 15-26 Sound Recordings on Session Log
Any of these recordings can be played back by using the
2 and 8 keys to highlight the desired recording and
pressing the
key.
5
Recording Type Indication
The type of each recording can be identified by highlighting
the specific recording file as indicated below.
Model 831 Technical Reference Manual
Sound Recording Playback
15-21
Manual Sound Recording
Sound recordings which have been recorded manually using
the Marker function will be indicated by the text “Markers
Record” as shown in FIGURE 15-27.
FIGURE 15-27 Manual Sound Record
Measurement Sound Recording
Sound recordings implemented automatically at the
beginning of Measurement History periods are identified by
the text “Measurement Record” as shown in FIGURE 15-28.
FIGURE 15-28 Measurement Sound Record
Noise Event Sound Recording
Sound recordings implemented automatically as a result of
noise events are identified by the text “Event Record” as
shown in FIGURE 15-29.
FIGURE 15-29 Noise Event Sound Record
Combined Recording
A combined sound recording, described in "Combined
Sound Recordings" on page 15-20, is identified by the
recording type of the first recording which initiated the
recording process.
15-22
Sound Recording Playback Model 831 Technical Reference Manual
Voice Recording
Voice recording, discussed in Chapter 9 "Voice Recording”
on page 9-1, will also appear with a speaker logo in the
Session Log. When highlighted, these can be differentiated
from sound recordings by the heading “Voice” instead of
“Sound”, as shown in FIGURE 15-30.
FIGURE 15-30 Voice Annotation Record
Playback from Data Display Screen
In addition to playback from the Session Log Page, both
Event Sound Recordings and Measurement Recordings can
also be played back from their first data display screens as
described below.
This is an alternative playback
method to using the Session Log.
Note that this playback method can
only be used prior to saving the
measurement.
Event Sound Recordings
When Event Sound Recording had been enabled during the
measurement period, a sound recording icon will appear
along with the Leq data for each event record, as shown in
FIGURE 15-31.
Sound Recording Icon
FIGURE 15-31 Sound Recording Playback; Event Recordings
To play back the recording for this record, press the Menu
key to obtain the menu shown in FIGURE 15-32
FIGURE 15-32 Menu
Model 831 Technical Reference Manual
Sound Recording Playback
15-23
The Model 831 must be stopped in
order to perform a playback in this
manner. If the instrument is running
when the playback is attempted, a
screen will be displayed to permit
the user to stop the instrument.
Select Yes and the playback will
begin immediately.
Highlight Playback and press the
sound recording.
5 key to playback this
Measurement Recordings
When Measurement Sound Recording had been enabled
during the measurement period, a sound recording icon will
appear along with the Leq data for each measurement
history event record, as shown in FIGURE 15-33.
FIGURE 15-33 Sound Recording Playback;
Measurement Recordings
To play back the recording for the displayed record, press
the Menu key to obtain the menu shown in FIGURE 15-34
FIGURE 15-34 Menu
The Model 831 must be stopped in
order to perform a playback in this
manner. If the instrument is running
when the playback is attempted, a
screen will be displayed to permit
the user to stop the instrument.
Select Yes and the playback will
begin immediately.
15-24
Highlight Playback and press the
sound recording.
5 key to play back this
Sound Recording Playback Model 831 Technical Reference Manual
CHAPTER
16
Data Explorer
Control Panel - Data Explorer
To activate the Data Explorer Page, press the 3 (TOOLS)
key. Highlight the Data Explorer icon as shown in FIGURE
16-1.
FIGURE 16-1 Control Panel
Press the
5 key to open the Data Explorer Page.
Press the Close Softkey to exit from this page.
Model 831 Technical Reference Manual
Data Explorer
16-1
Data Explorer
There is one Data Explorer Page. It shows a directory of all
saved data files. Data files saved to internal memory are
listed first, followed by data files saved on the USB memory
device. The files saved to the USB device are denoted by a
small flash memory icon as shown in FIGURE 16-2. There
is a scroll bar to indicate the relative position in the list of
data files. There may be more data files in the directory than
are displayed on this page. All files may be viewed by
scrolling through the list.
USB Memory
File Icon
FIGURE 16-2 Data Explorer
Note that the USB Host Port must be
set to On, as described in ‘USB Host
Port” on page 17-14, in order for
the Data Explorer to access data
saved on a USB memory device.
16-2
Using the 8 and 2 keys you can scroll through the list
of data files. As each file is selected you get an expanded
view of the directory entry showing:
•
File name
•
Start date and time of measurement
•
End date and time of measurement
•
Run time of measurement
•
Size of Measurement File
Data Explorer
Model 831 Technical Reference Manual
Scrolling
There are two modes of scrolling available:
•
By item
•
By page
Pressing the left softkey will toggle between these two
modes.
By item
“By item”, shown in FIGURE 16-2, is the default scrolling
mode. Using this mode, the window presenting information
for the selected file moves down or up one file at a time
when pressing the 2 or 8 keys, respectively.
By page
When working with a large number of files, the “By page”
scrolling mode will shift the listing of files down or up one
page at a time, when pressing the 2 or 8 keys,
respectively. When the desired file appear, shift to the “By
item” mode to select a particular file.
Model 831 Technical Reference Manual
Data Explorer
16-3
Menu Softkey
5
Press the
key to view the data file or press the Right
Softkey labeled Menu for more options.
FIGURE 16-3 Data Explorer Menu
5
Highlight the desired function and press the
key to
execute the function selected. To leave this menu without
taking any action press the Close Softkey.
View
The View function opens a data view of the selected data
file.
FIGURE 16-4 Data View Page
The Data View screen is similar to the Data Display screen.
The information found in the sections of the Data Page are
16-4
Data Explorer
Model 831 Technical Reference Manual
similar to the Data Display, Overall Page. See ‘Overall
Page” on page 5-12.
The file name of the data file being displayed is found in the
title bar near the top of the screen.
For information on the Session Log Page see ‘Session Log
Page” on page 5-24.
Press the Center Softkey labeled Close to return to the Data
Explorer view.
Delete
The Delete menu item deletes the highlighted stored data
file. The prompt shown in FIGURE 16-5 will be displayed.
FIGURE 16-5 Delete File
Highlight the appropriate response and press the
5 key.
Delete All Internal
Note that the file number used for the
file names will be reset to 001 when
the Delete All Internal is performed.
The Delete All Internal menu item will delete all files saved
to the internal memory of the Model 831. The prompt shown
in FIGURE 16-6 will be displayed.
FIGURE 16-6 Delete All Files Prompt
Highlight the appropriate response and press the
5 key.
Delete All USB
The Delete All USB menu item will delete all files saved on
the USB device. The prompt shown in FIGURE 16-6 will be
displayed; respond as appropriate.
Model 831 Technical Reference Manual
Data Explorer
16-5
Rename
The Rename menu item enables you to change the name of
the selected data file. Pressing the
key brings up a
message box for editing the file name.
5
FIGURE 16-7 Rename File
5
Highlight the text box with the file name, press the
key, modify the name as desired and press the
key to
complete the changes.
5
Highlight the Yes button to accept the changes or the No
button to discard the changes and press the
key.
5
If your new file name is the same as a file already in the
directory, an Overwrite message box will appear. See
FIGURE 16-9. If you select Yes, then the old file will be
over written with the newly named file. A response of No
will return the Rename message box.
Another method of renaming a file is to Overwrite an old
file. Highlight the “...” button and press the
key to
display a list of file names. This feature will allow you to
select the name of an existing file and replace that file with
the file you are renaming. See FIGURE 16-8.
5
FIGURE 16-8 File Name List
16-6
Data Explorer
Model 831 Technical Reference Manual
Highlight a name from the list and press the
5 key.
FIGURE 16-9 Overwrite Confirmation
A message box will appear requesting confirmation of the
desired action. Select the desired response and press the
key. If you select Yes, then the old file will be over
written with the selected file. A response of No will return to
the Rename message box.
5
Model 831 Technical Reference Manual
Data Explorer
16-7
Move to USB
The Move to USB menu item will transfer a highlighted
internal memory data file to the USB memory device. There
will be a pause as the data is transferred. During this time,
the icon shown below will appear to show the transfer is in
progress.
At the end of this time, the message shown in FIGURE 1610 will be displayed to indicate that the transfer has been
completed.
FIGURE 16-10 USB Copy Complete Message
If a file with the same name already exists on the USB
memory device when the move is initiated, the message
shown in FIGURE 16-11 will indicate this and the file move
will not be implemented.
FIGURE 16-11 USB File Already Exists Message
If the file size is larger than the available free space on the
USB drive, the file will not be copied and the message
shown in will appear.
FIGURE 16-12 Insufficient Space on USB Drive
Message
16-8
Data Explorer
Model 831 Technical Reference Manual
Move All to USB
The Move All to USB menu item will transfer all files on the
internal flash memory to the USB memory device. The
procedure is similar to that described in "Move to USB" on
page 16-8.
If the attached USB Flash Drive (or mass storage device)
already has a file named the same as one being moved from
internal memory, the instrument will automatically alter the
name so that it will be unique.
For standard files that are named with the user selected
default filename and a three digit sequential number
extension (831_Data.001), the first number in the extension
will be changed to a letter, from "A" through "Z", that offers
a unique filename and will then be saved to the USB Flash
Drive. The filename on the internal drive will not be altered.
For auto-store files (one whose name is made from the date
of measurement, i.e. 08010700.LD0) the digit of the
extension will be incremented from 0 through 9 (i.e. LD0,
LD1, and so on to LD9). If this method does not succeed in
creating a unique filename then the extension will be
changed to "A00" and the "A" will be changed, if needed, up
through "Z" until a unique filename is found.
If a unique filename cannot be determined by these methods
then the file will not be copied to the USB Flash Drive, but
will remain on the internal drive:
Example 1
The USB Flash Drive has been used as a transport for data
and currently contains files named 831_Data.001,
831_Data.002 and 831_Data.003. Perhaps I forgot to erase
the drive, but more likely I just like to keep an extra copy of
the data as a backup. The data inside the instrument was
reset and deleted with the Delete All Internal command from
Data Explorer so that new data files were named the same as
previously (starting the sequence number over at 001). More
data has been taken and the internal drive has two files
named 831_Data.001 and 831_Data.002. When you perform
a Move all to USB from the Data Explorer memory the
filename conflict will be detected and the names of the files
that will actually be stored to the USB Flash Drive will be
named 831_Data.A01 and 831_Data.A02. If I did this again
Model 831 Technical Reference Manual
Data Explorer
16-9
the new files would be named 831_Data.B01 and
831_Data.B02.
Example 2
The USB Flash Drive is being used to transport data from
three instruments used as remote noise monitors that
automatically do daily auto-stores. There are data for one
week on each instrument for a total of seven files each. All
seven files are moved to the USB Flash Drive from the first
instrument, 08010700.LD0 through 08011300.LD0. At the
second instrument, that has seven files with the exact names,
a Move All to USB is performed. This time the files stored
to the USB Flash Drive have a name conflict and will
actually
be
stored
as
08010700.LD1
through
08011300.LD1. At the third location we do the same thing
and now the USB Flash Drive has 08010700.LD2 through
08011300.LD2 added to it.
Refresh List
The Refresh List menu item will refresh the file list on the
Data Explorer Page.
Load Settings
Using the Load Settings Menu item, a new measurement
may be run with the exact same parameters as the selected
measurement. When the
key is pressed, the parameters
from the selected measurement are loaded so a new
measurement may be made. This is a convenient method to
duplicate a previous measurement.
5
Jump to Beginning
The Jump to Beginning menu item will select the first data
file listed.
Jump to End
The Jump to End menu item will select the last data file
listed.
16-10
Data Explorer
Model 831 Technical Reference Manual
Model 831 Technical Reference Manual
Data Explorer
16-11
16-12
Data Explorer
Model 831 Technical Reference Manual
CHAPTER
17
System Properties
The System Property Pages are used to identify and / or
control functions of the Model 831 that are not related to
sound measurement or calculations.
Control Panel - System Properties
To activate the System Property Pages, press the 3
(TOOLS) key. Highlight the System Properties icon as
shown in FIGURE 17-1 "Control Panel" .
FIGURE 17-1 Control Panel
Press the
5 key to open the System Property Pages.
There are six System Property Pages that may be selected
using the Right and Left Softkeys. All System Property
Pages have one section.
Model 831 Technical Reference Manual
System Properties
17-1
Device
The Device Page has three fields in which the user may enter
information about the instrument. This can identify the
owners company name and address. Information may be
easily placed in these fields using the SLM Utility-G3
software.
FIGURE 17-2 Device Page
Highlight one of the three fields to edit. Enter the desired
text and press the
key to accept the information and
move the highlight out of the field. At this point another
field can be selected and the above process repeated.
5
17-2
Device
Model 831 Technical Reference Manual
Time
The time and date for the Model 831 may be adjusted on the
time page.
FIGURE 17-3 Time Page
Setting Day and Year
Highlight the data field of the numerical parameter to
modify. Enter the desired values and press the
key
when modifications are complete.
5
Selecting the Month
5 key
When the Month box is highlighted, pressing the
will drop down a list of months. See FIGURE 17-4.
FIGURE 17-4 Month List
Model 831 Technical Reference Manual
Time
17-3
Highlight the desired month and press the
accept the selection and exit the field.
5
key to
Selecting the "Sync Date/Time with PC" check box enables
the Model 831 time to be set to the PC time when the unit is
connected to the 831 Utility software. This function is
enabled if there is an X in the check box. To modify the state
of the check box, move the highlight to the check box and
press
key. The state of the check box will change.
5
17-4
Time
Model 831 Technical Reference Manual
Power
Note that the default values for these
parameters are as shown in
FIGURE 17-5.
FIGURE 17-5 Power Page
There are five drop down list fields and one scrollable value
field on the Power Page. These fields are selected and
modified as discussed in the previous sections.
Battery Type
For more detailed information on
the selection of battery type see
"Batteries" on page 24-10.
This parameters identifies the type of battery installed in the
Model 831. This information is used for the calculation of
battery life.
To set the battery type, highlight the Battery Type data field
and press the
key to open the Battery Type Menu,
shown in FIGURE 17-7.
5
FIGURE 17-6 Battery Type Menu
Highlight the desired time and press the
selection.
Model 831 Technical Reference Manual
Power
5 key to make a
17-5
Battery type must be set to NiMH or Lithium to charge.
The default value is “Alkaline”.
WARNING:Do not mix Alkaline and NiMH batteries.
WARNING:Do not mix batteries from different
manufacturers
WARNING:Replace all four batteries when installing
fresh cells
WARNING:The correct battery type must be specified,
as described in "Battery Type" on page 17-5, based on
the battery type installed. Otherwise, serious damage,
injury or fire can occur when the battery type is set to
NiMH but Alkaline or Lithium batteries are installed
because the internal charger will be enabled. Alkaline or
Lithium batteries must not be charged.
Auto-Off Time
Auto-Off time is the duration of time the instrument will
stay on when no activity is occurring: button presses,
running a measurement, USB communications, etc.
Pressing the 0 (ON / OFF) key will return the instrument
and the display to the state it was in when the Auto-Off time
expired.
The auto-off feature is ignored when connected to external
power (assumed to mean when not on internal batteries
which includes USB and External Power). When the unit is
connected to USB power, the feature is ignored but when it
is connect to external power (12 Vdc) it is not ignored.
To set the Auto-off Time, highlight the Auto-Off Time data
field and press the
key to open the Auto-Off Time
Menu, shown in FIGURE 17-7.
5
FIGURE 17-7 Auto-Off Time Menu
17-6
Power
Model 831 Technical Reference Manual
Highlight the desired time and press the
selection.
5 key to make a
The default value is “Never”.
Power-Save Time
In the power save mode, battery power is significantly
reduced by shutting down the display and analog circuitry
and ceasing signal processing activities.
There are two power saving features controlled by the
Power-Save Time setting. Power can be shut off to the
display and to the analog circuitry to save power when the
Power-Save Time is set to a value other than Never.
The display will be powered down when no keys on the
instrument have been pressed for the time set. Pressing any
key will reactivate the display.
The analog circuitry, including power to the preamplifier.
will be shut down when the instrument has been stopped for
the time set. Pressing the 9 (RUN / PAUSE) key will
restore power to the analog circuitry and the instrument can
take data in a number of seconds.
To set the Power-Save Time, highlight the Power-Save Time
data field in the System Properties-Power tab and press the
key to open the Power-Save Time Menu, shown in
FIGURE 17-8.
5
FIGURE 17-8 Power-Save Time Menu
Highlight the desired time and press the
selection.
5 key to make a
The default value is “Never”.
Model 831 Technical Reference Manual
Power
17-7
Power Save Icon
When the Model 831 is in the power save mode, the power
save icon
will be displayed in the location where the measurement
status icons, described in "Measurement Status" on page 3-5,
usually appear.
Exit from Power Save Mode
Press any of the following keys to exit from the power save
mode:
•
7 (STOP/STORE)
•
1 (RESET)
•
9 (RUN / PAUSE): There will be a few seconds delay
before the instrument starts recording data.
The following actions will also cause an exit from the power
save mode:
17-8
•
Calibrate
•
Record (voice or sound recording)
•
Play (voice or sound recording)
Power
Model 831 Technical Reference Manual
Backlight Time
This sets the duration of time the backlight remains on after
the last key press.
To set the Backlight Time, highlight the Backlight Time data
field and press the
key to open the Backlight Time
Menu, shown in FIGURE 17-9.
5
FIGURE 17-9 Backlight Time Menu
Highlight the desired time and press the
selection.
5 key to make a
The default is “10 sec”.
Backlight
Note that using the backlight on
bright setting will significantly
increase power consumption and
decrease battery life
This field sets the intensity of the backlight. To set
Backlight, highlight the Backlight data field and press the
key to open the Backlight Menu, shown in FIGURE
17-9.
5
FIGURE 17-10 Backlight Menu
Highlight the desired time and press the
selection.
5 key to make a
The default is Off.
Backlight can also be set by pressing the key as described in
the section ‘ON/OFF Key” on page 3-7.
Exceptions
There are several situations which will affect the backlight
and its intensity as follows:
Model 831 Technical Reference Manual
Power
17-9
•
When the USB Host port is turned On, the backlight will
be turned Off for five seconds
•
When the USB Host port is On, the backlight will not go
into the Bright intensity (if set to Bright, it will switch to
the Dim intensity)
•
When running on battery power, if the batteries are less
than 10% the backlight will not go into the Bright
intensity (if set to Bright, it will switch to the Dim
intensity)
•
When running on battery power, if the batteries are less
than 3%. the backlight will not be permitted to turn on.
Display Contrast
Note that the Display Contrast can
also be set from the display by
pressing the 0 key as described in the
section "ON/OFF Key" on page 3-7.
This is the preferred method of
adjusting contrast because the
changes are made immediately. With
the method described here, the
change is not applied until the
System Properties display is closed.
This parameter is used to adjust the contrast of the display to
accommodate varying viewing angles, temperature and
lighting condition. Adjustment ranges from - 9 to +9. The
default is 0.
To set the Display Contrast, highlight the Display Contrast
data field and press the 5 key. This will open a single digit
data field as shown in Figure 17-11.
FIGURE 17-11 Entering Display Contrast
Enter a value in the range 0 to 9 and press the
conclude the process.
5 key to
External Shutoff Voltage
To avoid damaging the internal batteries when the voltage of
an external battery drops too low, the user can set an external
shutoff voltage. The instrument will shut off automatically
when the external voltage drops below this level.
The default level is 10.8 volts, but the user can select a value
in the range 10 to 25 volts by entering the value directly into
the Ext Shutoff Voltage field shown in FIGURE 17-12.
FIGURE 17-12 External Shutoff Voltage Menu
17-10
Power
Model 831 Technical Reference Manual
Preferences
Note that the default values for these
parameters are as shown in
FIGURE 17-13.
The Preferences Page is used to configure certain instrument
functions..
FIGURE 17-13 Preferences Page
Highlight the preference to be selected and press the
key to view a list of options.
5
Microphone Correction
When using a free-field microphone, a correction can be
applied to provide a random incidence response or, when
using a random incidence microphone, a correction can be
applied to provide a free-field response. Highlight the Mic
Corr. field and press the
key to open the Microphone
Correction menu shown in FIGURE 17-14.
5
FIGURE 17-14 Microphone Correction Menu
To correct a random incidence microphone to obtain a freefield response, highlight RI -> FF and press the
key.
5
Model 831 Technical Reference Manual
Preferences
17-11
To correct a free-field microphone to obtain a random
incidence response, highlight FF -> RI and press the 5
key.
The default mode is Off
Auto-Store
The Model 831 provides three Auto-Store options to
enhance your data gathering activities:
•
None
•
Prompt
•
Store
5
Highlight the Auto-Store field and press the
key to
obtain a listing of the choices as shown in FIGURE 17-15.
FIGURE 17-15 Auto-Store Preferences
Highlight the desired Auto-Store option and press the
key to make the selection.
5
None
The user must press the 7 (STOP/STORE) key to Stop the
measurement. Press it again to store the data and also assign
a filename. See ‘Storing the Measurement” on page 7-15.
Prompt
When the Run Mode is set to Daily, a
stop will be performed by the timer
without prompting for the data to be
stored even though Auto-Store is set
to Prompt.
When the 7 (STOP/STORE) key is pressed to stop a
measurement, the user will be prompted to save the data file.
See ‘Storing the Measurement” on page 7-15. If the user
responds Yes, then a data file is saved. If No is selected, a
data file is not saved. If data was stored when the 9 (RUN/
PAUSE) key is pressed, the instrument is automatically reset
so a new measurement may begin.
Store
In this mode, when the 7 (STOP/STORE) key is pressed, a
data file is automatically saved. The default file name is
17-12
Preferences
Model 831 Technical Reference Manual
assigned to the file. There is no user interaction in this
process.
Pressing the 9 (RUN/PAUSE) key, the instrument will
automatically reset so a new measurement may begin.
Jack Function
The AC/DC Out/Headset Jack on the bottom of the
instrument can be configured to provide one of the
following:
•
As an AC/DC output of the signal from the detector. Use
with the optional AC/DC Output Cable (CLBL139); AC
signal is output via the red BNC and DC signal via the
white BNC. The AC output is typically directed to a
frequency analyzer or oscilloscope and the DC output is
typically directed to a strip chart recorder.
•
As a microphone and speaker connection when used with
the optional headset for voice recording/playback
(ACC003)
It can also be set to Off.
The jack function setting becomes
active as soon as it is selected.
Use the 8 and 2 keys to highlight the Jack Function
field and press the
key to obtain a listing of the choices
as shown in FIGURE 17-16.
5
FIGURE 17-16 Jack Function Preferences
Highlight the desired Jack Function press the
make the selection.
5 key to
Reset Prompting
If the Reset Prompting check box is checked, the user will
be prompted with an “Are You Sure” message box whenever
the 1 (RESET) key is pressed. If it is not checked, this
prompt will not appear prior to the reset action taking place.
Highlight the Reset Prompting check box. Pressing the
key toggles the state of the check box.
Model 831 Technical Reference Manual
Preferences
5
17-13
Takt Maximal Data
The definition of LAFTM5 is shown
in "Taktmaximal-5" on page D-21.
When this is checked, the parameter LAFTM5 is also
measured and displayed on the Overall and Current Pages
and as a parameter of a Time History measurement.
USB Host Port
Note that this must be On in order to
utilize the USB Port with peripheral
devices.
This function controls the power to the USB Port, so it must
be set to On in order to utilize it with peripheral devices.
Highlight the USB Host Port field and press the
key to
obtain a listing of the choices as shown in FIGURE 17-16.
5
FIGURE 17-17 USB Host Port On/Off Menu
Highlight the desired USB Host Port Status and press the
key to make the selection. When the USB Host Port is
set On, additional data fields associated with the use of the
USB Host port will appear as shown in
5
FIGURE 17-18 USB Host Port Parameters
USB Storage
Data might not be copied correctly if
the USB drive has not been properly
formatted. As a result, it is
recommended that the drive be
formatted before using it, as
described in "Format USB" on page
23-4.
Data can be stored to internal memory or to an external
memory device connected to the USB Port. The options are:
•
No: Store only to internal memory
•
Auto: Store data to USB memory if available; otherwise,
store to internal memory.
5
Highlight the USB Storage field and press the
key to
obtain a listing of the choices as shown in FIGURE 17-16.
FIGURE 17-19 USB Storage Preferences
17-14
Preferences
Model 831 Technical Reference Manual
Highlight the desired USB Storage and press the
make the selection.
5 key to
When data is stored to USB memory, it is first stored to
internal flash memory, a process which is much more rapid
than storing directly to USB memory. Following that, the
data is then copied to USB memory without interfering with
the operation of the instrument. When the data file has been
successfully copied, the original data file in internal memory
is deleted.
GPS Mode
The USB Host Port must be set to On
for the GPS Mode field to appear.
Note that the daylight saving time is
not supported.
5
Highlight the GPS Mode field and press the
key to
obtain a listing of the choices as shown in FIGURE 17-20.
FIGURE 17-20 GPS Mode On/Off Menu
Highlight On and press the
5 key to make the selection.
When using the SLM Utility-G3 software to control the
Model 831, there are two operational modes for the GPS:
GPS On
In this mode, the GPS is always on and consuming power,
but the GPS page is also always being updated. This can be
useful for real-time tracking of location or time.
GPS Auto
In this mode, the GPS will turn on at two different time:
Model 831 Technical Reference Manual
•
At the beginning of an interval, the GPS will turn on to
record the location
•
During a daily autostore, the GPS will turn on to check
the time and update the internal clock if needed
Preferences
17-15
Time Zone
Setting the GPS to On will open the menus to select the time
zone in which the GPS is located, as shown in FIGURE 1721
FIGURE 17-21 GPS Time Zone Menu
The time zone is selected by both hours (1st data field) and
minutes (2nd data field), referenced to Greenwich Mean
Time. Highlight the desired data field, and press the
key to list the options, as shown below. Highlight the desired
value and press the
key to make a selection.
5
5
Hours
FIGURE 17-22 Time Zone: Hours
The Time Zone Hours range from -12 to +13, in integer
steps.
Minutes
FIGURE 17-23 Time Zone: Minutes
The available values range from 0 to 45, in 15 minute steps.
17-16
Preferences
Model 831 Technical Reference Manual
Localization
Note that the default values for these
parameters are as shown in
FIGURE 17-24.
The Localization Page, shown in is used to select formats for
parameters which may vary from one country or region to
another. FIGURE 17-24.
FIGURE 17-24 Localization Page
Highlight the parameter to be set and press the
view a list of options.
5 key to
Languages
The Model 831 supports the following languages:
Model 831 Technical Reference Manual
•
English
•
Czech
•
French
•
German
•
Italian
•
Portuguese(pt)
•
Spanish
•
Swedish
•
Norwegian
Localization
17-17
•
Portuguese(br)
English is the default language.
5
Highlight the Language field and press the
key to
obtain a listing of the language choices as shown in FIGURE
17-25.
FIGURE 17-25 Language Preferences
Highlight the desired language and press the
make a selection.
17-18
Localization
5 key to
Model 831 Technical Reference Manual
Decimal Symbol
The Model 831 supports two formats for the decimal symbol
•
Period (.)
•
Comma (,)
5
Highlight the Decimal Symbol field and press the
key
to obtain a listing of the choices as shown FIGURE 17-26.
FIGURE 17-26 Decimal Symbol Preferences
Highlight the desired symbol and press the
make the selection.
5
key to
Date Format
The Model 831 supports two formats for expressing dates
•
day-month-year
•
year-month-day
5
Highlight the Date Format field and press the
key to
obtain a listing of the choices as shown in FIGURE 17-27.
FIGURE 17-27 Date Format Preferences
Highlight the desired Date Format and press the
make the selection.
5 key to
Units
The Model 831 supports both English and SI units.
5
Highlight the Units field and press the
key to display
the Units Menu as shown in FIGURE 17-27.
FIGURE 17-28 Units Menu
Model 831 Technical Reference Manual
Localization
17-19
Highlight the desired Units and press the
the selection.
5 key to make
Displays
Note that the default values for these
parameters are as shown in
FIGURE 17-29.
The Displays page, shown in FIGURE 17-29., permits some
customization of the displays
FIGURE 17-29 Displays Page
17-20
Displays
Model 831 Technical Reference Manual
Start
The user can select to have one of the following displays
appear when the Model 831 is switched On.
5
With the Start data field highlighted, press the
key to
obtain a list of options, as shown in FIGURE 17-30.
Note that this list will present only
those measurements which have
been enabled in the setup.
FIGURE 17-30 Display Start Options
Highlight the Display Start option and press the
make the selection.
5 key to
Selecting Displays to Appear
When there are measurement functions not being used or
data displays which are not of interest for a measurement,
the instrument operation can be streamlined by hiding
selected displays. As a default, all available displays are set
to appear.
Tab Page Selection
The displays to be used are selected one tab page at a time.
Highlight the Tabs field to list the tab pages for which
displays can be set to appear or be hidden, as shown in
FIGURE 17-31.
FIGURE 17-31 Displays Tab Page Options
Model 831 Technical Reference Manual
Displays
17-21
Highlight the desired Tab Page and press the
make the selection.
5 key to
Display Selection
The displays which can be set to appear or be hidden are
shown below for each of the possible Tab Page selections.
Live Page Displays (7 items)
FIGURE 17-32 Live Page Displays
Overall Page Displays (14 items)
FIGURE 17-33 Overall Page Displays
17-22
Displays
Model 831 Technical Reference Manual
Session Log Display
FIGURE 17-34 Session Log Displays
Current Displays (13 items)
FIGURE 17-35 Current Displays
Model 831 Technical Reference Manual
Displays
17-23
Measurement Displays (13 Items)
FIGURE 17-36 Measurement Displays
Events Displays (6 items)
FIGURE 17-37 Events Displays
17-24
Displays
Model 831 Technical Reference Manual
Time History Displays (5 Items)
FIGURE 17-38 Time History Displays
All displays which have a check in their check box will
appear on the Model 831.
To modify any of the displays associated with one of the Tab
Pages, highlight the field listing those displays and press the
key. to obtain a display similar to FIGURE 17-39,
where the first item is highlighted.
5
FIGURE 17-39 Display; Set to Appear or Hide
Model 831 Technical Reference Manual
Displays
17-25
Pressing the 4 key will toggle the state of the highlighted
display between Appear (checked) and Hide (unchecked).
Highlight different displays and set them as desired. When
finished setting the display types for this Tab Page, press the
key.
5
When all desired modifications have been made to the
displays for all Tab Pages, press the center softkey Close to
return to the Control Panel.
Options
Note
that
default
options,
Community Noise for example, will
not appear in the list as they cannot
be masked.
Also, RT-60,
Exceedances, 1/1 Octave, and 1/3
Octave cannot be masked while in
RT-60 mode.
The Options Page permits the user to enable/disable
installed options on the Model 831.
FIGURE 17-40 Options Page
Note that this is temporary and does
not result in permanent loss of a
purchased option. The user is able to
re-enable a purchased option at any
time and a restore/format defaults,
described in ‘Format & Restore
Defaults” on page 16-3, will also
enable all purchased options.
17-26
When the option is checked in mask, it is enabled in the
instrument. Unchecking removes the option. To mask or
unmask any option(s), press the
key to enter the dialog
mode. Use the 2 and 8 arrow keys to highlight each
option and use the 4 and
arrow keys to toggle the state
of the option between masked (unchecked) and unmasked
5
5
Options
Model 831 Technical Reference Manual
(checked). In Figure 17-41,we see that the Sound Recorder
option has been masked.
FIGURE 17-41 Sound Recorder Masked
5
When all selections have been made, press the
key to
exit the dialog mode and press Close, which will produce
the message shown in FIGURE 17-42
FIGURE 17-42 Apply Changes
5
Highlight Yes and press the
key, which will produce
the message shown in FIGURE 17-43 indicating that the
instrument must be rebooted for the masking/unmasking
changes to take effect.
FIGURE 17-43 Reminder to Reboot Instrument
Model 831 Technical Reference Manual
Options
17-27
5
Press the
key to return to the System Properties Menu
and reboot the instrument.
Logic I/O
The Model 831 has one logic in line and one logic out line as
described in Table 24-4, “Model 831 I/O Pinouts,” on
page 24-9. The role of these lines is defined in the Logic I/O
menu, shown in FIGURE 17-44.
FIGURE 17-44 Logic I/O Menu
The Logic In line receives a signal from an external device
such as the 831-INT, permitting it to initiate one of the
actions listed in FIGURE 17-45.
FIGURE 17-45 Logic In Menu
17-28
Logic I/O
Model 831 Technical Reference Manual
Logic Out
The Logic Out line transmits a signal to an external device
such as the 831-INT, defining one of the states listed in
FIGURE 17-46.
FIGURE 17-46 Logic Out Menu
Run State
When the Logic Out is set to Run State, then the output will
be driven high when the Model 831 is running and will be
driven low when the Model 831 is stopped.
Event
When the Logic Out is set to Event, then the output is
dependent upon the event trigger settings as follows:
Level Triggering
If the event mode is set to Level Triggering, then this output
will be driven high whenever the current RMS level exceeds
the SPL1 trigger level or the current Peak level exceeds the
Peak1 trigger level. If the current RMS level is below SPL1
and the current peak level is below Peak1, then the output
will be driven low.
Dynamic
If the event trigger is set to Dynamic, then the output will be
driven high when the current SPL level exceeds the dynamic
trigger level plus the dynamic trigger offset and will be
driven low when the current SPL level is below the dynamic
trigger level plus the dynamic trigger offset.
Model 831 Technical Reference Manual
Logic I/O
17-29
17-30
Logic I/O
Model 831 Technical Reference Manual
CHAPTER
18
Non-Acoustical Inputs
This chapter discusses the use of external transducers and
devices to provide non-acoustical data to the Model 831.
Included are the following:
•
831-INT Interface Unit
•
Weather (Wind, Temperature and Humidity)
•
Location using GPS device
831-INT
For a detailed description of the
design and use of the 831-INT, see
the Larson Davis manual 831INT.01.
FIGURE 18-1 831-INT with Model 831 Mounted
The 831-INT is a device that connects to the Model 831
through the 831’s I/O connector and enhances the
capabilities of the 831 to include interfaces for all necessary
components of a permanent noise monitoring system. These
components include the following:
Model 831 Technical Reference Manual
•
Metrological Sensors: Wind Speed, Wind Direction,
Temperature, Humidity
•
Backup Battery Management and Charging Control
•
Power Management: including switch over to battery
power when mains power fails and support for solar
panels
Non-Acoustical Inputs
18-1
•
4-port Powered USB Hub
•
2 Digital I/O lines: 1 in, 1 out
Weather Measurement Using 831-INT
Note that the optional firmware 831-WTHR must be enabled
in order to measure weather parameters with the Model 831.
Larson Davis Sensors
The following devices are available from Larson Davis for
the measurement of weather data:
•
SEN028 Wind Monitor: Wind Speed and Direction
•
SEN029 Anemometer (Low Cost): Wind Speed and
Direction
•
SEN030 Sensor: Temperature and Humidity
These sensors connect to the Model 831 via the 831-INT.
Setup
The parameters controlling the measurement of weather data
are setup from the Weather tab shown in.FIGURE 18-2.
FIGURE 18-2 Weather-INT Setup Page
18-2
Weather Measurement Using 831-INT
Model 831 Technical
The settings menu, shown in FIGURE 18-2, is used to select
which weather parameters are to be setup.
FIGURE 18-3 Weather Settings Menu
Wind Setup
The Wind Setup menu is shown in FIGURE 18-2. Most of
the parameters call for direct input of numeric values based
on the design parameters of the wind transducer or text
based on the preference of the user.
The scale setting allows the use of any pulse type of
anemometer and permits the scaling to any wind speed
metric. The Model 831 measures the frequency of the wind
speed (or tachometer) signal. The displayed value is the
measured frequency (Hz) multiplied by the calculated scale
factor of the sensor. Below is a table showing the scale
values to enter into the Model 831 for the SEN028 and
SEN029 for various units of measure. The Units is the text
label to enter into the Units field of the Model 831.
Units of Measure
(abbreviation)
SEN028 Scale
RM Young Wind
Monitor
SEN029 Scale
Davis Anemometer
Units label
Meters per second
(m/s)
0.0980
1.0064
m/s
Kilometers per hour
(km/h)
0.3528
3.6230
km/h
Miles per hour
(mi/h)
0.2191
2.2500
mi/h
Table 18-1 Wind Sensor Scale Factor
Model 831 Technical Reference Manual
Weather Measurement Using 831-INT
18-3
Knots
(kn)
0.1904
1.9553
knots
Feet per second
(fps)
0.3216
3.3026
fps
Table 18-1 Wind Sensor Scale Factor
Compass
The compass menu, shown in FIGURE 18-4, provides a list
of permitted formats.
FIGURE 18-4 Weather Compass Menu
Temperature Setup
FIGURE 18-5 Weather Temperature Menu
Humidity Setup
FIGURE 18-6 Weather Humidity Menu
18-4
Weather Measurement Using 831-INT
Model 831 Technical
Vaisala Weather Station
Units
Units are not configurable using the Vaisala Weather Station
(SEN-031). However, they will follow English or SI units as
configured in the System Properties dialog described in
Chapter 17.
English
SI
Wind
mi/h
m/s
Temperature
F
C
Relative Humidity
% RH
% RH
Table 18-2 Vaisala Units
Wind Setup
The Wind Setup menu is shown in FIGURE 18-7.
FIGURE 18-7 Weather Wind Menu
Gust Dir: Choose Compass or Degrees for the display (i.e.,
ENE vs. 70.0°)
Threshold: If the wind speed is above this threshold, it is
considered windy.
Model 831 Technical Reference Manual
Weather Measurement Using 831-INT
18-5
Excd. Pause: If set to "Yes" and wind speed exceeds Excd.
Level, sound exceedance are held off.
Excd. Level: if Excd. Pause is set to "Yes" and wind speed
exceeds this level, sound exceedance are held off.
Hysteresis: If sound exceedance are paused due to a wind
exceedance, wind speed must drop below (Excd. Level Hysteresis) before sound exceedance are resumed.
Temperature Setup
Note: This menu is informational
only.
FIGURE 18-8 Weather Temperature Menu
18-6
Weather Measurement Using 831-INT
Model 831 Technical
Humidity Setup
Note: This menu is informational
only.
FIGURE 18-9 Weather Humidity Menu
When used with a Model 831, with the exception of
precipitation data, the Vaisala weather station is configured
to report measurements once per second. The reported
values are the average over that one second interval. Wind
Gust is the max speed detected over that interval.
The Vaisala will send precipitation information every 10
seconds if precipitation has been detected.
If the Model 831 is configured to include Vaisala weather
data in the Time History, it will be this one-second data,
even if the Time History period is set to something other
than one second. This means that if the TH interval is less
than one second, you will see a repetition of values until it is
updated by the Vaisala. Conversely, if the TH interval is
greater than one second, the reported value will be the
average over the last second only.
Precipitation data is not available in the Time History.
Model 831 Technical Reference Manual
Weather Measurement Using 831-INT
18-7
Display
When weather has been enabled, the measured data will
appear on both the Live and the Overall Pages.
Live Display
Instantaneous weather data appears on the Live Display tab
shown in FIGURE 18-10
FIGURE 18-10 Live Weather Display
18-8
Weather Measurement Using 831-INT
Model 831 Technical
Average Weather
Average weather data appears on the Overall Display tab
shown in FIGURE 18-11
FIGURE 18-11 Overall Weather Display
Model 831 Technical Reference Manual
Weather Measurement Using 831-INT
18-9
Location Measurement Using 831-INT
The optional firmware 831-GPS
must be enabled in order to utilize a
GPS with the Model 831. Note that
daylight savings time is not
supported.
To provide global positioning information to the Model 831,
Larson Davis offers the GPS001 USB GPS Receiver with a
magnetic mount. This device is connected directly to the
USB port of the Model 831,
Setup
The GPS Mode field will only appear
when the USB Host Port is set to On.
The setup parameters for the GPS are entered using the
Preferences tab page of the System Properties Page, shown
in FIGURE 18-12
FIGURE 18-12 System Properties Page
For a detailed description of the GPS setup procedure, see
"GPS Mode" on page 17-15.
18-10
Location Measurement Using 831-INT Model 831 Technical
GPS Data Display
When the GPS feature is enabled by the user, the display
shown in FIGURE 18-13 will appear on the Live Display
Page, just above the “Time, Battery Voltage and Memory”
display shown in Figure 5-11 on page -5-11.
FIGURE 18-13 GPS Display
The GPS will turn on automatically at the beginning of
every measurement run to acquire the current position
information. The Live GPS display will show the data from
previous acquisitions instead of clearing the data when the
GPS is off. They will be cleared on if there is a GPS connect/
disconnect error.
Model 831 Technical Reference Manual
Location Measurement Using 831-INT
18-11
GPS Time-Sync
The time-sync is made from the average of thirty readings
from the satellite (thirty second average) as long as there are
four or more satellites detected. The time-sync can be
performed manually or automatically when the Daily
Autostore mode is active.
Manual
Note that the manual time sync can
only be performed while the
instrument is stopped.
A time-sync can be triggered manually by pressing the
key from the GPS display, shown in FIGURE 18-13.
5
Daily Autostore
A time-sync will be performed along with a Daily Autostore
if the time is found to be more than one second off. In this
case, the GPS is turned on two minutes prior to the autostore
time in order to gather the time and create the time
correction value that will be utilized.
Datum
The GPS uses WGS 84 as its default datum. The user can
change the datum as described in the Ho lux manual.
18-12
Location Measurement Using 831-INT Model 831 Technical
CHAPTER
19
Communication
The Communication Pages are used to setup
communications between the Model 831 and a PC using
dial-up modems, GSM cellular telephones and RS-232
devices.
Control Panel - Communication
Most of the communication settings
in the Model 831 can be configured
using the SLM Utility-G3 software.
Communications between the Model 831 and a PC are
implemented using the SLM Utility-G3 software. This
chapter explains how to set the Model 831 for these
communications.
To activate the Communication Pages, press the 3
(TOOLS) key. Use the 8, 2, 4 or 6 keys to
highlight the Communication icon as shown in FIGURE 191. It will be necessary to scroll down through the Control
Panel display in order to see the Communication Icon.
FIGURE 19-1 Control Panel
Model 831 Manual
Communication
19-1
5
Press the
key to open the Communication Pages,
shown in FIGURE 19-2.
FIGURE 19-2 Communications Pages
There are four tab pages as follows:
•
Modem page discussed in ‘Modem Page” on
page 19-3
•
Wireless page, discussed in ‘Wireless Page” on
page 19-6
•
RS-232 page, discussed in ‘RS-232” on page 19-21
•
Status, discussed in‘Status Page” on page 19-19
The first three are used to setup the three different modes of
communication available with the Model 831. The Status
pages used to monitor the status of the USB and RS-232
ports.
19-2
Control Panel - Communication
Model 831 Manual
Modem Page
In order to setup to use an analog
USB modem, the USB Host Port
must be set to On, as described in
‘USB Host Port” on page 17-14.
The Modem Page, shown in FIGURE 19-3, is used to
implement communication using a MultiModem USB
Analog modem and either telephone lines or dedicated lines.
FIGURE 19-3 Communication: Modem Page
Most of the data fields call for direct entry of parameters.
The Modem and Dialout Settings utilize drop-down menus
as follows.
If you attempt to enable more than one device, the warning
message shown in will appear.
FIGURE 19-4 Multiple Communication Device
Warning
Modem
The Modem field turns On or Off the modem. Use the 2
and 8 keys to highlight the Modem field and press the
Model 831 Manual
Modem Page
19-3
5 key to open the Modem Menu, shown in FIGURE 195.
FIGURE 19-5 Modem Menu
Use the 2 or 8 key to highlight On or Off and press the
5 key to make the selection.
Dialout Settings
The Dialout Settings defines when the modem is to dial up
the computer. Use the 2 and 8 keys to highlight the
Dialout Settings field and press the
key to open the
Dialout Settings Menu, shown in FIGURE 19-6.
5
FIGURE 19-6 Dialout Settings Menu
None
The Model 831 will not dial the designated phone number
for any reason
Event
The Model 831 will dial the designated phone number when
a valid occurs and the max of the event is greater than SPL 2
or the peak of the event is greater than Peak 3 as defined in
the trigger setting described in ‘Level Trigger Method” on
page 12-4. This feature provides the user with the ability to
log many events but only receive a call for the worst event.
However, should the user desire to receive a call for all
events, then SPL 2 can be set equal to SPL 1 and Peak 3 can
be set equal to Peak 1.
Use the 2 and 8 keys to highlight the desired setting
and press the
key to make the selection.
5
Monitor #
Monitor number is used when there are multiple noise
monitoring sites which can communicate with the computer.
Assign these as desired.
19-4
Modem Page
Model 831 Manual
Phone Number
This is the telephone number that the 831 will dial when
configured to dial on exceedance or alarm.
Password
The SLM Utility-G3 will not connect unless the password
sent by SLM Utility-G3 matches the password stored within
the Model 831. This is a security feature to prevent
unwanted access by someone who has the telephone number.
Init String
This is a string sent to the modem to initialize it. The string
shown in FIGURE 19-3 is the default. For PCB provided
modems, this does not need to be changed and the default
will work correctly. This parameter is made available for the
situation where a user wishes to use some other modem.
Setup
Step 1 Use the System Properties Preferences tab page to
set the USB Host Port On.
Step 2 From the Communications Pages use the Modem
tab page to set the modem On.
Step 3 Connect the modem to the USB Hub. When you
connect the modem the following events should happen.
•
The 'TR' LED would turn on
•
•
The “DATA” LED would glow and turn off immediately
The 'TR' LED would stay turned on.
Step 4
Connect a powered USB hub onto the 831.
Step 5 Now the 831 is ready for incoming
connections.The status and state of the USB modem can be
checked on he Status page discussed in ‘Status Page” on
page 19-19.
Common Pitfalls in Analog Modem Communication:
Model 831 Manual
•
Ensure that the analog modem (MDMUSB-A) is
connected to the 831-INT or a powered USB Hub. It will
not work if connected directly to the Model 831 as it
cannot supply sufficient power.
•
Check if the modem is connected to a standard analog
phone line (sometimes called POT line).
Modem Page
19-5
Wireless Page
In order to setup to use a wireless
modem, the USB Host Port must be
set to On, as described in ‘USB Host
Port” on page 17-14.
The Wireless Page, shown in FIGURE 19-7, is used to
implement wireless communication using GSM networks.
FIGURE 19-7 Communication: Wireless Page
The Wireless field turns On or Off the wireless modem. Use
the 2 and 8 keys to highlight the Wireless Modem field
and press the
key to open the Modem Menu, shown in
FIGURE 19-8.
5
FIGURE 19-8 Modem Menu
Use the 2 or 8 key to highlight On or Off and press the
5 key to make the selection.
APN
Each cellular provider has a unique APN (Access Point
Name) which is to be entered into this field.
APN Username/APN Password
Some cellular providers will also supply a specific APN
Username and Password which must be entered into these
fields.
19-6
Wireless Page
Model 831 Manual
Password
The password field is for a user-defined password that will
be used to authenticate with an application, such as SLM
Utility-G3.
Setup
Step 1 Use the System Properties Preferences tab page to
set the USB Host Port On.
Step 2 From the Communications Pages use the Wireless
tab page to set the wireless modem On.
In addition to a Model 831 with firmware version V1.5 or
higher, the following devices are required:
•
Model 831 Option
Communication option.
file
with
the
Advanced
•
MultiModem EDGE wireless modem with firmware 2.0
or higher
•
SIM Card (with a data plan)
•
Powered USB Hub
Step 3 Insert the SIM card and write down the telephone
number.
Step 4
Connect a Powered hub onto the 831.
Step 5
Connect the MultiModem EDGE to the USB Hub.
Boot sequence for the Modem runs as follows:
Model 831 Manual
•
The 'PWR' LED would turn on.
•
The 'TR' LED would turn on.
•
The 'TR' LED should stay turned on.
Wireless Page
19-7
Step 6 Wait for 3 minutes. Model 831 is ready for
incoming connections. The status of the modem can be
verified on the Communication ->Status screen, described
in‘Status Page” on page 19-19.
FIGURE 19-9 Status Page
RS-232 Page
Note: Connections via the RS-232
are slow compared to direct USB
connections.
The RS-232 option is an alternative direct connection
method for communicating with the Model 831. There are
two basic scenarios in which the RS-232 connection may be
superior to a USB connection:
•
The computer being utilized does not have a USB port.
•
The length of the connecting cable exceeds sixteen feet
(USB cables have a maximum usable length of 5 m or
16.5 feet while RS-232 cables can be up to 15.24 m or 50
feet long. However, both cable types can be extended by
using power hubs).
Required Components
The following are required to connect via the RS-232
interface:
19-8
RS-232 Page
Model 831 Manual
WARNING: There can only be one
DVX008A connected to a Model 831
system at a time. Connecting more
than one will result in undesirable
behavior.
•
A USB-to-RS-232 adaptor (DVX008A)
FIGURE 19-10 DVX008A
•
An RS-232 null modem connection (either a null modem
cable (CBL117) or a null modem adaptor)
FIGURE 19-11 Null Modem Cable
•
A computer with a serial port connector and an available
COM port
•
A Model 831 with the 831-MDM option installed and
enabled.
Setup
Step 1 From the Communications Pages use the RS-232
tab page to set the RS-232 to On.
Step 2 Connect one end of the null modem connector to
the serial port of the computer.
Step 3 Connect the other end of the null modem cable to
the USB-to-RS-232 adaptor (DVX008A).
Step 4 Connect the DVX008A to the USB port on the
Model 831.
The status and state of the wireless
modem can be checked on the Status
page.
Model 831 Manual
Step 5 Ensure that the USB port has been enabled as
described in “USB Host Port” on page -17-14.
RS-232 Page
19-9
Step 6 Use the Communication RS-232 page, shown in
FIGURE 19-12, to set the RS-232 option to On, as shown in
FIGURE 19-13.
FIGURE 19-12 Communication: RS-232 Page
FIGURE 19-13 RS-232 Menu
19-10
RS-232 Page
Model 831 Manual
Step 7
14.
Set the desired Baud rate as shown in FIGURE 19-
FIGURE 19-14 Baud Rate Menu
Troubleshooting Tips
Note: If the connection is not using
the Larson Davis SLM Utility-G3
software on the PC, it is required
that the slmserver portion of the
SLM-Utility-G3 software be installed
to communicate with the Model 831
since there is not currently an ASCII
character-based command set for
RS-232 communication.
If the connection does not establish itself after a few
moments, verify the following settings on the COM port
configuration on the PC side:
•
Baud Rate: User selectable metric; must match the
connection rate on the instrument end.
•
Flow Control: None
•
Data Bits: 8
•
Stop Bits: 1
•
Parity: None
Troubleshooting
When a connection to the Model 831 cannot be made via the
wireless modem, the following procedure is recommended.
Verify that the modem is enabled on the communications tab
and that the USB host port is on. A few minutes after
connecting, the PWR and TR lights should be illuminated on
Model 831 Manual
Troubleshooting
19-11
the modem and the modem status page should show the state
as SMS wait.
FIGURE 19-15 Status SMS Wait Page
If the connection has not been made, verify that the default
baud rate for the wireless modem is set to 115.2k, verify that
the wireless signal strength is adequate and verify that the
modem firmware version is 2.00 or greater. This can be done
by connecting to the wireless modem using a hyper terminal
program.
Installing the Wireless Modem USB Driver
Step 1 Connect one end of the USB cable to the modem
and the other end to the PC.
Step 2 Place the wireless modem CD into the PC's CDROM drive and plug the USB cable into the PC. The Add
New Hardware Wizard will display. Please follow the
installation prompts
19-12
Troubleshooting
Model 831 Manual
Wireless Modem USB Baud Rate Setup
Step 1 After Installation go to Control Panel-> Systems>Device Manager.
Model 831 Manual
Troubleshooting
19-13
Step 2 In the Edge modem properties page. Look at the
COM Port the device is connected to. This would be used in
the EDGE Setup Document.
Step 3 3) Navigate to the HyperTerminal program. On
Windows XP machine the navigation path would be Start->
Accessories->Communication->HyperTerminal
19-14
Troubleshooting
Model 831 Manual
Step 4
This would open up the following window
Step 5 In the Connection Description Window fill in a
name and click Ok.
Step 6 When you select ok Connect to Dialog Would pop
out. In the Connect Using Drop down menu select the com
port to which the Modem is connected (This can be found
from the device manager setting in your pc). Select OK after
doing this.
Model 831 Manual
Troubleshooting
19-15
Step 7 In the Properties set to the following. Bits per
second-> 230400, Data bits ->8, Parity->None, Stop bits 1,
Flow control-> Hardware.
Step 8
In the Modem Properties ->settings-> Ascii Setup
• Enable "send line ends with line feeds"
• Echo typed characters locally (if the characters you
type in the next step are duplicated, return to this step
and uncheck this box.
19-16
Troubleshooting
Model 831 Manual
Step 9 Now type in AT in the window. Check If it
responds with OK. If it does proceed to Step- 11 else
proceed to step 10.
Step 10 Go to modem properties and change the bits per
second to 115200 rate and retry step 9.
Step 11 Now type in "AT+IPR?" This should be respond
with 230400.Type in "AT+IPR=115200".
Model 831 Manual
Troubleshooting
19-17
This change will cause communication with the modem to
cease. Return to the location identified in step 7 and set the
baud rate to 115200. Reconnect to the modem
Step 12 Now type in AT in the window. Check If it
responds with OK.
Step 13 Now type in "AT+IPR?" This should be respond
with 115200. Verify signal strength and error rate
Verify Signal Strength and Error Rate
Step 1
Type in "AT+CREG=1"
Step 2
Type "AT+CSQ". This will return a value pair.
The first number (possible values 0-30) is the signal
strength. Any number less than 10 may mean the signal is
too weak for reliable communication. The second number
(possible values 0-7) is the error rate. For more specific
details refer to the Multi Modem manual.
If the modem will not connect after all of these steps the
firmware version should be verified.
Verify Firmware Version
In the HyperTerminal window type in "ati". The firmware
version number will be reported. It must report revision 2.00
or higher for the modem to work properly, If it returns a
19-18
Troubleshooting
Model 831 Manual
lower version you will need to return the modem to
MultiTech or to the place of purchase for a firmware
upgrade.
Status Page
This page allows tracking of the status and state of attached
communication devices.
There are four separate channels that can be monitored.
Analog, Wireless, RS-232 and USB depending on which
type of device you have connected.
Analog
FIGURE 19-16 Status: Analog Modem
State
Note: A list of the most common
State values is presented in the
section ‘States” on page 19-22.
Displays the current state that the device is in along with a
time stamp signifying when the device entered that state. A
Ready state signifies that the device has been initialized and
is ready for use.
Previous
Shows the previous most recent state the device was in along
with the time stamp that the state was entered. This is useful
as it enable the use to more easily follow the progress of the
device as it moves through all possible states.
Model 831 Manual
Status Page
19-19
In
A representation of the last data packet received on this data
channel
Out
A representation of the last data packet sent on this data
channel
Time
Displays the current date and time of the unit
Wireless
FIGURE 19-17 Status: Wireless Channel
State
Note: A list of the most common
State values is presented in the
section ‘States” on page 19-22.
19-20
Displays the current state that the device is in along with a
time stamp signifying when the device entered that state. An
SMS Wait state signifies that the device has been initialized
and is waiting for a connection request.
Status Page
Model 831 Manual
RS-232
FIGURE 19-18 Status:RS-232
USB
FIGURE 19-19 Status: USB Channel
Model 831 Manual
Status Page
19-21
States
There are many possible states that each device can be in.
This section lists the most common ones.
Connect Wait
The wireless modem has successfully registered and
communicated with an application. This state will persist for
2 minutes before moving on to the next state.
Connected
The device is connected to and is being remotely controlled
by an application (G3-utility)
Device Found
A device has been found on one of the communication
channels and is being identified.
Disconnected
The device has been disconnected from the remote
application.
Initializing
The connected device is currently being initialized.
Internet
The wireless modem is connected to an IP address.
Sleep
It is only possible to have one device communicating at a
time. If you attempt to enable or use more than one device
the currently active device will enter a sleep state.
19-22
Status Page
Model 831 Manual
FIGURE 19-20 shows the wireless channel in a sleep state
as a result of a USB device also being connected to the
model 831 at the same time.
FIGURE 19-20 Sleep State Menu
SMS Init
The wireless modem has registered on the network
SMS Merge
When an SMS message has been sent via email and is too
large (>160 bytes) it is broken up and reassembled. This
state signifies that multiple SMS messages are being
reassembled.
SMS Received
An SMS message has been received by the device
SMS Wait
The wireless modem is ready to receive an SMS message
requesting connection.
Model 831 Manual
Status Page
19-23
Communications Watchdog
When the Model 831 is used with an 831-INT-ET Docking
Station, a watchdog is enabled that will reboot the system in
the event of a communications failure. The watchdog
enable state is indicated on the Communication Status tab as
shown in FIGURE 19-20.
NOTE: A Model 831 in an 831-INT
with the watchdog enabled will
reboot each time the watchdog count
expires. To prevent this, disable the
watchdog on the Communication
Status tab.
The only time this control needs to be changed by a user is if
the Model 831 was used with an 831-INT-ET and
subsequently moved to an 831-INT.
If the Communications Watchdog is enabled, the watchdog
count will be displayed on the Live tab as shown in FIGURE
19-21. The count tells how many seconds remain until the
system will reboot. The watchdog timeout is one hour or
3600 seconds.
FIGURE 19-21 Communications Watchdog
Countdown
19-24
Status Page
Model 831 Manual
CHAPTER
20
Lock/Unlock the Model 831
To prevent unauthorized use or tampering with
measurements and data, the Model 831 has a lock
feature. When this is enabled, the Model 831 is tamper
proof to a level selected by the user. There are 4 levels of
security provided by this feature.
Control Panel - Lock
To activate the Lock Page, press the 3 (TOOLS) key and
highlight the Lock icon as shown in FIGURE 20-1.
FIGURE 20-1 Control Panel
Press the
5 key to open the Lock Page.
There is one Lock Page. There are three items on this page
the user may configure.
Model 831 Technical Reference Manual
Lock/Unlock the Model 831
20-1
FIGURE 20-2 Lock Page
5 key to
Highlight the Lock Mode list box. Press the
drop down the list.
FIGURE 20-3 Lock Mode List
Highlight the desired lock mode. Press the
accept the selection.
5 key to
Lock Modes
Unlocked
The user has complete access to the features of the
instrument.
Lock w/Auto-Store
The user cannot change the data view in this mode. Only the
status line at the top of the screen is updated. A
measurement may be running when this mode is enabled or
pressing the 9 (RUN / PAUSE) key will begin a
measurement. A measurement cannot be paused. Pressing
20-2
Control Panel - Lock
Model 831 Technical Reference Manual
the 7 (STOP / STORE) key stops the run and stores the
data but does not reset the measurement. See Chapter 20
"Locked With Auto-Store" on page 20-7.
Lock w/Manual Store
In this mode, the Auto-Store
preference is disabled, see Chapter
17 "Preferences" on page 17-11.
The user cannot change the data view in this mode. Only the
status line at the top of the screen is updated. Measurements
may be run, paused and stopped. See Chapter 20 "Locked
With Manual-Store" on page 20-8.
Fully Locked
The user has no access to the instrument, except to start a
run. Auto-Store preferences are enabled in this mode. See
Chapter 20 "Fully Locked" on page 20-5.
A measurement cannot be reset when the Model 831 is
locked in any mode.
Unlock Code
Move the highlight to the Unlock Code Field.
FIGURE 20-4 Unlock Code
5
Press the
key. The 1st character in the field will be
highlighted. Enter the desired lock code and press the
key to accept the new unlock code .
5
Press the Close soft key to exit the Lock Page.
FIGURE 20-5 Apply Changes
Model 831 Technical Reference Manual
Control Panel - Lock
20-3
Highlight Yes or No and press the
process.
5 key to complete the
Allow Cal When Locked
Move the highlight to Allow Cal. When Locked. Pressing
the
key will toggle the state of the check boxes shown
in FIGURE 20-6. If the box is checked, calibration will be
allowed while the unit is locked, but not running a
measurement.
5
FIGURE 20-6 Allow Cal Check Box
20-4
Control Panel - Lock
Model 831 Technical Reference Manual
Fully Locked
FIGURE 20-7 Fully Locked
If you have selected Fully Locked for the Lock Mode, upon
accepting the changes, FIGURE 20-7 represents the view
you will have. At this point, the instrument is not running a
measurement. It is possible to select the Fully Locked mode
while a measurement is in progress.
Pressing the 9 (RUN/PAUSE) key will start a
measurement by bring up the following message box.
FIGURE 20-8 Are You Sure
5
Highlight Yes and press the
key to begin the
measurement. A measurement cannot be Paused, Stopped or
Stored in the Fully Locked mode.
Model 831 Technical Reference Manual
Fully Locked
20-5
To unlock the Model 831, press the 3 (TOOLS) key.
FIGURE 20-9 Unlock
5 key or the Right or Left Softkey may also be used.
Enter a 4 digit code, then press the 5 key.
The
The Model 831 is unlocked and all functions are available to
the user.
20-6
Fully Locked
Model 831 Technical Reference Manual
Locked With Auto-Store
If the Locked w/Auto-Store mode has been selected, upon
accepting the changes on the Lock Page, the view would
look as shown in FIGURE 20-10.
FIGURE 20-10 Locked with Auto Store or
Manual Store
In this mode, measurements may be started by pressing the
9 (RUN/PAUSE) key. A measurement may not be Paused
or Stopped. Pressing the 7 (STOP/STORE) key will
initiate storing the data file.
FIGURE 20-11 Auto-Store-Stop
5
Highlight the desired response and press the
key. If
Yes is selected, the data file will be saved. The unit is still
locked and a new measurement may be started by pressing
the 9 (RUN/PAUSE) key. If No is selected, the data is
reset and a new measurement may be made.
Model 831 Technical Reference Manual
Locked With Auto-Store
20-7
Unlock
To unlock the model 831, press the
3 (TOOLS) key, the
5 key or the right or left softkey. Enter your 4 digit code,
then press the 5 key.
FIGURE 20-12 Auto-Store Unlock
The Model 831 is unlocked and all the functions are
available to the user.
Locked With Manual-Store
If the Locked w/Manual-Store mode has been selected, upon
accepting the changes on the Lock Page, the view would be
as shown in FIGURE 20-10.
In this mode, a measurement is started by pressing the 9
(RUN / PAUSE) key. Pressing the 9 (RUN / PAUSE) key
a second time will pause the measurement and pressing it
again will continue the measurement.
The 7 (STOP / STORE) key will stop a measurement
Pressing it a second time will initiate the storage process by
displaying the “Save File” prompt as shown in FIGURE 2013.
FIGURE 20-13 Manual Store When Locked
Press Yes to store into the file number indicated, No to abort
the storage operation or... to overwrite a file into which data
has already been stored.
20-8
Locked With Manual-Store
Model 831 Technical Reference Manual
Unlock
To unlock the Model 831, press the
3 (TOOLS) key, the
5 key or the Right or Left Softkey. Enter your 4 digit
code, then press the 5 key. See FIGURE 20-10 "Locked
with Auto Store or Manual Store".
The Model 831 is unlocked and all functions are available to
the user. The measurement may be stored.
Calibration When The Model 831 Is Locked
When the Model 831 is in any of the lock modes, and is
stopped, the unit may be calibrated. This is only possible if
the “Allow Cal. When Locked” check box, on the Lock
Page, has been checked previous to entering Lock mode. See
FIGURE 20-6 "Allow Cal Check Box".
If the Center Softkey indicating CAL is active, as shown in
FIGURE 20-14, press this key. This will bring up the
calibration screen. See Chapter 21 "Calibration" on page 211 for complete details on calibrating the Model 831.
FIGURE 20-14 Locked with Calibration Permitted
Model 831 Technical Reference Manual
Calibration When The Model 831 Is Locked 20-9
20-10
Calibration When The Model 831 Is Locked Model 831 Technical Reference
CHAPTER
21
Calibration
Calibration Overview
Sensitivity Determination
The primary role of sound level meter calibration is to
establish a numerical relationship between the sound level at
the diaphragm of the microphone and the voltage measured
by the meter so that the sound pressure level can be read
directly from the display of the meter in units of dB. The
result of a calibration is the determination of the sensitivity
of the meter, including microphone and preamplifier,
typically in units of dB re 1V/Pa or mV/Pa.
Overload/Under Range Conditions
A secondary role of calibration is to determine the sound
level which would overload the instrument and the
minimum sound level which can be accurately measured,
referred to as the under range level. This requires a
knowledge of the electrical noise levels of the microphone,
preamplifier and the instrument circuitry.
Calibration Stability
The Model 831 should maintain a stable value of sensitivity
over long periods of time. Significant changes in sensitivity,
or a pattern of small but regular sensitivity changes, are
indicative of problems with the measurement system calling
for laboratory calibration and possibly service. To assist the
user in identifying these situations, the Model 831 provides
two notifications:
Calibration History
Data and date/time of the most recent ten calibrations.
Large Change Notification
During calibration, an automatic comparison is made
between the sensitivity determined by the calibration and a
published value of sensitivity. An on-screen window will
appear to warn the user when the difference between these
two values exceed 3 dB.
Model 831 Technical Reference Manual
Calibration
21-1
Control Panel - Calibrate
To activate the Calibration function, press the 3 (TOOLS)
key and highlight the Calibrate icon as shown below.
FIGURE 21-1 Control Panel
Press the
5 key to open the Calibrate Pages.
The Calibration Pages are shown in FIGURE 21-2.
21-2
Control Panel - Calibrate
Model 831 Technical Reference Manual
Calibrate Page
Sensitivity Page
E.A. History Page
History Page
Certification Page
Calibration Spectrum
E.A. Check Page
E.A. Check Spectrum Page
FIGURE 21-2 Calibration Pages
Model 831 Technical Reference Manual
Control Panel - Calibrate
21-3
Calibrate Page
The Calibrate Page is used when performing an acoustic
calibration, including the selection of the sound level
calibrator to be used and the implementation of the
calibration procedure.
History Page
The History Page lists the results, along with the date and
time, of the ten most recent calibrations performed using the
same type of preamplifier as presently connected to the
Model 831, whose name appears at the top of the page
(PRM831 in this example). The preamplifier type is read
automatically when the instrument is booted up, or
following a change in preamplifier. The value of sensitivity
in dB re. 1 V/Pa and the variation of the sensitivity
determined from that calibration relative to the calibration
prior to that, dB, are presented for each calibration.
Sensitivity Page
When performing an acoustic calibration, the Sensitivity
Page is used to select the microphone being used.
Certification Page
The Certification Page shows the date of the last
certification and the due date for the next certification.
Information about the calibration facility. Typically Larson
Davis, Inc. is displayed in the middle of the page. The user
can enter their own certification interval and certification
reminder from this page.
Exiting from the Calibration Function
Press the Close Softkey to exit from any of the calibration
pages to the Control Panel.
21-4
Control Panel - Calibrate
Model 831 Technical Reference Manual
Acoustic Calibration
When using a 426A12 Outdoor
Microphone and Power Supply or a
Model 2100 Outdoor Preamplifier, a
calibration check can be performed
remotely using an electrostatic
actuator (E.A.) as described in "E.A.
Check" on page 21-18.
This is the most commonly used calibration method, and the
one required by most national and international standards
prior to performing a measurement. A sound level calibrator
is used to apply an acoustical signal of a known amplitude
and frequency to the microphone. From the voltage level
measured by the meter the sensitivity can be determined. In
this technique one is obviously assuming that the calibrator
is functioning correctly; any variation in level from that
expected will result in an improper calibration and an
erroneous value of sensitivity. For this reason, the user is
advised to compare the newly determined sensitivity with
the previous sensitivity to ensure that significant variations
have not occurred.
Frequency Weighting
The Model 831 automatically switches to C frequency
weighting and Fast detector response for calibration. This
permits 250 Hz and 1000 Hz calibrators to be used. The Fast
detector response reduces the stabilization time required
before calibration. If the OBA is enabled and the OBA range
is set to Low, an OBA overload will occur due to the
amplitude of the calibrator output signal. Therefore, the
OBA range is automatically switched to high for the
calibration.
After calibration, the Model 831 returns to the original
frequency and time weighting set by the user. If the OBA is
enabled, the OBA range is also restored to that set by the
user.
Calibrator
The calibrator section of the Calibrate Page, shown in
FIGURE 21-2, includes an area to enter information about a
calibrator and a list of calibrators. The user may select a
calibrator from the list or enter new information about a
calibrator.
Recommended Calibrator
Larson Davis recommends the following calibrator:
If using a 1/4” microphone, the
adaptor ADP024 is required.
Model 831 Technical Reference Manual
•
Larson Davis Model CAL200: 94/114 dB @ 1 kHz
Acoustic Calibration
21-5
Model 831 with 1/2” Free-Field Microphone
The CAL200 provides a nominal pressure level of 94 dB or
114 dB. The exact levels are printed on the Larson Davis
calibration sheet that came with the calibrator. When using a
free-field microphone, the pressure level at the microphone
diaphragm will be slightly different. Thus, a free field
correction of -0.12 dB should be applied to either of these
levels. Pressure and random incidence microphone do not
require a correction of this type. If the calibrator and
instrument are near room temperature (23° C) and near sea
level (101.3 kPa) then no other corrections need to be made.
If the calibration sheet for the CAL200 indicates 113.98 dB
for it's level when set to 114 dB then set the Cal Level in the
Model 831 to 113.86 dB and 1kHz.
When the microphone and instrument are at a temperature
other than near room temperature or static pressures not near
sea level, then corrections will need to be added for the
ambient temperature and the prevailing static pressure.
Check the calibration data shipped from Larson Davis with
the CAL200 to get these corrections. The corrections can be
added to the level obtained in the previous paragraph to get
the actual level of the CAL200.
The microphone's sensitivity varies with static pressure. If
the instrument is calibrated in one environment and moved
to another, then the sensitivity will change (after
stabilization) depending on the change of temperature and
pressure. The coefficient of static pressure is -0.01 dB/kPa.
If the system is calibrated at 85 kPa for instance then it will
be 0.16 dB less sensitive at sea level. The sensitivity of the
microphone and Model 831 varies slightly with temperature
also. The coefficient of temperature is -0.009 dB/°C. If the
system is calibrated at 18 °C then it will be 0.05 dB less
sensitive at 23 °C.
The Larson Davis 3" Wind Screen has less than 0.05dB
effect on the system response at 1 kHz.
21-6
Acoustic Calibration
Model 831 Technical Reference Manual
Environmental Parameter Ranges
For proper calibration of a Class 1 sound level meter such as
the Model 831, the calibration procedure and the correction
values apply over the ranges presented in Table 21-1.
Parameter
Range
Static Pressure
65 kPa to 108 kPa (9.4 psi to 15.7 psi)
Temperature
- 10 C to + 50C (14 F to + 122F
Humidity
25 % to 90%, without condensation from - 10 C to + 39
(14 F to + 102.2F)
Table 3-1 Environmental Parameter Ranges for Calibration
Set the CAL200 level switch to 114 dB.
Adding a Calibrator
Refer to the calibrator certification
sheet for the calibration level
When adding a calibrator to the list, the following
information may be entered:
•
Calibration Level
•
Calibration Frequency
•
Calibrator Description
The calibration level and frequency values are as specified
in section ‘Model 831 with 1/2” Free-Field Microphone” on
page 21-6.
Looking at FIGURE 21-2, highlight each text box in the
Calibrator section of the Calibrate Page and enter the correct
information about a calibrator, enter the information and
press the
key to complete the entry.
5
When the calibration level, calibration frequency and
calibrator description have been entered, highlight the Save
button and press the
key to save the information to the
list of calibrators.
5
Model 831 Technical Reference Manual
Acoustic Calibration
21-7
FIGURE 21-3 New Calibrator
If the desired calibrator is already in the list, highlight the
calibrator and press the
key. The radio button next to
the selected calibrator will be filled in and the calibration
information will appear above.
5
Microphone Selection
The microphone being used is selected from the Sensitivity
Page, shown in FIGURE 21-2.
Larson Davis Microphone
If using one of the Larson Davis microphones most
frequently used with the Model 831, highlight the down
arrow portion of the Type data field to obtain a list of
microphones such as shown in FIGURE 21-4.
FIGURE 21-4 Microphone Selection List
Highlight the microphone type being used and press the
key to make the selection. The nominal value of
5
21-8
Acoustic Calibration
Model 831 Technical Reference Manual
sensitivity for that type of microphone will now appear in
the Published data field and the Self Noise for that
microphone and preamplifier combination will appear in the
Self Noise data field.
Other Microphone
In order for the Noise Floor and
Under Range Levels to be
determined when the microphone is
not selected from the drop down list
as described in ‘Direct Data Input”
on page 21-14, the user must
manually enter a value into the Self
Noise data field.
If using a microphone from another manufacturer, or if the
Larson Davis microphone type being used does not appear
in this list, the name and parameters can be entered
manually. The Type data field is a combobox, which means
that the down arrow (right) portion can be used to open a
drop down list while the left portion can be used for text
entry. Use the 4 key to highlight the left portion of the data
field and press the
key to bring up the cursor. Enter
descriptive text to define the microphone and press the
key to accept the input.
5
5
Performing the Calibration
Refer to the calibrators operating
instruction for more information.
Carefully insert the microphone into the microphone
opening in the top of the calibrator. Turn on the calibrator.
Highlight the Calibrate button on the Model 831 and press
the
key, opening the calibrating display shown in
FIGURE 21-5.
5
FIGURE 21-5 Calibrating
The present sound level (94.56 dB), the difference between
the calibration level and the present sound level ( and an
indication of stability are displayed in this message box.
When the pointer in the stability indicator is vertical, the
sound level is stable.
Model 831 Technical Reference Manual
Acoustic Calibration
21-9
The Cancel button is highlighted. Pressing the
will abort the calibration.
5 key
FIGURE 21-6 Save Calibration
You can simply verify the calibration
by selecting No. Also, if no
significant changes are seen you may
choose to answer No also.
When the calibration is completed, a message box appears.
Selecting Yes will save the results of the calibration and No
will cancel the results of the calibration. Highlight the
desired button and press the
key.
5
Warning Messages
After selecting Yes to save the results of the calibration,
there are two warning messages which may appear.
Outside Range of Normal Sensitivity
When the results of the calibration correspond to a
sensitivity greater than 3 dB outside the range of the nominal
sensitivity for that microphone, the message shown in
FIGURE 21-7 will appear.
FIGURE 21-7 Outside Normal Sensitivity Range
When this message is received, it is advisable to scrutinize
the current calibration sensitivity and overload level. Ensure
that the calibration was performed properly and that all of
the equipment is functioning correctly.
21-10
Acoustic Calibration
Model 831 Technical Reference Manual
> 0.5 dB From Previous Calibration Result
When the results of the calibration indicate a change in
sensitivity greater than 0.5 dB from the previous calibration
results, the message shown in FIGURE 21-8 will appear.
FIGURE 21-8 0.5 dB From Previous Calibration
Result
The choice of whether or not to save the calibration is up to
the discretion of the user.
Calibration History
The results of the last ten calibrations are displayed on the
History Page, shown in FIGURE 21-9.
FIGURE 21-9 Calibration History Page
Here we see the date and time of each calibration, along with
the sensitivity in dB re. 1 V/Pa and the difference between
the level measured during the calibration and the level of the
previous calibration.
Model 831 Technical Reference Manual
Acoustic Calibration
21-11
Calibration Spectrum
If the 1/1 or 1/3 octave settings had been active at the time
the calibration was performed, a spectrum will be saved with
the history record. Press the
key to display the
spectrum of the highlighted calibration, as shown in
FIGURE 21-10
5
FIGURE 21-10 Calibration Spectrum Display
21-12
Acoustic Calibration
Model 831 Technical Reference Manual
Sensitivity Page
The Sensitivity Page, shown in FIGURE 21-11, is used
primarily to establish the noise floor of the instrument with
the preamplifier and microphone presently being used and,
from that, determine the under range levels for A, C and Zweighting sound level measurements. The overload level is
also determined.
Preamplifier Presently
Connected
Peak Overload Level
Selected Microphone
Under Range Levels
Self Noise of Selected Microphone,
Unless Value Entered Manually
Noise Floor
Levels
FIGURE 21-11 Sensitivity Page
Noise Floor
The noise floor is calculated as the energy sum of the
microphone self noise, preamplifier self noise and
instrument self noise.
When using one of the following preamplifiers, identified
automatically when plugged into the Model 831,
•
PRM 831
•
426A12
•
ICP with ADP074
and one of the most commonly used microphones for that
type of preamplifier, user-selected, a database in the Model
831 provides the nominal sensitivity and the self noise of the
preamplifier and microphone pair.
When a calibration has been performed using any of the four
preamplifiers listed above, that calibration information is
saved for that preamplifier. If the preamplifier is switched
from one of these types to another, then the calibration
Model 831 Technical Reference Manual
Sensitivity Page
21-13
information already saved for that new preamplifier type is
recalled. As long as the same microphone is being used with
that preamplifier, the calibration should be correct.
Direct Data Input
Self-noise values can also be entered manually when using
preamplifiers and/or microphones not included in the Model
831 data base. See also ‘Direct Data Input” on page 21-14.
Overload Level
The overload level is the highest peak level which can be
measured without overloading the input of the Model 831.
Under Range Level
The Under Range Level is the higher of the following:
(1) Noise Floor plus 9.14 dB (under range shown when self
noise contributes 0.5 dB to the readings).
(2) Actual point where the log-linearity exceeds maximum
permitted value
Except for very low noise level microphones, the under
range level is usually determined by (1).
21-14
Sensitivity Page
Model 831 Technical Reference Manual
Calibration Without Preamplifier
There may be situations where the microphone preamplifier
provided with the Model 831 is not being used. For example
when a hydrophone is being used, no level calibrator is
available so the sensitivity must be input directly by the user.
When the preamplifier has been disconnected, the
Sensitivity Page will appear as shown in FIGURE 21-12
FIGURE 21-12 Sensitivity Page Without
Preamplifier
In this situation, the sensitivity of the transducer and the self
noise, if known, can be input directly.
Model 831 Technical Reference Manual
Calibration Without Preamplifier
21-15
Certification
FIGURE 21-13 Certification Page
A certification interval of one year is
recommended but this can be
lengthened or disabled depending on
applicable requirements.
The user has the opportunity to set the calibration interval
and a calibration reminder.
Certification Page Parameter Selection
The certification page parameters are selected as shown in
FIGURE 21-14.
FIGURE 21-14 Certification Page Parameter Selection
21-16
Certification
Model 831 Technical Reference Manual
Available values of Certification Interval are as follows:
•
1 Year
•
2 Years
•
3 Years
•
4 Years
•
Never
The default value is Never
Available values of Certification Reminder are as follows:
•
15 Days
•
30 Days
•
45 Days
•
60 Days
•
Never
The default value is Never
Notification
When appropriate, the message “Certification will expire in
xx days” or “Certification has expired” will be displayed as
follows:
•
When the instrument powers up
•
When the Calibrate Tool is selected, as shown in
FIGURE 21-1.
These messages will appear as shown in FIGURE 21-15 and
FIGURE 21-16.
FIGURE 21-15 Message: Calibration will expire
FIGURE 21-16 Message: Calibration has expired
Model 831 Technical Reference Manual
Certification
21-17
E.A. Check
When using a Larson Davis Model 426A12 Outdoor
Preamplifier and Power Supply or Model 2100 Outdoor
Preamplifier, this menu is used to perform a remote
calibration check by switching on the electrostatic actuator
(E.A.) contained within rain hat of the Model 426A12.
FIGURE 21-17 E.A. Check Menu
Initial Calibration
The sound pressure level produced by the E.A., typically in
the range 94 to 96 dB, will depend upon the manner in
which the rain hat is mounted upon the microphone, so it
may change whenever removed and then replaced. However,
once in place, it does generate a precision level that can be
used to determine changes in the system calibration, whether
in the microphone, instrumentation, cabling or in the
Electrostatic Actuator itself. As a result, after installation of
the rain hat, an initial calibration must be performed to
establish the standard E.A. level. To do this, highlight E.A
21-18
E.A. Check
Model 831 Technical Reference Manual
5
Check and press the
key to initiate a calibration.
which will produce the display shown in FIGURE 21-18.
FIGURE 21-18 Calibrating In Progress Display
This display will indicate the difference between the present
level and the previously measured level. When the
measurement is complete, the display will be as shown in
FIGURE 21-19
FIGURE 21-19 Save as Standard E.A. Display
For an initial calibration after replacing the rain hat,
highlight Yes and the
key, which will establish the
level produced by this measurement as the Standard E.A.
Level. This level will then appear in the E.A. Level box in
the lower portion of the screen.
5
Calibration
Once the Standard E.A. Level has been established, as long
as no changes have been made to the rain hat, follow the
same procedure as for initial calibration. As long as the
difference between the measured level and the Standard E.A.
Level is acceptably small, this indicates the system is
performing well. However, following a satisfactory
calibration check, it is up to the individual user whether to
select Yes or No to the Save as Standard E.A. Level inquiry.
By selecting Yes, the Standard E.A. Level will change to
follow the most recent calibration whereas selecting No will
maintain the original Standard E.A. Level as the standard for
comparison. All manual E.A.Checks that do not time-out
will be stored in the calibration history, meaning that even if
Model 831 Technical Reference Manual
E.A. Check
21-19
No had been selected for the Save as Standard E.A. Level
inquiry it will be saved.
Background Noise
If the measured level during calibration is not stable, the
Model 831 will assume that there is contamination due to
background noise and abort the calibration. Also, the E.A.
calibration spectrum can be viewed to see if there was any
significant out-of-band energy; see "E.A. Check Spectrum"
on page 21-21 for further information.
E.A. History
The last ten calibration E.A.calibration check levels are
saved in a Check History. These are displayed on the E.A
History Page, shown in FIGURE 21-20,.
Preamplifier Type
FIGURE 21-20 E.A. History Page
Note that E.A. History is only
available when using either the
426A12 or PRM2100 Outdoor
Preamplifier, as indicated in the
upper section of the display.
21-20
E.A. History
The parameters for the most recent calibration appear at the
top of the list. Both the absolute level measured and the
difference from the Standard E.A. Level setting appear for
each calibration, as well as the data and time of the
calibration.
Model 831 Technical Reference Manual
E.A. Check Spectrum
If either the 1/1 or 1/3 octave spectrum was enabled at the
time the E.A. Check was performed, a corresponding
spectrum will be stored with the measurement. Press the
key to display the spectrum of the highlighted E.A.
Check, as shown in FIGURE 21-21
5
FIGURE 21-21 E.A. Check Spectrum Display
Model 831 Technical Reference Manual
E.A. History
21-21
21-22
E.A. History
Model 831 Technical Reference Manual
CHAPTER
22
About
The About Pages give summary information concerning
the instrument, available options and instrument
identification.
Control Panel - About
To activate the About Pages, press the 3 (TOOLS) key and
highlight the About icon as shown in FIGURE 22-1.
FIGURE 22-1 Control Panel
Press the
5 key to open the About Pages.
There are three About Pages that may be selected using the
Right and Left Softkeys. All About Pages have one section.
There is no user input required on these pages.
Model 831 Technical Reference Manual
About
22-1
About
This page gives you important information such as Serial
Number and Firmware Revision. See FIGURE 22-2.
FIGURE 22-2 About Page
22-2
About
Model 831 Technical Reference Manual
Standards
The Standards Page lists the standards that the 831 meets.
See FIGURE 22-3.
FIGURE 22-3 Standards Page
Model 831 Technical Reference Manual
Standards
22-3
Options
Options may be added at any time
“In the Field”. Just call one of the
telephone numbers listed on the back
cover or contact your local
representative, listed under “Sales”
on the Larson Davis web site
www.LarsonDavis.com.
The Options Page lists available options for the Model 831.
A check mark next to an option indicates that the option is
enabled. See FIGURE 22-4.
FIGURE 22-4 Options Page
Scroll down to see more options than shown in this graphic.
User
This page displays any identifying information the user may
have entered on the System Properties / Device Page or
using SLM Utility-G3 software. See FIGURE 22-5.
FIGURE 22-5 User Page
22-4
Options
Model 831 Technical Reference Manual
Model 831 Technical Reference Manual
User
22-5
22-6
User
Model 831 Technical Reference Manual
CHAPTER
23
System Utilities
Control Panel - System Utilities
Note: It is necessary to press the 2
key one time in order to see the
System Utilities icon on the Control
Panel.
To activate the System Utilities Page, press the 3 (TOOLS)
key and highlight the System Utilities icon as shown in
FIGURE 23-1.
FIGURE 23-1 Control Panel
Press the
5 key to open the System Utilities Page.
There is one System Utilities Page: File System.
Model 831 Technical Reference Manual
System Utilities
23-1
File System
The File System page is used to repair or recover from file
system problems. The functions available on this page are
similar to function that would be used to manage a hard
drive. See FIGURE 23-2.
FIGURE 23-2 File System
Note that the two USB options shown
in FIGURE 23-2 will only appear if
the USB host port is turned on and a
USB storage device is connected.
The five functions on the File System page are
•
Check File System
•
Format
•
Format & Restore Defaults
•
Check/Repair USB
•
Format USB
Highlight the desired function and press the
initiate this operation.
Warning: Using these functions may
cause loss of data and restoration of
the Model 831 to default conditions.
5
key to
The user should only activate these functions if there
appears to be a problem.
Check File System
These utilities will detect and repair file system problems.
23-2
File System
Model 831 Technical Reference Manual
When the Check File System button is selected, the Model
831 will check the file system in the Model 831, similar to
Check Disk on a PC. If a problem is detected, an attempt
will be made to repair the problem.
Format
Selecting this function will format the internal data storage
area in the memory of the Model 831. This operates similar
to the Format function on a PC. System and Settings are
preserved.
Format & Restore Defaults
Note: User calibrations and
calibration history data are erased
when this function is implemented.
Selecting this function formats the internal data storage area
in the memory of the Model 831. The Model 831 is then
restored to factory settings.
The Format and Format & Restore Defaults function will
erase all internal data files, but it will not affect data stored
in USB memory.
Check/Repair USB
If you believe that the USB mass storage is corrupt, this
utility can be used to check and repair the corrupted sectors
of the USB mass storage device. Set the USB Host Port to
ON, insert the USB mass storage device into the USB
connector and run this utility. When the action has been
completed, the message shown in FIGURE 23-3 will be
displayed.
FIGURE 23-3 USB Check/Repair Done Message
If you still believe that the USB mass storage device is
corrupt, a Format USB operation should be performed.
Model 831 Technical Reference Manual
File System
23-3
Format USB
CAUTION: When the mass storage
device is formatted, all data stored
on it will be lost.
If you believe that the Check/Repair USB operation
described in "Check/Repair USB" on page 23-3 was not
successful, try formatting the USB mass storage device.Set
the USB Host Port to ON, insert the USB mass storage
device into the USB connector and run this utility. When the
action has been completed, the message shown in FIGURE
23-4 will be displayed.
Note: To completely erase a USB
drive, do a Check/Repair USB
operation followed by a Format USB
operation. Also, Format USB will
not format USB drives larger than 2
GB.
FIGURE 23-4 USB Drive Formatted Message
The USB mass storage device will now be formatted using
FAT16 file system.
If for some reason the USB mass storage device is not
detected, the message shown in FIGURE 23-5 will be
displayed.
FIGURE 23-5 USB File System Not Found Message
If any of the above operations are initiated while the USB
mass storage device is mounted or a “move/copy to USB”
operation is in progress, there is a possibility that the file
system will be corrupted. As a result, the operation will be
23-4
File System
Model 831 Technical Reference Manual
denied and the message shown in FIGURE 23-6 will be
displayed.
Note that the Copy to USB icon
appears on the upper left corner of
this display.
Model 831 Technical Reference Manual
FIGURE 23-6 Cannot Check/Repair/Format
Message
File System
23-5
23-6
File System
Model 831 Technical Reference Manual
CHAPTER
24
831 Hardware
Components
Microphone
Microphone
Preamplifier
160 X 240
Graphic LCD
Display
Context Sensitive
Softkeys
Fixed Function
Hardkeys
FIGURE 24-1 Model 831 Front View
Model 831 Technical Reference Manual
831 Hardware
24-1
FIGURE 24-2 Model 831, Dimensioned Drawing
24-2
Components
Model 831 Technical Reference Manual
Block Diagram
A block diagram of the Model 831 is shown in FIGURE 243.
MICROPHONE
-23 dB
PREAMPLIFIER
+33 dB ADC
DAC
+20dB
0
+10 dB
GAIN
34V
DSP
2.7mA
POWER SUPPLY
USB
MINI B
TO COMPUTER
FLASH MEMORY
250 MB
(UP TO 2 GB
INTERNAL)
USB HOST
PORT
USB DEVICE
PORT
USB
A
160 X 240
LCD
KEYBOARD
TO USB FLASH MEMORY,
GPS001, ETC.
FIGURE 24-3 Block Diagram of Model 831
Model 831 Technical Reference Manual
Block Diagram
24-3
Microphones and Microphone Preamplifier
The Model 831 is designed for use with prepolarized
microphones. The following microphone preamplifier is
used:
•
PRM831 1/2” Microphone Preamplifier
The most commonly used microphones, which can be used
with either of these preamplifiers are as follows:
•
1/2” Free Field Microphone with nominal sensitivity of
50 mV/Pa
•
1/2” Random Incidence Microphone with nominal
sensitivity of 50 mV/Pa
•
1/4” Free Field Microphone with nominal sensitivity of
3.16 mV/Pa (ADP043 adaptor required)
•
1/4” Pressure Microphone with nominal sensitivity of 1
mV/Pa (ADP043 adaptor required).
There are two equivalent electrical impedance adaptors
available. These are discussed in Chapter 1 "Optional
Accessories" on page 1-10.
Display
The Model 831 has a 160 x 240 graphic, liquid crystal
greyscale display. The display is backlit to provide
comfortable viewing in most ambient light situations.
Controls are provided for contrast and backlight
adjustments. These controls are discussed in Chapter 3
"Power Control Page" on page 3-8 and Chapter 17 "Power"
on page 17-5.
24-4
Block Diagram
Model 831 Technical Reference Manual
Keypad
SOFTKEYS:
Left
Center
Right
RUN/PAUSE
STOP/STORE
ENTER
UP
LEFT
RIGHT
DOWN
TOOLS
RESET
POWER
FIGURE 24-4 Model 831 Keys
Softkeys
The three push button keys just beneath the display, on the
body of the Model 831, are called Softkeys. Above each
Softkey, on the bottom of the display, is an icon that may
contain a label. The label indicates the action which will
take place when the key is pressed. Softkeys are so named
because the role of each key can change depending upon
how it is programmed, as indicated by the label.
Model 831 Technical Reference Manual
Block Diagram
24-5
Hardkeys
The ten push button hardkeys have fixed functionalities as
defined below.
The Power key is used to turn the Model 831 ON and OFF when the Hardware
Power Switch, on the base of the unit is in the “|” position.
The Navigation keys; Up, Down, Left and Right are multipurpose keys used to
highlight icons and defined areas on the display, make a selection from multiple
options, scroll through sections of multi section Data Views, and to input
alphanumeric characters into data fields.
The Enter key is used to implement data entry associated with selections from
multiple options or the input of alphanumeric characters into data fields.
The Run/Pause key is used to initiate and pause a measurement, and to continue
a paused measurement. This key has a green LED behind it which can be
illuminated to indicate the measurement state of the Model 831.
The Stop/Store key is used to stop a measurement and to store a measurement
when the measurement is stopped. This key has a red LED behind it which can
be illuminated to indicate the measurement state of the Model 831.
The Reset key is used to reset a measurement.
The Tools key is used to set a number of parameters not associated with a
specific measurement, such as setting date and time, managing power options
and setting personal preferences (i.e. language, decimal and date formats, etc.).
Table 24-1 Keypad Hardkeys
Hardkey LED Colors
Two of the hardkeys have colored LEDs behind them, as
indicated below:
24-6
•
9 (Run/Pause) key LED is Green
•
7 (Stop/Store) key LED is Red
Block Diagram
Model 831 Technical Reference Manual
When performing a measurement, the state of the Model 831
is indicated by the illumination of these two keys as follows:
Measurement State
Red
Green
Stopped, Reset
ON, flashing twice every 3.2 sec
Off
Stopped, with unstored data
ON
Off
Stopped, data stored
ON, flashing twice every 3.2 sec
Off
Paused
ON, flashing
Off
Running
Off
ON
Waiting for valid data to begin ON
1
running
ON, flashing
Table 24-2 Measurement State as Indicated by Green/Red LEDs
1
The state of waiting for valid data will occur when the instrument is first switched On, and also following a filter
reset (performed by pressing the 1 (Reset) key when the Model 831 has already been reset).
To conserve power usage, when no key has been pressed for
a period equal to ten times the Backlight Time, the state of
the Model 831 is indicated as follows:
Measurement State
Red
Green
Stopped, Reset
ON, flashing once every 3.2 sec
Off
Stopped, with unstored data
ON, flashing twice every 3.2 sec
Off
Stopped, data stored
ON, flashing once every 3.2 sec
Off
Paused
ON, flashing
Off
Running
Off
ON, flashing twice every
3.2 sec
Waiting for valid data to begin ON
running
ON, flashing rapidly
Table 24-3 Measurement State (after period without key presses)
Model 831 Technical Reference Manual
Block Diagram
24-7
Connectors and Interfaces
Hardware Power Switch USB Interface
AC/DC Output and Headset
AUX Connector
for USB
I/O Connector for Peripherals and
External Power
FIGURE 24-5 Model 831 Bottom Panel
DO NOT use the hardware power
switch to turn the Model 831 ON or
OFF. This will cause data to be lost.
The purpose of this switch is to
disconnect the batteries for storage
(1 to 2 weeks). It is recommended
that the batteries be removed from
the instrument if it will not be used
for a month or longer (the batteries
may self-discharge and leak,
damaging the instrument). See
"Hardware Power Switch” on
page 2-7 for additional information
on the use of the hardware power
switch.
24-8
•
Hardware Power Switch: When set to “O”, completely
powers down the Model 831 for storage. However, the
real-time clock will maintain its value for six minutes,
long enough to complete a battery change. Set to “|” for
instrument operation.
•
USB Interface: USB 2.0 peripheral full-speed port used
for communication with a PC, control of the Model 831
from the PC and downloading of data from the Model
831 to the PC. The PSA029 external power supply may
be connected here. The maximum USB cable length is 5
m and the cable is part number CBL138. Refer to SLM
Utility-G3 manual for system requirements.
•
AC/DC Output and Headset Jack: used to output
analog AC and DC signals or to connect to a headset for
the recording and playback of voice records. See “Jack
Function” on page 17-13.
•
AUX Connector for USB: intended for use with USB
mass storage, cellular & dialup modems, GPS and future
devices.
•
I/O Connector for Peripherals and External Power:
typically used with external devices. For example:
Block Diagram
Model 831 Technical Reference Manual
•CBL143 and CBL151 cables: these cables permit the
Model 831 to be powered from external 12 V batteries.
•CBL154 cable: used to obtain power from a battery
when used with the 426A12
•831-INT: integrates the Model 831 with outdoor
microphone units (426A12 and PRM2100K) and
weather transducers (SEN028, SEN029 and SEN030)
•426A12 and PRM2101K: Model 831 provides control
signals to these outdoor microphone units when not
used with 831-INT
I/O Connector Pinouts
The pinouts for the I/O Connector are as shown in Table 24-4 " Model 831 I/O Pinouts".
Pin #
Description
Signal Type
1
Ground, Digital and Power Supply
Ground
2
Logic Out 1, Logic Control Output
Output, 0 to +2.7 V
3
831 Activity
Output, 0 to +2.7 V
4
Logic In, Logic Control Input
Input, 0 to +5 V
5
Ground, Digital and Power Supply
Ground
6, 7
Vext, External Power Input
Input, +10.8 to +30 V, 0.5 A
auto-resetting PTC fuse
8
SensorClk_L, LD 426A12 digital sensor clock
Output, open drain, +20 V max. open
and 50 mA max. closed
9
SensorDIO, LD 426A12 digital sensor data
Bi-directional, +2.7 to +5 V logic,
open drain
10
CalOn_H, LD 426A12 calibration signal on
Output, 0 to +2.7 V
11
Ovld, LD 426A12 overload detection signal
Input, 0 to +5 V
12
Mains Power Status; OK when +2.7 V
Input, 0 to +2.7 V
13
+2.7 V to supply logic switches
Output, +2.7 V thru 220
14
WindSpeedIn, Pulse input for wind speed
sensors
Input, +5 Vpp max.
Table 24-4 Model 831 I/O Pinouts
Model 831 Technical Reference Manual
Block Diagram
24-9
Pin #
Description
15
Vwthr1, Analog to Digital Converter Input,
Wind Direction
16
Vwthr2, Analog to Digital Converter Input,
Temperature
17
Vwthr3, Analog to Digital Converter Input,
Humidity
18
Analog Ground, Signal ground for pins 15
through 17
Signal Type
Input, 0 to +2.048 V, 10k load,
scale with series resistor
Ground
Table 24-4 Model 831 I/O Pinouts
1. To enable the “Logic In, Logic Control Input” feature, when making your own cable, pin 12 (Mains
Power Status) must be driven by a resistance lower than about 20k. This may be done by connecting
a 10k resistor from pin 12 to either pin 13 (+2.5V, to simulate running on Mains power) or to pin 1 or
5 (Ground, to indicate running on external battery power). Pin 4 needs to be driven high to assert the
Logic In and pulled low to de-assert the input. It should not be left floating. This can be done with a
momentary push-button switch from pin 4 to pin 13 with a 10k pull down resistor to ground (10k
from pin 4 to pin 1 or 5).
Batteries
The installation of batteries into the
Model 831 is discussed in Chapter 2
"Inserting Batteries" on page 2-5.
The Model 831 is compatible with AA nickel metal hydride
(NiMH), Alkaline or 1.5 Volt Lithium batteries. Energizer,
Duracell and other nationally recognized brands are the
preferred suppliers of alkaline batteries. These will provide
the user with the best battery life estimation. Sanyo,
Energizer and Ray-O-Vac, 2500 mAH, Lithium, AA, NiMH
batteries and their respective fast chargers are also
recommended.
WARNING:Do not mix Alkaline and NiMH batteries.
WARNING:Do not mix batteries from different
manufacturers
WARNING:Replace all four batteries when installing
fresh cells
WARNING:The correct battery type must be specified,
as described in "Battery Type" on page 17-5, based on
the battery type installed. Otherwise, serious damage,
injury or fire can occur when the battery type is set to
24-10
Batteries
Model 831 Technical Reference Manual
NiMH but Alkaline or Lithium batteries are installed
because the internal charger will be enabled. Alkaline or
Lithium batteries must not be charged.
See Chapter 3 "Power Control
Page" on page 3-8
Battery Voltage and Estimated Run Time are displayed on
the Power Control screen and the last section of the Live
Pages. The battery icon indicates the state of the battery
charge by the width of the interior shaded portion. The two
icons below indicate a fully charged battery and a nearly
discharged battery..
Full Charge
Low Charge
FIGURE 24-6 Battery Status Icons
A battery icon is always available in the status bar at the top
of the screen. The battery voltage and the state of the battery
icon directly reflect the remaining Estimated Run Time as
displayed by the instrument.
Low Battery
As the battery nears end-of-life (1% of capacity), the empty
battery symbol will begin to flash. The unit will shut down
in a short time because the battery voltage is too low.
When the battery is at the end-of-life, the Model 831 will
stop running, save all data and instrument status, then turn
off. When the unit is turned on again, with fresh batteries or
an external power supply, the unit will return to the state it
was in when it shut down. .
FIGURE 24-7 External Power Icon
If external power is supplied through the USB connector, the
battery icon is replaced with the External Power icon.
When external power is connected to the Model 831, the
unit is not dependant on batteries. The Estimated Run Time
calculation is valid only if there is no external power.
Model 831 Technical Reference Manual
Batteries
24-11
External Power Supply
The Model 831 can be powered from a variety of sources
including internal batteries, via the USB port from a
computer, via the USB port from the PSA029 power supply,
via the I/O port from the PSA027 power supply (using
CBL140 or CBL154), from an external +10.8 to +30 Volt
battery or from an external +10.8 to +30 Volt mains power
source.
USB Port Power
When powered via the USB port by a computer, use of the
computer's USB power is negotiated with the host and
cannot be utilized until permission is granted by the host.
This means that the Model 831 must run on batteries until
allowed by the host to run on USB or external power. If the
batteries cannot provide sufficient power (flat cells) the
Model 831 may not power on. Ensure that the Model 831
has good batteries in order to turn on. If there are no
batteries installed in the instrument, it will use USB power
regardless of negotiation.
The PSA029 is supplied with power
plug adaptors for most areas of the
world.
The Model 831 can be powered via the USB port with the
PSA029 external power supply. The PSA029 has an input
operating voltage range of 90 to 274 VAC and a power line
frequency range of 47 to 63 Hz. The output voltage from the
supply is 5 VDC. The PSA029 used a standard USB A to
Mini-B 5-pin cable which connects to the USB connector on
the bottom of the Model 831.
If the Model 831 is operated without
batteries installed and power is
interrupted, there is a possibility of
data loss.
With the PSA029 power supply connected and operating at
rated conditions, the Model 831 will operate properly with
or without batteries installed.
External Voltage
The Model 831 can also be powered by a +10.8 to +30 dc
voltage applied through the I/O Connector for peripherals
and external voltage as described in Table 24-4, “Model 831
I/O Pinouts,” on page 24-9.
When powering the Model 831 by external power, Larson
Davis recommends the Model 831-INT System Interface
24-12
External Power Supply Model 831 Technical Reference Manual
Units and one of the following cables for making the
connection to the battery or batteries.
Low Voltage Shutdown
The Model 831 has a special feature to preserve the service
life of an external SLA (Sealed Lead-Acid) battery by
preventing it from being discharge excessively. When the
battery voltage drops below the external shutoff voltage
(default value +10.8 volts), but remains above +10.2 volts
for one minute, the instrument will stop, save data and turn
the Model 831 off.
Sudden Loss of External Voltage
If the external voltage is suddenly lost, for example when
the external supply is disconnected or when mains power
fails and there is no external battery, the Model 831 will
continue to run on internal batteries if they are present and in
good condition. Without internal batteries, the Model 831
will shut-down and un-stored data may be lost.
A sudden loss of power while the 831 is storing data may
lead to hardware damage and should be avoided.
This can commonly occur when the 831 is powered from
USB, contains no internal batteries and the PC is supplying
USB power is turned off. To avoid this, turn off the 831 prior
to turning off the PC.
Model 831 Technical Reference Manual
External Power Supply
24-13
24-14
External Power Supply Model 831 Technical Reference Manual
CHAPTER
25
Parameters Measured
This chapter describes the different acoustic parameters
which can be measured, displayed and stored using the
Model 831.
Basic Sound Level Measurements
Frequency Weighting
See "SLM Page" on page 4-4
Each of the sound level parameters measured at one time
will be frequency weighted as set by the user from the
Settings Pages. The frequency weighting for RMS and
Impulse averaged sound levels will be the same, selected
independent from the frequency weighting for peak
detection.
RMS and Impulse Weighting
The Model 831 measures RMS and Impulse averaged sound
level values using one of the following user-selected
frequency weightings:
•
A-Weighting
•
C-Weighting
•
Z-Weighting
Peak Weighting
The Model 831 measures peak sound level values using one
of the following user-selected frequency weightings:
Model 831 Technical Reference Manual
•
A-Weighting
•
C-Weighting
•
Z-Weighting
Parameters Measured
25-1
RMS Averaging
The exponential averaging time for RMS sound levels is set
to one of the following:
•
Slow
•
Fast
An impulse detector is also available.
Sound Level Metrics Measured
In Table 25-1 "Sound Level Metrics Measured" the symbol
X is used to represent the user-selected RMS and Impulse
frequency weighting (A, C or Z) and the symbol Y is used to
represent the user-selected peak frequency weighting (A, C
or Z). The symbol V represents the time weighting Fast,
Slow or Impulse.
Selected RMS
Averaging
Metric
Fast
Slow
Impulse
Peak
Instantaneous Sound Level
LXF
LXS
LXI
LYpeak
Maximum Sound Level
LXFmax
LXSmax
LXImax
LYpeak(max)
Minimum Sound Level
LXFmin
LXSmin
LXImin
Equivalent Level
LXIeq
Integrated
LXeq
Table 25-1 Sound Level Metrics Measured
1/1 and/or 1/3 Octave Frequency Spectra
The Model 831 can perform just 1/1 or 1/3 octave real-time
frequency spectra measurements or they can both be
measured simultaneously. These spectra will be made using
a user-selected frequency weighting (A, C or Z). The
averaging time is the same as that selected for the sound
level measurements (Fast, Slow or Impulse).
Spectral data is displayed on both the Live and Overall
Pages, but only the Overall Data can be stored.
25-2
Basic Sound Level Measurements Model 831 Technical Refer-
Live Page
From the Live Page, the graphic shows the instantaneous
SPL value for all frequencies and the bar to the far right
shows the summation value for the entire frequency band.
The value corresponding to the cursor position is displayed
numerically beneath the graph.
Overall Page
From the Overall Page, the graphic shows the energy
equivalent level calculated over the measurement time
period at each frequency band and, at the far right, for the
summation of all frequency bands. The values displayed
digitally beneath the graph represent the following data for
the frequency band at the cursor position.
•
Leq
•
Lmax
•
Lmin
Sound Exposure Metrics Measured
See Chapter 8 "Industrial Hygiene"
on page 8-1
The Model 831 measures two separate and independent sets
of sound exposure metrics.
The following parameters are user-selectable:
•
Exchange Rate: 3, 4, 5 or 6 dB
•
Threshold Enable: Yes or No
•
Threshold Level: Numeric entry
•
Criterion, Level and Hours: Numeric entries
In Table 25-2: "Sound Exposure Metrics Measured" the
symbol X is used to represent the user-selected RMS and
Impulse frequency weighting (A, C or Z) and the symbol Y
is used to represent the user-selected peak frequency
weighting (A, C or Z).
Model 831 Technical Reference Manual
Sound Exposure Metrics Measured
25-3
The symbol V is used to represent the user selected time
weighting (F, S or I)
Metric
Symbol
Sound Exposure Level, SEL
LXVE
Average Sound Level, Lavg
LXavg
Time Weighted Average Level, TWA(x)
TWA(8)
Noise Dose
DOSE
Projected Noise Dose
ProjDose
Daily Personal Noise Exposure, Lep,d
LXep,8
Sound Exposure, E
EXV
Projected 8 Hour Sound Exposure
EXV8
Projected 40 Hour Sound Exposure
EXV40
SEA
SEA
Table 25-2:Sound Exposure Metrics Measured
Statistical Metrics Measured
Broadband Statistics
For setup of Ln Statistics, see "Ln
Page" on page 4-8
Statistical sound level parameters are very useful for
characterizing time-varying sounds such as environmental
noise. A widely used parameter is Ln, which represents a
sound level which is exceeded n% of the measurement time.
For example, L90 is often used as a measure of the
background noise since it is exceeded 90% of the time.
The Model 831 can calculate and display six different Ln
statistical parameters using the frequency weighting (A, C or
Z) and exponential averaging (Slow or Fast) selected when
setting it up for a sound level measurement. These six values
are user-selected over the range L0.01 to L99.99.
The SLM Utility-G3 software permits
the distribution table from a saved
measurement to be exported to a
spreadsheet which could then be
utilized to calculate any possible
value of Ln over the range L0.01 to
L99.99.
25-4
To determine broadband statistics, the sound level is
sampled every 10 ms. into 0.1 dB wide amplitude classes
over a 199 dB span. The resulting table, from which all
values of Ln between L0.01 to L99.99 can be calculated, is
referred to as the distribution table. This distribution table is
saved whenever an overall measurement is saved.
Statistical Metrics Measured Model 831 Technical Reference
Although the six percentage values are user-defined as part
of the setup, these can be changed without resetting or
stopping a measurement, in order to display different values
of Ln.
Measurement History
When making automatic sequential measurements using the
measurement history feature, a distribution table is saved for
each measurement interval.
Spectral Statistics
When the spectral Ln mode has been enabled in the
frequency spectrum setup, the Model 831 will measure and
store spectral statistical data in addition to broadband
statistical data.
Spectral statistics are similar to broadband statistics except
that values of Ln are determined for every frequency band in
the measured spectrum. To determine spectral statistics, the
sound level in every frequency band is sampled every 100
ms. into 0.1 dB wide amplitude classes over a 199 dB span.
The resulting table, from which all values of Ln between
L0.01 to L99.99 can be calculated for each frequency band, is
referred to as the spectral distribution table. Both the
broadband and the spectral distribution tables are saved
whenever an overall measurement is saved. As with the
broadband distribution table, the SLM Utility-G3 software
can export the spectral distribution table from a saved
measurement to a spreadsheet which could then be utilized
to calculate any possible value of Ln for the range L0.01 to
L99.99 for all frequency bands.
Measurement History
When making automatic sequential measurements using the
measurement history feature, and the spectral Ln mode has
been enabled in the frequency spectrum setup, both the
broadband and spectral distribution tables are saved for each
measurement interval.
Model 831 Technical Reference Manual
Statistical Metrics Measured
25-5
Exceedance Counters
See "Triggers Page" on page 4-11
The Model 831 has three exceedance event counters: two
RMS event counters and three peak event counters. For each
exceedance there is a threshold level, event counter and
duration.
The thresholds LXV or LYpeak are the levels that the
parameter must exceed to increment the counter and
duration. X is RMS frequency weighting, Y is peak
frequency weighting and V is time weighting.
The Count is the number of times each parameter has exceed
the preset level.
The duration is the total accumulated duration of all
exceedances for a specific parameter.
Miscellaneous Parameters
S.E.A.
SEA is a time integration of peak levels that exceed 120 dB.
Time History (831-LOG Required)
See Chapter 10 "Time History" on page 10-1.
Measurement History (831-ELA Required)
See Chapter 11 "Measurement History" on page 11-1.
Event History (831-ELA Required)
See Chapter 12 "Event History" on page 12-1.
25-6
Exceedance Counters Model 831 Technical Reference Manual
CHAPTER
26
Memory Utilization
This chapter presents formulas to calculate the amount
of memory used by the parameters which can be stored
to internal or USB memory.
Out Of Memory Stop
In order to ensure that all measured data can be stored, the
Model 831 will be stopped automatically when the amount
of available memory drops to 1 MB.
Overall Data
Each overall data block stored when performing a “Save
File” operation will utilize memory as follows:
•
Without Spectral Ln enabled: 27 kB
•
With Spectral Ln enabled: 307 kB
Session Log
The amount of memory utilized, in bytes, when storing a
session log is calculated as follows:
52 + 12 *(Number of records)
where Number of records includes the following:
Model 831 Technical Reference Manual
•
Run
•
Pause
•
Stop
•
Voice Message
•
Markers
•
Sound Recording.
Memory Utilization
26-1
Measurement History
The amount of memory utilized, in bytes, when storing each
measurement history block is calculated as follows:
•
Base Size: 4948
•
Additional Noise Dose Data: 68
•
Additional Weather Data: 128
•
Additional Spectral Ln Data: 288000
•
Additional GPS Data: 32
•
Additional Takt Maximal: 4
Time History
The amount of memory utilized, in bytes, when storing a
time history block is calculated as follows:
52 + (Number of records)*[16+4*(Number of parameters enabled)]
where Number of Records = Number of Samples + Number
of Run, Pause and Stop events
Events
The amount of memory utilized, in bytes, when storing each
noise event block without event time history data is
calculated as follows:
Basic Event Data
26-2
•
Base Size: 90
•
With 1/1 Octave Spectra Data : 186
•
With 1/3 Octave Spectra Data: 378
•
With 1/1 and 1/3 Octave Spectra Data: 474
Measurement History Model 831 Technical Reference Manual
Event Time History Data
When event time history data are being saved, this will
increase the amount of memory utilized as follows:
Note that 1/3 octave spectra are
measured when the spectral mode
has been selected to be either 1/3
octave or 1/1,1/3 octave.
•Without Spectral Data: 4*(Number of Samples)+20
•With 1/1 Octave Spectra: 13*4*(Number of Samples)+20
•With 1/1 Octave Spectra: 37*4*(Number of Samples)+20
Voice Messages
The amount of memory utilized, in bytes, when storing each
voice message is calculated as follows:
24+16000*(Record Length)
where Record Length is in seconds.
Sound Recording
The amount of memory utilized, in bytes, when storing each
sound recording is calculated as follows:
72+2*(Sampling Rate)*(Record Length)
where:
Model 831 Technical Reference Manual
•
Sampling Rate is in Hz
•
Record Length is in seconds.
Voice Messages
26-3
Bad Flash Blocks
The Flash memory device used by the Model 831 contains a
controller that performs dynamic bad block mapping. In the
event that a Flash block fails after it has been written, that
bad block may be detected by the Model 831 firmware. If a
bad block is detected, the message shown in FIGURE 26-1
will be displayed.
FIGURE 26-1 Bad Flash Blocks Detected
NOTE: Data in a bad Flash block is
usually
unrecoverable.
Files
downloaded after this message is
displayed should be scrutinized for
errors.
26-4
In this case data should be retrieved from the Model 831 and
a file system format performed. Performing a file-system
format forces the controller to re-map all bad blocks.
Bad Flash Blocks
Model 831 Technical Reference Manual
CHAPTER
27
Upgrade Firmware and
Options
This chapter describes the procedure for upgrading the
Model 831 firmware and/or options.
SLM Utility-G3
The software program SLM Utility-G3 is used to install
firmware and option upgrades, as well as providing remote
control of the Model 831 and downloading data to the PC.
Access the Larson Davis website to see if you are using the
most recent version of this program. If not, download the
latest version from the website or call technical support.
The firmware will be in a zip format. Unzip the file and copy
the folder “CD” to the desktop and run setup.exe in the CD
folder. Follow the instructions to install the upgrade.
The default location is
Piezotronics\Slm Utility-G3.
C:\Program
Files\PCB
When the installation has been completed, an SLM UtilityG3 shortcut will be placed on the desktop.
Double click this shortcut to initiate the SLM Utility-G3
software.
Model 831 Technical Reference Manual
Upgrade Firmware and Options
27-1
Upgrading Model 831 Firmware
The SLM Utility-G3 software is used to implement the
firmware upgrade. The section "SLM Utility-G3” on
page 27-1 describes how to determine the latest version of
the software and how to update the software if you are not
using the latest version.
The CBL138 is included in the 831ACC, which is provided with 831-FF
and 831-RI packages.
Connect the Model 831 to the PC or laptop via the USB
cable CBL138, which is part of the PSA029 power supply,
and run the SLM Utility-G3 software.
Initiate communication between the Model 831 and the PC
or laptop by clicking the connect icon on the toolbar of the
SLM Utility-G3 software.
After communication has been established, the Instrument
Manager, shown in FIGURE 27-1. will appear.
FIGURE 27-1 Instrument Manager
27-2
Upgrading Model 831 Firmware Model 831 Technical Reference Manual
Click the Manual Control Tab to open the Manual Control
page, shown in FIGURE 27-2.
FIGURE 27-2 Manual Control Page
Model 831 Technical Reference Manual
Upgrading Model 831 Firmware
27-3
Click the Upgrade Model 831 box to run the
SLMFirmwareProgrammer software, which will produce the
display shown in FIGURE 27-3.
FIGURE 27-3 SLMFirmwareProgrammer
27-4
Upgrading Model 831 Firmware Model 831 Technical Reference Manual
Click Next to proceed with the upgrade, which will display
the Select File menu shown in FIGURE 27-4.
FIGURE 27-4 Select File Menu
Note that upgrades of both firmware
and options can be performed
simultaneously by checking the
check boxes for both and defining
the paths to the files accordingly. See
section "Upgrading Options” on
page 27-7 for details on upgrading
options.
Click the check box corresponding to the text “Upgrade the
firmware using a .ROM file”.
Define Path to Firmware Upgrade File
Click Browse and use the browser to define the path to the
831-v.rom file which was installed when you upgraded the
SLM Utility-G3 as described in "SLM Utility-G3” on
page 27-1. Unless you saved it to a different location, this
file will be located in the default location C:\Program
Files\PCB Piezotronics\Slm Utility-G3.
Click Next to display the Confirm Choices Menu, shown in
FIGURE 27-5.
Model 831 Technical Reference Manual
Upgrading Model 831 Firmware
27-5
.
FIGURE 27-5 Confirm Choices Menu
If the choice is correct, click Finish to initiate the firmware
upgrade. Otherwise, press Back to modify the choices or
Cancel to abort the procedure.
When the firmware upgrade is in progress, the status of the
upgrade process will be indicated dynamically on the screen
which, when complete, will look as shown in FIGURE 27-6.
27-6
Upgrading Model 831 Firmware Model 831 Technical Reference Manual
FIGURE 27-6 Loading Firmware Screen
for Firmware Upgrade
Upgrading Options
Saving an Option Upgrade File
Before modifying the options, you will need to contact
Larson Davis and arrange to have an option upgrade file sent
to you via E-mail. This will be a.opt file. Save this file on
your PC and make note of the location.
Implementing the Option Upgrade
The procedure for changing the options to the Model 831 is
very similar to upgrading the firmware, as described in
"Upgrading Model 831 Firmware” on page 27-2. Follow the
instructions up until the Select File Menu shown in FIGURE
27-4 “Select File Menu" appears.
Note that upgrades of both options
and firmware can be performed
simultaneously by checking the
check boxes for both and defining
the paths to the files accordingly.
Model 831 Technical Reference Manual
Click the check box corresponding to the text “Changing
installed options using a .OPT file”.
Upgrading Options
27-7
Define Path to Option Upgrade File
Click Browse and use the browser to define the path to the
.opt file you downloaded as described in "Saving an Option
Upgrade File” on page 27-7.
Click Next to display the Confirm Choices Menu. If the
choice is correct, click Finish to initiate the firmware
upgrade. Otherwise, press Back to modify the choices or
Cancel to abort the procedure.
When option upgrade is in progress, the status of the
upgrade process will be indicated dynamically on the screen
which, when complete, will look as shown in FIGURE 27-7.
FIGURE 27-7 Loading Firmware Screen for
Modification of Options
27-8
Upgrading Options
Model 831 Technical Reference Manual
Model 831 Technical Reference Manual
Upgrading Options
27-9
27-10
Upgrading Options
Model 831 Technical Reference Manual
APPENDIX
A
Technical Specifications
The specifications contained in this chapter are subject to change without notice. Please refer to
calibration and measurement results for data on a specific unit.
Standards Met by Model 831
The Model 831 meets the specifications of the following standards:
Sound Level Meter Standards
IEC61672-1 Ed. 1.0 (2002-05) Class 1, Group X
IEC60651 Ed 1.2 (2001) plus Amendment 1 (1993-02) and Amendment 2 (2000-10) Type 1,
Group X
IEC60804 (2000-10) Type 1, Group X
ANSI S1.4-1983 (R 2006) plus Amendment S1.4A-1985 (R 2006) Type 1
ANSI S1.43-1997 (R 2007) Type 1
Octave Filter Standards (Option 831- OB3)
IEC61260 Ed. 1.0 (1995-08) plus Amendment 1 (2001-09), 1/1 and 1/3-octave Bands, Class 1,
Group X, all filters
ANSI S1.11-2004 (2009) Class 1
Personal Noise Dosimeter Standards (Option 831-IH)
IEC61252 Ed. 1.1 (2002-03) Type 1
ANSI S1.25-1991(R2007) Class 1
Room Acoustics Standards (Option 831-RT)
ISO 3382-1:2009 Measurement of Room Acoustic Parameters Part 1: Performance Rooms
ISO 3382-2:2008 Measurement of Room Acoustic Parameters Part 2: Reverberation Time in
Ordinary Rooms
ASTM E2235 (2004) Standard Test Method for Determination of Decay Rates for Use in Sound
Insulation Test Methods.
Safety Requirements for Electrical Equipment for Measurement, Control and
Laboratory Use
IEC61010-1 Ed. 2.0 (2001-02)
Model 831 Technical Reference Manual
Technical Specifications
A-1
Model 831 Specifications
Features
Class 1 Precision Integrating Sound Level Meter with real-time 1/1 and 1/3 Octave Filters.
250 MB standard data memory. 2 GB optional
High contrast 1/8th VGA LCD display with white LED backlight; sunlight readable
Icon-driven graphic user interface
Soft rubber backlit keys
Large dynamic range
Time weightings: Slow, Fast, Impulse, Integration and Peak simultaneously
Integration Method: Linear or Exponential (Slow, Fast or Impulse)
Frequency weightings: A, C, Z simultaneously
1/1 and 1/3 octave frequency analysis available
Voice message annotation and sound recording available
Ln Statistics (L0.01 through L99.9 available)
1/1 or 1/3 Octave Spectral Ln Statistics available
831 Utility software available for setup, control and high speed data download with export to MS
ExcelTM
Multi-tasking processor allows measuring while viewing data or transferring data
Data Secure Feature saves data to permanent memory every minute
Communication Options: Cellular EDGE, RS-232 and Dial-up modem
AC/DC outputs to recorder
Long battery life; > 8 hours continuous measurement
Multiple Language Support
Field-upgradable firmware: keeps instrument current with the latest measurement features
Two-year limited warranty
Table A-1 Model 831 Features
A-2
Model 831 Specifications
Model 831 Technical Reference Manual
Sound Level Meter Specifications
RMS Time weighting:
Slow, Fast or Impulse
Frequency Weightings
A, C or Z
Peak detector Frequency weighting
A, C or Z
Reference range:
0 dB Gain and OBA Normal Range
Exchange rates:
3, 4, 5, or 6 dB with optional 831-IH
Sample rate:
51,200 Hz
Peak rise time
S
Integration Method
Linear or Exponential
Table A-2 Sound Level Meter Specifications
FFT Specifications
Frequency Span
100 Hz - 20 kHz in a 1-2-5 sequence
FFT Lines
400, 800, 1600, 3200, or 6400
Windowing Functions
Hanning, Flat-Top, or Rectangular
Frequency Weighting
A, C, or Z
Zoom
Graphical
Units
dB re 20 Pa
Output
Magnitude
Table A-3 FFT Specifications
Model 831 Technical Reference Manual
Model 831 Specifications
A-3
Performance Specifications
PRM831 with 377B02
Microphone
Gain
Measurement
Range1
Noise Floor1
Linearity Range2
Peak Range2
SPL Max Level2
Peak Max Level2
Max Level
Normal OBA2
Max Level
Low OBARange2
1
2
115 dB
24 to 140 dB
20 dB
24.9 - 120 dB
27 - 120 dB
34 - 120 dB
17 dB
17 dB
21 dB
101 dB
19 - 120 dB
0 dB
N/A
N/A
N/A
11.3 dBV
12.5 dBV
18.9 dBV
116 dBV
24 - 140 dBV
20 dB
N/A
N/A
N/A
- 2.1 dBV
- 2.4 dBV
- 3.1 dBV
112dBV
9 - 121 dBV
C
114 dB
25 - 140 dB
96 dB
23 - 120 dB
118 dBV
22 - 140 dBV
113dBV
8 - 121 dBV
Z
106 dB
32 - 140 dB
66 - 143 dB
66 - 143 dB
77 - 143 dB
140 dB
86 dB
32 - 120 dB
113 dBV
27 - 140 dBV
107dBV
14 - 121 dBV
46 - 123dB
46 - 123
59 - 123 dB
120 dB
76 - 143 dBV
73 - 143 dBV
78 - 143 dBV
140 dBV
56 - 124 dBV
53 - 124 dBV
58 - 124 dBV
121 dBV
143 dB
123 dB
143 dBV
124 dBV
140 dB
120 dB
140 dBV
120 dBV
107 dB
87 dB
107 dBV
87 dBV
A
C
Z
A
C
Z
A
A
C
Z
0 dB
28 - 140 dB
29 - 140 dB
35 - 140 dB
18 dB
18 dB
23 dB
Direct Input
Microphone and electrical self-noise included
Electrical Measurements
Table A-4 Model 831 Performance Specifications
A-4
Model 831 Specifications
Model 831 Technical Reference Manual
Table A-4 OBA Performance Specifications
Nominal
Frequency (Hz)
8.0
16.0
31.5
63.0
Normal OBA Range Linearity Range1
125.0
250.0
500.0
1000.0
2000.0
4000.0
8000.0
16000.0
PRM 831
0dB Gain
(dB)
78
62 to 140
85
55 to 140
87
53 to 140
92
48 to 140
95
45 to 140
94
46 to 140
90
50 to 140
95
45 to 140
92
90
50 to 140
88
52 to 140
85
55 to 140
Model 831 Technical Reference Manual
+20dB Gain
(dB)
83
37 to 120
88
32 to 120
89
31 to 120
90
30 to 120
89
31 to 120
92
28 to 120
91
29 to 120
95
25 to 120
95
25 to 120
92
28 to 120
87
33 to 120
85
35 to 120
Direct Input2
0dB Gain (dB) +20db Gain (dB)
78
62 to 140 dBV
85
55 to 140 dBV
87
53 to 140 dBV
92
48 to 140 dBV
95
45 to 140 dBV
94
46 to 140 dBV
90
50 to 140 dBV
95
45 to 140 dBV
92
48 to 140 dBV
90
50 to 140 dBV
88
50 to 140 dBV
85
55 to 140 dBV
83
37 to 120 dBV
88
32 to 120 dBV
89
31 to 120 dBV
90
30 to 120 dBV
89
31 to 120 dBV
92
28 to 120 dBV
91
29 to 120 dBV
95
25 to 120 dBV
95
25 to 120 dBV
92
28 to 120 dBV
87
33 to 120 dBV
85
35 to 120 dBV
Model 831 Specifications
A-5
8.0
16.0
31.5
63.0
125.0
Low OBA Range, Linearity Range1
250.0
500.0
1000.0
2000.0
4000.0
8000.0
16000.0
93
14 to 107
94
13 to 107
98
9 to 107
101
6 to 107
103
4 to 107
105
2 to 107
105
2 to 107
105
2 to 107
105
3 to 107
102
5 to 107
99
8 to 107
96
12 to 107
73
14 to 87
73
14 to 87
78
9 to 87
81
6 to 87
83
4 to 87
84
3 to 87
85
2 to 87
87
0 to 87
90
-3 to 87
90
-3 to 87
87
0 to 87
85
2 to 87
93
14 to 107 dBV
93
14 to 107 dBV
98
9 to 107 dBV
101
6 to 107 dBV
103
4 to 107 dBV
105
2 to 107 dBV
105
2 to 107 dBV
105
2 to 107 dBV
105
3 to 107 dBV
105
3 to 107 dBV
99
8 to 107 dBV
96
12 to 107 dBV
73
14 to 87 dBV
77
10 to 87 dBV
78
9 to 87 dBV
81
6 to 87 dBV
83
4 to 87 dBV
84
3 to 87 dBV
85
2 to 87 dBV
87
0 to 87 dBV
90
-3 to 87 dBV
90
-3 to 87 dBV
87
0 to 87 dBV
85
2 to 87 dBV
Electrical measurements, microphone noise not included.
Typical preamplifier noise included, direct in electrical performance using CBL093 may
be better than indicated at low frequencies
1
2
Table A-5 OBA Performance Specifications
A-6
Model 831 Specifications
Model 831 Technical Reference Manual
Direct In using ADP074 ICP Adapter
Gain
0 dB
20 dB
SPL Max Level
135 dBV
116 dBV
Peak Max Level
138 dBV
119 dBV
OBA Max Level,
Normal range
135 dBV
116 dBV
OBA Max Level,
Low Range
102 dBV
83 dBV
ICP Constant Current
2.2 ± 0.2 mA
ICP Open Circuit Voltage
32 to 36 VDC
Table A-6 ADP074 ICP Adapter Performance Specifications
Model 831 Technical Reference Manual
Model 831 Specifications
A-7
Physical Characteristics
Length with microphone and preamplifier
11.35 inches
29.0 cm
Length, instrument body only
8.80 inches
22.4 cm
Width
2.80 inches
7.10 cm
Depth
1.60 inches
4.10 cm
Weight with batteries; no preamplifer or
microphone
13.6 oz
390 g
Weight with batteries, preamplifer and
microphone
1.2 lb
550 g
Table A-7 Physical Characteristics
General Specifications
Reference level
114.0 dB SPL
Reference level range
Single large Range for SLM
Normal for OBA option
Reference frequency
1000 Hz
Reference direction
0° is perpendicular to the microphone
diaphragm
Temperature
± 0.5 dB error between
-10° C and 50°C
Storage temperature
-20°C to 70°C
Humidity
± 0.5 dB error from 30% and 90%
relative humidity at 40°C
Equivalent microphone
impedance
12 pF for Larson Davis 1/2” microphone
Range level error (OBA option)
±0.1 dB relative to the reference range
Table A-8 General Specifications
A-8
Model 831 Specifications
Model 831 Technical Reference Manual
Digital Display Update Rate
Once per second. First display indication
is available 0.25 seconds after initiation of
a measurement
Filename Requirements
Up to 12 characters long using letters "A"
to "Z" and "a" to "z"; numbers "0" to "9";
symbols "." period, "-" dash and "_"
underscore.
Effect of an extension cable
(EXCXXX) on calibration
None (up to 200 feet)
Electrostatic Discharges
The instrument is not adversely affected
by electrostatic discharges
Table A-8 General Specifications
Resolution Specifications
Levels
0.1dB
Dose
0.01%
Elapsed time
0.1 second
Real time clock
1 second
Calendar
01 Jan 2005 - 31 Dec 2038
Table A-9 Resolution Specifications
Model 831 Technical Reference Manual
Model 831 Specifications
A-9
Frequency Weightings
Nominal
Frequency
Exact
Frequency
ZWeight
(Ideal)
A
Weight
(Ideal)
C
Weight
(Ideal)
Electrical
Limits:
Class 1
Microphone
Limits:
Class 1
6.3
6.31
0.0
-85.3
-21.3
8.0
7.94
0.0
-77.8
-17.7
10
10.00
0.0
-70.4
-14.3
+ 1.4, - 0.7
±1.5
12.5
12.59
0.0
-63.4
-11.2
+ 0.5, - 0.6
±1.3
16
15.85
0.0
-56.7
-8.5
+ 0.4, -0.5
±1.0
20
19.95
0.0
-50.5
-6.2
+ 0.3, -0.4
±0.5
25
25.12
0.0
-44.7
-4.4
±0.2
±0.5
31.5
31.62
0.0
-39.4
-3.0
±0.2
±0.5
40
39.81
0.0
-34.6
-2.0
±0.2
±0.5
50
50.12
0.0
-30.2
-1.3
±0.5
±0.5
63
63.10
0.0
-26.2
-0.8
±0.5
±0.5
80
79.43
0.0
-22.5
-0.5
±0.5
±0.5
100
100.00
0.0
-19.1
-0.3
±0.5
±0.5
125
125.00
0.0
-16.1
-0.2
±0.5
±0.5
160
158.50
0.0
-13.4
-0.1
±0.2
±0.5
200
199.50
0.0
-10.9
0.0
±0.2
±0.5
250
251.20
0.0
-8.6
0.0
±0.2
±0.5
315
316.20
0.0
-6.6
0.0
±0.2
±0.5
400
398.10
0.0
-4.8
0.0
±0.2
±0.5
500
501.20
0.0
-3.2
0.0
±0.2
±0.5
630
631.00
0.0
-1.9
0.0
±0.2
±0.5
800
794.30
0.0
-0.8
0.0
±0.2
±0.5
Table A-10 Frequency Weightings
A-10
Model 831 Specifications
Model 831 Technical Reference Manual
Nominal
Frequency
Exact
Frequency
ZWeight
(Ideal)
A
Weight
(Ideal)
C
Weight
(Ideal)
Electrical
Limits:
Class 1
Microphone
Limits:
Class 1
1000
1000.00
0.0
0.0
0.0
±0.2
±0.5
1250
1259.00
0.0
0.6
0.0
±0.2
±0.5
1600
1585.00
0.0
1.0
-0.1
±0.2
±0.5
2000
1995.00
0.0
1.2
-0.2
±0.2
±0.5
2500
2512.00
0.0
1.3
-0.3
±0.2
±0.5
3150
3162.00
0.0
1.2
-0.5
±0.2
±0.5
4000
3981.00
0.0
1.0
-0.8
±0.2
±0.5
5000
5012.00
0.0
0.5
-1.3
±0.2
± 0.75
6300
6310.00
0.0
-0.1
-2.0
±0.2
±1.0
8000
7943.00
0.0
-1.1
-3.0
±0.2
±1.0
10000
10000.00
0.0
-2.5
-4.4
±0.2
±1.0
12500
12590.00
0.0
-4.3
-6.2
±0.2
±1.5
16000
15850.00
0.0
-6.6
-8.5
±0.3
±2.0
20000
19950.00
0.0
-9.3
-11.2
±0.5
±2.0
Table A-10 Frequency Weightings
Model 831 Technical Reference Manual
Model 831 Specifications
A-11
Typical Z-Weight Frequency Response
831 with PRM831
Typical Z wt Frequency Response
0 dB Gain
Level
dBµV
0.10
57
0.13
56.99
0.16
57.21
0.20
57.14
0.25
63.93
0.32
72.46
0.40
78.44
0.50
76.13
0.63
82.74
0.79
88.16
1.00
96.03
1.26
103.36
1.59
110.93
2.00
118.3
2.51
125.06
3.16
128.69
3.98
129.48
5.01
129.57
6.31
129.61
7.94
129.71
10.00
129.79
12.59
129.84
15.85
129.88
19.95
129.92
25.12
129.94
31.62
129.95
39.81
129.96
50.12
129.96
63.10
129.97
79.43
129.97
100.00
129.98
831 Z wt High Pass Frequency Response
130
120
110
100
dBμV
Frequency
Hz
90
80
70
60
50
0.1
1.0
10.0
100.0
Hz
Amplitude Units: dBµV
FIGURE A-1 High Pass Frequency Response
A-12
Model 831 Specifications
Model 831 Technical Reference Manual
831 with PRM831
Typical Z wt Frequency Response
0 dB Gain
Level
dBµV
1000
129.99
1259
130.00
1585
130.00
1995
130.01
2512
130.01
3162
130.02
3981
130.02
5012
130.02
6310
130.03
7943
130.03
10000
130.03
12589
130.01
15849
129.93
19953
129.67
21544
129.51
23263
128.63
25119
124.77
27123
113.81
29286
83.73
31623
63.62
34145
70.14
36869
71.18
39811
73.65
42987
73.30
46416
66.57
50119
67.04
54117
72.08
58434
73.93
63096
59.09
68129
74.58
73564
75.80
79433
76.23
85770
73.94
92612
72.14
100000
76.57
831 Z wt Low Pass Frequency Response
130
120
110
100
dBμV
Frequency
Hz
90
80
70
60
50
1000
10000
100000
Hz
Amplitude Units: dBµV
FIGURE A-2 Low Pass Frequency Response
Model 831 Technical Reference Manual
Model 831 Specifications
A-13
AC/DC Output
The purpose of the AC output is to drive a headset to listen to live and recorded sounds. It may be used
for other purposes, but may not function as expected as a source for additional analysis equipment.
The output is amplified for listening purposes and therefore is limited in its maximum output to be less
than the instrument’s maximum input level. For connection to external analysis equipment use the
adapter ADP015 and cable EXC006 to extract the signal directly from the preamplifier output. When
using the PRM831 preamplifier, there will be a DC bias on the output of the BNC connector of the
ADP015 of approximately + 17 Volts.
AC/DC Output Connector
2.5 mm Sub-Miniature Phone Jack
Tip: DC Output
Ring: AC Output
Sleeve: Ground
AC Output Voltage Range
Vpeak maximum output
0.5 mV to 1.6 Vrms sine wave
~70 dB dynamic range
AC Output Gain
(relative to instrument input)
+ 19.2 dB
AC Output Frequency Weighting
Signal is unweighted with frequency limitations imposed by
hardware design (see below)
AC Output Frequency Response
20 Hz to 23.6 kHz (-3 dB), RL= 10 k
21 Hz to 23.6 kHz (-3 dB), RL= 600
95 Hz to 23.6 kHz (-3 dB), RL= 16
AC Output Recommended Loads
Headset with 16 or greaterspeaker impedance
Resistive loads greater than 600 for maximum frequency
response range.
AC Output Impedance
Low impedance headset speaker driver with 100 F coupling
capacitor. Z = 1.5 + 1592/f, where Z is output impedance in
(Ohms) and f is frequency in Hz.
Instrument readings are not affected by AC output loading
although a short circuit when there is a large signal output
may draw excessive power such that the instrument could
power off.
AC Output Phase and Delay
- 180relative to input, 128 s digital delay
DC Output Frequency Weighting
Follows the SLM Frequency Weighting: A, C or Z
Table A-11 AC/DC Output
A-14
Model 831 Specifications
Model 831 Technical Reference Manual
DC Output Time Weighting
Follows the SLM Detector: F, S or I
DC Output Voltage Range
0 to +3 Volt (0 to 300 dB)
V0 = SPL/100
SPL = 100*V0
or
Sensitivity = 0.01 V/dB with resolution of 0.001 V
DC Output Impedance
3650
DC Output Recommended Loads
for less than 0.4% error
A 10 DC Voltmeter represents negligible error (-0.036%).
The output resistance can be accounted for in the interface
design. For example, if a chart recorder has an input load of
10 kthe gain can be set to 1.365 to correct for the loading.
Table A-11 AC/DC Output
Min/Max Integration Time
Minimum and maximum integration time for measurement of time-average levels and sound exposure
levels.
Time Average Levels and Sound Exposure Levels, (s)
Minimum
0.1
Maximum
(daily autostore enabled)
Unlimited
Maximum
(daily autostore disabled, errors less
than 0.5 dB)
> 23 days
Dosimeter Metrics: TWA, Dose (s)
Minimum
0.1
Maximum
Unlimited
Table A-12 Min/Max Integration Time
Model 831 Technical Reference Manual
Model 831 Specifications
A-15
Time of Day Drift
The Model 831 displays the time of day and also time-stamps various single events (i.e. maximum
level) and records.
Time-of-day clock accuracy is shown in Table A-13 (applies only to instruments serial number 2089
and above with firmware version 1.600 or above).
Temperature
Drift per Day
(seconds)
Drift per
Month
(seconds)
Drift per Year
(minutes)
ppm
25C
1
2
2.0
-10 to +50C
2
2.8
-40 to +70C
2
3.5
Table A-13 Time of Day Drift
Time Variations Between Session Log and Overall Start Time
The Session Log and the Run/Stop record in the Time History contain the time when the 9 RUN/
PAUSE button was pressed. The Overall display shows the time when logging begins. Since it takes
some time before data is available to be logged after starting to run, there can be a small difference
between these times.
This discrepancy can show up on the Model 831 where time resolution is in seconds. An example of
would be when the 9 RUN/PAUSE button is pressed a moment before the seconds digit transitions.
Data to be logged is available a moment later but the Seconds digit has changed. In this situation the
difference will appear to be a full second. In actuality the difference is closer to 1/10 of a second.
A-16
Model 831 Specifications
Model 831 Technical Reference Manual
Power Supply
Batteries
4-AA (LR6) NiMH, Alkaline or Energizer L91 e Lithium
cells (supplied with 2500 mAH NiMH cells).
Warning: Use of battery cells with greater than 1.5 Volt
specified rating can damage the instrument and void the
warranty.
External Power
Powered through USB interface from computer or from
PSA029 AC to DC Power Adapter: 5 Volt 5% required.
Applying a voltage greater than specified can damage the
instrument and void the warranty.
External Power
Power through I/O connector: 10 to 15.5 Vdc. Use cable
CBL154 for 426A12 or PSA027 and CBL140 for Model 831INT Interface Unit
2
Table A-14 Power Supply Specifications
Battery Operating Lifetime
Battery
Operating Life, Hours
4-AA (LR6) NiMH Cells
>8
Table A-15 Battery Operating Lifetime
Power Consumption
Model 831 Operating State
Watts
mA @ 12 Volts
mA @ 15 Volts
Running, Backlight Off, USB not connected
1.1
95
76
Running, Backlight Off, USB connected to PC
1.7
142
114
Running, Backlight Bright, USB connected to PC
2.9
238
190
Table A-16 Power Consumption
Model 831 Technical Reference Manual
Model 831 Specifications
A-17
Memory Retention
Data Memory
Permanently stored in non-volatile flash memory every one minute. If power failure, maximum data loss will be less than one minute
Real-time Clock
10 minutes
Table A-17 Memory Retention Without Batteries or External Power
PSA029 AC to DC USB Power Adapter Specifications
DC Output Voltage
5 Volts
DC Output Regulation
Line: ± 5%
Load:
DC Output Load
Minimum: 0 A
Maximum: 0.5 A
DC Output Connector
USB Type A Jack
(USB Cable, type A to mini-B supplied)
AC Input Voltage
90 to 264 Vac
AC Input Frequency
47 to 63 Hz
AC Input Current
0.15 Arms, 120 Vac at maximum load
0.08 Arms, 230 Vac at maximum load
Ac Inrush Current
30 A for 120 Vac at maximum load
60 A for 240 Vac at maximum load
Efficiency
55% typical
Power Saving
0.3 W maximum, no load, 230 Vac, 50 Hz
Temperature
Operation: 0 to 45C
Storage: - 40C to + 85C
Humidity
Operation: 10% to 90%
Storage: 5% to 85%
Safety Approvals
cUL/UL, CE, TEV, C-Tick and SAA
Emissions
FCC Part 15 Class B
EN55022 Class B
Table A-18 PSA029 AC to DC USB Power Adapter Specifications
A-18
Model 831 Specifications
Model 831 Technical Reference Manual
Immunity
EN61000-4-2, Level 4
EN61000-4-3, Level 2
EN61000-4-4, Level 2
EN61000-4-5, Level 3
EN61000-4-6, Level 3
EN61000-4-11
Harmonic
EN6100-3-2 (A1 +A2 + A14)
Flicker
EN6100-3-3
Leakage Current
0.20 A maximum 254 Vac, 54 Hz
Dielectric Withstand (Hipot)
3,000 Vac, 1 minute, 10 mA
MTBF (Full Load, 25C)
kHrs
AC Input Plugs (supplied)
USA: RPA
Europe: RPE
UK: RPK
Australia: RPS
Dimensions/Weight
Length: 75.32 mm (2.97 in)
Height: 31.67 mm (1.25 in)
Width: 45.96 mm (1.81 in)
Weight: 61.1 g (2.16 oz)
Table A-18 PSA029 AC to DC USB Power Adapter Specifications
CE Information
Declaration of Conformity
PCB Piezotronics, Inc. declares that:
Model 831 Sound Level Meter
has been measured in representative configuration with: PRM831 preamplifier, 377B02 microphone
and the following cables: EXC010 microphone extension cable, CBL138 USB interface cable and
CBL139 AC/DC output cable with an applied acoustic field of 74 dB at 1 kHz.
Model 831 Technical Reference Manual
CE Information
A-19
The Model 831 SLM complies with the European Community EMC Directive (2004/108/EC) and also
the Low Voltage Safety Directive (2006/95/EC) by meeting the following standards:
•
IEC61326-1:2005: Electrical equipment for measurement, control and laboratory use - EMC
requirements.
•IEC61000-4-2:2008 Electrostatic discharge (ESD) immunity.
± 8 kV air discharges.
± 4kV contact discharges and
•IEC61000-4-3:2006 Radiated, radio frequency, electromagnetic field immunity. 26 MHz to 1
GHz at 10 V/m, 1.4 GHz to 2 GHz at 3 V/m, 2.0 GHz to 2.7 GHz at 1 V/m with 1 kHz 80%
AM.
•IEC61000-4-4:2004 Electrical fast transient (EFT)/burst immunity. ±2 kV (5/50 ns, 5 kHz).
•IEC61000-4-6:2008 Immunity to RF conducted line disturbances. 10 V, 1 kHz 80% AM from
150 kHz to 80 MHz.
•IEC61000-4-8:2001 Power frequency magnetic field immunity. 80 A/m. 50/60 Hz.
•CISPR 11:2009: Industrial, scientific and medical (ISM) radio-frequency equipment - Electromagnetic disturbance characteristics - Limits and methods of measuremen.t Class B
•
IEC61010-1:2001 Safety requirements for electrical equipment for measurement, control and laboratory use - Part 1: General Requirements.
A-20
CE Information
Model 831 Technical Reference Manual
1/1 and 1/3 Octave Filters
The 1/1 and 1/3 octave filters (Option 831-OB3) comply with all requirements of IEC 61260 Ed 1.0
(1995-08) including amendment 1 (2001-09) for Class 0 and all requirements of ANSI S1.11-2004 for
Class 1. These digital filters are sampled at a rate of 51,200 samples per second, with base X10 center
frequencies and having real-time performance for all filters. The 0 dB gain setting is the reference
range and the reference input signal is 1 Volt rms at 1 kHz.
When testing filters, an ADP092 adaptor should be used. If this is not available, a 2-pole filter with
cutoff frequency of 75 kHz can be used as an alternative.
Frequency Range
1/1 Octave Filters: 8 Hz to 16 kHz
1/3 Octave Filters: 6.3 Hz to 20 kHz
Filter Shape
The following figure represents the filter shape for the 1/3 octave band centered at 1 kHz. Overlaid
with this curve is the limit curves associated with IEC 61260 Ed 1.0 (1995-08) Class 0.
Model 831 Technical Reference Manual
1/1 and 1/3 Octave Filters
A-21
Sound Level Meter Model: 831 Serial Number: 0001681 Firmware: 1.500
Certificate of 1000.0 Hz Third Octave Filter Shape
This Sound Level Meter (including attached PRM831 preamplifier and ADP090 12pF input adapter) was calibrated with a reference
1kHz sine wave. The instrument's 1000.0 Hz filter response was then electrically tested using a 128.00 dBSPL sinewave at
selected frequencies as specified in IEC 61260-2001. Instrument is in normal OBA range.
10.00
0.00
-10.00
-20.00
Level (dB)
-30.00
-40.00
-50.00
-60.00
-70.00
-80.00
-90.00
-100.00
100
1000
10000
Frequency (Hz)
Freq
(Hz)
Measured
(dB)
Uncert
(dB)
Limits
(dB)
Freq
(Hz)
Measured
(dB)
Uncert
(dB)
Limits
(dB)
185.46
327.48
-95.29
-91.81
0.10
0.10
-75.00, -inf
-62.00, -inf
1026.67
1055.75
0.00
-0.01
0.10
0.10
+0.15, -0.20
+0.15, -0.40
531.43
772.57
-97.83
-76.24
0.10
0.10
-42.50, -inf
-18.00, -inf
1087.46
1122.02
-0.23
-2.96
0.10
0.10
+0.15, -1.10
-2.30, -4.50
891.25
919.58
-3.01
-0.41
0.10
0.10
-2.30, -4.50
+0.15, -1.10
1294.37
1881.73
-94.91
-98.90
0.10
0.10
-18.00, -inf
-42.50, -inf
947.19
974.02
-0.00
-0.04
0.10
0.10
+0.15, -0.40
+0.15, -0.20
3053.65
5391.95
-99.09
-98.76
0.10
0.10
-62.00, -inf
-75.00, -inf
1000.00
-0.00
0.10
+0.15, -0.15
Uncertainties are given as expanded uncertainty at ~95% confidence level (k=2).
This instrument is in compliance with IEC 61260-2001 Class 0 and ANSI S1.11-2004 Class 0.
Technician: Ron Harris
Test Date: 27 Jun 2008 10:44:06
FIGURE A-3 Passband of 1kHz 1/3 Octave Filter
A-22
1/1 and 1/3 Octave Filters
Model 831 Technical Reference Manual
1/1 Octave Filter Linearity
The filter linearity range depends upon both the Input Gain, which is set as described in the section "20
dB Gain" on page 4-5, and the Filter Range, which is set as described in the section "OBA Range
Setting" on page 4-7.The data, which were measured using an electrical input, are in dB re. 1 V,
which is equivalent to dBSPL when a 50 mV/Pa microphone is used
Gain
Range
0 dB
Normal
Frequency
8.0
16.0
31.5
63.0
125.0
250.0
500.0
1000.0
2000.0
4000.0
8000.0
16000.0
Overload
140.8
140.8
140.8
140.8
140.8
140.8
140.8
140.8
140.8
140.8
140.8
140.8
0 dB
Low
Lower
Linearity
Limit
Linearity
Range
78.9
85.8
87.8
92.8
95.8
94.8
90.8
95.7
92.7
90.8
88.8
85.8
61.9
55.0
53.0
48.0
45.0
46.0
50.0
45.1
48.1
50.0
52.0
55.0
Noise
Floor Overload
31.9
31.9
30.4
29.5
31.1
31.1
33.5
31.7
33.6
36.7
40.3
43.6
20 dB
Normal
Linearity
Range
107.5
107.5
107.5
107.5
107.5
107.5
107.5
107.5
107.5
107.5
107.5
107.5
75.5
78.7
80.5
81.5
84.5
90.5
92.5
88.5
92.5
90.5
87.5
84.5
Lower
Linearity
Limit
Noise
Floor
32.0
28.8
27.0
26.0
23.0
17.0
15.0
19.0
15.0
17.0
20.0
23.0
14.1
12.8
8.8
6.2
4.4
2.2
2.1
2.0
2.5
5.1
8.3
11.5
Overload
Linearity
Range
120.7
120.7
120.7
120.7
120.7
120.7
120.7
120.7
120.7
120.7
120.7
120.7
83.7
88.7
89.7
90.7
89.7
92.7
91.7
95.7
95.6
92.6
87.7
85.7
20 dB
Low
Lower
Linearity
Limit
37.0
32.0
31.0
30.0
31.0
28.0
29.0
25.0
25.1
28.1
33.0
35.0
Noise
Floor
Overload
16.2
14.7
14.3
12.9
12.6
11.2
12.1
12.0
13.8
16.7
20.2
23.5
Linearity
Range
87.4
87.4
87.4
87.4
87.4
87.4
87.4
87.4
87.4
87.4
87.4
87.4
52.4
59.4
58.4
60.4
65.4
70.4
69.4
70.4
75.4
77.4
75.4
73.4
Lower
Linearity
Limit
35.0
28.0
29.0
27.0
22.0
17.0
18.0
17.0
12.0
10.0
12.0
14.0
Noise
Floor
13.7
10.0
9.0
5.8
4.1
2.8
2.0
0.2
-2.9
-2.3
-0.4
2.0
Table A-19 1/1 Octave Linearity Range
1/1 Octave Filter Summation
Summation (dB)
1/1 Octave Sum m ation
2
1.5
1
0.5
0
-0.5
-1
-1.5
-2
8.058 18.84 44.03 102.9 240.6 562.3 1314 3073 7182
Frequency
FIGURE A-4 Gain = 0 dB, Filter Range = Normal
Model 831 Technical Reference Manual
1/1 and 1/3 Octave Filters
A-23
Summation (dB)
1/1 Octave Sum m ation
2
1.5
1
0.5
0
-0.5
-1
-1.5
-2
8.058 18.57 42.78 98.57 227.1 523.3 1206 2778 6401 14749
Frequency
FIGURE A-5 Gain = 0 dB, Filter Range = Low
Summation (dB)
1/1 Octave Sum m ation
2
1.5
1
0.5
0
-0.5
-1
-1.5
-2
8.058 21.13 55.43 145.4 381.3 1000 2623 6879
Frequency
FIGURE A-6 Gain = 20 dB, Filter Range = Normal
A-24
1/1 and 1/3 Octave Filters
Model 831 Technical Reference Manual
Summation (dB)
1/1 Octave Sum m ation
2
1.5
1
0.5
0
-0.5
-1
-1.5
-2
8.058 18.84 44.03 102.9 240.6 562.3 1314 3073 7182
Frequency
FIGURE A-7 Gain = 20 dB, Filter Range = Low
Model 831 Technical Reference Manual
1/1 and 1/3 Octave Filters
A-25
1/3 Octave Filter Linearity
The filter linearity range depends upon both the Input Gain, which is set as described in the section "20
dB Gain" on page 4-5, and the Filter Range, which is set as described in the section "OBA Range
Setting" on page 4-7.The data, which were measured using an electrical input, are in dB re. 1 V,
which is equivalent to dBSPL when a 50 mV/Pa microphone is use.
Gain
0 dB
Range
Normal
Frequency
6.3
8
10
12.5
16
20
25
31.5
40
50
63
80
100
125
160
200
250
315
400
500
630
800
1000
1250
1600
2000
2500
3150
4000
5000
6300
8000
10000
12500
16000
20000
Overload
140.8
140.8
140.8
140.8
140.8
140.8
140.8
140.8
140.8
140.8
140.8
140.8
140.8
140.8
140.8
140.8
140.8
140.8
140.8
140.8
140.8
140.8
140.8
140.8
140.8
140.8
140.8
140.8
140.8
140.8
140.8
140.8
140.8
140.8
140.8
140.8
0 dB
Linearity
Range
88.1
91.8
92.8
91.8
91.8
92.8
94.8
93.8
93.8
95.8
97.8
98.8
97.8
96.8
100.8
99.8
99.8
101.8
97.8
98.8
101.7
100.7
97.8
99.8
100.8
100.8
99.8
96.8
97.7
95.7
93.8
91.8
92.7
91.7
90.8
88.8
20 dB
Low
Lower
Linearity
Limit
52.0
49.0
48.0
49.0
49.0
48.0
46.0
47.0
47.0
45.0
43.0
42.0
43.0
44.0
40.0
41.0
41.0
39.0
43.0
42.0
39.1
40.1
43.0
41.0
40.0
40.0
41.0
44.0
43.1
45.1
47.0
49.0
48.1
49.1
50.0
52.0
Noise Floor Overload
27.6
26.7
28.4
28.2
25.5
27.7
25.7
26.5
25.7
25.2
25.7
25.8
25.0
24.6
25.2
25.6
27.7
26.5
26.0
25.9
25.8
26.5
26.9
27.8
28.3
28.8
29.8
30.9
31.9
33.1
33.9
35.5
36.6
37.6
38.6
40.2
107.5
107.5
107.5
107.5
107.5
107.5
107.5
107.5
107.5
107.5
107.5
107.5
107.5
107.5
107.5
107.5
107.5
107.5
107.5
107.5
107.5
107.5
107.5
107.5
107.5
107.5
107.5
107.5
107.5
107.5
107.5
107.5
107.5
107.5
107.5
107.5
20 dB
Normal
Linearity
Range
71.5
74.5
78.5
75.9
76.7
78.7
81.5
85.5
85.5
86.5
87.5
83.5
84.5
87.5
88.5
87.5
93.5
96.5
95.5
89.5
96.5
94.5
95.5
97.5
96.5
97.5
96.5
94.5
94.5
92.5
93.5
91.5
90.5
89.5
89.5
87.7
Lower
Linearity
Limit
36.0
33.0
29.0
31.6
30.8
28.8
26.0
22.0
22.0
21.0
20.0
24.0
23.0
20.0
19.0
20.0
14.0
11.0
12.0
18.0
11.0
13.0
12.0
10.0
11.0
10.0
11.0
13.0
13.0
15.0
14.0
16.0
17.0
18.0
18.0
19.8
Noise Floor Overload
12.3
9.6
8.3
8.8
6.9
6.0
5.5
5.3
3.6
1.5
1.5
1.2
0.5
-1.4
-1.8
-1.8
-3.0
-2.5
-2.0
-2.1
-2.3
-3.0
-3.1
-2.9
-2.6
-2.1
-1.5
-0.4
0.4
1.4
2.4
3.5
4.5
5.8
6.5
8.2
120.7
120.7
120.7
120.7
120.7
120.7
120.7
120.7
120.7
120.7
120.7
120.7
120.7
120.7
120.7
120.7
120.7
120.7
120.7
120.7
120.7
120.7
120.7
120.7
120.7
120.7
120.7
120.7
120.7
120.7
120.7
120.7
120.7
120.7
120.7
120.7
Linearity
Range
81.7
87.7
87.7
89.7
88.7
90.7
87.7
90.7
92.7
92.7
95.7
93.7
96.7
94.7
95.7
99.7
98.7
99.7
96.7
92.7
100.7
99.7
100.7
100.7
100.7
100.7
99.7
98.7
97.7
96.7
94.7
92.7
93.7
91.7
91.7
89.7
Low
Lower
Linearity
Limit
39.0
33.0
33.0
31.0
32.0
30.0
33.0
30.0
28.0
28.0
25.0
27.0
24.0
26.0
25.0
21.0
22.0
21.0
24.0
28.0
20.0
21.0
20.0
20.0
20.0
20.0
21.0
22.0
23.0
24.0
26.0
28.0
27.0
29.0
29.0
31.0
Noise Floor Overload
13.5
12.7
11.3
9.1
10.6
9.8
8.8
8.4
8.1
7.7
8.4
7.5
7.6
6.2
4.4
5.8
4.8
5.6
8.1
5.6
6.0
6.1
6.4
7.6
8.0
8.7
9.6
10.6
11.6
13.0
14.1
15.0
16.4
17.5
18.5
20.2
87.0
87.0
87.0
87.0
87.0
87.0
87.0
87.0
87.0
87.0
87.0
87.0
87.0
87.0
87.0
87.0
87.0
87.0
87.0
87.0
87.0
87.0
87.0
87.0
87.0
87.0
87.0
87.0
87.0
87.0
87.0
87.0
87.0
87.0
87.0
87.0
Linearity
Range
53.0
47.0
58.0
59.0
60.0
59.0
60.0
64.0
63.0
66.0
67.0
71.0
69.0
71.0
73.0
71.0
75.0
74.0
75.0
79.0
80.0
81.0
81.0
79.0
82.0
82.0
81.0
81.0
82.0
82.0
81.0
80.0
79.0
79.0
78.0
77.0
Lower
Linearity
Limit
34.0
40.0
29.0
28.0
27.0
28.0
27.0
23.0
24.0
21.0
20.0
16.0
18.0
16.0
14.0
16.0
12.0
13.0
12.0
8.0
7.0
6.0
6.0
8.0
5.0
5.0
6.0
6.0
5.0
5.0
6.0
7.0
8.0
8.0
9.0
10.0
Noise Floor
9.9
9.6
9.3
7.9
6.8
5.6
5.9
4.1
2.6
2.5
2.9
2.7
2.3
-0.3
-2.4
-1.5
-3.0
-3.1
-3.6
-3.1
-4.2
-4.1
-4.9
-6.6
-7.4
-7.7
-7.6
-7.6
-7.0
-6.5
-6.1
-5.2
-4.5
-3.6
-2.9
-1.6
Table A-20 1/3 Octave Linearity Range
A-26
1/1 and 1/3 Octave Filters
Model 831 Technical Reference Manual
1/3 Octave Filter Summation
1/3 Octave Filter Sum m ation
2
1.5
Error (dB)
1
0.5
0
-0.56.31 15.25 36.87 89.13 215.4 520.8 1259 3043 7356 17783
-1
-1.5
-2
Frequency
FIGURE A-8 Gain = 0 dB, Filter Range = Normal
Error (dB)
1/3 Octave Filter Sum m ation
2
1.5
1
0.5
0
-0.5
-1
-1.5
-2
6.31 15.11 36.17 86.6 207.3 496.4 1189 2846 6813 16312
Frequency
FIGURE A-9 Gain = 0 dB, Filter Range = Low
Model 831 Technical Reference Manual
1/1 and 1/3 Octave Filters
A-27
Error (dB)
1/3 Octave Filter Sum m ation
2
1.5
1
0.5
0
-0.5
-1
-1.5
-2
6.31 17.61 49.17 137.2 383.1 1069 2985 8334
Frequency
FIGURE A-10 Gain = 20 dB, Filter Range = Normal
Error (dB)
1/3 Octave Filter Sum m ation
2
1.5
1
0.5
0
-0.5
-1
-1.5
-2
6.31 15.11 36.17 86.6 207.3 496.4 1189 2846 6813 16312
Frequency
FIGURE A-11 Gain = 20 dB, Filter Range = Low
A-28
1/1 and 1/3 Octave Filters
Model 831 Technical Reference Manual
Minimum Residual Filter Decay Time for RT 60 (option 831-RT)
Table A-20 on page A-26 shows the residual decay time (TR) and the bandwidth-time product (BT)
for each of the filters on the Model 831. This data was taken by feeding the output of the internal pink
noise source into the input of the Model 831 using a CBL09x. The residual decay time for each
frequency is the T30 of the ensemble average of 50 decays.
Frequency
50.0 Hz
63.0 Hz
80.0 Hz
100 Hz
125 Hz
160 Hz
200 Hz
250 Hz
315 Hz
400 Hz
500 Hz
630 Hz
800 Hz
1000 Hz
1250 Hz
1600 Hz
2000 Hz
2500 Hz
3150 Hz
4000 Hz
5000 Hz
6300 Hz
800 Hz
10000 Hz
1/3 Octave
TR (ms)
BT
378
4.37
301
4.38
216
3.96
181
4.18
153
4.43
119
4.34
94
4.32
75
4.36
55
4.04
43
3.93
37
4.26
29
4.18
24
4.44
13
3.11
17
4.97
16
5.85
12
5.38
11
6.30
11
6.30
10
9.45
8
9.42
5
7.27
10
18.69
7
17.05
TR (ms)
1/1 Octave
BT
160
7.12
86
7.63
40
7.10
16
5.62
8
5.56
6
8.87
5
13.63
5
28.50
Table A-21 Residual Decay Times
Model 831 Technical Reference Manual
1/1 and 1/3 Octave Filters
A-29
Position of Instrument and Operator
When making a measurement, it is recommended that the observer be positioned as far behind and to
the right of the instrument as possible to minimize interference of the sound field at the microphone
resulting from body reflections. When using the Model 831, the meter is held in one hand with the arm
extended away from the body. Better results can be obtained by using a tripod.
Effect of Windscreen
The corrections which should be subtracted from the measured data when using the Larson-Davis
Model WS001 3½ inch diameter windscreen with a ½ inch Larson-Davis microphone are as indicated
in the following table.
Directional Response Effect of 3½ Inch Wind Screen on 377B02 Microphone Attached to Model 831
Frequency
(Hz)
251.19
266.07
281.84
298.54
316.23
334.97
354.81
375.84
398.11
421.70
446.68
473.15
501.19
530.88
562.34
595.66
630.96
668.34
707.95
749.89
794.33
841.40
891.25
944.06
1000.00
1059.25
1122.02
1188.50
1258.93
1333.52
1412.54
1496.24
1584.89
1678.80
1778.28
1883.65
1995.26
2113.49
2238.72
2371.37
2511.89
2660.73
2818 38
0
0.00
0.00
0.00
0.07
0.00
0.00
0.03
0.03
0.00
0.00
0.00
0.03
0.10
0.03
0.10
0.07
0.03
0.10
0.10
0.10
0.10
0.03
0.10
0.13
0.20
0.10
0.20
0.20
0.13
0.20
0.20
0.23
0.33
0.30
0.40
0.40
0.40
0.50
0.50
0.50
0.50
0.53
0 57
15
0.00
0.00
0.10
0.07
0.03
0.00
0.07
0.07
0.00
0.00
0.03
0.03
0.10
0.10
0.10
0.10
0.00
0.10
0.10
0.10
0.10
0.07
0.07
0.17
0.10
0.10
0.23
0.10
0.17
0.20
0.20
0.20
0.30
0.30
0.40
0.40
0.50
0.50
0.50
0.50
0.57
0.53
0 53
30
0.00
0.03
0.07
0.00
0.07
0.03
0.10
0.03
0.10
0.07
0.03
0.03
0.13
0.13
0.13
0.13
0.07
0.13
0.13
0.13
0.13
0.10
0.10
0.20
0.13
0.23
0.23
0.23
0.23
0.33
0.23
0.23
0.37
0.40
0.43
0.43
0.43
0.53
0.53
0.53
0.53
0.57
0 57
45
0.00
-0.03
-0.03
0.00
0.00
0.00
-0.03
0.00
-0.03
0.03
-0.03
0.00
0.07
0.07
0.07
0.07
-0.03
0.07
0.07
0.07
0.07
0.07
0.00
0.07
0.07
0.17
0.13
0.07
0.17
0.27
0.17
0.17
0.30
0.37
0.37
0.37
0.47
0.47
0.47
0.47
0.57
0.57
0 60
60
0.00
0.00
-0.07
-0.03
-0.07
-0.07
-0.07
-0.03
-0.03
-0.07
0.00
0.03
-0.03
-0.07
0.03
-0.03
0.00
0.03
0.03
0.00
0.03
0.03
0.03
0.07
0.03
0.13
0.13
0.13
0.13
0.13
0.23
0.23
0.27
0.33
0.33
0.33
0.43
0.43
0.43
0.43
0.50
0.50
0 50
Angle from Reference direction (degrees)
75
90
105
120
0.00
0.00
0.00
0.00
0.00
0.00
-0.03
0.03
0.00
0.03
0.00
0.07
0.00
0.03
-0.03
-0.03
-0.03
0.00
-0.03
0.03
-0.03
0.07
-0.13
0.00
0.00
0.00
-0.03
0.03
-0.03
0.00
-0.03
0.03
0.00
0.00
-0.03
0.07
-0.03
0.00
-0.03
0.03
-0.03
0.10
0.03
0.03
-0.03
0.07
0.00
0.03
0.07
0.00
0.00
0.13
0.07
0.03
0.03
0.07
0.07
0.00
-0.03
0.13
0.03
0.00
0.00
0.10
0.07
0.10
0.07
0.13
0.00
0.03
0.03
0.07
0.07
0.10
0.07
0.03
-0.03
0.10
0.07
0.13
0.13
0.10
0.07
0.13
0.07
0.10
0.10
0.03
0.07
0.03
0.07
0.13
0.07
0.13
0.17
0.20
0.17
0.10
0.17
0.23
0.07
0.10
0.07
0.13
0.17
0.10
0.17
0.23
0.17
0.10
0.17
0.13
0.17
0.23
0.13
0.23
0.17
0.20
0.23
0.23
0.17
0.20
0.27
0.23
0.17
0.20
0.27
0.23
0.27
0.33
0.27
0.30
0.27
0.30
0.27
0.33
0.33
0.40
0.37
0.33
0.37
0.40
0.37
0.33
0.47
0.40
0.37
0.37
0.47
0.40
0.47
0.43
0.47
0.50
0.47
0.47
0.47
0.50
0.47
0.53
0.57
0.53
0.53
0.53
0.50
0.60
0.50
0.53
0 50
0 53
0 53
0 57
135
0.00
0.00
0.00
0.03
-0.03
0.00
0.03
0.00
-0.03
0.00
0.00
0.00
0.10
0.00
0.10
0.07
0.10
0.00
0.10
0.10
0.10
0.10
0.07
0.17
0.10
0.10
0.20
0.20
0.17
0.20
0.20
0.27
0.27
0.20
0.40
0.30
0.40
0.37
0.40
0.50
0.50
0.50
0 57
150
0.00
-0.03
-0.03
-0.10
-0.10
-0.07
-0.03
-0.10
-0.07
-0.07
0.00
-0.07
-0.07
-0.03
-0.03
-0.03
0.03
0.03
0.03
0.03
0.03
0.03
0.03
0.03
0.03
0.03
0.13
0.13
0.13
0.13
0.13
0.13
0.20
0.17
0.13
0.23
0.23
0.33
0.30
0.33
0.37
0.43
0 43
165
0.00
-0.03
0.03
0.03
0.07
0.07
0.03
0.00
0.07
0.00
0.00
0.03
0.03
0.03
0.00
0.07
0.10
0.10
0.10
0.10
0.10
0.10
0.10
0.17
0.10
0.10
0.13
0.17
0.10
0.20
0.17
0.10
0.27
0.20
0.30
0.30
0.33
0.33
0.40
0.50
0.47
0.50
0 57
180
0.00
0.00
0.00
0.00
0.00
0.00
0.00
0.00
0.07
0.00
0.00
0.00
0.00
0.00
0.07
0.00
0.10
0.00
0.00
0.10
0.10
0.10
0.10
0.13
0.10
0.10
0.10
0.10
0.20
0.10
0.20
0.20
0.30
0.27
0.30
0.30
0.30
0.40
0.40
0.40
0.47
0.43
0 50
Continued on next page
A-30
Position of Instrument and Operator
Model 831 Technical Reference
Frequency
(Hz)
2818.38
2985.38
3162.28
3349.65
3548.13
3758.37
3981.07
4216.97
4466.84
4731.51
5011.87
5308.84
5623.41
5956.62
6309.57
6683.44
7079.46
7498.94
7943.28
8413.95
8912.51
9440.61
10000.00
10592.54
11220.18
11885.02
12589.25
13335.21
14125.38
14962.36
15848.93
16788.04
17782.79
18836.49
19952.62
0
0.57
0.40
0.40
0.30
0.23
0.20
0.10
0.03
0.00
-0.30
-0.17
0.00
0.00
0.17
0.10
0.13
0.03
-0.10
-0.30
-0.40
-0.40
-0.37
-0.13
-0.20
-0.47
-0.67
-0.57
-0.70
-0.40
-0.70
-0.90
-0.90
-0.87
-0.90
-1.27
15
0.53
0.50
0.40
0.40
0.27
0.23
0.10
0.00
-0.07
-0.20
-0.20
-0.10
-0.07
0.07
0.20
0.10
0.07
-0.10
-0.37
-0.37
-0.50
-0.40
-0.20
-0.20
-0.43
-0.73
-0.73
-0.67
-0.50
-0.73
-0.90
-1.07
-0.93
-1.10
-1.30
30
0.57
0.43
0.53
0.37
0.33
0.13
0.13
0.10
-0.07
-0.17
-0.17
-0.07
-0.03
0.10
0.23
0.20
0.07
-0.07
-0.30
-0.37
-0.37
-0.37
-0.27
-0.17
-0.37
-0.63
-0.83
-0.63
-0.57
-0.53
-0.97
-1.00
-0.93
-0.90
-1.13
45
0.60
0.57
0.50
0.37
0.30
0.17
0.13
0.03
-0.07
-0.23
-0.30
-0.23
-0.17
-0.13
-0.03
0.07
0.07
-0.03
-0.23
-0.43
-0.53
-0.50
-0.43
-0.40
-0.43
-0.60
-0.87
-0.83
-0.60
-0.73
-1.03
-1.30
-1.10
-1.10
-1.47
60
0.50
0.43
0.33
0.37
0.23
0.23
0.00
-0.10
-0.17
-0.27
-0.27
-0.30
-0.20
-0.17
-0.07
-0.03
0.03
-0.07
-0.33
-0.53
-0.67
-0.67
-0.57
-0.47
-0.53
-0.73
-0.97
-1.00
-0.90
-0.97
-1.27
-1.33
-1.33
-1.43
-1.73
Angle from Reference direction (degrees)
75
90
105
120
0.50
0.53
0.53
0.57
0.50
0.57
0.53
0.57
0.57
0.50
0.47
0.53
0.43
0.40
0.40
0.43
0.37
0.33
0.33
0.37
0.27
0.20
0.23
0.33
0.13
0.10
0.10
0.23
0.07
0.00
-0.03
0.07
-0.07
-0.10
-0.10
-0.07
-0.30
-0.30
-0.43
-0.27
-0.23
-0.40
-0.33
-0.37
-0.33
-0.40
-0.43
-0.47
-0.33
-0.37
-0.43
-0.47
-0.23
-0.33
-0.37
-0.43
-0.03
-0.10
-0.33
-0.37
-0.03
-0.13
-0.17
-0.27
0.00
-0.10
-0.13
-0.17
-0.03
-0.20
-0.23
-0.27
-0.23
-0.33
-0.40
-0.37
-0.43
-0.57
-0.57
-0.57
-0.63
-0.70
-0.73
-0.73
-0.70
-0.70
-0.83
-0.77
-0.57
-0.77
-0.83
-0.77
-0.47
-0.70
-0.83
-0.83
-0.47
-0.70
-0.90
-0.77
-0.57
-0.83
-0.90
-0.83
-0.97
-1.00
-1.00
-1.00
-1.17
-1.10
-1.07
-1.07
-1.00
-1.00
-1.20
-1.17
-0.90
-1.10
-1.33
-1.23
-1.13
-1.30
-1.60
-1.37
-1.47
-1.50
-1.53
-1.40
-1.53
-1.70
-1.57
-1.67
-1.43
-1.70
-1.83
-1.80
-1.67
-2.07
-2.30
-1.97
135
0.57
0.57
0.50
0.43
0.40
0.37
0.20
0.03
0.00
-0.20
-0.40
-0.50
-0.50
-0.50
-0.40
-0.33
-0.27
-0.20
-0.33
-0.50
-0.80
-0.90
-0.90
-0.83
-0.80
-0.87
-1.17
-1.37
-1.37
-1.50
-1.57
-1.70
-1.73
-1.83
-2.23
150
0.43
0.37
0.43
0.40
0.33
0.27
0.13
0.03
-0.07
-0.37
-0.37
-0.60
-0.53
-0.57
-0.47
-0.40
-0.27
-0.27
-0.33
-0.43
-0.73
-0.93
-0.97
-0.97
-0.77
-0.73
-1.07
-1.53
-1.63
-1.53
-1.37
-1.77
-2.30
-2.13
-2.13
165
0.57
0.50
0.50
0.50
0.40
0.40
0.27
0.10
0.00
-0.20
-0.30
-0.43
-0.43
-0.50
-0.40
-0.40
-0.23
-0.10
-0.20
-0.23
-0.50
-0.77
-0.90
-0.87
-0.90
-0.70
-0.90
-1.20
-1.47
-1.43
-1.40
-1.43
-2.00
-2.27
-1.97
180
0.50
0.50
0.50
0.50
0.40
0.30
0.23
0.13
0.00
-0.20
-0.30
-0.43
-0.43
-0.40
-0.30
-0.20
-0.13
-0.10
-0.17
-0.37
-0.50
-0.60
-0.70
-0.70
-0.67
-0.70
-0.90
-1.13
-1.20
-1.13
-1.17
-1.43
-1.70
-1.77
-1.67
Table A-22 Directional Response of 3 1/2" Windscreen
Model 831 Technical Reference Manual
Position of Instrument and OperatorA-31
Frequency Response
Plane Parallel to Display Screen
LD Model: 831, Serial #: 0099, Normalized to 251.19Hz @ 0° xy
Tested 02/03/06 15:13:24 by Alex T.
Note: 377B02/100916 PRM831/0118
Reference Mic: B&K Model: 4189, Serial Number: 2440346, Tested: 02/03/06 10:50:56
2.0
dB
0.0
dB
-2.0
dB
-4.0
dB
-6.0
dB
-8.0
dB
-10.0
dB
-12.0
dB
-14.0
dB
200 Hz
Mic 0°
1K Hz
Mic 60°
20K Hz
Mic 120°
FIGURE A-12 Model 831 with 377B02 Microphone: 060 and 120 degrees
A-32
Frequency Response
Model 831 Technical Reference Manual
LD Model: 831, Serial #: 0099, Normalized to 251.19Hz @ 0° xy
Tested 02/03/06 15:13:24 by Alex T.
Note: 377B02/100916 PRM831/0118
Reference Mic: B&K Model: 4189, Serial Number: 2440346, Tested: 02/03/06 10:50:56
2.0
dB
0.0
dB
-2.0
dB
-4.0
dB
-6.0
dB
-8.0
dB
-10.0
dB
-12.0
dB
-14.0
dB
200 Hz
Mic 15°
1K Hz
Mic 75°
20K Hz
Mic 135°
FIGURE A-13 Model 831 with 377B02 Microphone: 1575and 135degrees
Model 831 Technical Reference Manual
Frequency Response
A-33
LD Model: 831, Serial #: 0099, Normalized to 251.19Hz @ 0° xy
Tested 02/03/06 15:13:24 by Alex T.
Note: 377B02/100916 PRM831/0118
Reference Mic: B&K Model: 4189, Serial Number: 2440346, Tested: 02/03/06 10:50:56
2.0
dB
0.0
dB
-2.0
dB
-4.0
dB
-6.0
dB
-8.0
dB
-10.0
dB
-12.0
dB
-14.0
dB
200 Hz
Mic 30°
1K Hz
Mic 90°
20K Hz
Mic 150°
FIGURE A-14 Model 831 with 377B02 Microphone: 3090and 150degrees
A-34
Frequency Response
Model 831 Technical Reference Manual
LD Model: 831, Serial #: 0099, Normalized to 251.19Hz @ 0° xy
Tested 02/03/06 15:13:24 by Alex T.
Note: 377B02/100916 PRM831/0118
Reference Mic: B&K Model: 4189, Serial Number: 2440346, Tested: 02/03/06 10:50:56
2.0
dB
0.0
dB
-2.0
dB
-4.0
dB
-6.0
dB
-8.0
dB
-10.0
dB
-12.0
dB
-14.0
dB
200 Hz
Mic 45°
1K Hz
Mic 105°
20K Hz
Mic 165°
FIGURE A-15 Model 831 with 377B02 Microphone: 45105and 165degrees
Model 831 Technical Reference Manual
Frequency Response
A-35
Directional Characteristics
LD Model: 831, Serial #: 0099, Normalized to 251.19Hz @ 0° xy
Tested 02/03/06 15:13:24 by LD
Note: 377B02/100916 PRM831/0118
Reference Mic: B&K Model: 4189, Serial Number: 2440346, Tested: 02/03/06 10:50:56
0°
2.0 dB
-2.0 dB
-6.0 dB
-10.0 dB
-14.0 dB
-18.0 dB
-22.0 dB
90°
Mic 251.19 Hz
FIGURE A-16 Model 831 with 377B02: 251.19 Hz
A-36
Frequency Response
Model 831 Technical Reference Manual
LD Model: 831, Serial #: 0099, Normalized to 251.19Hz @ 0° xy
Tested 02/03/06 15:13:24 by Alex T.
Note: 377B02/100916 PRM831/0118
Reference Mic: B&K Model: 4189, Serial Number: 2440346, Tested: 02/03/06 10:50:56
0°
2.0 dB
-2.0 dB
-6.0 dB
-10.0 dB
-14.0 dB
-18.0 dB
-22.0 dB
Mic 1000.00 Hz
90°
Mic 1995.26 Hz
Mic 3981.07 Hz
Mic 7943.28 Hz
FIGURE A-17 Model 831 with 377B02: 1000.00 Hz, 1995.26 Hz, 3981.07 and
7943.28 Hz
Model 831 Technical Reference Manual
Frequency Response
A-37
LD Model: 831, Serial #: 0099, Normalized to 251.19Hz @ 0° xy
Tested 02/03/06 15:13:24 by Alex T.
Note: 377B02/100916 PRM831/0118
Reference Mic: B&K Model: 4189, Serial Number: 2440346, Tested: 02/03/06 10:50:56
0°
2.0 dB
-2.0 dB
-6.0 dB
-10.0 dB
-14.0 dB
-18.0 dB
-22.0 dB
Mic 1258.93 Hz
90°
Mic 2511.89 Hz
Mic 5011.87 Hz
Mic 10000.00 Hz
FIGURE A-18 Model 831 with 377B02 Microphone: 1258.93 Hz 2511.89 Hz,
5011.87 Hz and 10000.00 Hz
A-38
Frequency Response
Model 831 Technical Reference Manual
LD Model: 831, Serial #: 0099, Normalized to 251.19Hz @ 0° xy
Tested 02/03/06 15:13:24 by Alex T.
Note: 377B02/100916 PRM831/0118
Reference Mic: B&K Model: 4189, Serial Number: 2440346, Tested: 02/03/06 10:50:56
0°
2.0 dB
-2.0 dB
-6.0 dB
-10.0 dB
-14.0 dB
-18.0 dB
-22.0 dB
Mic 1584.89 Hz
90°
Mic 3162.28 Hz
Mic 6309.57 Hz
Mic 12589.25 Hz
FIGURE A-19 Model 831 with 377B02 Microphone: 1584.89 Hz 3162.28 Hz,
6309.57 Hz and 12589.25 Hz
Model 831 Technical Reference Manual
Frequency Response
A-39
Perpendicular to Plane of Display Screen
LD Model: 831, Serial #: 0099, Normalized to 251.19Hz @ 0° xy
Tested 02/03/06 15:13:24 by Alex T.
Note: 377B02/100916 PRM831/0118
Reference Mic: B&K Model: 4189, Serial Number: 2440346, Tested: 02/03/06 10:50:56
2.0
dB
0.0
dB
-2.0
dB
-4.0
dB
-6.0
dB
-8.0
dB
-10.0
dB
-12.0
dB
-14.0
dB
200 Hz
Mic 15° (2)
1K Hz
Mic 75° (2)
20K Hz
Mic 135° (2)
FIGURE A-20 Model 831 with 377B02 Microphone: 1575,and 135 degrees
A-40
Frequency Response
Model 831 Technical Reference Manual
LD Model: 831, Serial #: 0099, Normalized to 251.19Hz @ 0° xy
Tested 02/03/06 15:13:24 by Alex T.
Note: 377B02/100916 PRM831/0118
Reference Mic: B&K Model: 4189, Serial Number: 2440346, Tested: 02/03/06 10:50:56
2.0
dB
0.0
dB
-2.0
dB
-4.0
dB
-6.0
dB
-8.0
dB
-10.0
dB
-12.0
dB
-14.0
dB
200 Hz
Mic 30° (2)
1K Hz
Mic 90° (2)
20K Hz
Mic 150° (2)
FIGURE A-21 Model 831 with 377B02 Microphone: 3090,and 150 degrees
Model 831 Technical Reference Manual
Frequency Response
A-41
LD Model: 831, Serial #: 0099, Normalized to 251.19Hz @ 0° xy
Tested 02/03/06 15:13:24 by Alex T.
Note: 377B02/100916 PRM831/0118
Reference Mic: B&K Model: 4189, Serial Number: 2440346, Tested: 02/03/06 10:50:56
2.0
dB
0.0
dB
-2.0
dB
-4.0
dB
-6.0
dB
-8.0
dB
-10.0
dB
-12.0
dB
-14.0
dB
200 Hz
Mic 45° (2)
1K Hz
Mic 105° (2)
20K Hz
Mic 165° (2)
FIGURE A-22 Model 831 with 377B02 Microphone: 45105and 165 degrees
A-42
Frequency Response
Model 831 Technical Reference Manual
LD Model: 831, Serial #: 0099, Normalized to 251.19Hz @ 0° xy
Tested 02/03/06 15:13:24 by Alex T.
Note: 377B02/100916 PRM831/0118
Reference Mic: B&K Model: 4189, Serial Number: 2440346, Tested: 02/03/06 10:50:56
2.0
dB
0.0
dB
-2.0
dB
-4.0
dB
-6.0
dB
-8.0
dB
-10.0
dB
-12.0
dB
-14.0
dB
200 Hz
Mic 60° (2)
1K Hz
Mic 120° (2)
20K Hz
Mic 180°
FIGURE A-23 Model 831 with 377B02 Microphone: 60120,and 180 degrees
Model 831 Technical Reference Manual
Frequency Response
A-43
Directional Characteristics
LD Model: 831, Serial #: 0099, Normalized to 251.19Hz @ 0° xy
Tested 02/03/06 15:13:24 by Alex T.
Note: 377B02/100916 PRM831/0118
Reference Mic: B&K Model: 4189, Serial Number: 2440346, Tested: 02/03/06 10:50:56
0°
2.0 dB
-2.0 dB
-6.0 dB
-10.0 dB
-14.0 dB
-18.0 dB
-22.0 dB
Mic 1000.00 Hz (2)
90°
Mic 1995.26 Hz (2)
Mic 3981.07 Hz (2)
Mic 7943.28 Hz (2)
FIGURE A-24 Model 831 with 377B02 Microphone: 1000.00 Hz 1995.25 Hz,
3981.07 Hz and 7943.28 Hz
A-44
Frequency Response
Model 831 Technical Reference Manual
LD Model: 831, Serial #: 0099, Normalized to 251.19Hz @ 0° xy
Tested 02/03/06 15:13:24 by Alex T.
Note: 377B02/100916 PRM831/0118
Reference Mic: B&K Model: 4189, Serial Number: 2440346, Tested: 02/03/06 10:50:56
0°
2.0 dB
-2.0 dB
-6.0 dB
-10.0 dB
-14.0 dB
-18.0 dB
-22.0 dB
Mic 1258.93 Hz (2)
90°
Mic 2511.89 Hz (2)
Mic 5011.87 Hz (2)
Mic 10000.00 Hz (2)
FIGURE A-25 Model 831 with 377B02 Microphone: 1258.91 Hz 2511.89 Hz,
5011.87 Hz and 10000.00 Hz
Model 831 Technical Reference Manual
Frequency Response
A-45
LD Model: 831, Serial #: 0099, Normalized to 251.19Hz @ 0° xy
Tested 02/03/06 15:13:24 by Alex T.
Note: 377B02/100916 PRM831/0118
Reference Mic: B&K Model: 4189, Serial Number: 2440346, Tested: 02/03/06 10:50:56
0°
2.0 dB
-2.0 dB
-6.0 dB
-10.0 dB
-14.0 dB
-18.0 dB
-22.0 dB
Mic 1584.89 Hz (2)
90°
Mic 3162.28 Hz (2)
Mic 6309.57 Hz (2)
Mic 12589.25 Hz (2)
FIGURE A-26 Model 831 with 377B02 Microphone: 1584.89 Hz 3162.28 Hz,
6309.57 Hz and 12589.25 Hz
A-46
Frequency Response
Model 831 Technical Reference Manual
Random Incidence
LD Model: 831, Serial #: 0099, Normalized to 251.19Hz @ 0° xy
Tested 02/03/06 15:13:24 by Alex T.
Note: 377B02/100916 PRM831/0118
Reference Mic: B&K Model: 4189, Serial Number: 2440346, Tested: 02/03/06 10:50:56
2.0
dB
0.0
dB
-2.0
dB
-4.0
dB
-6.0
dB
-8.0
dB
-10.0
dB
-12.0
dB
-14.0
dB
200 Hz
1K Hz
20K Hz
Random
FIGURE A-27 Model 831 with 377B02 Microphone: Random Incidence
Model 831 Technical Reference Manual
Frequency Response
A-47
Noise Levels
The noise of the Model 831 includes contributions from the following components:
•
Instrument and preamplifier
•
Microphone
Noise Level as a Function of 1/3 Octave Frequency Bands
In the following sections, the noise levels for each component, and the total, are presented as a
function of 1/3 octave frequency bands.
.
Typical Noise of Model 831 with 377B02 Microphone, 0 dB Gain, Low Range
10
8
6
Noise (dB SPL)
4
2
Total Noise
0
-2
Electronic Noise
-4
-6
-10
Microphone
Noise
8.0
10.0
12.5
16.0
20.0
25.0
31.5
40.0
50.0
63.0
80.0
100
125
160
200
250
315
400
500
630
800
1000
1250
1600
2000
2500
3150
4000
5000
6300
8000
10000
12500
16000
20000
-8
Frequency (Hz)
FIGURE A-28 Noise of Model 831 with 377B02: 0 dB Gain, Low Range
A-48
Frequency Response
Model 831 Technical Reference Manual
Typical Noise of Model 831 with 377B02 Microphone, 0 dB Gain, Normal Range
40
35
30
Noise (dB SPL)
25
Total Noise
Electronic Noise
20
15
10
5
0
-10
Microphone
Noise
8.0
10.0
12.5
16.0
20.0
25.0
31.5
40.0
50.0
63.0
80.0
100
125
160
200
250
315
400
500
630
800
1000
1250
1600
2000
2500
3150
4000
5000
6300
8000
10000
12500
16000
20000
-5
Frequency (Hz)
FIGURE A-29 Noise of Model 831 with 377B02: 0 dB Gain, Normal Range
Model 831 Technical Reference Manual
Frequency Response
A-49
Typical Noise of Model 831 with 377B02 Microphone, 20 dB Gain, Low Range
Noise (dB SPL)
10
5
Total Noise
0
-5
-10
Electronic Noise
8.0
10.0
12.5
16.0
20.0
25.0
31.5
40.0
50.0
63.0
80.0
100
125
160
200
250
315
400
500
630
800
1000
1250
1600
2000
2500
3150
4000
5000
6300
8000
10000
12500
16000
20000
Microphone
Noise
Frequency (Hz)
FIGURE A-30 Noise of Model 831 with 377B02: 20 dB Gain, Low Range
A-50
Frequency Response
Model 831 Technical Reference Manual
Typical Noise of Model 831 with 377B02 Microphone, 20 dB Gain, Normal Range
25
20
Noise (dB SPL)
15
10
Total Noise
Electronic Noise
5
0
-10
Microphone
Noise
8.0
10.0
12.5
16.0
20.0
25.0
31.5
40.0
50.0
63.0
80.0
100
125
160
200
250
315
400
500
630
800
1000
1250
1600
2000
2500
3150
4000
5000
6300
8000
10000
12500
16000
20000
-5
Frequency (Hz)
FIGURE A-31 Noise of Model 831 with 377B02: 20 dB Gain, Normal Range
Model 831 Technical Reference Manual
Frequency Response
A-51
Noise Level as a Function of Octave Frequency Bands
In the following sections, the noise levels for each component, and the total, are presented as a
function of octave frequency bands.
Typical Noise of Model 831 with 377B02 Microphone, 0 dB Gain, Low Range
15
Noise (dB SPL)
10
Total Noise
5
Electronic Noise
0
16000
8000
4000
2000
1000
500
250
125
31.5
16.0
8.0
-10
63.0
Microphone
Noise
-5
Frequency (Hz)
FIGURE A-32 Noise of Model 831 with 377B02: 0 dB Gain, Low Range
A-52
Frequency Response
Model 831 Technical Reference Manual
Typical Noise of Model 831 with 377B02 Microphone, 0 dB Gain, Normal Range
50
Noise (dB SPL)
40
30
Total Noise
Electronic Noise
20
10
16000
8000
4000
2000
1000
500
250
125
31.5
16.0
8.0
-10
63.0
Microphone
Noise
0
Frequency (Hz)
FIGURE A-33 Noise of Model 831 with 377B02: 0 dB Gain, Normal Range
Model 831 Technical Reference Manual
Frequency Response
A-53
Typical Noise of Model 831 with 377B02 Microphone, 20 dB Gain, Low Range
15
Noise (dB SPL)
10
Total Noise
5
0
16000
8000
4000
2000
1000
500
250
125
63.0
31.5
16.0
8.0
-10
Electronic Noise
Microphone
Noise
-5
Frequency (Hz)
FIGURE A-34 Noise of Model 831 with 377B02: 20 dB Gain, Low Range
A-54
Frequency Response
Model 831 Technical Reference Manual
Typical Noise of Model 831 with 377B02 Microphone, 20 dB Gain, Normal Range
30
25
15
Total Noise
Electronic Noise
10
5
0
16000
8000
4000
2000
1000
500
250
31.5
16.0
-10
8.0
-5
125
Microphone
Noise
63.0
Noise (dB SPL)
20
Frequency (Hz)
FIGURE A-35 Noise of Model 831 with 377B02: 20 dB Gain, Normal Range
Model 831 Technical Reference Manual
Frequency Response
A-55
Broadband Noise Levels
The A, C and Z-weighted self-generated noise levels, including 377B02 microphone are presented in
Table A-23.
Self-Generated Electrical Noise2
0dB gain
Weighting
A
C
Z
typical (dB)
13
15
22
3
max (dB)
15
22
25
Typical (dB)
6
12
19
Self-Generated Total Noise1
0dB gain
Weighting
A
C
Z
1
2
3
typical (dB)
18
18
23
20dB gain
3
max (dB)
19
23
26
max3 (dB)
10
16
26
20dB gain
Typical (dB)
17
17
21
max3 (dB)
17
19
26
combination of the electronic noise and the thermal noise of the 377B02 microphone at 20 °C
measured in a sealed cavity and vibration isolated with an averaging time of 60 seconds.
electronic noise of the instrument with an ADP090 (12 pF) in place of the microphone
highest anticipated self-generated noise
Table A-23 831 Self-generated Noise
Microphone Preamplifier Specifications
Nominal
Preamplifier
Nominal
Microphone Microphone Preamplifier
Type
Type
Sensitivity
Gain
mV/Pa
dB
Nominal Sensitivity at 831 Input
mV/Pa
Sensitivity Limits
High
Low
dB re. 1V/Pa
dB re. 1V/Pa
dB re. 1V/Pa
PRM831
377B02
50
-0.1
49.4
-26.1
-23.1
-29.1
PRM831
377B20
50
-0.1
49.4
-26.1
-23.1
-29.1
PRM831¹
377B01
2
-2.1
1.57
-56.1
-52.1
-60.1
PRM831¹
377B10
1
-2.1
0.79
-62.1
-58.1
-66.1
377B02
50
-0.1
49.4
-26.1
-23.1
-29.1
377B02
50
19.9
494.3
-6.1
-3.1
-9.1
377B20
50
-0.1
49.4
-26.1
-23.1
-29.1
377B20
50
19.9
494.3
-6.1
-3.1
-9.1
426A12
0 dB Gain
426A12
20 dB Gain
426A12
0 dB Gain
426A12
20 dB Gain
1
with ADP043
FIGURE A-36 Model 831 with Various Microphones and Preamplifiers
A-56
Frequency Response
Model 831 Technical Reference Manual
Model PRM831
The Larson Davis PRM831 is an electret microphone preamplifier for use with a Larson Davis Model
831 Sound Level Meter. It requires very little supply current and will drive 300 feet of cable. The
preamplifier operates over wide temperature and humidity ranges. It has very little attenuation for use
with 50 mV/Pa sensitivity microphones up to 140 dBSPL.
Specifications
Frequency response
with respect to the response at 1 kHz with 1 Volts rms input and 12 pF equivalent microphone.
8 Hz to 16 Hz +0.1, -0.2 dB
16 Hz to 100 kHz +0.1, -0.1 dB
Lower -3 dB limit < 1.5 Hz
Attenuation
0.1 dB (typical)
Input Impedance
10 G Ohm // 0.16 pF
Output Impedance
50 Ohm
Maximum Output
28 Vpp
143 dB peak for microphones with 50 mV/Pa sensitivity
Maximum Output Current
12 mA peak
Distortion
Harmonics <-70 dBC with 8 Volt rms output at 1 kHz
Model 831 Technical Reference Manual
Frequency Response
A-57
Output Slew Rate
2 V/µS (typical)
Electronic Noise
with 12 pF equivalent microphone
1.8 µV typical A-weighted (2.4 µV max)
4.3 µV typical Flat 20 Hz to 20 kHz (5.0 µV max)
Power Supply Voltage
15 to 36 Volts
DC Output Level
~1/2 power supply voltage
Power Supply Current
1.9 mA typical
Temperature Sensitivity
<±0.05 dB from -40° to +80 °C (14° to +176 °F)
Humidity Sensitivity
<±0.05 dB from 0 to 90% RH, non-condensing at 50 °C (122 °F)
Dimensions
12.7 mm diameter x 73 mm length (0.50" diameter x 2.88" length)
Microphone Thread
11.7 mm - 60 UNS (0.4606 - 60 UNS)
Cable Driving Capability
Model 831 SLM (10 V rms output signal)
To 20 kHz with 300' (91 m) cable
A-58
Frequency Response
Model 831 Technical Reference Manual
Test Conditions
All values are at 23 °C, 50% RH, 35 Volt supply, 3 m (10') cable and equivalent microphone of 12 pF
unless otherwise stated.
Model 831 Technical Reference Manual
Frequency Response
A-59
Output Connector
Switchcraft TA5M
5-Pin male
Pin
Signal
1
Signal Ground
2
Signal Output
3
Power Supply + 35 Volts
4
Preamp sense
5
No Connection
Shell
Connect to preamp housing
Table A-24 Output Connector
Compatibility
Use with ½" electret microphone having about 50 mV/Pa sensitivity and meeting the mechanical
requirements of IEC 61094-4 or ¼" electret microphone using the Larson Davis ADP043 adapter.
In the interest of constant product improvement, specifications are subject to change without notice.
Larson Davis provides a complete line of acoustic measurement tools including dosimeters, sound
level meters, real time analyzers, preamps, calibrators and microphones.
A-60
Frequency Response
Model 831 Technical Reference Manual
Preamplifier Model: PRM831 Serial Number: 10123
Certificate of Electrical Conformance
Frequency response of this model PRM831 preamplifier was tested at a level of 1 Vrms with 12pF microphone
capacitance and driving a short cable. Output level at 1kHz is 0.9878 Vrms (-0.107 dBV), uncertainty 0.033 dB.
Results are displayed relative to the level at 1kHz.
0.5
Level
(dB)
0.0
-0.5
-1.0
-1.5
-2.0
2.5
5
10
20
50
Freq (Hz) Measured (dB) Uncert (dB)
--------- ------------- ----------2.51
-1.05
0.075
3.16
-0.70
0.058
3.98
-0.46
0.058
5.01
-0.30
0.036
6.31
-0.20
0.036
7.94
-0.13
0.036
10.00
-0.09
0.016
12.59
-0.06
0.016
15.85
-0.04
0.016
19.95
-0.03
0.016
25.12
-0.03
0.016
31.62
-0.02
0.016
39.81
-0.02
0.016
50.12
-0.02
0.016
63.10
-0.01
0.016
79.43
-0.01
0.016
100.00
-0.01
0.016
125.89
-0.01
0.016
158.49
-0.01
0.016
199.53
-0.01
0.016
251.19
-0.01
0.016
316.23
-0.01
0.016
398.11
-0.00
0.016
501.19
-0.00
0.016
100
200
501
1000
Frequency (Hz)
Tolerance (dB)
--------------0.82, -1.26
-0.54, -0.86
-0.34, -0.58
-0.21, -0.39
-0.12, -0.26
-0.07, -0.19
-0.03, -0.15
-0.01, -0.11
+0.01, -0.09
+0.02, -0.08
+0.02, -0.08
+0.03, -0.07
+0.03, -0.07
+0.04, -0.06
+0.04, -0.06
+0.04, -0.06
+0.04, -0.06
+0.04, -0.06
+0.05, -0.05
+0.05, -0.05
+0.05, -0.05
+0.05, -0.05
+0.05, -0.05
+0.05, -0.05
1995
5012
10000
19953
Freq (Hz) Measured (dB) Uncert (dB)
--------- ------------- ----------630.96
-0.00
0.016
794.33
-0.00
0.016
1000.00
0.00
0.016
1258.90
0.00
0.016
1584.90
0.00
0.016
1995.30
0.00
0.016
2511.90
0.00
0.016
3162.30
0.00
0.016
3981.10
0.01
0.016
5011.90
0.00
0.016
6309.60
0.00
0.016
7943.30
0.00
0.016
10000.00
0.01
0.016
12589.00
0.01
0.016
15849.00
0.01
0.016
19953.00
0.01
0.016
25250.00
0.01
0.022
31500.00
0.01
0.022
39750.00
0.01
0.022
50000.00
0.01
0.022
63000.00
0.00
0.047
79500.00
0.00
0.047
100000.00
0.00
0.047
126000.00
0.00
0.063
50000 100000
Tolerance (dB)
-------------+0.05, -0.05
+0.05, -0.05
+0.05, -0.05
+0.05, -0.05
+0.05, -0.05
+0.05, -0.05
+0.05, -0.05
+0.05, -0.05
+0.05, -0.05
+0.05, -0.05
+0.05, -0.05
+0.05, -0.05
+0.05, -0.05
+0.05, -0.05
+0.05, -0.05
+0.05, -0.05
+0.05, -0.05
+0.05, -0.05
+0.05, -0.05
+0.06, -0.06
+0.07, -0.07
+0.08, -0.08
+0.09, -0.09
+0.10, -0.10
Noise floor data: 1kHz (1/3 Octave) = 0.42 uV, -7.6 dBuV, uncertainty = 0.47 dB
Flat (20Hz-20kHz) = 4.3 uV, 12.6 dBuV, uncertainty = 0.47 dB
Awt = 1.8 uV, 4.9 dBuV, uncertainty = 0.46 dB
Uncertainties are given as expanded uncertainty at ~95% confidence interval (k = 2).
Technician: Leroy Harbaugh
Test Date: 10OCT2007
FIGURE A-37 Certificate of Conformance; PRM831
Model 831 Technical Reference Manual
Frequency Response
A-61
Vibration Sensitivity
Vibration Parallel to Microphone Diaphragm
Frequency
Laeq
Ref
31.5
35.7
35.4
63
35.5
34.8
125
35.8
36.8
250
47.7
47.9
500
52.6
51.4
630
60.5
50.4
800
61.0
54.4
1,000
62.2
60.0
Table A-25 Axis of Vibration Parallel to the Microphone Diaphragm
Vibration Perpendicular to Microphone Diaphragm
Frequency
Laeq
Ref
31.5
35.9
35.6
63
38.6
34.5
125
46.0
35.5
250
54.1
39.4
500
67.1
44.2
630
82.6
70.0
800
69.7
45.7
1,000
69.2
51.7
Table A-26 Axis of Vibration Perpendicular to the Microphone Diaphragm
A-62
Vibration Sensitivity
Model 831 Technical Reference Manual
APPENDIX
B
Measuring to IEC61672-1
This appendix presents information for measuring the sound level meter functionality of the Model
831 according to IEC61672-1.
Sections 5, 6, 7 and 9 (except 9.3)
The following table references sections and tables in this manual where information called for in
specific sections of IEC61672-1 can be found. In certain instances the requested information is not
applicable, as noted in the Comments column.
Further information called for in section 9.3 for testing, as appropriate for a sound level meter, can be
found in "Section 9.3" on page B-9.
Section
Model 831 Manual
5.1.4
"Model 831 Components" on page 1-16
5.1.6
"Microphone" on page 1-9 and Chapter 7
"Making a Measurement” on page 7-1.
5.1.7
"Connecting the Microphone and
Preamplifier" on page 2-2 and "Connecting
the Preamplifier" on page 2-3
5.1.8
5.1.10
Comments
Computer software is not an
integral part of the Model 831
"Frequency Weightings" on page A-10.
5.1.12
The Model 831 measures sound
level using a single range
5.1.13
"Section 9.3" on page B-9
5.1.14
"RESET Key" on page 3-9 and "Overall
SLM" on page 5-15
5.1.15
"AC/DC Output" on page A-14 and "g)
Electrical Insert Signals" on page B-11
5.1.16
"i) Highest Sound Pressure Level" on page
B-11
Model 831 Technical Reference Manual
Measuring to IEC61672-1
B-1
Section
Model 831 Manual
5.1.17
The Model 831 is a single
channel instrument
5.1.18
"Start-up Period" on page 7-2
5.2.1
"Calibrator" on page 21-5
5.2.3
"Acoustic Calibration" on page 21-5
5.2.4
"9.2.4 d Frequency Responses and
Corrections" on page B-8
5.2.5
"9.2.4 d Frequency Responses and
Corrections" on page B-8
5.2.7
"d) Periodic Testing" on page B-9
5.2.8
"d) Periodic Testing" on page B-9
5.4.12
B-2
Comments
No optional frequency responses
5.5.9
"f) Linear Measurement Starting Level" on
page B-10
5.5.10
"f) Linear Measurement Starting Level" on
page B-10
5.5.11
"k ) Display Device" on page B-11
5.6.1
"Noise Levels" on page A-48
5.6.2
"Noise Levels" on page A-48
5.6.3
"Noise Levels" on page A-48
5.6.4
"Noise Levels" on page A-48
5.6.5
"Low Level Sound Fields" on page 7-16
5.7.1
"Sound Level Meter Specifications" on
page A-3
5.10.1
"Overload Indication" on page 7-8
5.11.1
"Under Range Icon" on page 3-4
Sections 5, 6, 7 and 9 (except 9.3) Model 831 Technical Reference Manual
Section
Model 831 Manual
5.11.2
Model 831 measures sound level
using a single range. The lower
limit for level linearity error is
caused by the inherent noise
from the microphone and
electronic elements within the
sound level meter.
5.12.1
"Performance Specifications" on page A-4
5.14
"Threshold and Criterion" on page 8-4
5.15.2
Chapter 5 "Basic Data Display” on page 5-1
5.15.3
Chapter 5 "Basic Data Display” on page 5-1
5.15.4
Chapter 5 "Basic Data Display” on page 5-1
5.15.5
"General Specifications" on page A-8
5.15.6
"Integration Method" on page 4-5
5.15.7
"Software CD" on page 1-9
5.15.8
Model 831 uses no alternative
display devices
5.16.1
"AC/DC Output" on page A-14 and "Jack
Function" on page 17-13
5.17.1
"Control Page" on page 4-9 and "Time" on
page 17-3
5.17.1 NOTE 2
"Time of Day Drift" on page A-16
5.17.2
"Min/Max Integration Time" on page A-15
5.18.1
"Microphone Extension Cable" on page 7-4
5.18.2
Comments
"n) Radio Frequency Emission" on
page B-12
5.19.2
The Model 831 is a single
channel instrument
5.20.2
"j) Battery Power Voltage Range" on page
B-11
5.20.3
"Power Supply" on page A-17
5.20.4
"External Power Supply" on page 24-12
Model 831 Technical Reference Manual
Sections 5, 6, 7 and 9 (except 9.3)
B-3
Section
Model 831 Manual
5.20.5
"Power Supply" on page A-17
6.1.2
Comments
"l) Typical Stabilization Time" on
page B-12
6.2.2
"Calibration Overview" on page 21-1
6.2.2 Note
"Model 831 with 1/2” Free-Field
Microphone" on page 21-6
6.5.2
"General Specifications" on page A-8
6.6.1
"o) AC Power and Radio Frequency
Susceptibility" on page B-12
6.6.3
No detectable increase in any
direction with application of 74
dB A-weighted sound level.
6.6.9
"o) AC Power and Radio Frequency
Susceptibility" on page B-12
7.1
"Microphone Extension Cable" on page 7-4
7.2
"Effect of Windscreen" on page A-30
7.4
"Octave Band Analyzer Page (Optional)" on
page 4-6
9.2.1 General
a
"Standards Met by Model 831" on page A-1
b
"Configuration of the System" on page 7-1 ,
"Microphone Extension Cable" on page 7-4
and "Use of a Windscreen" on page 7-5.
c
"Standard Accessories" on page 1-9
d
No microphone extension or
microphone extension cable is
required to meet specified
standards
e
The Model 831 is a single
channel instrument
9.2.2 Design Features
a
B-4
Chapter "Parameters Measured" on page
25-1
Sections 5, 6, 7 and 9 (except 9.3) Model 831 Technical Reference Manual
Section
Model 831 Manual
b
"Frequency Response" on page A-32
c
"Frequency Weightings" on page A-10
d
"Sound Level Meter Specifications" on
page A-3
e
"Performance Specifications" on page A-4
f
"20 dB Gain" on page 4-5
g
"General Specifications" on page A-8
h
"Performance Specifications" on page A-4
i
"Performance Specifications" on page A-4
Comments
j
Computer software is not an
integral part of the Model 831
k
Additional metrics measured,
not specified by the IEC 61672
standard, perform to their
respective standards published
elsewhere, for example Takt
Maximal and SEA
9.2.3 Power Supply
a
"Power Supply" on page A-17
b
"Power Indicator" on page 3-2 and "j)
Battery Power Voltage Range" on page B11
c
"Power Supply" on page A-17
d
"Power Supply" on page A-17
9.2.4 Adjustments to Indicated Levels
a
"Recommended Calibrator" on page 21-5
b
"Recommended Calibrator" on page 21-5
c
"Acoustic Calibration" on page 21-5
d
See "9.2.4 d Frequency Responses and
Corrections" on page B-8
9.2.5 Operating the Sound Level Meter
Model 831 Technical Reference Manual
Sections 5, 6, 7 and 9 (except 9.3)
B-5
Section
Model 831 Manual
a
"General Specifications" on page A-8
b
"Positioning the Model 831" on page 7-4
c
Comments
The 831 measures sound level
using a single range
d
"Low Level Sound Fields" on page 7-16
e
"Start-up Period" on page 7-2
f
"Integration Method" on page 4-5
g
"Control Page" on page 4-9 and "Time" on
page 17-3
h
"Manual Stop, Timed Stop or Stop When
Stable" on page 6-4
i
"RESET Key" on page 3-9 and "Overall
SLM" on page 5-15
j
"Overload Indication" on page 7-8 and
"Overall SLM" on page 5-15 and "Run
Pending Icon" on page 3-5
k
"Measurement Range" on page 7-8
l
"Threshold and Criterion" on page 8-4
m
"Software CD" on page 1-9 and
"Connectors and Interfaces" on page 24-8
n
"Connectors and Interfaces" on page 24-8
o
"h) Self-generated Noise" on page B-11
p
"AC/DC Output" on page A-14 and "Jack
Function" on page 17-13
9.2.6 Accessories
a
"Effect of Windscreen" on page A-30
b
"Microphone Extension Cable" on page 7-4
c
"Octave Band Analyzer Page (Optional)" on
page 4-6
d
B-6
No manufacturer-provided
auxiliary devices are provided
Sections 5, 6, 7 and 9 (except 9.3) Model 831 Technical Reference Manual
Section
Model 831 Manual
Comments
9.2.7 Influence of variations in environmental conditions
a
No components of the Model
831 are intended to be operated
only in an environmentally
controlled enclosure
b
"General Specifications" on page A-8
c
"CE Information" on page A-19
Model 831 Technical Reference Manual
Sections 5, 6, 7 and 9 (except 9.3)
B-7
9.2.4 d Frequency Responses and Corrections
Larson Davis 831 with PRM831 and 377B02 Microphone
average frequency responses and corrections
Required by IEC 61672-1 Sections 5.2.4, 5.2.5, 5.2.6 and 9.2.4 (d)
Nominal
Frequency
Hz
250
315
400
500
630
800
1000
1060
1120
1180
1250
1320
1400
1500
1600
1700
1800
1900
2000
2120
2240
2360
2500
2650
2800
3000
3150
3350
3550
3750
4000
4250
4500
4750
5000
5300
5600
6000
6300
6700
7100
7500
8000
8500
9000
9500
10000
10600
Exact
Frequency
Hz
251.19
316.23
398.11
501.19
630.96
794.33
1000.00
1059.25
1122.02
1188.50
1258.93
1333.52
1412.54
1496.24
1584.89
1678.80
1778.28
1883.65
1995.26
2113.49
2238.72
2371.37
2511.89
2660.73
2818.38
2985.38
3162.28
3349.65
3548.13
3758.37
3981.07
4216.97
4466.84
4731.51
5011.87
5308.84
5623.41
5956.62
6309.57
6683.44
7079.46
7498.94
7943.28
8413.95
8912.51
9440.61
10000.00
10592 54
0° Free Field
0° Free Field
Effect of
Wind Screen
on 831
Response
dB
0.0
0.0
0.0
0.1
0.0
0.0
-0.2
0.0
-0.1
-0.3
-0.3
-0.3
-0.2
-0.3
-0.1
0.0
0.0
0.0
0.3
0.4
0.3
0.1
0.1
0.1
0.0
-0.3
-0.2
-0.2
-0.3
0.1
0.1
-0.2
0.2
-0.1
-0.3
0.2
-0.1
-0.4
0.3
0.1
0.2
0.0
0.0
0.3
0.5
0.4
0.5
04
Corrections¹
dB
0.0
0.0
0.0
-0.1
0.0
0.0
0.2
0.0
0.1
0.3
0.3
0.3
0.2
0.3
0.1
0.0
0.0
0.0
-0.3
-0.4
-0.3
-0.1
-0.1
-0.1
0.0
0.3
0.2
0.2
0.3
-0.1
-0.1
0.2
-0.2
0.1
0.3
-0.2
0.1
0.4
-0.3
-0.1
-0.2
0.0
0.0
-0.3
-0.5
-0.4
-0.5
04
Wind Screen
dB
0.0
0.0
0.1
0.0
0.1
0.1
0.2
0.2
0.1
0.2
0.3
0.3
0.2
0.2
0.3
0.3
0.3
0.3
0.4
0.4
0.5
0.5
0.5
0.5
0.5
0.4
0.4
0.3
0.2
0.1
0.0
0.0
-0.1
-0.3
-0.2
-0.2
-0.1
0.3
0.0
0.2
-0.1
-0.2
-0.4
-0.4
-0.4
-0.4
-0.3
03
0° Free Field
dB
0.0
0.0
0.1
0.1
0.1
0.1
0.0
0.1
-0.1
-0.1
-0.1
-0.1
-0.1
-0.1
0.2
0.3
0.3
0.3
0.6
0.8
0.8
0.6
0.6
0.6
0.6
0.1
0.3
0.1
-0.1
0.1
0.1
-0.2
0.1
-0.3
-0.5
0.0
-0.1
-0.1
0.4
0.3
0.2
-0.1
-0.3
-0.1
0.2
0.0
0.2
02
0° Free Field
Corrections with
Wind Screen
expanded
uncertainty
of Corrections
on 831¹
dB
0.0
0.0
-0.1
-0.1
-0.1
-0.1
0.0
-0.1
0.1
0.1
0.1
0.1
0.1
0.1
-0.2
-0.3
-0.3
-0.3
-0.6
-0.8
-0.8
-0.6
-0.6
-0.6
-0.6
-0.1
-0.3
-0.1
0.1
-0.1
-0.1
0.2
-0.1
0.3
0.5
0.0
0.1
0.1
-0.4
-0.3
-0.2
0.1
0.3
0.1
-0.2
0.0
-0.2
02
@ 95%
dB
0.4
0.4
0.4
0.4
0.4
0.4
0.4
0.4
0.4
0.4
0.4
0.4
0.5
0.5
0.6
0.6
0.6
0.6
0.6
0.6
0.6
0.6
0.6
0.6
0.6
0.6
0.6
0.6
0.6
0.6
0.6
0.6
0.6
0.6
0.6
0.6
0.6
0.6
0.6
0.6
0.6
0.6
0.6
0.6
0.6
0.6
0.6
07
Continued on next page
B-8
Sections 5, 6, 7 and 9 (except 9.3) Model 831 Technical Reference Manual
Larson Davis 831 with PRM831 and 377B02 Microphone
average frequency responses and corrections
Required by IEC 61672-1 Sections 5.2.4, 5.2.5, 5.2.6 and 9.2.4 (d)
Nominal
Frequency
Hz
10000
10600
11200
11800
12500
13200
14000
15000
16000
17000
18000
19000
20000
Exact
Frequency
Hz
10000.00
10592.54
11220.18
11885.02
12589.25
13335.21
14125.38
14962.36
15848.93
16788.04
17782.79
18836.49
19952.62
0° Free Field
0° Free Field
Effect of
Wind Screen
on 831
Response
dB
0.5
0.4
0.6
0.5
0.5
0.6
0.4
0.8
1.1
0.9
0.7
0.3
-0.3
Corrections¹
dB
-0.5
-0.4
-0.6
-0.5
-0.5
-0.6
-0.4
-0.8
-1.1
-0.9
-0.7
-0.3
0.3
Wind Screen
dB
-0.3
-0.3
-0.6
-0.7
-0.6
-0.6
-0.5
-0.8
-0.9
-0.9
-0.9
-0.9
-1.1
0° Free Field
dB
0.2
0.2
0.0
-0.2
0.0
0.0
-0.1
0.0
0.2
-0.1
-0.2
-0.6
-1.5
0° Free Field
Corrections with
Wind Screen
expanded
uncertainty
of Corrections
on 831¹
dB
-0.2
-0.2
0.0
0.2
0.0
0.0
0.1
0.0
-0.2
0.1
0.2
0.6
1.5
@ 95%
dB
0.6
0.7
0.8
0.9
1.0
1.0
1.0
1.0
1.0
1.0
1.0
1.0
1.0
¹add numbers in this column to levels read on the 831 to correct the level at a specific frequency
Section 9.3
a) Reference Sound Pressure Level
The reference sound pressure level is 114 dB re 20 µPa.
b) Reference Level Range
The reference level range is normal.
c) Microphone Reference Point
The microphone reference point is the center of the diaphragm of the 377B02 microphone.
d) Periodic Testing
Table 2 lists values of Larson Davis 831 with PRM831 and 377B02 Microphone adjustment data of Aweighted levels used for periodic measurements.
Model 831 Technical Reference Manual
Sections 5, 6, 7 and 9 (except 9.3)
B-9
.
e) Linear Operating Range
A-weighted sound levels for the 831 at the upper and lower limits of the linear operating ranges.
Gain
31.5 Hz
1 kHz
4 kHz
8 kHz
12.5 kHz
0 dB
24 dB to 101 dB
24 dB to 140 dB
24 dB to 141 dB
26 dB to 139 dB
26 dB to 136 dB
20 dB
19 dB to 81 dB
19 dB to 120 dB
19 dB to 121 dB
19 dB to 119 dB
19 dB to 116 dB
f) Linear Measurement Starting Level
The starting point for measuring level linear errors on the reference range is 114 dB.
B-10
Sections 5, 6, 7 and 9 (except 9.3) Model 831 Technical Reference Manual
g) Electrical Insert Signals
The electrical design of the input device to insert electrical signals into the preamplifier is a series
12pF ± 5% capacitor. The Larson Davis ADP090 is used for this purpose. The ADP090 can be used
for noise floor measurements by attaching the included short on the front of the ADP090.
h) Self-generated Noise
Self-generated noise of the Model 831 is shown in Table B-11.
Self-Generated Electrical Noise2
0dB gain
Weighting
A
C
Z
typical (dB)
13
15
22
max3 (dB)
15
22
25
Self-Generated Total Noise1
0dB gain
Weighting
A
C
Z
typical (dB)
18
18
23
max3 (dB)
19
23
26
20dB gain
Typical (dB)
6
12
19
max3 (dB)
10
16
26
20dB gain
Typical (dB)
17
17
21
max3 (dB)
17
19
26
1
combination of the electronic noise and the thermal noise of the 377B02 microphone at 20 °C
measured in a sealed cavity and vibration isolated with an averaging time of 60 seconds.
2
electronic noise of the instrument with an ADP090 (12 pF) in place of the microphone
3
highest anticipated self-generated noise
Table B-1: Self-generated Noise Levels
i) Highest Sound Pressure Level
The highest sound pressure level the Larson Davis 831 is designed to accommodate at the level of
overload is 140 dB. The peak-to-peak voltage at this level is 28 Vpp input through the ADP090.
j) Battery Power Voltage Range
The battery power supply voltage range for which the 831 conform to this standard:
6.4 Volts maximum
The 831 will shut down if the battery is below 4.0 Volts when used with alkaline batteries. Therefore
from 4.0 to 6.4 Volts is the usable range of battery voltage. The instrument will shut off to ensure that
no data is taken that would not meet the requirements of IEC 61672.
k ) Display Device
The display device will display all levels over the entire linear operating range.
Model 831 Technical Reference Manual
Sections 5, 6, 7 and 9 (except 9.3)
B-11
l) Typical Stabilization Time
The typical time interval needed to stabilize after changes in environmental conditions.
For a temperature change of 5 °C then 30 minutes are required.
For a static pressure change of 5 kPa then 15 seconds are required.
For a humidity change of 30 % (non-condensing) then 30 minutes are required.
m) Field Strength > 10 V/m
The Larson Davis model 831 was not measured for field strengths greater than 10 V/m.
n) Radio Frequency Emission
The mode of operation of the 831 that produces the greatest radio frequency emission levels was with
the 831 set to run and with an EXC010 (10' microphone extension cable) used to connect the PRM831
to the 831.
o) AC Power and Radio Frequency Susceptibility
The mode of operation of the 831 that produced the greatest measurement susceptibility to A.C. power
frequency and radio frequency fields was with the 831 set to run, USB cable attached and with an
EXC010 (10' microphone extension cable) between the PRM831 and the 831.
B-12
Sections 5, 6, 7 and 9 (except 9.3) Model 831 Technical Reference Manual
APPENDIX
C
Integrated Level Calculations
Basic Integrated Level Calculations
Equivalent Continuous Sound Level
The Larson Davis Model 831 calculates equivalent
continuous sound levels based on equations from IEC
standard 61672-1, Section 3.9 which defines Leq as follows:
Note that the 831 displays the equivalent continuous A-weighted sound
pressure level as LAeq.
Equivalent continuous A-weighted sound pressure level
(also average A-weighted sound pressure level) is defined as
follows:
LAT LAeqT 20 lg 1
T
t TP d
2
A
1/ 2
/ P dB
0
where:
LAeqT is the equivalent continuous A-weighted sound
pressure level re 20 µPa, determined over a time interval T
is a dummy variable of time integration over the averaging
time interval ending at the time of observation t
T is the averaging time interval
pA() is the A-weighted sound pressure
p0 is the reference sound pressure of 20 µPa
In the equation, the numerator of the argument of the
logarithm is the root-mean-square, frequency-weighted
sound pressure level over the averaging time interval T.
Model 831 Technical Reference Manual
Integrated Level Calculations
C-1
Note that the format used by the 831
to display equivalent continuous
sound pressure level is LXeq, where
X is the frequency weighting (X = A,
C or Z).
When a frequency weighting other than A is used, the
frequency weighting used shall be included explicitly in the
title and the formula of the quantity, for example equivalent
continuous C-weighted sound pressure level:
20
lg
CT
CeqT
L L
1T
P
d
t T
1/ 2
2
C
/ P0 dB
If no frequency weighting is used, the quantity is simply
called equivalent continuous sound pressure level.
Time-Weighted Averages
The Larson Davis 831 calculates many time-integrated
levels or time-weighted averages (TWA) based on different
parameters and time intervals. They are all designed and
programmed to perform the equation specified in IEC
61672-1 with allowances for the following:
A, C and Z frequency weighting characteristics
Various interval times, both fixed interval TWAs and
variable interval event TWAs
Exchange-rates, or “doubling rates” can be entered that
effect certain TWA measurements
Certain TWA measurements include a programmable
threshold with only levels above this threshold contributing
to the measurement
No attempt is made to meet the IEC 61672-1 requirement to
title the TWA by frequency weighting and time interval
within the analyzer’s display or report system. The
Frequency Weighting and Time Interval are both displayed
in the same view to meet this requirement.
The following figure indicates how the requirements are met
in the 831.
C-2
Basic Integrated Level Calculations Model 831 Technical Reference Manual
The numerical value for the TWA and ProjTWA
Time-weighted average (TWA) based on 8 hours
The Projected Time Weighted Average for 8 hours
The currently selected Frequency Weighting (A) and
Detector Response (Slow) for SPL
The currently selected Exchange Rate
Threshold Level
Elapsed measurement time shown as h:mm:ss.s
FIGURE C-1 TWA
Note that the 831 displays the time
weighted average as TWA[Hr]
where Hr is the time in hours over
which the average is performed.
The actual equations used within the 831 are based on those
for IEC 61672-1 and are implemented according to this
equation:
n
L TWA
Ls
------k
10 – log n
= L cal + k log
s = 1
where:
L(s) is the current SPL at sample s (for measurements that
include a threshold, L(s) is set to -× if L(s) is less than the
Threshold Level Lt)
k is the exchange rate constant which is equal to:
10.00 for an exchange rate of 3dB (Leq)
13.29 for an exchange rate of 4dB (LDOD)
16.61 for an exchange rate of 5dB (LOSHA)
20.00 for an exchange rate of 6dB (LAvg)
Model 831 Technical Reference Manual
Basic Integrated Level Calculations
C-3
n is the total number of samples taken in the measurement.
The sample rate is 32 samples per second.
Lcal is the calibration offset that corrects for various
sensitivities of microphones
SEL Calculations
Note that the 831 displays SEL as
LXE, where X is the frequency
weighting (X = A, C or Z).
SEL is available for the overall measurement and is
calculated using this formula:
n
L s
------k
SEL = L cal + k log
10 – log 32
s = 1
All of the SEL energy values in the analyzer utilize the
Threshold and Exchange Rate settings. Care should be taken
when modifying these settings since some standards or
governments require SEL to be taken without a Threshold
(set it to zero) and with an Exchange Rate of 3dB.
Sound Exposure Level
Sound Exposure in hours
Sound Exposure in seconds
FIGURE C-2 Sound Exposure Level and Sound Exposure
C-4
Basic Integrated Level Calculations Model 831 Technical Reference Manual
Dose and Projected Dose Calculations
Dose is a measure of Sound Exposure and is defined in
ANSI S1.25 Section 4.7 as:
T
–L
L
--------------c
q
100
D Q = --------- 10
Tc
dt
0
See FIGURE C-3 “DOSE and Projected DOSE"
where:
D(Q) is the percentage criterion exposure for exchange rate
Q
Tc is the criterion sound duration = 8 hours
T is the measurement duration in hours
t is the time in hours
L is the SLOW, (or FAST) A-weighted sound level, a
function of time, when the sound level is greater than or
equal to L, or equals -× when the A-weighted sound level is
less than Lt
Lt is the threshold sound level specified by the manufacturer
LC is the criterion sound level specified by the manufacturer
Q is the exchange rate in dB, and q = the parameter that
determines the exchange rate, where:
q = 10 for a 3dB exchange rate
q = 13.29 = 4/log(2) for a 4dB exchange rate
q = 16.61 = 5/log(2) for a 5dB exchange rate
q = 20 = 6/log(2) for a 6dB exchange rate
The factor of 100 in the equation produces a result that is a
percentage.
Dose is obtained from the accumulations made for TWA and
SEL using the formula:
where,
Model 831 Technical Reference Manual
Basic Integrated Level Calculations
C-5
L(s) is the current SPL at sample s; for measurements that
include a threshold L(s) is set to × if L(s) is less than the
Threshold Level Lt
n
L
s
----------
L
k
log
10 – -----c – log T c 115200 + log 100
k
s=1
DOSE = 10
%
k is the exchange rate constant. See the explanation for “q”
on the previous page.
n is the total number of samples taken in the measurement.
The sample rate is 32 samples per second.
Tc is the criterion sound duration as set by the 831’s
“Criterion Time Hours” setting which by default is set to 8
hours Lc is the criterion sound level as set by the 831’s
“Overall Criterion” or “Current Criterion” settings.
Addition of the term “log(100)” was used to implement the
100 multiplier of the ANSI equation that creates the
percentage. Subtracting the log of the Criterion Time was
used to implement the division of Criterion Time of the
ANSI equation.
Projected Dose in the analyzer is obtained with an equation
similar to that of Dose except that the actual duration (time)
of the measurement is used rather than a Criterion Time, as
thus:
n
PROJDOSE = 10
C-6
L
s
----------
L
k
log
10 – -----C- – log n + log 100
k
s=1
%
Basic Integrated Level Calculations Model 831 Technical Reference Manual
where the log(n) is the actual time factor, n being the total
number of samples taken.
DOSE
Projected DOSE
The currently selected Frequency Weighting (A)
and Detector Response (Slow) for SPL
The currently selected Exchange Rate
Criterion Time and Level
Elapsed measurement time shown as h:mm:ss.s
FIGURE C-3 DOSE and Projected DOSE
Sound Exposure Calculations
Sound exposure and sound exposure level are calculated as
specified in IEC 61672-1.
Note that the 831 displays Sound
Exposure as EX, where X is the
frequency weighting (X=A, C or Z).
Sound Exposure
See FIGURE C-2 “Sound Exposure
Level and Sound Exposure"
The A-weighted sound exposure EA of a specified event is
represented by
t2
EA p A2 (t )dt
t1
where PA2(t) is the square of the A-weighted instantaneous
sound pressure during an integration time starting at t1 and
ending at t2.
The unit of A-weighted sound exposure is pascal-squared
seconds if A-weighted sound pressure is in pascals and
running time is in seconds. However it is sometimes
Model 831 Technical Reference Manual
Basic Integrated Level Calculations
C-7
expressed in pascal-squared hours for measurements of
noise exposure in the workplace.
Note that the 831 displays Sound
Exposure Level as LXE, where X is
the frequency weighting (X=A, C or
Z).
t 2
LAE 10 lg p A2 t dt / p02T0
t1
Sound Exposure Level
The A-weighted sound exposure level LAE is related to a
corresponding measurement of time-average, A-weighted
sound level, LAT or LAEeqT, by
dB 10 lgE / E dB L
A
0
AT
10 lg T / T0 dB
where
EA is the A-weighted sound exposure in pascal-squared
seconds
E0 is the reference sound exposure of:
(20 Paxs = 400 x 10-12 Pa2s
T0 = 1 s
T = t2 - t1, the time interval for measurement, in seconds, for
sound exposure level and time-average sound level
C-8
Basic Integrated Level Calculations Model 831 Technical Reference Manual
Community Noise Descriptors
LDN
The day-night level LDN is defined by the following
formula:
LDN
1
10 log10
H D H N
Lnight LPN
Lday
H D 10 10 H N 10 10
Where:
•
HD is the number of hours programmed for "daytime",
•
HN is the number of hours programmed for "nighttime",
•
Lday is the equivalent level measured during the daytime
period,
•
Lnight is the equivalent level measured during the
nighttime period
•
LPN is the nighttime penalty level, generally 10dB.
In the default form, the day has sixteen hours (HD = 16) and
the night has eight hours (HN = 8). The defined time periods
for Day and Night times are programmed the same as LDEN.
Default time periods are shown below.
Generally LDN is only defined for full 24 hour periods. If the
measurement did not last for the entire 24 hours (or more),
the level measured for any partial portion of the day or night
period is assumed to represent the entire period. If there was
no measurement performed for either the day or night time
period then the number of hours used in the formula is set to
zero and the corresponding Lday or Lnight will be shown as
"- - -". The Session Log and Run Time are used to qualify
the measurement periods.
Model 831 Technical Reference Manual
Community Noise Descriptors
C-9
LDEN
The day-evening-night level LDEN is defined by the
following formula:
1
LDEN 10 log10
H D H E H N
Lnight LPN
Levening LPE
Lday
10
H D 10 10 H E 10
H N 10 10
Where:
•
HD is the number of hours programmed for the "day"
period,
•
HE is the number of hours programmed for "evening"
period,
•
HN is the number of hours programmed for "night"
period,
•
Lday is the equivalent level measured during the daytime
period,
•
Lnight is the equivalent level measured during the
nighttime period,
•
LPE is the evening penalty level, generally 5dB (4.7dB
for CNEL) and
•
LPN is the nighttime penalty level, generally 10 dB.
In the default form, the day has twelve hours (HD = 12),
evening has four hours (HE = 4) and the night has eight
hours (HN = 8). In the default form, the day has eight hours,
the evening has four hours and the night has eight hours, as
can be seen in the equation. The default times for these
periods are as follows:
•
Day: 0700 to 1900
•
Evening: 1900 to 2300
•
Night: 2300 to 0700
Lday, Levening and Lnight are A-weighted long-term
average sound levels measured during the day, evening and
night, respectively
Generally LDEN in only defined for full 24 hour periods. If
the measurement did not last for the entire 24 hours (or
more), the level measured for any partial portion of the day,
evening or night period is assumed to represent the entire
period. If there was no measurement performed for any of
C-10
Community Noise Descriptors
Model 831 Technical Reference Manual
the day, evening or night time periods then the number of
hours used in the formula is set to zero and the
corresponding Lday, Levening or Lnight will be shown as "- -". The Session Log and Run Time are used to qualify the
measurement periods.
CNEL
In the state of California, a commonly used community
noise descriptor is Community Noise Equivalent Level
(CNEL), defined by the following formula:
1
CNEL = 10log10 ----- 24
0700
0000
1900
10
L + 10 10
i
+
0700
2200
10
L 10
i
+
2400
10
L + 5 10
i
1900
+
10
L + 10 10
i
2200
This is essentially the same as the LDEN using default
values, with the exception that the evening period begins at
22.00 instead of 23.00. Thus, by making this change in the
LDEN formula, the measured value will represent CNEL.
Model 831 Technical Reference Manual
Community Noise Descriptors
C-11
C-12
Community Noise Descriptors
Model 831 Technical Reference Manual
APPENDIX
D
Glossary
This appendix contains technical definitions of key
acoustical and vibration terms commonly used with Larson
Davis instruments. The reader is referred to American
National Standards Institute document S1.1-1994 (R2004)
for additional definitions. Specific use of the terms defined
are in the main body of the text.
Allowed Exposure Time (Ti)
It is the allowed time of exposure to sound of a constant Aweighted sound level given a chosen Criterion Level,
Criterion Duration, and Exchange Rate. The equation for it
is
Tc
Tc
T i = ----------------------------------------- = ----------------------------------------L
– Lc Q
L
– Lc q
2 avg
10 avg
where Lc is the Criterion Level, Tc is the Criterion Duration,
Q is the Exchange Rate, q is the Exchange Rate Factor and
Lavg is the Average Sound Level.
Example: If Lc = 90, Tc = 8, Q = 3 and Lave= 95 then
8
8
T i = -------------------------- = ------------------------------- = 2.52 = 2 hours and 31 minutes
95 – 90 3
95 – 90 10
2
10
This means that if a person is in this area for 2 hours and 31
minutes he will have accumulated a Noise Dose of 100%.
Standard: ANSI S12.19.
The table for Exchange Rate (Q), Exchange Rate Factor (q)
and Exposure Factor is shown in the section Exchange Rate
(Q), Exchange Rate Factor (q), Exposure Factor (k) on page
D-7.
Average Sound Level (Lavg)
It is the logarithmic average of the sound during a
Measurement Duration (specific time period), using the
chosen Exchange Rate Factor. Exposure to this sound level
over the period would result in the same noise dose and the
actual (unsteady) sound levels. If the Measurement Duration
is the same as the Criterion Duration, then Lavg=LTWA(LC)
where the Measurement Duration (specified time period) is
T=T2-T1 and q is the Exchange Rate Factor. Only sound
Model 831 Technical Reference Manual
Glossary
D-1
T
L avg
2
Lp t q
1
dt
= qLog 10 --- 10
T
T
1
levels above the Threshold Level are included in the
integral. Standard: ANSI S12.19
Community Noise Equivalent
Level (CNEL, Lden)
1
L
= 10log ----den
10
24
A rating of community noise exposure to all sources of
sound that differentiates between daytime, evening and
nighttime noise exposure. The equation for it is
0700
1900
10
L + 10 10
i
0000
+
0700
2200
10
L 10
i
+
1900
2400
10
L + 5 10
i
+
2200
10
L + 10 10
i
The continuous equivalent sound level is generally
calculated on an hourly basis and is shown in the equation as
L. The levels for the hourly periods from midnight to 7 a.m.
have 10 added to them to represent less tolerance for noise
during sleeping hours. The same occurs from 10 p.m. to
midnight. The levels for the hourly periods between 7 p.m.
and 10 p.m. have 5 added to them to represent a lessened
tolerance for noise during evening activities. They are
energy summed and converted to an average noise exposure
rating.
Criterion Duration (Tc)
D-2
It is the time required for a constant sound level equal to the
Criterion Level to produce a Noise Dose of 100%. Criterion
Duration is typically 8 hours.
Example: If the Criterion Level = 90 dB and the Criterion
Duration is 8 hours, then a sound level of 90 dB for 8 hours,
will produce a 100% Noise Dose. See Noise Dose. Standard:
ANSI S12.19
Glossary
Model 831 Technical Reference Manual
Criterion Sound Exposure
(CSE)
The product of the Criterion Duration and the mean square
sound pressure associated with the Criterion Sound Level
when adjusted for the Exchange Rate. It is expressed in
Pascals-squared seconds when the exchange rate is 3 dB.
where q is the Exchange Rate Factor. See Exchange Rate.
CSE = T c 10
Lc q
Standard: ANSI S1.25
Criterion Sound Level (Lc)
It is the sound level which if continually applied for the
Criterion Duration will produce a Noise Dose of 100%. The
current OSHA Criterion Level is 90 dB.
Standard: ANSI S12.19
Daily Personal Noise Exposure
(LEP,d)
It is the level of a constant sound over the Criterion Duration
that contains the same sound energy as the actual, unsteady
sound over a specific period. The period is generally shorter,
so the sound energy is spread out over the Criterion Duration
period.
Example: If the Criterion Duration = 8 hours and the specific
period is 4 hours and the average level during the 4 hours is
86 dB, then the LEP,d = 83 dB.
Day-Night Average Sound
Level (DNL, Ldn)
A rating of community noise exposure to all sources of
sound that differentiates between daytime and nighttime
noise exposure. The equation for it is
1
L
= 10Log ----dn
10
24
0700
2200
10
L + 10 10
i
0000
+
0700
2400
10
L 10
i
+
2200
10
L + 10 10
i
The continuous equivalent sound level (See definition) is
generally calculated on an hourly basis and is shown in the
equation as L.
The values for the hourly periods from midnight to 7 a.m.
have 10 added to them to represent less tolerance for noise
Model 831 Technical Reference Manual
Glossary
D-3
during sleeping hours. The same occurs from 10 p.m. to
midnight. They are energy summed and converted to an
average noise exposure rating.
Decibel (dB)
A logarithmic form of any measured physical quantity and
commonly used in the measurement of sound and vibration.
Whenever the word level is used, this logarithmic form is
implied. The decibel provides us with the possibility of
representing a large span of signal levels in a simple manner
as opposed to using the basic unit Pascal for acoustic
measurements.
It is not possible to directly add or subtract physical
quantities when expressed in decibel form since the addition
of logarithmic values correspond to multiplication of the
original quantity.
The word level is normally attached to a physical quantity
when expressed in decibels; for example, Lp represents the
sound pressure level.
The difference between the sound pressure for silence versus
loud sounds is a factor of 1,000,000:1 or more, and it is very
unpractical to use these large numbers. Therefore, a measure
that would relate to “the number of zeros” would help, for
example, 100,000 would be equal to 50 and 1000 would be
equal to 30 and so on. This is the basic principal of the dB
measure.
All dB values are unit free and therefore, the dB value is not
the value of the quantity itself, but the ratio of that quantity
to an actual reference quantity used. Thus, for every level in
decibels there must be a well defined reference quantity.
Sound versus vibration uses different references, but the dB
principal is the same. When the quantity equals the reference
quantity the level is zero. To keep dB values above zero, the
reference is generally set to be the lowest value of the
quantity that we can imagine or normally wish to use.
Before explaining the calculation of dB values, it is useful to
remember the following rules of thumb when dB values are
used for sound levels:
- Doubling of the Sound Pressure = 6 dB
- Doubling of the Sound Power = 3 dB
- Doubling of the Perceived Sound Level = (approx) 10 dB
D-4
Glossary
Model 831 Technical Reference Manual
Note: The latter is frequency and level dependent, but the
value “10 dB” is a good rule of thumb, especially around 1
kHz.
Table 1 shows the actual value of a specific item, such as
sound power, for which the sound level is calculated. First,
the sound power value is divided with the reference used and
then the ten-based logarithm is applied. This value is then
multiplied by 10 to create the decibel value (see equation D1 below).
For every 10 decibels, a unit called Bel is created. The
decibel stands for: deci for “one tenth” and bel for “Bel”
(compare decimeter). The relationship between Bel and
decibel is thus: 1 Bel = 10 decibels. It is not possible to
directly add or subtract decibel values, since addition of
logarithmic values correspond to multiplication of the
original quantity.
Table 1
Power form, squared units
Ration of Value to Reference
1
10
100
200
1,000
10,000
100,000
1000,000
Exponential Form of
Ratio
100
101
102
102.3
103
104
105
106
Level form
10•Exponent
0
10
20
23
30
40
50
60
Each time the sound pressure level increases by 6 dB, the
corresponding sound pressure value is doubled and thus
multiplied by 2. Each time the sound power level increases
by 3 dB, the sound power value is multiplied by 2. Thus, it is
important to notice that a doubling of the sound power is
equal to 3 dB, and a doubling of the sound pressure is equal
to 6 dB, since a doubling of the sound pressure will result in
a quadruple increase of the sound power. The advantage
with using dB is simply that they remain the same even if we
use sound pressure or sound power. Compare this to the use
of voltage and power units in electrical engineering, units
being related by P~V2. In table 2 an illustration is made of
values calculated on sound pressure, non-squared units.
Model 831 Technical Reference Manual
Glossary
D-5
The original definition of decibel was intended for powerlike quantities, such as sound power. If we consider sound
pressure levels instead (usually denoted P in acoustics), the
equation will be the same, since the “two” in the squared
units will move from within the bracket and become a 20 log
instead of a 10 log and thus compensate for using linear or
quadratic units. Please note that it is not allowed to use 20
log for squared units, since that expression assumes that we
use linear units, like sound pressure in acoustics or voltage
in electrical engineering. This is illustrated in equation D-1
below:
2
P
P
dB = 10Log 10 -------2- = 20Log ----P
0
P0
;p 0 = 20Pa
Table 2 illustrates how a a tenfold increase of the sound
pressure will result in an increase in 20 dB steps, while
sound power increases in 10 dB steps. See the linear form
(Table 2) and compare with equation D-1. In conclusion, dB
values are always the same, independent of using sound
power or sound pressure as the base unit. A 6 dB increase
implies four times the sound power or two times the sound
pressure.
Table 2
Linear form, non-squared units
Ration of Value to Reference
1
10
100
200
1,000
10,000
100,000
1000,000
D-6
Glossary
Exponential Form of
Ratio
100
101
102
102.3
103
104
105
106
Level form
20•Exponent
0
20
40
46
60
80
100
120
Model 831 Technical Reference Manual
Department of Defense Level
(LDOD)
The Average Sound Level calculated in accordance with
Department of Defense Exchange Rate and Threshold Level.
See Average Sound Level
Dose
(See Noise Dose)
Detector
The part of a sound level meter that converts the actual
fluctuating sound or vibration signal from the microphone to
one that indicates its amplitude. It first squares the signal,
then averages it in accordance with the time-weighting
characteristic, and then takes the square root. This results in
an amplitude described as rms (root-mean-square).
Eight Hour Time-Weighted
Average Sound Level (L TWA(8))
It is the constant sound level that would expose a person to
the same Noise Dose as the actual (unsteady) sound levels.
The equation for it is
D
L TWA 8 = L c + qLog 10 ---------
100
NOTE: This definition applies only for a Criterion Duration
of 8 hours.
Standard: ANSI S12.19
Energy Equivalent Sound Level
(Leq)
The level of a constant sound over a specific time period that
has the same sound energy as the actual (unsteady) sound
over the same period.
T2 2
p t dt
T1
L eq = 10Log 10 -------------------------2
po T
where p is the sound pressure and the Measurement
Duration (specific time period) T=T2-T1. See Sound
Exposure Level.
Exchange Rate (Q), Exchange
Rate Factor (q), Exposure
Factor (k)
Model 831 Technical Reference Manual
It is defined in ANSI S1.25 as “the change in sound level
corresponding to a doubling or halving of the duration of a
sound level while a constant percentage of criterion
exposure is maintained.” The rate and the factors are given
Glossary
D-7
in the table below.
Standard: ANSI S12.19
Exchange Rate, Q
3.01
4
5
6.02
Far Field
Exchange Rate
Factor, q
10
13.29
16.61
20
Exposure Factor, k
1
.75
.60
.50
There are two types of far fields: the acoustic far field and
the geometric far field.
Acoustic Far Field: The distance from a source of sound is
greater than an acoustic wavelength. In the far field, the
effect of the type of sound source is negligible. Since the
wavelength varies with frequency (See the definition of
Wavelength), the distance will vary with frequency. To be in
the far field for all frequencies measured, the lowest
frequency should be chosen for determining the distance.
For example, if the lowest frequency is 20 Hz, the
wavelength at normal temperatures is near 56 ft. (17 m); at
1000 Hz, the wavelength is near 1.1 ft. (1/3 m). See the
definition of Acoustic Near Field for the advantages of being
in the acoustic far field.
Geometric Far Field: The distance from a source of sound is
greater than the largest dimension of the sound source. In the
far field, the effect of source geometry is negligible. Sound
sources often have a variety of specific sources within them,
such as exhaust and intake noise. When in the far field, the
sources have all merged into one, so that measurements
made even further away will be no different. See the
definition of Geometric Near Field for the advantages of
being in the geometric far field.
Free Field
A sound field that is free of reflections. This does not mean
that the sound is all coming from one direction as is often
assumed, since the source of sound may be spatially
extensive. See the definitions of near and far fields for more
detail. This definition is often used in conjunction with
reverberant field.
Frequency (Hz, rad/sec)
The rate at which an oscillating signal completes a complete
cycle by returning to the original value. It can be expressed
in cycles per second and the value has the unit symbol Hz
(Hertz) added and the letter f is used for a universal
descriptor. It can also be expressed in radians per second,
D-8
Glossary
Model 831 Technical Reference Manual
which has no symbol, and the greek letter is used for a
universal descriptor. The two expressions are related through
the expression =2f.
Frequency Band Pass Filter
The part of certain sound level meters that divides the
frequency spectrum on the sound or vibration into a part that
is unchanged and a part that is filtered out. It can be
composed of one or more of the following types:
Low Pass: A frequency filter that permits signals to pass
through that have frequencies below a certain fixed
frequency, called a cutoff frequency. It is used to
discriminate against higher frequencies.
High Pass: A frequency filter that permits signals to pass
through that have frequencies above a certain fixed
frequency, called a cutoff frequency. It is used to
discriminate against lower frequencies.
Bandpass: A frequency filter that permits signals to pass
through that have frequencies above a certain fixed
frequency, called a lower cutoff frequency, and below a
certain fixed frequency, called an upper cutoff frequency.
The difference between the two cutoff frequencies is called
the bandwidth. It is used to discriminate against both lower
and higher frequencies so it passes only a band of
frequencies.
Octave band: A bandpass frequency filter that permits
signals to pass through that have a bandwidth based on
octaves. An octave is a doubling of frequency so the upper
cutoff frequency is twice the lower cutoff frequency. This
filter is often further subdivided in 1/3 and 1/12 octaves (3
and 12 bands per octave) for finer frequency resolution.
Instruments with these filters have a sufficient number of
them to cover the usual range of frequencies encountered in
sound and vibration measurements.The frequency chosen to
describe the band is that of the center frequency. Note table
in Frequency Filter - Frequency Weighting.
Frequency Filter - Weighted
A special frequency filter that adjusts the amplitude of all
parts of the frequency spectrum of the sound or vibration
unlike band pass filters. It can be composed of one or more
of the following types:
A-Weighting: A filter that adjusts the levels of a frequency
spectrum in the same way the human ear does when exposed
to low levels of sound. This weighting is most often used for
Model 831 Technical Reference Manual
Glossary
D-9
evaluation of environmental sounds. See table below.
B-Weighting: A filter that adjusts the levels of a frequency
spectrum in the same way the human ear does when exposed
to higher levels of sound. This weighting is seldom used.
See table below.
C-Weighting: A filter that adjusts the levels of a frequency
spectrum in the same way the human ear does when exposed
to high levels of sound. This weighting is most often used
for evaluation of equipment sounds. See table below.
Flat-Weighting: A filter that does not adjust the levels of a
frequency spectrum. It is sometimes an alternative selection
for the frequency-weighting selection..
Z-Weighting: Similar to a flat-weighting curve, this is a
bandpass filter with a passband from 10 Hz to 20 kHz.
Center Frequencies, Hz
1/3 Octave
20
25
31.5
40
50
63
80
100
125
160
200
D-10
Glossary
1 Octave
31.5
63
125
Weighting Network Frequency
Response
A
B
C
-50.4
-24.2
-6.2
-44.7
-20.4
-4.4
-39.4
-17.1
-3.0
-34.6
-14.2
-2.0
-30.2
-11.6
-1.3
-26.2
-9.3
-0.8
-22.5
-7.4
-0.5
-19.1
-5.6
-0.3
-16.1
-4.2
-0.2
-13.4
-3.0
-0.1
-10.9
-2.0
0
Model 831 Technical Reference Manual
Center Frequencies, Hz
1/3 Octave
250
315
400
500
630
800
1000
1250
1600
2000
2500
3150
4000
5000
6300
8000
10000
12500
16000
20000
1 Octave
250
500
1000
2000
4000
8000
16000
Weighting Network Frequency
Response
A
B
C
-8.6
-1.3
0
-6.6
-0.8
0
-4.8
-0.5
0
-3.2
-0.3
0
-1.9
-0.1
0
-0.8
0
0
0
0
0
0.6
0
0
1.0
0
-0.1
1.2
-0.1
-0.2
1.3
-0.2
-0.3
1.2
-0.4
-0.5
1.0
-0.7
-0.8
0.5
-1.2
-1.3
-0.1
-1.9
-2.0
-1.1
-2.9
-3.0
-2.5
-4.3
-4.4
-4.3
-6.1
-6.2
-6.6
-8.4
-8.5
-9.3
-11.1
-11.2
Leq
See “Energy Equivalent Sound Level”, “Sound Level”,
Energy Average”, and “Time Weighted Average”
Level (dB)
A descriptor of a measured physical quantity, typically used
in sound and vibration measurements. It is attached to the
name of the physical quantity to denote that it is a
logarithmic measure of the quantity and not the quantity
itself. The word decibel is often added after the number to
express the same thing. When frequency weighting is used
the annotation is often expressed as dB(A) or dB(B).
Measurement Duration (T)
The time period of measurement. It applies to hearing
damage risk and is generally expressed in hours.
Standard: ANSI S12.19
Microphone Guidelines
Microphone - Types: A device for detecting the presence of
sound. Most often it converts the changing pressure
associated with sound into an electrical voltage that
duplicates the changes. It can be composed of one of the
following types:
Capacitor (Condenser): A microphone that uses the motion
of a thin diaphragm caused by the sound to change the
capacitance of an electrical circuit and thereby to create a
Model 831 Technical Reference Manual
Glossary
D-11
signal. For high sensitivity, this device has a voltage applied
across the diaphragm from an internal source.
Electret: A microphone that uses the motion of a thin
diaphragm caused by the sound to change the capacitance of
an electrical circuit and thereby to create a signal. The
voltage across the diaphragm is caused by the charge
embedded in the electret material so no internal source is
needed.
Microphone - Uses: The frequency response of
microphones can be adjusted to be used in specific
applications. Among those used are:
Frontal incidence (Free Field): The microphone has been
adjusted to have an essentially flat frequency response when
in a space relatively free of reflections and when pointed at
the source of the sound.
Random incidence: The microphone has been adjusted to
have an essentially flat frequency response for sound waves
impinging on the microphone from all directions.
Pressure: The microphone has not been adjusted to have an
essentially flat frequency response for sound waves
impinging on the microphone from all directions.
What a microphone measures: A microphone detects more
than just sound. The motion of a microphone diaphragm is
in response to a force acting on it. The force can be caused
by a number of sources only one of which are we interested:
sound. Non-sound forces are: (1) direct physical contact
such as that with a finger or a raindrop; (2) those caused by
the movement of air over the diaphragm such as
environmental wind or blowing; (3) those caused by
vibration of the microphone housing; and (4) those caused
by strong electrostatic fields.
Rules:
1. Do not permit any solid or liquid to touch the microphone
diaphragm. Keep a protective grid over the diaphragm.
2. Do not blow on a microphone and use a wind screen over
the microphone to reduce the effect of wind noise.
3. Mount microphones so their body is not subject to
vibration, particularly in direction at right angles to the plane
of the diaphragm.
4. Keep microphones away from strong electrical fields.
A microphone measures forces not pressures. We would like
the microphone to measure sound pressure (force per unit
area) instead of sound force. If the pressure is applied
D-12
Glossary
Model 831 Technical Reference Manual
uniformly over the microphone diaphragm a simple constant
(the diaphragm area) relates the two, but if the pressure
varies across the diaphragm the relationship is more
complex. For example, if a negative pressure is applied on
one-half the diaphragm and an equal positive pressure is
applied to the other half, the net force is zero and essentially
no motion of the diaphragm occurs. This occurs at high
frequencies and for specific orientations of the microphone.
Rules:
1. Do not use a microphone at frequencies higher than
specified by the manufacturer; to increase the frequency
response choose smaller microphones.
2. Choose a microphone for free field or random incidence
to minimize the influence of orientation.
A microphone influences the sound being measured. The
microphone measures very small forces, low level sound can
run about one-billionth of a PSI! Every measurement
instrument changes the thing being measured, and for very
small forces that effect can be significant. When sound
impinges directly on a microphone the incident wave must
be reflected since it cannot pass through the microphone.
This results in the extra force required to reflect the sound
and a microphone output that is higher than would exist if
the microphone were not there. This is more important at
high frequencies and when the microphone is facing the
sound source.
Rules:
1. Do not use a microphone at frequencies higher than
specified by the manufacturer; to increase the frequency
response choose smaller microphones.
2. Choose a microphone for free field or random incidence
to minimize the influence of orientation.
A microphone measures what is there from any direction:
Most measurements are intended to measure the sound level
of a specific source, but most microphones are not
directional so they measure whatever is there, regardless of
source.
Rules:
1. When making hand-held measurements, keep your body
at right angles to the direction of the sound you are
interested in and hold the meter as far from your body as
possible. Use a tripod whenever possible.
2. Measure the influence of other sources by measuring the
background sound level without the source of interest. You
may have to correct for the background.
Model 831 Technical Reference Manual
Glossary
D-13
Near Field
There are two types of near fields: the acoustic near field
and the geometric near field.
Acoustic Near Field: The distance from a source of sound is
less than an acoustic wavelength. In the near field, the effect
of the type of sound source is significant. Since the
wavelength varies with frequency (See the definition of
Wavelength), the distance will vary with frequency. The
most common example of a near field is driving an
automobile with an open window. As you move your ear to
the plane of the window, the sound pressure level builds up
rapidly (wind noise) since most of the pressure changes are
to move the air and very little of it compresses the air to
create sound. Persons not far way, can hardly hear what you
hear. The acoustic near field is characterized by pressures
that do not create sound that can be measured in the far field.
Therefore measurements made here are not useful in
predicting the sound levels far way or the sound power of
the source.
Geometric Near Field: The distance from a source of sound
is less than the largest dimension of the sound source. In the
near field, effect of source geometry is significant. Sound
sources often have a variety of specific sources within them,
such as exhaust and intake noise. When in the near field, the
sound of a weaker, but close, source can be louder than that
of a more distant, but stronger, source. Therefore
measurements made here can be used to separate the various
sources of sound, but are not useful in predicting the sound
levels and sound spectrum far from the source.
Noise
Typically it is unwanted sound. This word adds the response
of humans to the physical phenomenon of sound. The
descriptor should be used only when negative effects on
people are known to occur. Unfortunately, this word is used
also to describe sounds with no tonal content (random):
Ambient: The all encompassing sound at a given location
caused by all sources of sound. It is generally random, but
need not be.
Background: The all encompassing sound at a given location
caused by all sources of sound, but the source to be
measured. It is essentially the sound that interferes with a
measurement.
Pink: It is a random sound that maintains constant energy
per octave. Pink light is similar to pink noise in that it has a
higher level at the lower frequencies (red end of the
D-14
Glossary
Model 831 Technical Reference Manual
spectrum).
White: It is a random sound that contains equal energy at
each frequency. In this respect, it is similar to white light.
Noise Dose (D)
It is the percentage of time a person is exposed to noise that
is potentially damaging to hearing. Zero represents no
exposure and 100 or more represents complete exposure. It
is calculated by dividing the actual time of exposure by the
allowed time of exposure. The allowed time of exposure is
determined by the Criterion Duration and by the sound level
(the higher the level, the shorter the allowed time). The
sound levels must be measured with A-frequency weighting
and slow exponential time weighting. See Projected Noise
Dose.
100T L – L q
D = ------------ 10 i c
Tc
where
T is Measurement Duration
Tc is Criteria Time
Li is TWA
Lc is Criteria Level
q is exchange rate factor; see page D-7 "Exchange Rate (Q),
Exchange Rate Factor (q), Exposure Factor (k)"
Standard: ANSI S12.19
Noise Exposure
(See Sound Exposure)
OSHA Level (LOSHA)
The Average Sound Level calculated in accordance with the
Occupational Safety and Health Administration Exchange
Rate and Threshold Level.
Preamplifier
A part of the sound level meter that matches a particular
model of microphone to the meter. It must be chosen in
conjunction with a microphone and a cable that connects
them.
Projected Noise Dose
It is the Noise Dose expected if the current rate of noise
exposure continues for the full Criterion Duration period.
Model 831 Technical Reference Manual
Glossary
D-15
Single Event Noise Exposure
Level (SENEL, LAX)
The total sound energy over a specific period. It is a special
form of the Sound Exposure Level where the time period is
defined as the start and end times of a noise event such as an
aircraft or automobile passby.
Sound
The rapid oscillatory compressional changes in a medium
(solid, liquid or gas) that propagate to distant points. It is
characterized by changes in density, pressure, motion, and
temperature as well as other physical quantities. Not all
rapid changes in the medium are sound (wind noise) since
they do not propagate.
The auditory sensation evoked by the oscillatory changes.
Difference between sound and noise: Sound is the physical
phenomenon associated with acoustic (small) pressure
waves. Use of the word sound provides a neutral description
of some acoustic event. Generally, noise is defined as
unwanted sound. It can also be defined as sound that causes
adverse effects on people such as hearing loss or annoyance.
It can also be defined as the sound made by other people. In
every case, noise involves the judgment of someone and
puts noise in the realm of psychology not physics.
Rules:
1. Use word sound to describe measurements to remove the
emotional overtones associated with the word noise. Some
sound metrics use noise in their name and it is proper to use
the name as it is.
Sound Exposure (SE)
It is the total sound energy of the actual sound during a
specific time period. It is expressed in Pascals-squared
seconds.
T2
SE =
2
pA t dt
T1
where pA is the sound pressure and T2 - T1 is the
Measurement Duration (specific time period).
When applied to hearing damage potential, the equation is
changed to
where k is the Exposure Factor. See Exchange Rate.
Standard: ANSI S1.25
D-16
Glossary
Model 831 Technical Reference Manual
T2
SE =
k
p t dt
2
A
T1
Sound Exposure Level (SEL,
L E)
The total sound energy in a specific time period. The
equation for it is
T2
2
p t dt
T
1
SEL = 10Log 10 -----------------------2
p0 T
The sound pressure is squared and integrated over a specific
period of time (T2-T1) this is called the sound exposure and
has the units Pascal squared- seconds or Pascal squaredhours. P0 is the reference pressure of 20 µPa and T is the
reference time of 1 second. It is then put into logarithmic
form. It is important to note that it is not an average since the
reference time is not the same as the integration time.
Sound Pressure
Model 831 Technical Reference Manual
The physical characteristic of sound that can be detected by
microphones. Not all pressure signals detected by a
microphone are sound (e.g., wind noise). It is the amplitude
of the oscillating sound pressure and is measured in Pascals
(Pa), Newtons per square meter, which is a metric equivalent
of pounds per square inch. To measure sound, the oscillating
pressure must be separated from the steady (barometric)
pressure with a detector. The detector takes out the steady
pressure so only the oscillating pressure remains. It then
squares the pressure, takes the time average, and then takes
the square root (this is called rms for root-mean square).
There are several ways this can be done.
Glossary
D-17
Moving Average: The averaging process is continually
accepting new data so it is similar to an exponential moving
average. The equation for it is
t
p rms =
– t – T
1 2
--- p e
d
T
ts
The sound pressure is squared and multiplied by a
exponential decay factor so that when the time of integration
is near the current time (t) it is essentially undiminished. For
times older (less) than the current time, the value is
diminished and so becomes less important. The rate at which
older data are made less influential is expressed by the
constant T. The larger it is, the slower the decay factor
reduces and the slower the response of the system to rapid
changes. These are standardized into three values called
Time Weighting. See the values below.
Fixed Average: The averaging process is over a fixed time
period. The equation for it is
T2
p rms =
2
1
----------------------- p t dt
T2 – T1
T1
The sound pressure is squared and averaged over a fixed
time period. Unlike the moving average, the sound pressures
in all time intervals are equally weighted.
Sound Pressure Level (SPL, Lp)
The logarithmic form of sound pressure. It is also expressed
by attachment of the word decibel to the number. The
logarithm is taken of the ratio of the actual sound pressure to
a reference sound pressure which is 20 MicroPascals ( Pa).
There are various descriptors attached to this level
depending on how the actual sound pressure is processed in
the meter:
Instantaneous: The time varying reading on a meter face on
in a meter output due to changes in the sound pressure. The
reading will depend on the time-weighting applied.
D-18
Glossary
Model 831 Technical Reference Manual
The fundamental relationship between the two is logarithmic
p rms
L p = 20log 10 ---------p0
p rms = p 0 10
L p 20
where p0 is the reference sound pressure of 20 µPa. The
square of the sound pressure is a power-like quantity that
can be expressed in the original form of the level definition
2
p rms
L p = 10log 10 --------2
p0
2
2
p rms = p 0 10
L p 10
Sound Pressure Level can be converted to sound pressure as
follows. If the sound pressure is 1 Pascal, then the sound
pressure level is
1
- = 20log 10 50000 = 20 4.699 = 94.0dB
L p = 20log 10 --------------------–6
20 10
Calibrators often use a level of 94 dB so they generate a
sound pressure of 1 Pascal.
If the sound pressure level = 76.3 dB, then the sound
pressure is
Pa = 20 10
–6
10
76.3 20
= 20 10
3.815 – 6
= 20 10
– 2.185
= 20 0.0065 = 0.13
Energy Average (Leq): The value of a steady sound measured
over a fixed time period that has the same sound energy as
the actual time varying sound over the same period. This
descriptor is widely used. It is a fixed average (See Sound
Pressure).
Impulse: The value of an impulsive sound. The reading will
depend on the time-weighting applied.
Model 831 Technical Reference Manual
Glossary
D-19
Unweighted Peak: The peak value of a sound with a meter
that has flat frequency weighting and a peak detector.
Weighted Peak: The peak value of a sound with a meter that
has a frequency weighting other than flat and a peak
detector.
Sound Power(W)
The sound power emitted by a sound source. It is measured
in Watts.
Sound Power Level (PWL, Lw)
The logarithmic form of sound power. It is also expressed by
attachment of the word decibel to the number. The logarithm
is taken of the ratio of the actual sound power to a reference
sound power, which is 1 pico-watt. Sound power level
cannot be measured directly, but can only be deduced
through measurements of sound intensity or sound pressure
around the source. The equation for it is
W
L w = 10log 10 ------W0
Sound Speed, (c,)
W = W 0 10
The speed at which sound waves propagate. It is measured
in meters per second. It should not be confused with sound
or particle velocity which relates to the physical motion of
the medium itself.
c = 20.05 degC + 273
c = 49.03 degF + 460
Spectrum (Frequency
Spectrum)
D-20
L w 10
m sec
ft sec
The amplitude of sound or vibration at various frequencies.
It is given by a set of numbers that describe the amplitude at
each frequency or band of frequencies. It is often prefixed
with a descriptor that identifies it such as sound pressure
spectrum. It is generally expressed as a spectrum level.
Glossary
Model 831 Technical Reference Manual
Taktmaximal-5
An integration of the five second maximum A frequency
weighted, fast time weighted sound pressure levels.
L AF max 5s (n )
10 10
LAFTM 5 10 log
n
Where:
LAmax 5s(n) is the maximum A-weighted fast exponential
time weighted sound pressure level for each n 5-second time
period
and
n is the number of 5 second periods accumulated during the
measurement.
Threshold Sound Level (Lt)
The A-weighted sound level below which the sound
produces little or no Noise Dose accumulation and may be
disregarded. It is used for hearing damage risk assessment.
Standard: ANSI S1.25
Time Weighted Average Sound
Level (TWA, LTWA(TC))
It is the level of a constant sound over the Criterion
Duration, that would expose a person to the same Noise
Dose as the actual (unsteady) sound over the same period. If
the Exchange Rate is 3 dB then the TWA is equal to the Leq.
T
2 L t K
1
p
L TWA TC = Klog 10 --- 10
dt
T
T
1
where Tc=T2-T1 and K is the Exchange Rate Factor. It is
used for hearing damage risk assessment.
Standard: ANSI S12.19
Model 831 Technical Reference Manual
Glossary
D-21
Time Weighting
The response speed of the detector in a sound level meter.
There are several speeds used.
Slow: The time constant is 1 second (1000 ms). This is the
slowest and is commonly used in environmental noise
measurements.
Fast: The time constant is 1/8 second (125 ms). This is a less
commonly used weighting but will detect changes in sound
level more rapidly.
Impulse: The time constant is 35ms for the rise and 1.5
seconds (1500 ms) for the decay. The reason for the double
constant is to allow the very short signal to be captured and
displayed.
Vibration
The oscillatory movement of a mechanical system
(generally taken to be solid). It is used as a broad descriptor
of oscillations.
Wavelength (l)
The distance between peaks of a propagating wave with a
well defined frequency. It is related to the frequency through
the following equation
= -cf
where c is the sound speed and f is the frequency in Hz. It
has the dimensions of length.
Wavenumber (k)
A number that is related to the wavelength of sound and is
used to compare the size of objects relative to the
wavelength or the time delay in sound propagation. It is
related to wavelength through the following equation
2
2 f
k = ------ = -------- = ---
c
c
where is the wavelength, c is the sound speed, f is the
frequency in Hz, and is the radian frequency. It has the
dimensions of inverse length.
D-22
Glossary
Model 831 Technical Reference Manual
Numerics
831 Hardware........................................... 24-1
Batteries ............................................ 24-10
Components ...................................... 24-1
Connectors ........................................ 24-8
Display.............................................. 24-4
External Power Supply ..................... 2-724-12
Hardkey LED Colors ........................ 24-6
Hardkeys ........................................... 24-6
Interface Connector Pinouts ............. 24-8
Interfaces........................................... 24-8
Keypad.............................................. 24-5
Microphone....................................... 24-4
Microphone Preamplifier.................. 24-4
Softkeys ............................................ 24-5
A
About ....................................................... 22-1
About ................................................ 22-2
Control Panel .................................... 22-1
Options.............................................. 22-4
Standards........................................... 22-3
User................................................... 22-4
About Pages ............................................. 3-22
About ................................................ 3-22
Options.............................................. 3-22
Standards........................................... 3-22
User................................................... 3-23
AC/DC Output ......................................... 17-13
Accessories
Microphone....................................... 1-9
Microphone Preamplifier.................. 1-9
Microphones ..................................... 1-10
Optional ............................................ 1-10
Other ................................................. 1-9
Standard ............................................ 1-9
Add Options ............................................. 27-1
Alphanumeric Parameters........................ 3-26
Any Level Display ................................... 5-40
Auto-Off................................................... 17-6
Auto-Store................................................ 17-12
I831.01 Rev J Supporting Firmware Version 2.0
B
Back Erase ............................................... 7-10
Backlight.................................................. 17-9
Display ............................................. 3-13
Mode................................................. 3-8
Time ................................................. 17-9
Basic Data Display .................................. 5-1
Batteries................................................... 24-10
Alignment......................................... 2-6
Door.................................................. 2-5
Inserting............................................ 2-5
Low Voltage..................................... 24-11
Battery ..................................................... 5-11
Voltage ............................................. 5-11
Battery Door
Removal ........................................... 2-5
Battery Power .......................................... 2-4
Check................................................ 3-13
Battery Type ............................................ 17-5
C
C-A Level ................................................ 5-22
Cables
AC/DC Output.................................. 1-13
Direct Input ...................................... 1-13
Microphone Extension ..................... 1-13
USB .................................................. 1-13
Calculations ............................................. C-1
Calibrate .................................................. 3-2221-1
Calibration ............................................... 21-1
> 0.5 dB From Previous Calibration 21-11
Calibrate ........................................... 21-1
Calibration History........................... 21-11
Calibration Spectrum........................ 21-12
Calibration without Preamplifier...... 21-15
Calibrator.......................................... 21-5
Certification...................................... 21-16
Certification Interval ........................ 21-16
Certification Reminder..................... 21-16
Control Panel.................................... 21-2
Direct Data Input.............................. 21-14
Microphone Selection ...................... 21-8
Noise Floor....................................... 21-13
Outside Range of Normal Sensitivity21-10
Overload Level ................................. 21-14
Performing the Calibration ............... 21-9
Sensitivity Page ................................ 21-13
Under Range Level ........................... 21-14
Warning Messages............................ 21-10
Calibrator ................................................. 21-5
Recommended .................................. 21-5
Changing Data Pages ............................... 3-17
Changing Views....................................... 3-7
Check Battery Power ............................... 3-13
Close Key................................................. 3-9
CNEL ....................................................... 4-15C-11
Communication........................................ 3-2219-1
Common Pitfalls in Analog Modem Communication19-5
Control Panel .................................... 19-1
GPRS Modem Page .......................... 19-6
Modem Page ..................................... 19-3
Communication Status ............................. 19-19
States................................................. 19-22
Wireless Channel .............................. 19-20
Community Noise .................................... 5-21
Equivalent Level............................... C-11
Community Noise Equivalent Level........ 4-15
Complete an Action ................................. 3-12
Continue a Run ........................................ 3-12
Contrast
Control .............................................. 3-13
Control Page ............................................ 4-9
Manual Stop Mode ........................... 4-10
Stop When Stable Mode ................... 4-11
Time Stop Mode ............................... 4-10
Control Panel ........................................... 23-1
Calibrate............................................ 21-2
Criterion ................................................... 8-4D-2
Sound Level ...................................... D-3
Current Date and Time ............................ 5-11
D
Data Display
1/1 Octave Band Analyzer................ 5-5
Any Level Display............................ 5-40
Data Labels ....................................... 5-1
Graph Scaling ................................... 5-27
Leq .................................................... 5-12
I831.01 Rev J Supporting Firmware Version 2.0
Live Page.......................................... 5-2
No. of Measurements ....................... 5-23
Overall.............................................. 3-15
Overall Page ..................................... 5-12
Overall SLM..................................... 5-15
Session Log ...................................... 5-24
Tabbed Page Structure ..................... 5-1
Time, Battery Voltage and Memory 5-11
Data Display Screen ................................ 3-13-143-157-2
Data Entry................................................ 3-24
Alphanumeric Parameters ................ 3-26
Numeric Parameters ......................... 3-27
Data Explorer........................................... 16-2
Close................................................. 16-1
Data View Screen............................. 16-4
Delete All Internal Files ................... 16-5
Delete File ........................................ 16-5
End Data and Time........................... 16-2
File Name ......................................... 16-2
Jump to End File .............................. 16-10
Load Settings.................................... 16-10
Menu................................................. 16-4
Move All Files to USB Memory Device16-9
Move File to USB Memory Device . 16-8
Refresh File List ............................... 16-10
Rename File...................................... 16-6
Scrolling ........................................... 16-3
Start Date and Time.......................... 16-2
Test Run Time.................................. 16-2
View ................................................. 16-4
Data Labels.............................................. 5-1
Data View Screen .................................... 16-4
Date Format ............................................. 17-19
Day/Night Page ....................................... 4-13
Day-Evening-Night Level ....................... 4-14C-10
Day-Night Level...................................... 4-14C-9
DC Output ............................................... 17-13
Decibel..................................................... D-4
Decimal Symbol ...................................... 17-19
Declaration of Conformity ...................... A-19
Delete File ............................................... 16-5
Department of Defense
LeveL ............................................... D-7
Detector ................................................... D-7
Device Page ............................................. 17-2
Disk Check During Boot-up .................... 7-2
Display
Backlight........................................... 3-13
Display Contrast ...................................... 3-817-10
Display Customization............................. 17-20
Display Sections/Icons............................. 3-2
Input Overload .................................. 3-3
Measurement Name .......................... 3-3
Measurement Status.......................... 3-5
OBA Overload .................................. 3-4
Page................................................... 3-2
Power Indicator................................. 3-2
Run Time .......................................... 3-3
Scroll Bar .......................................... 3-2
Section Indicator............................... 3-2
Stability Indicator ............................. 3-3
Tabs................................................... 3-2
Displays
Selecting Displays to Appear............ 17-21
Displays Page
Start................................................... 17-21
Duration
Measurement..................................... D-11
E
Eight Hour TWA ..................................... D-7
End a Test ................................................ 3-12
Enter Key ................................................. 3-12
Equivalent Electrical Impedance Adaptor1-12
Event History ........................................... 12-16
1/1 Octave Spectrum Display ........... 12-17
1/3 Octave Spectrum Display ........... 12-18
Changing Displayed Record ............. 12-16
Continuation Period .......................... 12-2
Data................................................... 12-1
Events Display .................................. 12-13
Level Based Events........................... 12-1
Link to Measurement History........... 11-1212-24
Link to Time History ........................ 11-1212-24
Minimum Duration ........................... 12-2
Sound Recording in Progress Icon ... 12-15
Spectra Time History Display .......... 12-20
Time History..................................... 12-10
Time History Display ....................... 12-19
I831.01 Rev J Supporting Firmware Version 2.0
Trigger Method ................................ 12-3
Trigger Status Icons ......................... 12-14
Triggers Page.................................... 12-2
Event Sound Recording........................... 15-15
Event Time History ................................. 12-10
Max Number of Samples.................. 12-12
Period ............................................... 12-10
Pre/Post Trigger................................ 12-11
Pre-trigger......................................... 12-12
Spectral Mode .................................. 12-11
Event Time History Display.................... 12-19
Exceedance Event Data ........................... 4-13
Exceedance History ................................. 12-1
Exchange Rate
Glossary............................................ D-7
Exchange Rate Factor
Glossary............................................ D-7
Exchange Rates ....................................... 8-4
Exposure Factor
Glossary............................................ D-7
External Shutoff Voltage......................... 17-10
F
Far Field................................................... D-8
Acoustic............................................ D-8
Geometric ......................................... D-8
Features.................................................... 1-5
File System .............................................. 23-2
Filters
1/1, 1/3 Octave Filter Shapes ........... A-21
Firmware
Upgrade ............................................ 27-1
Free field.................................................. D-8
Frequency
Band Pass Filter................................ D-9
Glossary............................................ D-8
Hz, rad/sec........................................ D-9
Frequency Spectrum................................ D-20
Frequency Weighting .............................. 4-4
G
Gain, 20 dB.............................................. 4-5
Glossary................................................... D-1
Allowed Exposure Tiime ................. D-1
Average Sound Level ....................... D-1
CNEL, Lden...................................... D-2
Criterion Duration............................. D-2
Criterion Sound Exposure................. D-3
Criterion Sound Level....................... D-3
Daily Personal Noise Exposure ........ D-3
Day-Night Average Sound Level ..... D-3
Decibel.............................................. D-4
Detector............................................. D-7
Dose .................................................. D-7
Exchange Rate .................................. D-7
Exchange Rate Factor
Glossary
Exposure FactorD-7
Far Field............................................ D-8
Free Field .......................................... D-8
Frequency ......................................... D-8
Frequency Band Pass Filter .............. D-9
Frequency Filter-Weighted............... D-9
LDOD ............................................... D-7
Leq .................................................... D-7D-11
Level ................................................. D-11
LTWA(8) .......................................... D-7
Measurement Duration ..................... D-11
Microphone Guidelines .................... D-11
Near Field ......................................... D-14
Noise ................................................. D-14
Noise Dose........................................ D-15
Noise Exposure................................. D-15
OSHA Level ..................................... D-15
Preamplifier ...................................... D-15
Projected Noise Dose........................ D-15
Single Event Noise Exposure Level . D-16
Sound ................................................ D-16
Sound Exposure ................................ D-16
Sound Exposure Level...................... D-17
Sound Power..................................... D-20
Sound Power Level........................... D-20
Sound Pressure.................................. D-17
Sound Pressure Level ....................... D-18
Sound Speed ..................................... D-20
Spectrum ........................................... D-20
Taktmaximal-5.................................. D-21
Threshold Sound Level..................... D-21
Time Weighted Average Sound LevelD-21
I831.01 Rev J Supporting Firmware Version 2.0
Time Weighting................................ D-22
Vibration........................................... D-22
Wave Number .................................. D-22
Wavelength....................................... D-22
GPRS Modem Page................................. 19-6
GPS Input ................................................ 18-10
Setup................................................. 18-10
Graph Scaling .......................................... 5-27
H
Headset .................................................... 1-14
Output............................................... 17-13
Use of ............................................... 9-3
I
Improper Shutdown ................................. 7-17
Impulsivity............................................... 5-22
Industrial Hygiene
Auto-Calculate ................................. 8-4
Criterion ........................................... 8-4
Data Display..................................... 8-5
Dose Parameters Individually Defined8-3
Dosimeter 1 and 2 ............................ 8-6
Exchange Rates ................................ 8-4
Measurement Setup .......................... 8-1
Predefined Dose Setups.................... 8-2
SEA .................................................. 8-8
Sound Exposure................................ 8-5
Threshold.......................................... 8-4
Industrial Hygiene Measurements........... 8-111-1
Initiate a Run ........................................... 3-12
Integrated Level Calculations.................. C-1
Dose Calculations............................. C-5
Equivalent Continuous Sound Level C-1
Projected Dose.................................. C-5
Sound Exposure................................ C-7
Time-Weighted Averages ................ C-2
Integration................................................ 4-5
J
Jack Function........................................... 17-13
Jump to End File...................................... 16-10
L
L(500Hz)S ............................................... 5-5
LAeq ........................................................ 5-2
LAeq(1s) .................................................. 5-3
Languages ................................................ 17-17
LAS .......................................................... 5-35-55-135-15
LASeq ...................................................... 5-125-15
LASmax ................................................... 5-15
LASmin.................................................... 5-16
LCeq-LAeq .............................................. 5-22
LDEN....................................................... 4-14C-10
LDN ......................................................... 4-14C-9
Left and Right Keys ................................. 3-12
Leq ........................................................... 5-12
Level ........................................................ D-11
Dept of Defense ................................ D-7
Levels Display ......................................... 12-16
Live .......................................................... 3-15
Live Display Page .................................... 5-2
Live Page
1/3 Octave Band Analyzer................ 5-6
Large Digit Display .......................... 5-4
Preamp Display................................. 5-8
SLM Display..................................... 5-2
Time/Battery Voltage/Memory Display5-11
Triggering ......................................... 5-7
Ln
Modifying n Values During a Measurement4-9
Selection of n Values ........................ 4-8
Ln Page .................................................... 4-8
Load Settings ........................................... 16-10
Localization Page..................................... 17-17
Lock ......................................................... 3-21
Lock Modes
Fully Locked..................................... 20-3
Lock with Auto-Store ....................... 20-2
Lock with Manual Store ................... 20-3
Unlocked........................................... 20-2
Lock/Unlock ............................................ 20-1
Allow Cal when Locked ................... 20-4
Calibration when Locked.................. 20-9
Control Panel .................................... 20-1
Fully Locked..................................... 20-5
Lock Modes ...................................... 20-120-2
I831.01 Rev J Supporting Firmware Version 2.0
Locked with Auto-Store ................... 20-7
Locked with Manual Store ............... 20-8
Unlock Code..................................... 20-3
LZpeak..................................................... 5-35-15
LZpeak(max) ........................................... 5-15
M
Making a Measurement ........................... 7-17-6
831 Setup.......................................... 7-4
Back Erase........................................ 7-10
Calibrating........................................ 7-4
Low Level Sound Fields .................. 7-16
Measurement Display....................... 7-7
Measurement Range......................... 7-8
Microphone Extension Cable ........... 7-4
Observer Position ............................. 7-4
Overload Indication.......................... 7-8
Pausing the Measurement................. 7-9
Performing the Measurement ........... 7-6
Positioning........................................ 7-4
Recovery from Improper Shutdown. 7-17
Resetting the Measurement .............. 7-13
Softkeys............................................ 7-3
Start-up Period.................................. 7-2
Stopping the Measurement............... 7-14
Storing the Measurement ................. 7-15
Switch On......................................... 7-1
Under Range Indication ................... 7-9
Use of Windscreen ........................... 7-5
Views................................................ 7-3
Manual Sound Recording ........................ 15-7
Manual Stop Mode .................................. 4-10
Marker Initiated Recording ..................... 15-10
Marker Recording.................................... 15-10
Markers.................................................... 10-18
Close Window .................................. 10-21
Naming ............................................. 10-1915-11
Setting All Off.................................. 10-21
Setting On/Off .................................. 10-20
Setup................................................. 10-1815-10
Using ................................................ 10-20
Mask/Unmask Options ............................ 17-27
Measurement Counter ............................. 11-3
Measurement History .............................. 11-1
Continuous Mode.............................. 11-2
Data Display ..................................... 11-6
Link to Time History ........................ 11-12
Manual Mode.................................... 11-5
Measurement Counter....................... 11-3
Run Control ...................................... 11-1
Stop When Stable Mode ................... 11-5
Storing Measurement........................ 11-12
Timed Stop Mode ............................. 11-3
Timer Mode ...................................... 11-2
Measurement History Sound Recording.. 15-19
Measurement Name ................................. 3-3
Measurement Properties Screen............... 3-143-17
Accessing.......................................... 4-1
Control .............................................. 3-18
Dosimeter 1....................................... 3-18
Dosimeter 2....................................... 3-18
General.............................................. 3-18
Ln...................................................... 3-18
OBA.................................................. 3-18
Settings in Use .................................. 4-2
SLM .................................................. 3-18
Triggers............................................. 3-18
Measurement Range ................................ 7-8
Measurement Status ................................. 3-5
Pause Icon......................................... 3-6
Reset Icon ......................................... 3-5
Run Icon............................................ 3-6
Run Next Icon................................... 3-5
Stop Icon........................................... 3-6
Store Icon.......................................... 3-6
USB Copy Indicator Icon ................. 3-6
Memory.................................................... 5-11
Memory Status ......................................... 5-11
Memory Utilization.................................. 26-1
Microphone
Guidelines ......................................... D-11
What it measures............................... D-12
Microphone Correction............................ 17-11
Microphone Extension Cable................... 7-4
Microphone Preamplifier Specifications . A-56
PRM831............................................ A-57
Microphone/Preamplifier
Connecting........................................ 2-3
Connecting Together ........................ 2-2
I831.01 Rev J Supporting Firmware Version 2.0
Disconnecting................................... 2-4
Microphones
Capacitor .......................................... D-11
Electret ............................................. D-11
Uses .................................................. D-12
Modem (GPRS) Page .............................. 19-6
Modem Page............................................ 19-3
Move Horizontally................................... 3-12
Move To USB Icon ................................. 3-6
Move Vertically....................................... 3-12
N
Near Field
Acoustic............................................ D-14
Geometric ......................................... D-14
Glossary............................................ D-14
Noise
Ambient............................................ D-14
Background ...................................... D-14
Daily personal exposure ................... D-3
Dose(D) ............................................ D-14
Exposure........................................... D-15
Glossary............................................ D-2D-14
Pink................................................... D-14
Projected noise dose ......................... D-15
Single event exposure level.............. D-16
White ................................................ D-14
Non-Acoustical Inputs
Location (GPS)................................. 18-10
Weather ............................................ 18-2
Numeric Parameters ................................ 3-27
O
Octave Band Analyzer Page.................... 4-6
Bandwidth Setting ............................ 4-7
Frequency Weighting ....................... 4-7
Range Setting ................................... 4-7
Spectral Ln Mode ............................. 4-7
Off Key.................................................... 3-8
On/Off Key.............................................. 3-7
Power Control Page.......................... 3-8
Turn On Model 831.......................... 3-7
Optional Accessories
Equivalent Electrical Impedance Adaptor1-12
Options..................................................... 1-7
Add ................................................... 27-1
OSHA
Level ................................................. D-15
Output
AC..................................................... 17-13
DC..................................................... 17-13
Overall Display
1/1 Octave Band Analyzer................ 5-16
1/3 Octave Band Analyzer................ 5-17
C-A Level/Impulsivity...................... 5-22
Community Noise............................. 5-21
Events ............................................... 5-20
Industrial Hygiene ............................ 5-23
Ln Percentiles ................................... 5-18
Maximum/Minimum/Peak Sound Levels5-15
Overall Large Digit Sound Level ..... 5-14
Overloads.......................................... 5-21
Spectral Ln........................................ 5-19
Status Page........................................ 5-23
Overall Display Page ............................... 5-12
Overload
Input.................................................. 3-3
IOBA................................................. 3-4
Overload Indication ................................. 7-8
Overload Level ........................................ 7-821-14
P
Page.......................................................... 3-2
Parameter Selection ................................. 3-24
Drop Down List ................................ 3-25
Parameters in a Row ......................... 3-24
Parameters Measured ............................... 25-1
Exceedance Counters........................ 25-6
Miscellaneous Parameters ................ 25-6
Sound Exposure ................................ 25-3
Sound Level ...................................... 25-1
Sound Level Metrics......................... 25-2
Statistical Metrics ............................. 25-4
Pause a Run.............................................. 3-12
Pause Icon ................................................ 3-6
Pausing a Measurement ........................... 7-9
Power Control Screen .............................. 3-13
Power Indicator........................................ 3-2
I831.01 Rev J Supporting Firmware Version 2.0
Power Save Icon ...................................... 3-617-8
Power Save Time..................................... 17-7
Power Supply
External ............................................ 2-724-12
Power Switch (Hardware) ....................... 2-7
Powering the Model 831 ......................... 2-4
Battery Power................................... 2-4
Power-up Operation................................. 2-8
Preamplifier
Definition ......................................... D-15
Preferences Page...................................... 17-11
Auto-Store ........................................ 17-12
Date Format...................................... 17-19
Decimal Symbol............................... 17-19
Reset Prompt .................................... 17-13
R
Refresh Files List..................................... 16-10
Reset Icon ................................................ 3-5
Reset Prompt ........................................... 17-13
Resetting a Measurement ........................ 7-13
Run Control
Measurement History Data............... 11-6
Setup................................................. 6-1
Without Measurement History ......... 6-4
Run Icon .................................................. 3-6
Run Next Icon.......................................... 3-5
Run Time ................................................. 3-35-11
Run/Pause Keys....................................... 3-12
S
Sample Rate............................................. 15-2
Screens..................................................... 3-23-133-15
Data Display..................................... 3-13
Measurement Properties................... 3-13
Power Control .................................. 3-13
Tools................................................. 3-13
Scroll Bar................................................. 3-2
Scrolling Between Sections..................... 3-17
Section Indicator...................................... 3-2
SEL Calculations ..................................... C-4
Session Log Page..................................... 5-24
Settings Screen ........................................ 3-144-1
Control Page..................................... 4-9
Day/Night Page................................. 4-13
Exiting............................................... 4-15
General Page..................................... 4-3
Ln Page ............................................. 4-8
Octave Band Analyzer Page ............. 4-6
Setup Pages....................................... 4-2
Triggers Page .................................... 4-11
Setup Key................................................. 3-8
Setup Manager ......................................... 4-16
Change to Default Setup................... 4-18
Close ................................................. 4-25
Delete Setup File............................... 4-25
Edit Settings...................................... 4-24
Load Settings .................................... 4-24
Modifying Active Setup ................... 4-21
Refresh List....................................... 4-25
Rename Setup File............................ 4-24
Save File As...................................... 4-25
Save Modified Setup......................... 4-22
User-Defined Setup Operations........ 4-24
Setup Pages .............................................. 4-2
Shutdown, Improper ................................ 7-17
Shutdown, Proper..................................... 3-7
Softkeys ................................................... 3-67-3
Sound
Average level (lavg) ......................... D-1
Day-night average level.................... D-3
Energy average(Leq) ........................ D-19
Exposure ........................................... D-16
Exposure level .................................. D-17
Fixed average.................................... D-18
Glossary ............................................ D-16
Impulse ............................................. D-19
Instantaneous .................................... D-18
Intensity ............................................ D-20
Moving average ................................ D-18
Pressure............................................. D-17
Sound pressure level(SPL,Lp) .......... D-18
Unweighted peak .............................. D-19
Weighted peak .................................. D-20
Sound Level
Threshold(Lt).................................... D-21
Sound Power Level .................................. D-20
Sound Pressure Level (see Sound)........... D-18
Sound Recording...................................... 15-1
I831.01 Rev J Supporting Firmware Version 2.0
Additional Considerations for Event Recording15-16
Automatic on Event.......................... 15-15
Automatic on Measurement History 15-19
Combined Sound Recordings........... 15-20
Data Display Playback ..................... 15-23
Initiating a Recording....................... 15-13
Manual Recording ............................ 15-7
Marker Initiated Recording .............. 15-10
Marker Recording ............................ 15-10
Playback ........................................... 15-21
Pre-trigger Time ............................... 15-1215-15
Range................................................ 15-5
Range Selection................................ 15-4
Range Selection Guide ..................... 15-5
Recording Time................................ 15-13
Recording Type Indication............... 15-21
Sample Rate...................................... 15-2
Session Log Playback....................... 15-21
Setup................................................. 15-2
Snapshot Time.................................. 15-1515-20
Types Available................................ 15-1
Sound Recording in Progress Icon .......... 12-15
Sound Speed ............................................ D-20
Speaker Output ........................................ 17-13
Specifications
Noise Levels..................................... A-44
Spectra Time History Display ................. 12-20
Spectral Ln............................................... 5-19
Stability Indicator .................................... 3-3
Starting a Measurement........................... 7-6
Start-up Period......................................... 7-2
Status Page............................................... 5-23
Stop Icon.................................................. 3-6
Stop When Stable Mode.......................... 4-11
Stop/Store Key......................................... 3-12
Store Icon................................................. 3-6
Storing a Measurement............................ 7-15
System Properaties Pages
Displays............................................ 3-21
Localization...................................... 3-21
Logic I/O .......................................... 3-21
Power................................................ 3-21
Preferences ....................................... 3-21
Time ................................................. 3-21
System Properties .................................... 3-2117-1
Auto-Off ........................................... 17-6
Backlight........................................... 17-9
Backlight Mode ................................ 3-8
Backlight Time ................................. 17-9
Battery Type ..................................... 17-5
Control Panel .................................... 17-1
Device Page ...................................... 17-2
Display Contrast ............................... 3-817-10
Display Customization...................... 17-20
External Shutoff Voltage .................. 17-10
Jack Function .................................... 17-13
Languages ......................................... 17-17
Localization Page.............................. 17-17
Mask/Unmask Option....................... 17-27
Microphone Correction..................... 17-11
Power Page ....................................... 17-5
Power Save Time.............................. 17-7
Preferences Page............................... 17-11
Takt Maximal Data ........................... 17-14
Time Page ......................................... 17-3
Units.................................................. 17-19
USB Host Port .................................. 17-14
USB Storage ..................................... 17-14
System Properties Pages .......................... 3-21
Device ............................................... 3-21
System Utilities........................................ 3-2323-1
Control Panel .................................... 23-1
File System ....................................... 23-2
Format Internal Memory................... 23-3
Format Internal Memory and Restore Defaults23-3
T
Tabs.......................................................... 3-2
Live ................................................... 7-3
Overall .............................................. 7-3
Session Log....................................... 7-3
Takt Maximal Data .................................. 17-14
Technical Specifications .......................... A-1
AC/DC Output .................................. A-14
Battery Operating Lifetime............... A-17
CE Information ................................. A-19
Declaration of Conformity................ A-19
Effect of Windscreen ........................ A-30
Electromagnetic Emission ................ A-19
I831.01 Rev J Supporting Firmware Version 2.0
Features ............................................ A-2
Frequency Response......................... A-32
Frequency Weightings...................... A-10
General Specifications...................... A-8
Memory Retention............................ A-18
Min/Max Integration Time............... A-15
Model 831 Specifications................. A-2
Noise Levels..................................... A-48
Performance Specifications.............. A-4
Physical Characteristics.................... A-5
Position of Instrument and Operator A-30
Power Consumption ......................... A-17
Power Supply ................................... A-17
PSA029 Specifications..................... A-18
Resolution Specifications................. A-9
Sound Level Meter Specifications ... A-3
Standards Met................................... A-1
Time of Day Drift............................. A-16
Threshold................................................. 8-4
Time......................................................... 5-11
Allowed Exposure time (Ti)............. D-1
Weighting ......................................... D-22
Time History............................................ 10-1
Display ............................................. 10-9
Frequency Spectra ............................ 10-12
Link to Measurement History .......... 10-17
Locate Record Number .................... 10-16
Markers............................................. 10-18
Parameters Logged........................... 10-1
Setup................................................. 10-4
Time History Parameters.................. 10-6
Time History Period ......................... 10-5
Time Setting ............................................ 17-3
Time Weighting....................................... 4-4
Timed Stop Mode .................................... 4-10
Tools Screen ............................................ 3-13
Trigger Status Icons................................. 12-14
Continuation ..................................... 12-15
Pre-Trigger ....................................... 12-14
Ready................................................ 12-14
Triggered .......................................... 12-14
Valid ................................................. 12-14
Triggers Page........................................... 4-11
Exceedance Event Data.................... 4-13
Peak Trigger Level ........................... 4-12
RMS Trigger Levels ......................... 4-12
TWA(TC)................................................. D-21
U
Under Range Indication ........................... 7-9
Under Range Levels................................. 7-821-14
Units......................................................... 17-19
Unpacking and Inspection ....................... 2-1
Up and Down Keys.................................. 3-12
Upgrade Firmware ................................... 27-1
USB Host Port ......................................... 17-14
USB Storage ............................................ 17-14
User .......................................................... 22-4
V
Vibration .................................................. D-22
View Spectrum Normalized..................... 5-28
Graph Relative .................................. 5-39
Selection Reference Spectrum.......... 5-29
Using Frequency Weighting ............. 5-325-335-385-39
Using Measured Spectrum................ 5-31
Using Previously Measured Spectrum5-36
Views
Changing........................................... 3-7
Voice Annotation ..................................... 3-22
Voice Recorder ........................................ 3-229-2
Voice Recording
Control Page ..................................... 9-1
Playback............................................ 9-4
Record............................................... 9-3
Voice Recorder ................................. 9-2
Voltage..................................................... 5-11
W
Wavelength(l)
Glossary ............................................ D-22
Wavenumber
Glossary ............................................ D-22
Weather .................................................... 18-2
Weather Inputs ......................................... 18-2
Weighting
Frequency ......................................... D-9
Time.................................................. D-22
I831.01 Rev J Supporting Firmware Version 2.0
Total Customer Satisfaction Guaranteed
3425 Walden Avenue, Depew NY USA 14043
Phone: 716-926-8243 Toll Free: 888-258-3222
LarsonDavis.com FAX: 716-926-8215
Total Customer Satisfaction Guaranteed
3425 Walden Avenue, Depew NY USA 14043
Phone: 716-926-8243 Toll Free: 888-258-3222
LarsonDavis.com FAX: 716-926-8215