1
CardioSys
Operator’s Manual
Version 4.1
227 498 02 GA(e)
Revision A
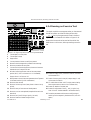
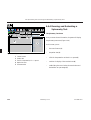
Contents
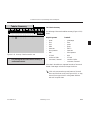
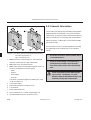
The product CardioSys bears the CE marking
-0366
indicating its compliance with the provisions of the Council
Directive 93/42/EEC about medical devices and fulfills the
essential requirements of Annex I of this directive.
The product fully complies with the electromagnetic immunity requirements of standard EN 60601-1-2 “Electromagnetic Compatibility – Medical Electrical Equipment”.
The device is in radio-interference protection class B in
accordance with EN 55011.
The EC Declaration of Conformity covers only the accessories
listed in the “Equipment” section.
This manual reflects software version 4.1.
© Marquette Hellige GmbH 1999
Postfach 600265
D-79032 Freiburg
Germany
Tel. +49 761 45 43 0
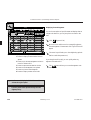
Revision History
This document is subject to the Marquette Hellige change order system. The revision code, a letter that follows the document
part number, changes with every update of the manual.
Part No./Revision Code
227 498 02-A
Date
10 Feb. 1999
Comment
Initial Release
MS-DOS and Windows are trademarks of Microsoft Corp.
2
CardioSys V 4.1
227 498 02-A
Contents
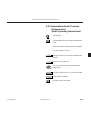
1.
Introduction
2.
General Information on System Operation
3.
Selecting and Admitting a Patient, Retrieving Stored
Examinations
4.1 The Resting ECG
4.2 The Exercise ECG
4.3 The STAT ECG
4.4 The Spirometry Test
4.5 Ambulatory Blood-Pressure Measurement
4.6 Late Potential Analysis
4.7 External Programs
5.
Deleting Examinations, Quitting the Program
6.
System Services Menu
7.
Cleaning, Disinfection and Maintenance
8.
System Messages and Troubleshooting Tips
9.
Technical Specifications
10. Equipment List, Order Information
Appendix
Index
227 498 02-A
CardioSys V 4.1
3
Contents
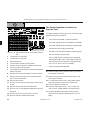
General
information
General Information
*
*
*
This manual is an integral part of the instrument and
describes its normal use. It should always be kept close to
the equipment. Observance of the manual is a prerequisite for proper instrument performance and correct
operation and ensures patient and operator safety.
*
Marquette Hellige is responsible for the effects on safety,
reliability, and performance of the equipment, only
m
–
*
Patient safety, specified measuring accuracy, and interference-free operation can be guaranteed only if original
Marquette Hellige devices are interconnected (e.g. basic
units and plug-in modules).
Only use accessories which are listed in this manual and
which have been tested in combination with the device
(e.g. patient cables, electrodes, transducers, sensors,
consumables, etc.). If you use accessories or consumables
from other manufacturers, Marquette Hellige does not
guarantee safe operation or functioning of the device.
if assembly operations, extensions, readjustments,
modifications, or repairs are carried out by
Marquette Hellige or by persons authorized by
Marquette Hellige.
Information which refers only to certain versions of the
instrument is accompanied by the catalog number(s) of
the instrument(s) concerned. The catalog number is
given on the instrument nameplate.
For detailed safety information, please refer to section
1.3 “For your safety”.
4
The warranty does not cover damages resulting from the
use of accessories and consumables from other manufacturers.
The symbol
denotes: Refer to Operator’s Manual!
It serves as an indicator for important facts to be noted
when operating the instrument.
*
*
*
–
if the instrument is used in accordance with the
instructions for use.
*
All publications are in conformity with the instrument
specifications and IEC publications on safety of electromedical equipment valid at printing date. All rights are
reserved for instruments, circuits, techniques, and names
appearing in the manual.
*
On request Marquette Hellige will provide a service
manual.
*
The Marquette Hellige quality management system
complies with the DIN EN ISO 9001 and EN 46001
Standards.
CardioSys V 4.1
227 498 02-A
Introduction to CardioSys
1. Introduction to CardioSys
In this section you will find
227 498 02-A
–
an overview of the CardioSys features and capabilities
and of the available software options
–
a survey of the CardioSys system components
–
points to note during system operation
–
instructions on putting the system into operation
CardioSys V 4.1
5
Introduction to CardioSys
1.1 Program Features
CardioSys is a PC-based system for ECG recording, spirometry tests and ambulatory blood-pressure examinations. The
following options are available to enhance the program functions:
3-Lead Exercise ECG (ERG1)
– 3-lead recording and display
– control of all Marquette Hellige ergometers
– creation of custom protocols and phases (depending on
ergometer model)
Basic Software Package (RESB)
– 12-lead ECG acquisition (resting ECG, STAT ECG)
– recording of spirometry tests
– downloading of data from TONOPORT IV/IVa (ambulatory blood pressure)
– downloading of data from electrocardiographs EK 53,
EK 56, EK 512, CardioSmart
– data management for all operating modes
– BDT interface
Upgrade for 12-Lead Exercise ECG (ERG2)
– optional recording of 3, 6 or 12 ECG leads
– 12-lead ST measurement
– automatic or manual determination of the J+X point
– presentation of the ST medians
– presentation of the resting ECG complex and of the
current ST beat for direct comparison
– arrhythmia analysis and presentation during the test
Resting ECG Measurement (RESM)
– measurement of 12 ECG leads acquired simultaneously
– tabular presentation of the measured values
– editing of measuring marks
– direct comparison of 2 resting ECGs
Storage of the Full-Disclosure ECG (EGMO)
– continuous storage of up to 12 ECG leads
– color-coded arrhythmias
– any segment of the full-disclosure ECG can be zoomed
and stored
Resting ECG Interpretation (RESI)
– interpretation of the measured resting ECG with detailed
explanations
– medication and the patient’s age are taken into account
– reanalysis after modification of the measuring marks
Exercise Test Expert Mode (ERG3)
– optional presentation of ST level and slope in the form
of a bar diagram or ST medians with reference marks
– manual editing of the E, J, and J+X points
– scrolling to previous stages during the exercise test
– direct cross-referencing from trends to full-disclosure
ECG (final report)
6
CardioSys V 4.1
227 498 02-A
Introduction to CardioSys
In-Test Reports (ESTA)
– automatic or manual printout during the exercise test via
laser printer or thermal printer
– report formats for laser printer: medians + 12-lead ECG
(approx. 4 seconds)
– report formats for thermal printer:
• 10-second segments of the 12-lead ECG in different
formats
• comparative medians + 12-lead ECG
• continuous rhythm (6 or 12 leads)
Late Potential Analysis (AVER)
– recording of ventricular late potentials
– recording of the standard vectors X, Y, Z (uncorrected)
– manual editing of QRS onset and offset
Data Storage on File Server (NETS)
– storage of the procedure data on the network file server
Monitoring of Remote Test Stations (ERGM)
– during the exercise test data are continuously sent via the
network
– the following data can be viewed at any of the workstations in the network:
• station name
• 6-lead ECG, leads selectable
• information on the exercise test and on the ergometer
• HR and blood pressure
• ST measurement results (resting beat, current beat)
227 498 02-A
Task List (OMAN)
– patient selection on task list
– task list created by host program (hospital information
system, medical reimbursement program, etc.)
– supports BDT format
– examination results are returned to the requesting system
ECG History (ECGH) requires hardlock
– display of the median beats from up to 5 selectable
resting ECGs for visual comparison or printout
– 3D presentation of the medians for serial comparison
Review Manager (REVM) requires hardlock
– users can review and confirm the examination results
– name of the physician who confirmed the results is
automatically entered in the patient file
– display of examination procedures according to different
criteria (confirmed, unconfirmed, all)
Cardio Mailbox (CBOX) requires hardlock
– transmission of multiple procedures via a modem to
CardioSys/CardioSoft
– storage of multiple procedures on storage medium
– reception of multiple procedures via a modem (from
CardioSys/CardioSoft or CardioSmart)
CardioSys V 4.1
7
Introduction to CardioSys
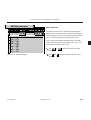
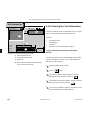
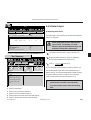
1.2 System Configuration and
Function, Setting Up the PC
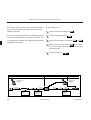
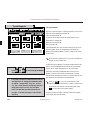
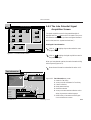
CardioSys is a system cart centering around a PC and software
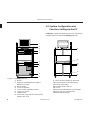
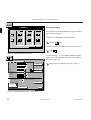
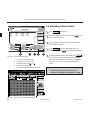
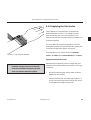
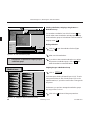
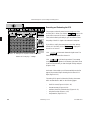
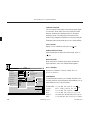
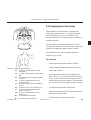
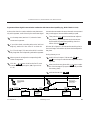
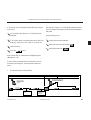
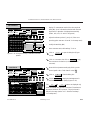
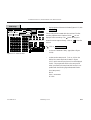
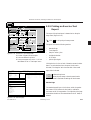
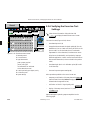
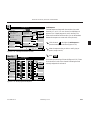
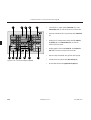
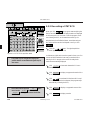
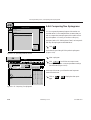
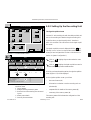
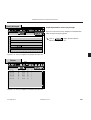
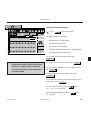
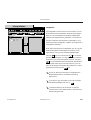
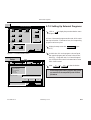
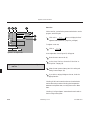
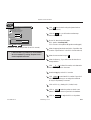
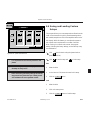
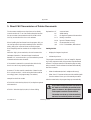
programs. Figure 1-1 shows the CardioSys system cart.
1
F1
F2
F3
F4
F5
F6
F7
F8
F9
F10
2
3
11
4
5
12
6
7
13
14
8
15
9
16
10
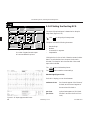
Figure 1-1. CardioSys system cart
1 Monitor
2 Supports for electrode application system or
respiration flow sensor
3 Monitor support
4 Tray for PC keyboard
5 Tray for function keyboard and mouse
6 Tray (e.g. for printer)
7 Accessory drawer
8 Power button, floppy disk drive and drive bays
(streamer, MO drive)
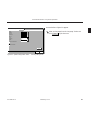
8
CardioSys V 4.1
9
10
11
12
13
14
15
16
Shelf with power connector for defibrillator
Conductive castors (front castors locking)
Monitor retaining strip
Connection panel (under lid)
Lid lock
Power switch (removes power from the system)
Power input with instrument fuses
Potential equalization pin
227 498 02-A
Introduction to CardioSys
Warning
The lid should only be opened by Marquette
Hellige staff or by factory-trained personnel.
Biocompatibility
The parts of the product described in this operator
manual, including all accessories, that come in contact
with the patient during the intended use, fulfill the
biocompatibility requirements of the applicable standards. If you have questions in this matter, please contact Marquette Hellige GmbH or its representatives.
The system comes pre-installed and is ready for operation.
All connections for system components and peripheral devices
(including the patient cable) are located under the lid (12)
which can be opened with a tool only.
The program is a Windows application. Its scope can be
expanded by activation of individual optional programs. This
manual describes the program with all options included. If
you have not purchased one or the other option, simply skip
the corresponding sections.
Being familiar with PC programs may be a help, but in this
manual you will find everything you need to know about
using a mouse and a PC keyboard.
Whenever you are unsure about a program function or operating step, just click on the Help button to obtain online
information.
Access to the program is restricted to registered users. At the
time a user is registered, the password and the user’s rights are
assigned (user, physician, with or without the right to make
system changes).
227 498 02-A
CardioSys V 4.1
9
Introduction to CardioSys
1.3 For Your Safety
The safety information given below is divided into the categories “Danger”, “Warning” and “Caution”.
Danger
Warning
indicates an imminently hazardous situation
which, if not avoided, will result in death or
serious injury.
☞
CardioSys is a class I system.
Caution
indicates a potentially hazardous situation
which, if not avoided, could result in death or
serious injury.
Warning
Caution
☞
indicates a potentially hazardous situation
which, if not avoided, may result in minor or
moderate injury and/or damage to the equipment.
Danger
provides application tips or other useful information to assure that you get the most from your
equipment.
Danger
10
CardioSys V 4.1
Before connecting the device to the power line,
check that the voltage and frequency ratings of
the power line are the same as those indicated
on the system’s nameplate. If this is not the
case, do not connect the system to the power
line.
Do not use extension cables with multiple
power outlets to connect the system to the
power line.
Before putting the system into operation visually inspect all connecting cables for signs of
damage. Damaged cables and connectors must
be replaced immediately.
When disconnecting the system from the power
line, remove the plug from the wall outlet first.
Then you may disconnect the power cord from
the device. If you do not observe this sequence,
there is a risk of coming into contact with line
voltage by inserting metal objects, such as the
pins of electrode leads, into the sockets of the
power cord by mistake.
227 498 02-A
Introduction to CardioSys
Caution
Warning
Warning
CardioSys can be operated on an uninterruptible power supply (UPS). The UPS should
not be disconnected from the power line for
prolonged periods of time to prevent deep
discharging of the battery. For this reason,
switch the CardioSys system off and on with the
system’s own power switch and do not use the
switch of the UPS or the main power switch of
the office.
As a general rule, the UPS must first be connected to the power line and switched on; then
you may switch on CardioSys.
Do not switch on the CardioSys system during
a power outage.
Only the CardioSys system may be connected to
the UPS.
The UPS must be installed within the medically used room, but outside the patient environment.
Observe the information given in the UPS user
manual.
The power socket of the CardioSys system cart
is reserved for a defibrillator for recharging of
the defibrillator battery (max. power 30 VA).
Caution
☞
The system should be set up to provide the operator an unobstructed view of the control panel.
Danger
Devices intended for emergency application
must not be stored or transported at temperatures which cause moisture condensation at the
application site. Wait until all moisture condensation has evaporated before using the
device.
Warning
If the system is used as an emergency device, a
second ECG recorder must be available.
Warning
The device is not intended for intracardiac
application.
Warning
All devices of a system must be connected to the
same power supply circuit. Devices which are
not connected to the same circuit must be
electrically isolated when operated (electrically
isolated RS232 interface).
227 498 02-A
Set up the device in a location which affords
sufficient ventilation. The ventilation openings
of the device must not be obstructed. The
ambient conditions specified in the “Technical
Specifications” section must be ensured at all
times.
CardioSys V 4.1
The device is not suitable for operation in areas
where an explosion hazard may occur. Explosion hazards may be caused by the use of flammable anesthetics, skin-cleansing agents and
disinfectants. Great care must be exercised
when the monitor is used in an oxygen-enriched
atmosphere. The atmosphere is considered to be
oxygen-enriched when the room air contains
more than 25% of oxygen or nitrous oxide.
11
Introduction to CardioSys
Warning
Warning
Warning
Warning
12
The patient signal input is labelled with the
symbol, indicating that it is protected
against damage resulting from defibrillation
and electrocautery. Nevertheless extreme care
must be taken when devices which are directly
connected to the patient remain applied during
defibrillation. The distance between ECG electrodes and defibrillation paddles should be at
least 6 in./15 cm. If in doubt, disconnect the
patient cable from the device while applying the
defibrillation pulse.
Magnetic and electrical fields are capable of
interfering with the proper performance of the
device. For this reason do not operate the
system in the vicinity of equipment emitting
strong electromagnetic radiation (X-ray equipment, diathermy systems or MRI devices).
Warning
Danger
Warning
Only use the original Marquette Hellige patient cable. Do not connect other signal sources
to the cable.
If the system cart is installed in the patient environment, only the special printer modified by
Marquette Hellige and equipped with an additional protective earth connection (potential
equalization) may be operated. Observe the assembly instructions supplied with the printers.
For stress-test examinations, a defibrillator
and a pacemaker, regularly checked for proper
functioning, must be readily accessible.
Extreme care must be exercised when using
medical electrical equipment. Many parts of
the man/machine circuit are conductive, such
as the patient, connectors, electrodes, transducers. It is very important that these conductive parts do not come into contact with other
grounded, conductive parts when connected to
the isolated patient input of the device. Such
contact would bridge the patient’s isolation
and cancel the protection provided by the
isolated input. In particular, there must be no
contact of the neutral electrode and ground.
With all peripheral devices connected,
CardioSys represents a medical system. It
fulfills the requirements of the system standard
IEC 60601-1-1. The entire system may be
operated in the patient environment.
CardioSys V 4.1
227 498 02-A
Introduction to CardioSys
Warning
Danger
Danger
Devices may only be interconnected with each
other or to parts of systems when it has been
made certain that there is no danger to the
patient, the operators, or the environment as a
result. In those instances where there is any
element of doubt concerning the safety of
connected devices, the user must contact the
manufacturers concerned or other informed
experts as to whether there is any possible
danger to the patient, the operator, or the
environment as a result of the proposed combination of devices. Standards IEC 60601-1-1/
EN 60601-1-1 must be complied with in all
cases.
Liquids must not be allowed to enter the devices. Devices into which liquids have penetrated must be checked by a service technician
before being used again.
Chemicals required for the application or
maintenance of the devices must under all
circumstances be stored, prepared and kept at
hand in the containers provided by the manufacturer. Failure to observe this instruction
may result in severe consequences for the patient.
☞
Medical technical equipment such as the
CardioSys system must only be used by persons
who have sufficient knowledge, who have received
adequate training in the use of such equipment
and who are capable of applying it properly.
Warning
Caution
The operator must be familiar with the operation of the system.
Caution
Verify the performance of the system once a
month.
Warning
Caution
Warning
Warning
CardioSys is not intended for use as a vital
signs physiological monitor.
227 498 02-A
Before using the system, the operator is obliged
to verify that it is in correct working order and
operating condition.
CardioSys V 4.1
Dispose of the packaging material, observing
the applicable waste control regulations and
keeping it out of children’s reach.
At the end of its service life, CardioSys and its
accessories must be disposed of in compliance
with the applicable waste control regulations.
If you have any questions in this matter, please
contact Marquette Hellige GmbH.
Only use bicycle ergometers and treadmills that
fulfill the applicable IEC 60601-1 requirements. CardioSys and the associated bicycle
ergometer or treadmill must be connected to
the same power supply circuit via separate wall
outlets.
13
Introduction to CardioSys
Warning
Only modems complying with the requirements
of IEC 60950 or UL1950 may be connected to
the system. Furthermore, the regulations applicable in the respective countries must be observed.
The modem must be set up inside the medically
used room, but outside the patient environment.
Literature
Medical Device Directive
EN60601-1/1990 + A1:1993 + A2:1995: Medical electrical
equipment. General safety standards
EN60601-1-1/9.1994 and A1 12.95: General safety standards. Standards for the safety of medical electrical systems.
IEC Publication 513/1994: Fundamental aspects of safety
standards for medical equipment.
ROY, O.Z.: Summary of cardiac fibrillation thresholds for
60-Hz currents and voltages applied directly to the heart.
Med. & Biol. Engn. & Computing 18: 657...659 (1980).
14
CardioSys V 4.1
227 498 02-A
Introduction to CardioSys
1.4 Putting the System Into Operation, Testing the Performance
*
Before using the system for the first time, please read the
information given in section 1.3 “For your Safety”.
*
Turn on power with the main power switch (14).
*
Switch on the system with the power button on the front
panel (press for approx. 1 second).
Upon power up the PC runs automatic self tests. When the
program detects any malfunctions, an error message is displayed. If no problem exists, you will see the usual Windows
screen.
–
Do not run more than one other Windows application
at the same time as CardioSys.
–
Do not activate a Windows screen saver.
–
Run a daily backup of your data (Appendix, sections 3.1).
–
Quit the program in the prescribed manner (Chapter 5.
“Deleting Examinations, Quitting the Program”) before
switching off the system with the power button (8).
Turn off power with the main power switch (14) only
when the CardioSys cart will not be used for a prolonged
period of time
The ECG program too runs a self test when a signal acquisition screen is called up. If you do not see any error messages,
the program and the computer are intact. Error messages may
also appear during program operation.
227 498 02-A
CardioSys V 4.1
15
Introduction to CardioSys
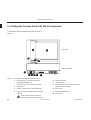
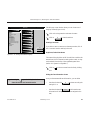
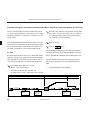
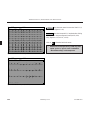
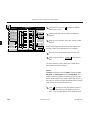
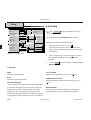
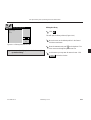
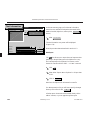
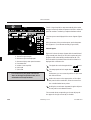
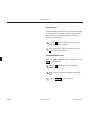
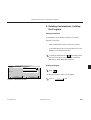
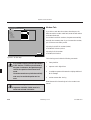
1.5 Putting the Thermal Printer AR 200 Into Operation
Controls and indicators of the thermal printer are shown in
Figure 1-2.
2
4
Top View
1
3
Rear Panel View
5
6
7 8 9
10
Figure 1-2. Controls and indicators of the thermal printer
1 Green indicator, is lit when the printer is
connected to the power line
Yellow indicator, is lit to indicate a problem
2 Paper guide
3 Paper tray door latch (lift latch to open door)
4 Paper tray door (the printer stops when the door
is opened)
Caution
16
5
6
7
Specification labels
Instrument fuses
Power button (printer is turned on with the
system’s main power switch)
8 Power input
9 Potential equalization pin
10 Parallel port
When the door is open, take care to
insure no small objects enter the printer.
CardioSys V 4.1
227 498 02-A
Introduction to CardioSys
Explanation of Symbols as Used on the Printer
printer problem
interface
fuse
T3, 15A/250V
Chart-Paper Loading
Caution
*
Before loading chart paper, make sure that the
printer is switched off (button 7, Figure 1-2).
The indicators will go off after a few seconds.
*
Pull the first sheet of the pad straight out over the paper
guide, at the same time closing the paper tray door.
*
Turn on the printer.
Pulling upward on the paper tray door latch (3, Figure
1-2), open the paper tray door.
Caution
*
Remove the cardboard backing of the old pad.
*
When inserting the new pad, be aware of the following
points:
–
the last sheets of the paper pad have a red stripe, so
this side of the pad should be at the bottom of the
tray
Caution
–
the black squares should be facing down and located on the side of the printer nearest the paper
tray door latch
–
place the pad, including the cardboard backing, on
the tray and remove the cardboard on the top.
227 498 02-A
CardioSys V 4.1
Do not attempt to operate the printer without
thermal paper.
Do not pull on the sheets to remove them from
the printer.
After loading a new pad, press keys Ctrl +
+ )9 ] to ensure that the next printout
starts at the top of the page.
The thermal printer AR 200 does not require
an additional protective earth connection
(device in compliance with IEC 60601).
17
Introduction to CardioSys
Printer Problems (Thermal Printer)
Problem
Reinstalling the Thermal Printer Driver
Usually the printer driver is installed. If it needs to be reinstalled, proceed as follows:
Remedy
Does not print and green
Check that power cable is
LED labeled Power does not properly connected.
light
Check that power switch is
on.
Does not print and green
LED labeled Power is lit
Check if the printer is out
of paper.
Check if there are any paper
scraps caught under the
print head.
18
Exit the application to Windows.
*
From the Program Manager screen, call up
Check if the CardioSys
system power is on.
Check cables between
CardioSys system and
printer. (May need to reboot the system.)
Paper moves paper but
recorder does not print
*
–
–
–
*
Select “Add Printer”.
*
Select “Install unlisted or updated driver”.
*
Select “Install...”.
*
Place the disk with the printer driver into the diskette
drive and click on “OK”.
*
Check the “Default printer” box.
*
Select “Close”.
*
Restart the application.
Paper is incorrectly loaded.
Check that paper has
correct pagination mark.
Main Group
Control Panel
Printers.
CardioSys V 4.1
227 498 02-A
General Information on System Operation
2. General Information on System
Operation
This section describes some basic facts on program operation. You will learn
227 498 02-A
–
how to use the program with a mouse
–
how to enter data via the PC keyboard
–
how to start the program
–
how to select the language
CardioSys V 4.1
19
General Information on System Operation
2.1 Operating the Program with a
Mouse
All operating steps required to run the program can be performed with a mouse. The screen layout permits swift program operation, and text entries via the keyboard have been
reduced to a minimum. The system allows you to create
libraries for various situations, which you can copy from the
list to the respective text boxes in a dialog window, using the
mouse.
If you are already familiar with the functions and handling of
a PC mouse, you can skip this paragraph.
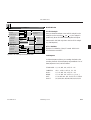
Some General Remarks on the PC Mouse
☞ When entering text via the keyboard, use the
key to move from text box to text box. This
will save time as your hands can stay on the
keyboard all the time.
An arrow or mouse pointer appears on all screens. This
mouse pointer moves around on the screen as you move the
mouse on the table. Sliding the mouse to the right, for instance, shifts the pointer to the right.
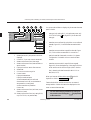
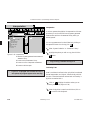
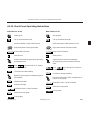
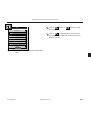
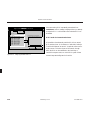
The program can be used with a two or a three-button mouse
(Figure 2-1). The buttons are operated with the index finger
and the middle finger. The left button (index finger) controls
almost all functions, while the right button (middle finger) is
seldom used.
Figure 2-1. Mouse buttons
20
CardioSys V 4.1
227 498 02-A
General Information on System Operation
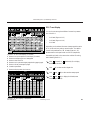
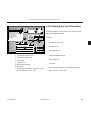
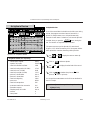
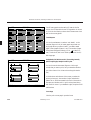
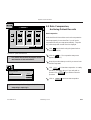
The icons displayed on the monitor screen resemble the
operating controls on a conventional ECG recorder
(Figure 2-2).
Hellige
Patient
Procedure
System Services Help
Baker, Dave, 41yrs
REST ECG/ Signal Acquisition
Test Information
X 35 HZ
Setup
Freeze ECG
X 50 HZ
Options
10 mm/mV
HR (BPM)
»
85
25 mm/s
SYS/DIA (mmHg)
To select a function you place the mouse pointer on the
respective icon and press the left mouse button. You will see
that the key on the screen is “pressed” at the same time.
V1
V2
1 2
3
V3
aVR
V4
aVL
V5
aVF
V6
4 5 6
R
L
N
F
Lead Sequence
STANDARD
Spline
Pressing a mouse button is also called “clicking”. When, later
on in this manual, you are asked to “double-click” this means
that you should press the left mouse button twice in rapid
succession.
ON
Figure 2-2. Screen with operating controls
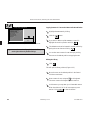
On many screens you will see windows offering various
selections (Figure 2-3).
To select an option, move the mouse pointer to the item and
press the left mouse button. This selects the item, and the
window disappears.
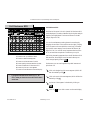
Select Procedure
Patient
Baker, Dave, 41yrs
Procedure
all
Status
all
Location
-
Date (from - to)
Show new procedure list
12/04/1996
12/04/1996
12/04/1996
12/04/1996
11/20/1996
03:38:17pm
03:29:24pm
03:10:13pm
03:00:11pm
10:53:39am
Display
0
x0
0
*0
0
Exercise
Exercise
Exercise
Exercise
Exercise
Test
Test
Test
Test
Test
Confirm
1
Send
Combined Report…
3
4
Delete
Cancel
2
Help
Figure 2-3. Excerpt from the procedure list
1 moves the list down (line by line)
2 moves the list up (line by line)
3 allows you to scroll to a general location in the list
4 clears the window without saving entries
227 498 02-A
When a list of selections is too long to fit in the window, the
window has a scroll bar at its right edge. Clicking the arrow at
the upper end of the scroll bar moves the list down one by
one (1, Figure 2-3), clicking the lower arrow moves the list up
(2, Figure 2-3).
A so-called scroll box between the two arrows allows you to
move quickly through the list by clicking the scroll box,
holding the mouse button depressed, and dragging the box up
or down (3, Figure 2-3).
CardioSys V 4.1
21
General Information on System Operation
The scroll box also indicates which section of the list is currently displayed. If the box is just below the upper arrow you
see the top portion of the list, if the box is in the middle of
the scroll bar, the middle portion of the list is on display, etc.
When you see an horizontal scroll bar below a picture, the
two arrows and the scroll box allow you to shift the picture
left or right.
Select Procedure
Baker, Dave, 41yrs
Patient
Procedure
all
Status
all
Location
-
Date (from - to)
Show new procedure list
12/04/1996
12/04/1996
12/04/1996
12/04/1996
11/20/1996
03:38:17pm
03:29:24pm
03:10:13pm
03:00:11pm
10:53:39am
Display
0
x0
0
*0
0
Exercise
Exercise
Exercise
Exercise
Exercise
Test
Test
Test
Test
Test
Confirm
1
Send
Combined Report…
3
4
Delete
Cancel
2
Help
Figure 2-3. Excerpt from the procedure list
1 moves the list down (line by line)
2 moves the list up (line by line)
3 allows you to scroll to a general location in the list
4 clears the window without saving entries
☞ You clear the HELP window by clicking “File”
and “Exit”.
22
Some screens which offer various selections can be cleared by
Cancel
OK
two methods: either with
or with
(Figure 2-3).
When you select
tions made, with
OK
Cancel
the program accepts the selec, the selections will be ignored.
If you wish to highlight text click the first letter of the text
block, hold the left mouse button down and drag the pointer
to the last letter. Then release the mouse button. The marked
text is displayed in reverse video.
To obtain information on program operation, click the
Help
button or
.
CardioSys V 4.1
227 498 02-A
General Information on System Operation
2.2 The Most Important Keyboard
Controls
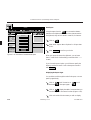
Use the keyboard to enter text and numbers. The following is
a description of functions which you do not know from a
conventional typewriter. If you are already familiar with a PC
keyboard, you may skip this section.
*
or to delete text (Del key) (3, Figure 2-4).
*
The Home and End keys (2, Figure 2-4) move the
cursor to the first and last position in the text.
*
The Backspace key (1, Figure 2-4) clears the characters
from left to right, one by one.
*
With Return (4) and on Windows screens with TAB (6)
you move the cursor to the beginning of a new, blank
line.
*
The cursor keys (5, Figure 2-4) are used to move the
cursor up, down, right and left to any desired position in
the text, for instance, to insert text (Ins key)
2
1
Esc
¬
`
F1
F2
F3
F4
"
2
£
$
%
3
4
5
!
1
Q
Caps Lock
W
A
|
\
E
S
Z
R
D
X
F8
F9
F10
*
(
)
_
+
7
8
9
0
-
=
U
H
B
F7
&
Y
G
V
F6
^
6
T
F
C
F5
I
J
N
O
K
M
P
L
@
'
<
>
?
,
.
/
F12
}
]
{
[
:
;
F11
Num
Lock
Print
Scroll
Lock
Pause
Insert
Home
Page
Up
Num
Lock
Delete
End
Page
Down
Home
~
#
7
Scroll
Lock
Caps
Lock
÷
8
x
9
_
+
PgUp
4
5
6
1
2
3
PgDn
Enter
Ctrl
Alt
6
Alt Gr
O
Ctrl
4
Ins
3
5
,
Del
3
Figure 2-4. The keyboard
227 498 02-A
CardioSys V 4.1
23
General Information on System Operation
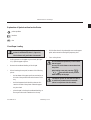
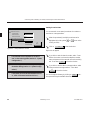
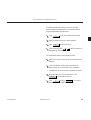
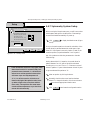
Start program
2.3 Starting the Program,
Explanation of the Function
Keys and Selecting the
Language
marquette HELLIGE CardioSoft (Supervisor)
120/80
Starting the Program
marquette HELLIGE CardioSoft
4.1e
*
Turn on the system and start the program by doubleclicking on
. The title screen (Figure 2-5) appears.
When the password function is enabled in the System
Configuration (tab “General”), you will see the user
registration window.
Figure 2-5. Title screen
☞
When the password function is enabled (section
6.1 “System Configuration –> General”) enter the
user name and password first.
☞
The program may be configured to default to an
operating mode, such as resting ECG. In this case
you will see the patient selection screen instead of
the title screen. Chapter 3 “Selecting and Admitting a Patient” explains how to retrieve a patient
from the database.
24
Enter the name and password and click on the
button.
CardioSys V 4.1
Start program
227 498 02-A
General Information on System Operation
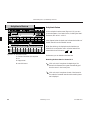
Explanation of the Function Keys
The function keys are used to call up the different program
functions:
120/80
Opens a window for patient selection or for
admission of a new patient (section 3.1, 3.2)
Calls up further examination procedures
Recording of a resting ECG (section 4.1)
Opens a window for selection of stored procedures
Recording of an exercise ECG (section 4.2)
Opens the printer menu and allows you to print
the displayed procedure
Recording of a STAT ECG (section 4.3)
Allows you to compare the current procedure with
another one
Initiates a pulmonary function test (section 4.4)
Allows you to delete the displayed procedure
Initiates the ambulatory BP program for programming of the BP monitor and data evaluation
(section 4.5)
Calls up system services (chapter 6)
Initiates the late potential analysis program (section 4.6)
Calls up the online help function
Allows you to quit the program
Initiates a bronchodilation test (section 4.7)
…
227 498 02-A
CardioSys V 4.1
25
General Information on System Operation
Hellige
Patient
Procedure
(Unbenannt)
System Services
SystemPPG
Services
HelligeMenu
Procedure
Selecting the Language
Help
Archiving
Setup
The program offers different languages for the user interfaces
and for the printed reports.
System
Configuration
Compression
Copy Patient
Records
Load
To select one of the languages, proceed as follows:
HELLIGE CARDIOSOFT
from ECG
System/ECG
Recorder
Voice
Recorder
T1.0a
Archive Patient
Save
Records
Click the
Cancel
Help
button.
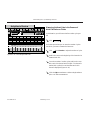
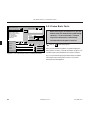
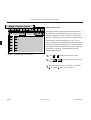
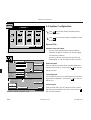
The window showing the system services opens (Figure 2-6).
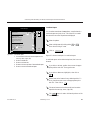
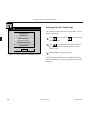
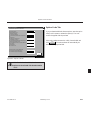
Select
.
Figure 2-6. System services selection window
You will see Figure 2-7. (This paragraph describes language
selection only. Other settings to be made in this window are
discussed in section 6.1)
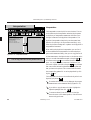
System Configuration
General Modem MUSE Option Code Country Settings
Institution Name and Address
Name
Select the “Country Settings” tab (arrow, Figure 2-7).
Database…
Street
City
Remote Cart Name
Physician
ID
Technician
ID
User List…
Default Procedure
Modify password…
black-yellow (antial.)
Windows control menu
(Restart program for changes to become
effective)
Screen Diagonal
15 in
Menu labels
Remote Test Screen
NETBIOS-Protocol
Trace Background
Test Patient (temporary)
Enable Password Function
Anti-Aliasing of ECG Waveforms
Patient Selection prior to STAT ECG
Enable Test Information Window
Icon Bar…
System Configuration
Save
Load
Print
For Service only
Help
OK
Cancel
Figure 2-7. System configuration menu – “General” tab
26
CardioSys V 4.1
227 498 02-A
General Information on System Operation
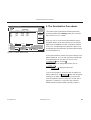
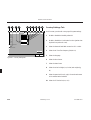
A screen similar to Figure 2-8 appears.
System Configuration
General Modem MUSE Option Code Country Settings
Language
English
Time Format
24-Hour Format
Date Format
DD.MM.YYYY
Unit of Measure
cm, kg
Speed Unit
km/h
ST Level
mV
Line Frequency
50 Hz
Lead Label
IEC
Select your language from the “Language” list box and
OK
click
to quit the menu.
Enable Swedish Patient ID
Enable Card Reader
Help
OK
Cancel
Figure 2-8. System configuration menu – “Country Settings” tab
227 498 02-A
CardioSys V 4.1
27
General Information on System Operation
For your notes
28
CardioSys V 4.1
227 498 02-A
Selecting and Admitting a Patient, Retrieving Stored Examinations
3. Selecting and Admitting a Patient,
Retrieving Stored Examinations
In this section you will find information on
227 498 02-A
–
how to select a patient from the database
–
how to admit a new patient to the system
–
how to retrieve examinations stored for a specific
patient
CardioSys V 4.1
29
Selecting and Admitting a Patient, Retrieving Stored Examinations
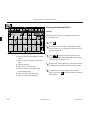
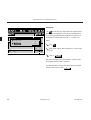
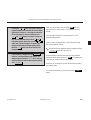
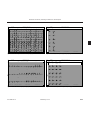
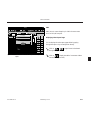
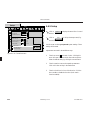
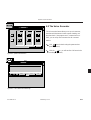
1
2
3
3.1 Retrieving a Patient From the
Database
4
Select patient (local database)
Search for …
Last Name
Patient ID
Last Name
First Name
Date of Birth
Patient ID
Master
Miller
Richards
Roberts
Shields
Stevenson
Thompson
next page…
Jim
Jane
Chantal
Jennifer
Stuart
Robert
Anthony
10/05/1949
06/04/1943
03/12/1977
07/27/1977
11/11/1912
11/22/1966
09/19/1932
8738999
654987
7766699
543876
765321
333999
665544
5
6
7
8
9
10
Select
New Patient
Delete
Unnamed
Help
Cancel
Close
New Patient…
Last Name
Master
First Name
Jim
Patient ID
8738999
Date of Birth
10/05/1949
Gender
Male
Height
176
in
Weight
66/0
lb
Race
MM/DD/YYYY
Pacemaker
An examination procedure can be assigned to a patient only
when this patient has been retrieved from the database or
when the patient is admitted to the system first. Similarly, you
have to select a patient from the database before recalling one
of the procedures stored for this patient (“Unnamed” allows
you to run a procedure without assigning it to a patient).
Click on
to display the patient selection screen.
Accept
Local Database (Figure 3-1)
13
12
11
Figure 3-1. Patient selection screen
1 Displays more patients
2 Bar cursor, highlighting selected patient
3 Text box for patient’s last name
4 Click to select highlighted patient and go to the
title screen
5 Click to enter new patient data
6 Clears the patient data
7 “Unnamed” button (the test will not be assigned
to a patient)
8 Click to display the online help screen
9 Clears the menu (entries are not saved)
10 Displays the title screen
11 Click to save the data to the database
12 Pacemaker patient: yes X , no
13 Patient data window
Type the last name or ID number of the patient whose
record you wish to retrieve (it is sufficient to enter the
first letters or numbers).
Click at (1) to display a new page of patient records.
Check the patient data. If it needs to be changed:
– type over the old text, and
Accept
– click
.
To select the highlighted patient record
– click
, or
– press
.
Select
As an alternative, you can select a patient record by
double-clicking on the name.
☞ Depending on the system configuration you will
be working with the local database or with the
database of the MUSE CV system.
30
CardioSys V 4.1
227 498 02-A
Selecting and Admitting a Patient, Retrieving Stored Examinations
If you are working with the keyboard only;
– enter the patient name,
– press the
key twice, and
– confirm the selection with .
Selecting a Patient from the MUSE CV System Database
☞
Refer to chapter 6 for instructions on configuring
the system for communication with the MUSE CV
system database.
In a network environment, do not access the same
patient file from more than one workstation.
Use only standard ASCII letters (A through Z)
and numbers (0 through 9) when entering information for the MUSE CV system.
When working with the MUSE CV system database, remember the following limitations:
it is not possible to search the database for a patient by
the patient ID number
patients can be admitted or deleted at the MUSE CV
system database only
patient data can be edited at the MUSE CV system
database only
Entering Patient ID with the Bar Code Wand
☞
Do not activate the Shift Lock key on the keyboard when using the bar code wand.
Click on the “Patient ID” text box.
Place the wand on the recording, at least 10 bars’
breadths to the left of the bar code.
Tilting the wand moderately, drag it across the bar code
at an even pace. If necessary, use a ruler as an aid.
227 498 02-A
CardioSys V 4.1
31
Selecting and Admitting a Patient, Retrieving Stored Examinations
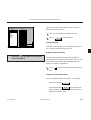
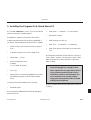
3.2 Admitting a New Patient
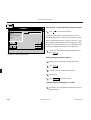
Select patient (local database)
Search for …
Last Name
Patient ID
Last Name
First Name
Date of Birth
Patient ID
Master
Miller
Richards
Roberts
Shields
Stevenson
Thompson
next page…
Jim
Jane
Chantal
Jennifer
Stuart
Robert
Anthony
10/05/1949
06/04/1943
03/12/1977
07/27/1977
11/11/1912
11/22/1966
09/19/1932
8738999
654987
7766699
543876
765321
333999
665544
Click
Select
New Patient
New Patient
(1, Figure 3-2).
Enter the patient’s last name, and press the
move to the next box, etc.
Delete
Unnamed
key to
Card Reader…
Cancel
Use the spacebar to apply or remove the checkmark in
the Pacemaker checkbox.
Close
New Patient…
Last Name
Master
First Name
Jim
Patient ID
8738999
Date of Birth
10/05/1949
Gender
Male
Height
176
in
Weight
66/0
lb
Race
2
MM/DD/YYYY
3
Accept
Click
to save the new patient file to the
database (or press the
key and then the spacebar).
Accept
Pacemaker
1
4
5
Figure 3-2. Patient data entry screen
1 Click to enter new patient data
2 Text box for patient’s last name
3 Pacemaker patient: yes X , no
4 Confirms the entered data
5 Click to enter patient data via card reader
To admit a patient with the card reader click Card Reader…
and follow the displayed instructions (the card reader
function must be enabled in the System Configuration
menu, but this function is not supported by all keyboards).
☞
Hellige
Patient
Procedure
System Services Help
Baker, Dave, 41 yrs
REST ECG/ Signal Acquisition
Test Information
Setup
The first letters of the first and last names are
automatically capitalized. Enter only ASCII
characters and numbers for the MUSE CV system.
X 40 HZ
X 50 HZ
Freeze ECG
10 mm/mV
Options
HR (bpm)
»
85
25 mm/s
SYS/DIA (mmHg)
V1
V2
1 2
3
V3
aVR
V4
aVL
V5
4 5 6
R
L
N
F
Lead Sequence
STANDARD
aVF
V6
Spline
ON
Figure 3-3. Headline with the selected patient’s name
32
CardioSys V 4.1
227 498 02-A
Selecting and Admitting a Patient, Retrieving Stored Examinations
1
2
4
6
3
5
8
7
10
9
Tests stored in the database can be retrieved
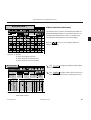
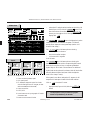
Select Test
Patient
Baker, Dave, 41 yrs
Test
DD.MM.YYYY Status
Date (from - to)
all
all
Location
Show new list
04.12.1998
04.12.1998
3.3 Editing Stored Tests
15:14:53
11:40:43
0
0
Right-Heart Catherization
STAT ECG
View
Combined Report …
Confirm
Transfer to MUSE
–
–
–
–
–
to be reviewed
to be assessed
to be transmitted
for creation of a combined report
to be deleted.
Send
Delete
Cancel
Selecting a Test
Help
Figure 3-4. Window for selection of stored tests
1 Selected patient (only this patient’s records are
displayed)
2 Choose “all” if you want to see all stored tests
3 Selection of the search filter (date range)
4 Selection of the search filter (tests recorded at a
special location)
5 Displays list when all search filters were set
6 Selected test
7 Click arrow to scroll through list
8 Control buttons
Displays the selected test
Displays a combined report
Allows the selected test to be confirmed
Saves the test for MUSE (to the database or
storage medium, as configured)
Allows transmission of procedures
Clears a test
9 Selection of the search filter (confirmed, unconfirmed or all tests)
10 Selection of the search filter (only resting ECGs,
only STAT ECGs, only exercise tests)
227 498 02-A
Before you are able to edit test data, you will have to select a
test from the database. You can either display a list of all
stored tests or of the tests stored for a specific patient.
Select the patient.
Click on
.
A list appears showing all the examination procedures stored
for the selected patient (Figure 3-4). If you wish to see all
stored procedures,
Click on
CardioSys V 4.1
(2, Figure 3-4) and select “all”.
33
Selecting and Admitting a Patient, Retrieving Stored Examinations
1
2
4
6
3
5
8
7
10
9
You can set various filters to display only those tests that meet
specific criteria:
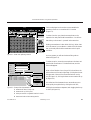
Select Test
Patient
Baker, Dave, 41 yrs
Test
DD.MM.YYYY Status
Date (from - to)
all
–
test type (only resting ECG, only spirometry tests, only
STAT ECGs (click (10, Figure 3-5), then select the
test type)
–
tests that were confirmed by a physician or unconfirmed
tests (9, Figure 3-5). Confirmed tests are marked with
an x.
–
tests that were recorded at a special location (4, Figure
3-5). This could be an external ECG recorder or a
particular test lab. Please refer to section 6.1 “System
Configuration” for details on how to set the location
number.
–
tests that were recorded in a specific time range (3,
Figure 3-5). Enter the beginning of the range in the box
at left and the end in the box at right (click in the box
first), observing the date format (DD.MM.YYYY or
MM/DD/YYYY).
all
Location
Show new list
04.12.1998
04.12.1998
15:14:53
11:40:43
0
0
Right-Heart Catherization
STAT ECG
View
Combined Report …
Confirm
Transfer to MUSE
Send
Delete
Cancel
Help
Figure 3-5. Window for selection of stored tests
1 Selected patient (only this patient’s records are
displayed)
2 Choose “all” if you want to see all stored tests
3 Selection of the search filter (date range)
4 Selection of the search filter (tests recorded at a
special location)
5 Displays list when all search filters were set
6 Selected test
7 Click arrow to scroll through list
8 Control buttons
Displays the selected test
Displays a combined report
Allows the selected test to be confirmed
Saves the test for MUSE (to the database or
storage medium, as configured)
Allows transmission of procedures
Clears a test
9 Selection of the search filter (confirmed, unconfirmed or all tests)
10 Selection of the search filter (only resting ECGs,
only STAT ECGs, only exercise tests)
34
When you have set all filters, either press
on the PC
Show new list
keyboard or click the
button.
Tests marked with an asterisks are stored on an external
storage medium. Follow the instructions displayed on the
screen to restore these test data.
☞
CardioSys V 4.1
You can select multiple procedures by clicking on
the procedure and holding the
key depressed
at the same time.
Ctrl
227 498 02-A
Selecting and Admitting a Patient, Retrieving Stored Examinations
Displaying Tests
☞
☞
☞
Select a test and clear the window with
Double-clicking on a test is a quick method to
select it from the database.
When working in a network environment, it is not
possible to display the same test at more than one
workstation at a time.
If multiple tests are highlighted when you first
display the test records list, these are records that
were sent from an ECG recorder and they may not
be assigned to the correct patient, or a record was
repeatedly sent and assigned to different patients.
View
.
The test report will be displayed. For details on the individual
report documents, please refer to section 4.1.4.
Confirming Tests
A test is considered confirmed, when a physician has reviewed
the test evaluation and “signed” it electronically with his/her
name. It is possible to confirm tests more than once.
Select a test and clear the window with
Confirm
.
The screen automatically displays the report page with the
interpretation statements. Please refer to section 4.1.4 for
details on how to evaluate a test.
227 498 02-A
CardioSys V 4.1
35
Selecting and Admitting a Patient, Retrieving Stored Examinations
Sending Procedure Data
Send procedures
Number of selected procedures: 2
You can transmit one or several procedures via a modem or
save them to a storage medium.
Transmission via modem
Telephone Number
External User Name
External User Password
Select the procedure(s) (multiple procedures can be
highlighted by holding either
or
down when
clicking on them).
Save procedure to storage medium
Ctrl
Medium Directory
a:\
Modify…
OK
Cancel
Click on
Send
to clear the window.
Figure 3-6. “Send procedures” window
Figure 3-6 will appear.
☞
The addressee must be registered as “External
user” at the receiving system (section 6.1 “System
Configuration”).
☞
When sending data via the modem, please verify
the modem settings (section 6.1 “System Configuration”).
☞
If the system cannot access the selected disk drive
a:\, data will be saved to the hard drive c:\.
36
If you wish to send the data via modem, select “Transmission via modem” and enter the telephone number,
name and password of the external user at the receiving
OK
end. Then select
to clear the window.
If you wish to save the data to a storage medium, select
“Save procedure to storage medium”. Then select
OK
to clear the window.
You can change the directory by clicking on
dow opens showing the available directories.
CardioSys V 4.1
Modify…
: a win-
227 498 02-A
Selecting and Admitting a Patient, Retrieving Stored Examinations
Combined Report
Hellige
Patient
Untersuchung
Hilfsfunktionen
Combined Report Hilfe
Combined Report
Baker
19.12.1995, 15:40:06, Before Bronchodilation
No Respiratory Problem
15.12.1995, 15:22:59, Ambulatory Blood Pressure:
24h Average sys/dia [mmHg]
101.5/ 75.1
syst. BP readings above 135 mmHg [%]
2.1
diast. BP readings above 85 mmHg [%]
0.0
Day-Time Average sys/dia [mmHg]
101.5/ 75.1
15.12.1995, 15:17:35, Resting ECG:
suspected left ventr. hypertrophy
because [R+S] in [V5] and QRS angle < -15°
1
minor left axis deviation
because QRS angle between -30° and 0°
You can select several tests of one patient, compile these in a
combined report and print it out. This function is not available when the records of all patients are displayed.
A
1
2
3
B
A
C
Select the patient.
4
5
Select multiple tests by holding either
down when clicking on a test.
or
Ctrl
Print
negative T-wave [lateral]
Cancel
Click on
Figure 3-7. Combined report
1 Arrow buttons and scroll boxes to reposition the
text (up, down, right, left)
2 Button to delete text
3 Button to reinsert text
4 Button to initiate a printout of the combined report
5 Button to cancel the combined report
Combined Report
.
Figure 3-7 shows an example of a combined report.
A combined report can be edited and printed, but it can not
be saved.
If you wish to add text, position the cursor at the appropriate position and click. Then type the text.
If you wish to delete text, highlight it, then click on
A .
Deleted text can be inserted in any desired position. To
do so, place the mouse cursor at the appropriate point
and click. Then click on B A C .
The arrow buttons and scroll boxes (1) can be used to
reposition the text (up, down, right, left).
The Print button is used to initiate the printout of the
combined report.
227 498 02-A
CardioSys V 4.1
37
Selecting and Admitting a Patient, Retrieving Stored Examinations
Patient
Hellige
Hilfsfunktionen
External
Procedure Hilfe
Summary
Untersuchung
Holter ECG: 19.10.1995 • 13:00:30
(Unbenannt)
Interpretation (summary)
For examinations made with an external program, you will see
a procedure summary (Figure 3-8), when you press the
OK
button.
no pathological findings
Delete Stored Tests
The Delete button allows you to remove the highlighted
test(s) from the database.
Sending Test Data to the MUSE CV System
Detailed Report
Figure 3-8. Summary
Cancel
Use only standard ASCII letters (A through Z) and numbers
(0 through 9) when entering information for the MUSE CV
system.
Once transferred to the MUSE CV system, the tests cannot
be edited any more.
Data sent to MUSE can be viewed with the MUSE Browser
and printed. Note: Before printing, always set the printer to
the landscape format.
If you enable “Start modem connection before transfer” on
the MUSE tab of the System Configuration menu, the system
may still find an active modem connection while it tries to
establish a new connection. Windows NT will inform you of
this condition. Terminate the existing connection (Hangup)
and resend the data.
38
CardioSys V 4.1
227 498 02-A
The Examination Procedures
4. The Examination Procedures
Select patient (local database)
Search for …
Last Name
Patient ID
Last Name
First Name
Date of Birth
Patient ID
Master
Miller
Richards
Roberts
Shields
Stevenson
Thompson
next page…
Jim
Jane
Chantal
Jennifer
Stuart
Robert
Anthony
10/05/1949
06/04/1943
03/12/1977
07/27/1977
11/11/1912
11/22/1966
09/19/1932
8738999
654987
7766699
543876
765321
333999
665544
Select
New Patient
Delete
The following sections describe the different examination
procedures possible with CardioSys (resting ECGs, exercise
tests, STAT ECGs, etc.) in detail.
Unnamed
Help
Cancel
Close
New Patient…
Last Name
Master
First Name
Jim
Patient ID
8738999
Date of Birth
10/05/1949
Gender
Male
Height
176
in
Weight
66/0
lb
Race
MM/DD/YYYY
Pacemaker
Accept
When you click on one of the procedure selection buttons,
the patient selection screen opens, allowing you to retrieve a
patient from the database or to enter a new patient (sections
3.1 and 3.2). The advantage of this approach is that you can
immediately select the examination procedure without having
to choose a patient first.
Figure 4.0-1. Patient selection screen
On the patient selection screen the bar cursor is always on the
patient selected last. So, if you wish to perform multiple tests
on the same patient, all you have to do is click on the
Select
button or press .
If you prefer to run an unassigned procedure, click on
Unnamed
.
Close
Choose
to display the title screen.
If you run the program in conjunction with a hospital information system (HIS), the Order List
button will also appear,
enabling you to display a list of requested procedures (this
function requires the optional “Order List” module, refer to
Appendix 2 “Operation in Conjunction with a Medical
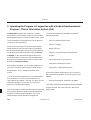
Reimbursement Program/Hospital Information System”).
227 498 02-A
CardioSys V 4.1
39
The Examination Procedures
For your notes
40
CardioSys V 4.1
227 498 02-A
The Resting ECG
4.1 The Resting ECG
This section describes all operating steps necessary to
–
apply the electrodes to the patient and connect the
patient
–
enter the test information (indication, medication,
comments, etc.)
–
record the ECG
–
call up the report pages for on-screen review
–
print the report pages
–
compare two resting ECGs
–
set up the system
The brief operating instructions at the end of this section
sum up what you have to do to record a resting ECG.
227 498 02-A
CardioSys V 4.1
41
The Resting ECG / The Basics
4.1.1 The Basics
Test Information
Library: Reason for Test
ABE
Therapy outcome control
Routine test
Clarify chest discomfort
Confirm/Rule out CAD
Angina Pectoris
Post-MI
Preop. Diagnosis
Blood Press.(mmHg)
Reason for Test
F
A
B
A
»
sys
Choose the
dia
Medication
C
…
Comment
OK
Physician:
Cancel
Technician:
Help
icon to activate the resting ECG mode.
After selection of a patient, the window for entry of the test
information will open (Figure 4.1-1), if you have chosen this
feature in the system configuration (refer to section 6.1 “System Configuration”). We recommend that you apply the
electrodes to the patient as explained in section 4.1.2 prior to
entering the test information.
Figure 4.1-1. Test information window
42
CardioSys V 4.1
227 498 02-A
The Resting ECG / Applying the Electrodes
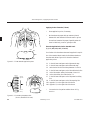
4.1.2 Applying the Electrodes
Careful application of the electrodes is a prerequisite for
obtaining interference-free ECGs. The signal acquisition
screen immediately gives you a visual indication of your
electrode technique and of the signal quality (provided the red
R electrode is applied).
For quick, reliable and trouble-free application of the electrodes we recommend our Electrode Application System (refer
to the Electrode Application System user manual).
As an alternative you can use the conventional plate electrodes on the limbs and the suction electrodes on the thorax.
Figure 4.1-2. Applying plate electrodes
Applying Plate Electrodes (Limbs)
☞
The red R electrode is the reference electrode.
Placement and signal quality of all other electrodes can be assessed on the signal acquisition
screen only when this electrode is applied.
227 498 02-A
Plate electrodes are applied by means of a rubber strap; electrode paper is the recommended contact medium for this type
of electrode.
*
Moisten the electrode paper with tap water and place it
between skin and electrode.
*
Secure the electrode with the rubber strap (Figure 4.1-2)
so that it cannot shift during the recording; take care not
to strangulate blood vessels in the process.
CardioSys V 4.1
43
The Resting ECG / Applying the Electrodes
Applying Suction Electrodes (Thorax)
C1
C3R
C4R
C2
C3
Shave application points, if necessary.
*
Moisten electrode paper with tap water and place it
between skin and electrode. Electrode cream or gel can
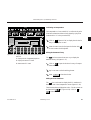
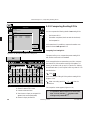
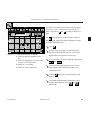
be used here instead of the paper. Especially when the
chest is a little hairy, cream or gel helps to seal.
C5
C6
C4
Electrode Application Points for Standard Leads
(I, II, III, aVR, aVL, aVF, V1 to V6)
C8
C7
Four limb and six chest electrodes must be applied for acquisition of the standard leads. Attach the limb electrodes above
the wrists and ankles. Figure 4.1-3 shows the chest lead
application points:
C6
C4R
*
C5
C3R C1 C2 C3 C4
Figure 4.1-3. Chest electrode application points
N black
R red
C1
C2
C3
C4
C5
C6
C7
right leg
right arm
C1 white
C1
C2 white
C3 white
C2
C3
C5
C4
C6
C4 white
C5 white
C6 white
C8
L yellow
left arm
F green
C7
C6
left leg
C1 C2 C3 C4
in the 4th intercostal space at the right sternal edge
in the 4th intercostal space at the left sternal edge
at the level of the 5th rib midway between C2 and C4
in the 5th intercostal space on the left midclavicular line
on the left anterior axillary line between C4 and C6
on the mid-axillary line at the level of C4
in the 5th intercostal space on the left posterior axillary
line
C8 in the 5th intercostal space on the left scapulary line
C3R opposite C3, on the right side of the thorax
C4R opposite C4, on the right side of the thorax
C5
*
Connect the 10-wire patient cable as shown in Figure 4.1-4.
Figure 4.1-4. Connecting the patient cable
(10-wire, standard ECG leads)
44
CardioSys V 4.1
227 498 02-A
The Resting ECG / Applying the Electrodes
*
correct
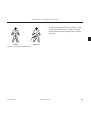
Figure 4.1-5. Arranging the patient cable
227 498 02-A
Arrange the patient cable as shown in Figure 4.1-5 and
connect it to the system (type CF signal input: highly
isolated, suitable for intracardiac application, defibrillation-proof).
incorrect
CardioSys V 4.1
45
The Resting ECG / Applying the Electrodes
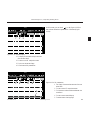
Electrode Application Points for NEHB Leads
Figure 4.1-6 shows the application points for the NEHB
electrodes. Connect the 12-wire patient cable as shown in
Figure 4.1-7 (Nap is identical with C4).
*
Figure 4.1-6. Electrode application points for NEHB leads
Nst attachment point of the 2nd rib to the right
sternal edge
Nax in the 5th intercostal space on the left posterior
axillary line (identical with C8)
Nap in the 5th intercostal space on the left midclavicular line (identical with C4)
N black
R red
If necessary disable the anti-drift system and the filters
(muscle and AC line filter) to view the unfiltered “raw”
ECG signal (sections 4.1.4 and 4.1.7).
As an alternative the NEHB leads can also be acquired with the
10-wire patient cable. In this case, select the sequence High,
Right or Left as described in section 4.1.7 (“Modifying the
Lead Sequence”) and change:
I
to
D
II
to
A
III
to
J.
Apply the R electrode to Nst
the L electrode to Nax (C8)
the F electrode to Nap (C4).
☞
It is not possible to record chest leads at the same
time as NEHB leads.
☞
Please observe the information given in sections
7.1 “Artifact Due to Poor Electrode Application”,
7.2 “ECGs of Pacemaker Patients” and 7.3 “ECG
Recording During Defibrillation” in the appendix.
right leg
right arm
C1 white
Nst
C2 white
C1
C3 white
C2
C3
C5
C4
Nst
C6
(Nap)
C4 white (Nap)
C8 Nax
Nax
C8
C5 white
C7
C6 white
C6
L yellow
left arm
F green
left leg
C1 C2 C3 C4
Nst
Nap
C5
Figure 4.1-7. Connecting the patient cable (12-wire, NEHB leads)
46
CardioSys V 4.1
227 498 02-A
The Resting ECG / Entering the Test Information
4.1.3 Entering the Test Information
Test Information
Library: Reason for Test
Therapy outcome control
Routine test
Clarify chest discomfort
Confirm/Rule out CAD
Angina Pectoris
Post-MI
Preop. Diagnosis
ABE
A
Reason for Test
F
B
A
C
2
»
The test information screen offers menus and text boxes for
entry of all data relevant for the resting ECG procedure.
1
On this screen you can
3
4
Blood Press.(mmHg)
sys
Medication
Technician:
OK
–
enter blood pressure readings
5
–
select the medication
–
enter comments
–
register the physician’s and technician’s names.
Cancel
Help
Figure 4.1-8. Test information screen
1 Reason for Test Library
2 The patient’s reason for test
3 Blood pressure readings
4 Medications
5 Boxes for entry of comments and of the physician’s and technician’s names
227 498 02-A
enter the reason for the test
…
Comment
Physician:
–
dia
CardioSys V 4.1
47
The Resting ECG / Entering the Test Information
Copying Reason for Test from the Library to the Patient
Window
The reason for test library contains a list of standard statements that you can copy easily into the patient’s window. The
library can be expanded or edited as required.
Click on a statement to highlight it.
Click the
☞ A Reason for Test can easily be copied by double-clicking.
button.
If you wish to delete a copied reason or part of it, highlight the words in question and click A .
The deleted words can be inserted in another position by
placing the cursor there and clicking B A C .
You can enter a reason for test directly by moving the
cursor to the desired position and typing the text.
Expanding or Editing the Reason for Test Library
Click
ABE
F
.
This will open the library window (Figure 4.1-9).
ABE
F
Modify Library: Reason for Test
Move the cursor to the desired position in the list and
click the mouse button.
Therapy outcome control
Routine test
Clarify chest discomfort
Confirm/Rule out CAD
Angina Pectoris
Post-MI
Preop. Diagnosis
OK
Cancel
Help
Enter a standard statement and press on the keyboard. The cursor moves to the beginning of the next
line.
Figure 4.1-9. Editing the Reason for Test library
48
CardioSys V 4.1
227 498 02-A
The Resting ECG / Entering the Test Information
In this manner you may enter all reasons for a test .
OK
When you’re done, click on
to clear the
window.
Entering Blood Pressure Readings
☞
Click
click
to display and increase the value, or
to decrease the value.
Blood pressure readings are either entered directly via the
keyboard or they are selected and changed in steps of
5 mmHg by clicking the arrow boxes. When you first click
the arrows you will see default pressures of 120 mmHg (sys)
and 80 mmHg (dia).
Move the cursor to the sys box and click the left mouse
button.
Enter the value via the keyboard.
Enter the diastolic value in the same manner.
227 498 02-A
CardioSys V 4.1
49
The Resting ECG / Entering the Test Information
Test Information
Library: Reason for Test
ABE
Reason for Test
F
A
B
A
C
Therapy outcome control
Routine test
Clarify chest discomfort
Confirm/Rule out CAD
none
Angina Pectoris
unknown
Post-MI
digitalis
Preop. Diagnosis
diuretics
psychotherap. agents
steroids
beta-blockers II
beta-blockers III
antiarrhythmics Ia
antiarrhythmics Ib
antiarrhythmics Ic
antiarrhythmics III
Blood Press.(mmHg) Ca antagonist,
sys verapamil type
dia
Ca antagonist, nifedipine type
Selecting a Medication, Assigning a Drug Name to a Medication Group
»
Medication
You can select a medication from a list of 14 items . You
can also select a second medication and assign specific drugs
to the medication groups to include these in the list instead of
the group name … .
Making a Selection
…
Comment
OK
Physician:
Cancel
Technician:
Help
Figure 4.1-10. List of medication groups
☞
Click on
4.1-10).
to open the medication list box (Figure
Select one of the medications.
The physician is responsible for assigning drugs to
a medication group.
If you wish to select a second medication or to assign a
drug name to a medication group, click on … and
select the medication as described above.
Assigning Drugs to a Medication Group
Medications…
Medication
Medication Group
Drug Name
none
-->
unknown
-->
digitalis
-->
diuretics
-->
psychotherap. agents
-->
steroids
-->
beta-blockers II
-->
beta-blockers III
-->
antiarrhythmics Ia
-->
antiarrhythmics Ib
-->
antiarrhythmics Ic
-->
antiarrhythmics III
-->
Ca antagonist,verapamil type
-->
Ca antagonist,nifedipine type
-->
Click on
Medications…
.
A window opens, showing 14 items (Figure 4.1-11). There is
a drug name window for each of these groups. Click on the
respective text box, if you wish to enter a name. Then type the
drug name.
Furthermore, you are free to arrange the medication groups
any way you want. To do so
Help
OK
Cancel
Click on the
at the end of the group name box.
Figure 4.1-11. Assigning a drug to a medication group
50
CardioSys V 4.1
227 498 02-A
The Resting ECG / Entering the Test Information
This brings up a new window where you can choose one of
the group names (Figure 4.1-12).
Medication
Medication Group
none
Drug Name
-->
none
unknown
digitalis
diuretics
psychotherap. agents
steroids
beta-blockers II
beta-blockers III
antiarrhythmics Ia
antiarrhythmics Ib
antiarrhythmics Ic
antiarrhythmics III
Ca antagonist,verapamil type
Ca antagonist,nifedipine type
nitrates
ACE
alpha-blockers
cytostatics
-->
Click on the drug name box and enter the name
-->
-->
-->
Click on
-->
OK
to clear the window.
-->
-->
Entering Comments
-->
-->
-->
Help
-->
OK
-->
-->
If you wish to enter a comment on the test procedure, click in
the “Comment” text box and key in the text.
Cancel
Physician’s/Technician’s Name
Figure 4.1-12. Editing the medication group
The names of the physician and ECG technician can either be
entered here (click in the text box and type the name), or they
can be selected from the list of the registered system users
(section 6.1 “System Configuration”).
Click on
on it.
and choose a name from the list by clicking
Exiting the Test Information Screen
☞
Pressing the
key on the PC keyboard also
clears the window and saves the entries.
227 498 02-A
Once you have entered all test information, you can either
–
clear the window with
resting ECG or
–
clear the window with Cancel
(in this case the test
information will be ignored and are not assigned to the
test)
CardioSys V 4.1
OK
and start recording the
51
The Resting ECG / Recording A Resting ECG
OK
4.1.4 Recording A Resting ECG
Hellige
Patient
Procedure
System Services Help
Baker, Dave, 41yrs
REST ECG/ Signal Acquisition
Test Information
X 40 HZ
Setup
X 50 HZ
Freeze Traces
10 mm/mV
85
25 mm/s
2
1
HR (BPM)
»
Options
3
SYS/DIA (mmHg)
130/80
V1
V2
1 2
3
V3
aVR
6
4
L
N
F
7
Lead Sequence
5
STANDARD
V6
52
This screen (Figure 4.1-13) shows:
Cubic Spline
ON
Figure 4.1-13. Signal acquisition screen for the resting ECG
1 Control buttons
2 Current heart rate
3 Blood pressure readings
4 Applied electrodes
green: properly applied
yellow: not properly applied
white: site not used
red: electrode off or lead break
5 For selection of the lead sequence
6 Leads impaired by poor signal quality
7 Calibration pulse
☞
The resting ECG signal acquisition screen
V5
aVL
aVF
V4
4 5 6
R
Once you have entered the test information and cleared the
OK
window with
, the signal acquisition screen for the
resting ECG (Figure 4.1-13) will appear. Take a few seconds
to become familiar with the details shown on this screen
before proceeding to recording the resting ECG.
The applied electrodes are shown on the torso only
for the “Standard” and “CABRERA” lead sequences. In all other cases there is only a schematic representation of the electrodes. The reference electrode R (red) must be applied for the
lead-check function to work properly.
–
the current heart rate (2) and the blood pressure readings
(3) (if entered manually, section 4.1.3)
–
the applied electrodes and the signal quality (4). Furthermore an arrow (6) points to the leads which are impaired
by improper electrode application or which cannot be
recorded due to disconnected electrodes (or due to a
break in the patient cable).
–
the selected lead sequence (5)
–
the selected sensitivity (the 1-mV calibration pulse (7) is
valid for all channels).
This program allows you to select specific system settings
similar to a conventional ECG recorder. You can enable or
disable muscle and AC line filters, select different sweep
speeds and sensitivities, etc. Furthermore, you can set up the
system to suit your personal needs and preferences. These
settings will be retained and are activated each time the system
is turned on (section 4.1.7 “Setup”).
CardioSys V 4.1
227 498 02-A
The Resting ECG / Recording A Resting ECG
☞
Click
Settings selected from the Setup menu will be
retained and are automatically activated each
time the system is turned on.
Select
4.1.7).
Options >>
Setup
to display the system settings buttons.
to display the setup menu (section
The buttons
and
allow you to change the display
of the ECG leads: either you see 5-second segments of all
12 leads at a time, or you see 10-second segments of
groups of 6 leads.
Hellige
Patient
Procedure
System Services Help
Baker, Dave, 41yrs
Test Information
Setup
The 40 Hz box switches a muscle filter on and off
REST ECG/ Signal Acquisition
X 40 HZ
X 50 HZ
Freeze Traces
10 mm/mV
Options
HR (BPM)
»
85
25 mm/s
SYS/DIA (mmHg)
V1
The 50 Hz check box switches an AC filter on and off
( X = AC filter on).
V2
The arrows at
1 2
3
V3
aVR
V4
aVL
V5
aVF
V6
L
N
F
Analyzing…
Figure 4.1-14. Resting ECG acquisition screen with control
buttons and “Analyzing...” message
☞
Please remember that a filter may also suppress
diagnostically relevant information, as it limits
the frequency bandwidth. Therefore you should
not switch filters on indiscriminately.
☞
If “Manual Override” is enabled in the Setup
menu (section 4.1.7), the system starts recording
the ECG even when not all electrodes are applied.
227 498 02-A
4 5 6
R
mm/mV select the gain (2.5, 5,
10, 20, 40 mm/mV).
The arrows at ... mm/s select the sweep speed (25 or
50 mm/s).
The entire ECG recording is controlled with the four buttons:
CardioSys V 4.1
Test Information
Freeze Traces
Options >>
.
53
The Resting ECG / Recording A Resting ECG
Recording and Evaluating the ECG
Hellige
Patient
Procedure
System Services Help
Baker, Dave, 41yrs
REST ECG/ Signal Acquisition
Test Information
Setup
X 40 HZ
X 50 HZ
Freeze Traces
10 mm/mV
Options
HR (BPM)
»
85
25 mm/s
SYS/DIA (mmHg)
V1
V2
1 2
3
V3
aVR
V4
aVL
V5
aVF
V6
The program continually saves 10-second segments of the
incoming ECG. When you click the
button, the
most recent 10 seconds of the ECG signal will be analyzed.
Thus, before initiating the analysis, you can make sure that
the quality of the ECG signal to be evaluated is adequate.
4 5 6
R
L
N
F
If you wish to modify the sweep speed or the filter settings
(muscle, AC line filter), click on Options >> to display the
second row of controls.
Analyzing…
Figure 4.1-14. Resting ECG acquisition screen with control
buttons and “Analyzing...” message
Click Freeze Traces to freeze and release the signal traces. The
freeze function does not affect channel 1.
Click
to initiate the procedure. The message
“Analyzing...” which appears in the bottom right-hand corner
for about 6 seconds tells you that the signal is being analyzed
(Figure 4.1-14).
At the end of the analysis you will automatically see the first
page of the procedure report showing the 10-second ECG
strips (Figure 4.1-15).
The resting ECG report includes the following documents
which are described in detail on the following pages:
–
–
–
–
–
54
the ECG traces (Figure 4.1-15/4.1-16)
the test summary (Figure 4.1-20)
medians (dominant, subdominant) (Figure 4.1-22)
arrhythmia review (Figure 4.1-25)
interpretation (Figure 4.1-27)
CardioSys V 4.1
227 498 02-A
The Resting ECG / Evaluating the ECG
ECG Trace Display
Hellige
Patient
Procedure
System Services
Baker, Dave, 41 yrs
Help
REST ECG / 10-s-ECG
10 mm/mV
You can choose among three different formats for presentation of the ECG:
25 mm/s
40 Hz
V1
50 Hz
V2
1
2
3 4
V3
5
6
2 x 6 leads (Figure 4.1-15)
1 x 6 leads (Figure 4.1-16)
3 x 4 leads
V4
aVR
7
aVL
7
V5
aVF
V6
Figure 4.1-15. ECG trace display (2 x 6 leads)
1 Button to call up the optional 6-lead display (2 screens)
2 Buttons to change the gain and sweep speed
3 Button to zoom the ECG
4 Buttons to call up the other report pages (scrolling page by page)
5 Button to directly access specific pages
6 Procedure parameters
7 Buttons to display other time intervals
Hellige
Patient
–
–
–
Procedure
System Services
Baker, Dave, 41 yrs
Help
Depending on the selected format and sweep speed the entire
ECG (10 seconds) may take up several screens. The default
format is the presentation of all 12 leads (Figure 4.1-15).
Measurements can be performed on all ECGs (amplitude/
intervals/slope) (refer to the next section entitled “Zooming
and Measuring the ECG”).
Click
(forward) or
another time window.
(backward) (7) to display
Click
(2) to select another signal size.
Click
and
(2) to select another sweep speed.
REST ECG / 10-s ECG
10 mm/mV
Click
and
(1) to display the 6 leads/screen
format (Figure 4.1-16).
25 mm/s
40 Hz
50 Hz
aVR
aVL
aVF
1.0
2.0
3.0
4.0
5.0
6.0
7.0
8.0
9.0
Figure 4.1-16. ECG display, 6 leads/screen
227 498 02-A
CardioSys V 4.1
55
The Resting ECG / Evaluating the ECG
Zooming and Measuring the ECG
Hellige
Patient
Procedure
System Services
Baker, Dave, 41 yrs
Help
REST ECG / 10-s ECG / Zoom
Amplitude 1.5 mV
aVL
Zooming
40 mm/mV 200mm/s
40 Hz
The zoom function allows you to display a portion of the
ECG at a larger scale.
50 Hz
1
2
3
4
5
6
Click
7
701 ms
0.1
0.2
0.3
0.4
0.5
0.6
0.7
Figure 4.1-17. Zooming the ECG
1 Buttons to display the same segment in another
channel
2 Button to obtain a hardcopy of the displayed
screen
3 Measured amplitude
4 Button to quit the zoom display
5 Buttons to display the other report pages
(scrolling page by page)
6 Button to directly access specific pages
7 Scroll box to move the trace segment
56
.
Move the cursor to the region of interest that you want
to zoom, and click. Your display looks similar to the one
shown on Figure 4.1-17.
Click
to display the same time window in another lead. The label of the selected lead is shown below
the arrow buttons (Figure 4.1-17).
Drag the scroll box 7 (Figure 4.1-17) along the scroll bar
to displace the trace segment vertically and horizontally.
To obtain a true-to-scale hardcopy of the displayed
screen, click on the
icon (the hardcopy includes the
caliper marks).
CardioSys V 4.1
227 498 02-A
The Resting ECG / Evaluating the ECG
Measuring the ECG
Hellige
Patient
Procedure
System Services
Baker, Dave, 41 yrs
Help
On all zoomed ECG displays you can measure amplitudes
(mV), intervals (ms) and slopes (mV/s).
REST ECG / 10-s ECG / Zoom
40 mm/mV 200mm/s
aVL
Reference Point 1
40 Hz
50 Hz
As soon as you place the cursor in the ECG area, it
becomes a caliper.
Reference Point 2
701 ms
0.1
0.2
0.3
0.4
Figure 4.1-18. ECG measurement
0.5
0.6
0.7
Position the cursor on the first reference point and click.
A green caliper now marks reference point 1. Then
position the cursor on the second reference point and
click again. A yellow line connecting these two points
appears along with the measured value (Figure 4.1-18).
The result is given in mV for the amplitude, in ms for
the time interval, and in mV/s for the slope.
Click the right mouse button to delete a reference point
or an entire measurement.
On the zoomed display the position of the cursor is continuously indicated in mV at 3 (Figure 4.1-17), measured from
the grid line at the center.
Click
to cancel the zoom display. The original
display reappears.
227 498 02-A
CardioSys V 4.1
57
The Resting ECG / Evaluating the ECG
Displaying Other ECG Report Pages
Go to…
Test Summary
You can either scroll through all ECG report pages, or access
specific pages directly.
ECG Traces
Medians (dom.)
Medians (subd.)
Click
to scroll forward or
through the report.
to scroll backward
Arrhythmia Review
Interpretation
Cancel
Figure 4.1-19. Table of contents of the resting ECG report
Click
to display the table of contents from which
you can choose specific report documents for review
(Figure 4.1-19).
Select the desired document by clicking.
The key functions described above are available for all documents. An explanation of the report pages follows on the next
few pages.
58
CardioSys V 4.1
227 498 02-A
The Resting ECG / Evaluating the ECG
Patient
Hellige
Test Summary
System Services
Procedure
Baker, Dave, 41 yrs
The Test Summary
Help
REST ECG / Test Summary
The test summary (Figure 4.1-20) provides a survey of
ABE
F
Reason for Test
Measurements Summary
supraventr premature (SVPB)
because premature beat with same morphology
left axis deviation
because QRS angle between -90° and -30°
Medication
Comment
Physician
Technician
Dr. Williams
Dorothy
Figure 4.1-20. Test Summary
Age
48 years
Sex
Male
Race
Caucasian
Height
175 cm
Weight
80.0 kg
Blood Pressure
HR
84 BPM
QRS
QT
QTC
PQ
P
RR
PP
Sokolov
QTD
< QRS -25°
<T
50°
<P
25°
106
392
330
180
136
708
705
3,50
20
ms
ms
ms
ms
ms
ms
ms
mV
ms
Reason for Test (from the test information)
Measurements Summary (excerpt from interpretation, Figure
4.1-27)
Medication/Comment/Physician/Technician (from the test
information)
-90
0
90
Patient Data
Blood Pressure (from the test information)
QRS, QT, QTC, PQ, RR, PP interval (from the “Measurements”)
SOKOLOV LYON index: S (V1) + R (V5) or S (V1) + R (V6),
whichever is greater (from the “Measurements”)
QTD (QT dispersion): max. difference between max. QT
duration and min. QT duration of all leads
Vector angles
QRS, T and P angle (from the “Measurements”)
If you wish to add or edit procedure data, click on
Changing the medication will cause the program to
reanalyze the ECG.
ABE
227 498 02-A
CardioSys V 4.1
F
.
59
The Resting ECG / Evaluating the ECG
Data Export
Hellige
Patient
Procedure
Baker, Dave, 41 yrs
ABE
System Services
Help
REST ECG / Test Summary
F
Reason for Test
Export Data
Export data to clipboard
Measurements(Analysis Program)
supraventr premature (SVPB)
because premature beat with same morphology
Export data to file
left axis deviation
because QRS angle between -90° and -30°
Medication
Comment
Physician
Technician
Dr. Williams
Dorothy
Figure 4.1-21. Data Export window
Age
48 years
Sex
Male
Race
Caucasian
Height
175 cm
Weight
80.0 kg
Blood Pressure
HROK
84 BPM
QRS
Cancel
QT
QTC
PQ
P
RR
PP
Sokolov
QTD
< QRS -25°
<T
50°
<P
25°
106
392
330
180
136
708
705
3,50
20
ms
ms
ms
ms
ms
ms
ms
mV
ms
The
icon allows you to export the most important data
pertaining to the resting ECG procedure to the clipboard or
to any file. Data exported to the clipboard, for instance, can
be inserted in a text file with the “Edit” —> “Paste” command.
Click
-90
0
.
Select either “Export data to clipboard” or “Export data
to file”.
90
Click on
OK
.
Data from the clipboard can be imported in a word processing program with the “Paste” command.
For data exported to a file you will have to specify the target
OK
directory and confirm it with
.
60
CardioSys V 4.1
227 498 02-A
The Resting ECG / Evaluating the ECG
Medians (dom.)
Hellige
Patient
Procedure
System Services
Baker, Dave, 41 yrs
Medians (dominant/subdominant)
Help
REST ECG / Dominant Medians
20mm/mV
Measurements
I
aVR
1
The dominant (and, if present, the subdominant) medians of
all leads are displayed together on one screen (Figure 4.1-22).
The reference marks are shown as well. You are free to perform additional measurements as on the zoom display.
Reanalysis
V1
2
V4
3
II
aVL
V2
V5
III
aVF
V3
V6
With the
buttons you can change the signal size
(default: 20 mm/mV).
Figure 4.1-22. Medians
1 Button to change the signal size
2 Button to display the measured values
3 Button to display the re-analysis screen
Measurements
Patient
Procedure
Baker, Dave, 41 yrs
102
444
522
178
ms
ms
ms
ms
Help
REST ECG / Measurements (dom. median)
Return…
QRS
QT
QTC(H)
PQ
Click Measurements to display the measured values (Figure
4.1-23).
Hellige
System Services
P
122 ms
RR
700 ms
PP
700 ms
Sokolov 1.83 mV
Reanalysis
NB
QTD
12
46 ms
< QRS
<T
<P
-25°
50°
25°
aVR -90
aVL
0I
Click Reanalysis to display a screen which allows you to
adapt the analysis criteria to your needs (Figure 4.1-23).
III 90 II
aVF
Figure 4.1-23. Measurements (results obtained with the HEART
measurement program)
227 498 02-A
CardioSys V 4.1
61
The Resting ECG / Evaluating the ECG
Reanalysis
Patient
Procedure
Baker, Dave, 41 yrs
Select…
V4
Reanalysis (HEART ECG Measurement Program)
Hellige
System Services
Help
Click Reanalysis
4.1-24).
REST ECG / Reanalysis (dom.median)
Reset
Measurements
Return…
ECG Analysis
40 Hz
50 Hz
1
Amplitude
QRS
104
QT
394
PQ
174
P
132
ms
ms
ms
ms
0.10 mV
102 ms
392 ms
175 ms
132 ms
Here you see the medians of all leads superimposed. The
reference marks determined by the system are located below
the ECG baseline, those above the baseline can be moved
with the mouse. A table in the top right-hand corner lists the
time intervals.
You can perform the same measurements as on the zoomed
display (amplitudes, intervals, slopes). The amplitude of the
cursor position is continuously displayed in the top line of the
table.
Figure 4.1-24. The reanalysis screen
1 active lead (highlighted)
☞ If the program was unable to locate the beginning and end of the P wave (e.g. in the presence
of atrial fibrillation), the reference marks will be
dashed. In this case the user can click on them
with the right mouse button and drag them to
the appropriate position. The user-selected
marks are solid instead of dashed. It is possible
to restore the original position of the reference
marks by double-clicking on them.
62
to call up the reanalysis screen (Figure
For a reanalysis of the ECG you can change the following
settings:
–
You select the leads from which the average beats for
determination of the measurement marks are to be
derived and which are superimposed ( Select… ).
–
From these leads you choose one whose median complex
is to be highlighted (buttons
und
).
–
You move the reference marks above the baseline to any
desired position (mouse).
–
You perform a reanalysis (
–
You cancel the reanalysis results (
CardioSys V 4.1
ECG Analysis
).
Reset
).
227 498 02-A
The Resting ECG / Evaluating the ECG
First select the leads from which you want to derive the
median complex for determination of the reference marks.
Only those beats will be superimposed.
Click
Select…
. A window opens showing all leads.
Select the leads (check mark = lead is selected).
Click
OK
to clear the window.
Click the arrow button
or
highlighted (1, Figure 4.1-24).
to select the lead to be
The measurement marks can be moved as follows:
Position the cursor on the mark to be moved (above the
baseline).
Click the mark and, holding the mouse button depressed, drag it to its new position. Now release the
mouse button. The time interval is updated in the table.
When all marks are in the correct position, click
ECG Analysis
for a reanalysis of the ECG.
Click
and then ECG Analysis , if you wish to
Reset
restore the original analysis results.
227 498 02-A
CardioSys V 4.1
63
The Resting ECG / Evaluating the ECG
Arrhythmia Review
Hellige
Patient
Procedure
System Services
Baker, Dave, 41 yrs
Arrhythmia Review
Help
REST ECG / Arrhythmia Review
Cycles >>
Determine HR
1
QRS Complexes 13
I
2
HR 82 BPM
10 mm/s
40 Hz 50 Hz
On the arrhythmia review screen (Figure 4.1-25) you see a
10-second segment of one lead at a time, including the identified events, such as PVC or PSVC.
PVC
3
1.0
2.0
3.0
4.0
4
5.0
6.0
7.0
8.0
9.0
A bar diagram below the signal trace indicates the deviation of
the RR interval from the mean RR interval.
Mean RR Interval 726 ms
800
800
700
700
700
700
700
700
700
760
700
500
Figure 4.1-25. Arrhythmia review
1 number of identified QRS complexes
2 HR
3 displayed lead
4 mean RR interval
500
When first called up, the display shows the lead that you
selected in the configuration menu. All other leads can be
selected with the arrow buttons
and
.
Furthermore you can determine the heart rate.
Measuring the Heart Rate in a Normal ECG
Click on the QRS complex at the beginning of the
interval to be measured; the system automatically positions the cursor in the correct place.
Click on the QRS complex at the end of the interval. A
line marks the measured interval and the resulting heart
rate is displayed.
64
CardioSys V 4.1
227 498 02-A
The Resting ECG / Evaluating the ECG
Arrhythmia Review
Hellige
Patient
Procedure
System Services
Baker, Dave, 41 yrs
Measuring the Heart Rate in the Presence of
Atrial Fibrillation or Flutter
Help
REST ECG / Arrhythmia Review
1
Cycles >>
Determine HR
Number
HR 85 BPM
QRS Complexes 13
10 mm/s
III
40 Hz 50 Hz
In this situation you will have to define a cardiac cycle yourself.
PVC
Click
Cycles
.
HR 85 BPM
1.0
2.0
3.0
4.0
5.0
6.0
7.0
8.0
9.0
Mean RR Interval 726 ms
800
800
700
700
700
700
700
700
500
700
760
700
500
A window opens where you can enter the number of cycles
over which you want to measure the heart rate.
Click
Figure 4.1-26. Calculating the heart rate
above Number to adjust the number of cycles.
Position the cursor at the beginning of the interval to be
measured and click.
Count the number of cardiac cycles, position the cursor
at the end of the interval and click again. The interval is
marked with a yellow line and the heart rate for this
interval is displayed (Figure 4.1-26).
Click the right mouse button to delete a single reference
point or an entire measurement.
227 498 02-A
CardioSys V 4.1
65
The Resting ECG / Evaluating the ECG
Interpretation
Hellige
Patient
Procedure
System Services
Baker, Dave, 41yrs
ABE
Interpretation
Help
The interpretation screen is split into two windows. The one
on the left shows the interpretation as derived by the system
or the library of interpretative statements, while the one on
the right is reserved for the physician’s interpretation. The
physician’s interpretation has priority over the system interpretation (for printing or in the procedure summary). Only
when the procedure is assigned to a patient can the physician’s
interpretation be entered.
REST ECG/ Interpretation
A
F
Measurements Summary
Statement Library
B
A
C
Interpretation
suspected left ventr. hypertrophy
because (R+S) in [V5] and QRS angle < -15°
minor left axis deviation
because QRS angle between -30° and 0°
negative T-wave (lateral)
because T <= -0.1 mV in [V6]
R/S inversion area between V1 and V2
»
Figure 4.1-27. Interpretation screen
☞ You can copy individual lines by double-clicking.
When writing the physician’s interpretation you can first of
all choose between the interpretation from the analysis program and the statement library, then you can copy parts or all
of these statements to the right window. In the window at the
right you can edit these statements again, using the A icon
to cut text and the B A C icon to reinsert the text in any other
place. You may also add any comments. Furthermore, you
can record a spoken comment, using the
icon, provided
that a sound card has been implemented in your system and
that you have a microphone. This comment will be saved to
the corresponding patient file. It can be played back by clicking the
icon.
The interpretation is shown to be confirmed only after it was
signed by a physician (
).
First select the information to be displayed: the program
measurements or the statement library (Figure 4.1-27).
If you wish to copy phrases to the right, highlight the
respective passages, then click
.
To enter text directly into the window on the right,
move the cursor to the desired position, click the mouse
button and type the text.
66
CardioSys V 4.1
227 498 02-A
The Resting ECG / Evaluating the ECG
Confirming an Interpretation
Hellige
Patient
Procedure
System Services Help
Baker, Dave, 41yrs
ABE
REST ECG/ Interpretation
A
F
Measurements Summary
Statement Library
B
A
The interpretation of a recorded ECG is confirmed only after
it has been reviewed and electronically signed by a physician
(marked with a “X” in the procedure list).
C
Interpretation
suspected left ventr. hypertrophy
because (R+S) in [V5] and QRS angle < -15°
Review
minor left axis deviation
because QRS angle between -30° and 0°
negative T-wave (lateral)
because T <= -0.1 mVPhysician
in [V6]
Dr. Williams
R/S inversion area between V1 and V2
2
Click on
(Figure 4.1-28) to display the window for
entry of the physician’s name.
OK
»
Cancel
1
10 mm/mV 25 mm/s
3
Select the name from the list (open the list box with
or enter a name via the keyboard.
)
Editing the Statement Library
Figure 4.1-28. Interpretation screen with confirmation window
and ECG
1 Displays the list of registered physicians
2 Displays the other ECG leads
3 Removes the ECG leads
The
icon becomes active as soon as you display the
statement library (1, Figure 4.1-27).
ABE
F
Click on ABE F to open the window for entry of interpretative statements.
Key in new text or edit the existing phrases.
Select
OK
to clear the window.
Adding the ECG Waveforms
The
icon can be used to display the ECG waveforms in
the bottom half of the interpretation screen (Figure 4.1-28).
Three leads are always displayed at a time. The other leads can
be viewed with
(2, Figure 4.1-28). Click on
or
to clear the ECGs.
227 498 02-A
CardioSys V 4.1
67
The Resting ECG / Comparing Resting ECGs
4.1.5 Comparing Resting ECGs
Hellige
Patient
Procedure
Hilfsfunktionen
Compare TestHilfe
Procedure 1
Baker, Dave, 4810.08.1996
J
11:32:23 Ruhe-EKG / Interpretation
A
Procedure 2
10.08.1996
11:32:51
Measurements(Analyseprogramm)
10.08.1996
11:12:45
supraventr premature (SVPB)
10.08.1996
11:07:42
because premature beat with same morphology
10.08.1996
11:40:18
10.08.1996
11:35:29
left axis deviation
B
A
You can compare the following details of two resting ECGs
C
Resting ECG
(Analyseprogramm)
RestingInterpretation
ECG
Resting ECG
Resting ECG
Resting ECG
–
–
–
because QRS-angel >= 90 Grad
because QRS-angel <= 90 Grad
negative T-wave (lateral)
because T <= 0.1 mV in (VG)
the 10-second ECG
the median complexes (dominant and sub-dominant)
the interpretation
»
R/S inversion area between V1 and V2
At the same time it is possible to compare the median complexes of at least 3 and up to 6 ECGs.
OK
Cancel
Comparing Two Resting ECG
Figure 4.1-29. Window for selection of a resting ECG
The system offers you to compare the present resting ECG
with another one stored in the database.
OK
Hellige
Patient
Procedure
System Services
Baker, Dave, 41 yrs
Help
REST ECG / Compare / 10-s ECG
Procedure 1
Procedure 2
10.08.1996 · 11:32:51
11.07.1996 · 10:30:06
10 mm/mV 25 mm/s
1
2
3
2.0
3.0
4.0
5.0
6.0
50 Hz
4
10 mm/mV 25 mm/s
1.0
40 Hz
7.0
8.0
Click
40 Hz
50 Hz
.
A window will open listing all of the patient’s resting ECGs
(Figure 4.1-29).
Select a recording and click
window.
9.0
Figure 4.1-30. Comparing two resting ECGs
1 Buttons to select the ECG leads
2 Procedure dates and times
3 Zoom button to display an enlarged ECG
segment (both traces superimposed)
4 Buttons to display the medians
68
For the example below we assume that you wish to compare
the recent ECG with an earlier recording of the patient. Of
course, you are free to call up any ECG (section 3.3 “Editing
Stored Examinations”) and compare it with any other ECG as
described below:
OK
to clear the
The comparison screen appears (Figure 4.1-30).
☞
CardioSys V 4.1
It is possible to select multiple ECGs at the same
time. To do so, hold the
key down while
clicking on the procedures.
Ctrl
227 498 02-A
The Resting ECG / Comparing Resting ECGs
For each ECG the screen shows 3 leads at a time (25 mm/s,
10 mm/mV). ECG 1 is displayed in the top half, ECG 2
below. Click buttons
and
to display the other ECG
leads.
Hellige
Patient
Procedure
Baker, Dave, 41 yrs
Procedure 1
Procedure 2
System Services
Help
REST ECG / Compare / Zoom
10.08.1996 · 11:32:51
10.08.1996 · 11:32:51
40 Hz
1
50 Hz
The
button allows you to select a portion of the ECG
and display it at a larger scale. Identical segments of the two
procedures are superimposed.
2
3
4
Click
Figure 4.1-31. Comparing two zoomed ECG segments
1 Displays the same QRS complexes in other
leads
2 Displays the average beats, returns you to the
10-s ECG or to the interpretation
3 Moves ECG 2 up and down
4 Moves ECG 2 to the right and left
.
Move the cursor to the region of interest (the cursor
becomes a magnifying glass) and click. You will see a
display similar to that shown in Figure 4.1-31.
You can move ECG 2 up/down/right/left, using buttons
and
.
You can perform measurements on the ECG (amplitudes, intervals, slopes) as described in section 4.1.4
“Measuring the ECG”.
Clicking
ments.
returns you to the 10-second ECG seg-
The median complexes and the interpretation can be
compared in the same way. Click
and
to
display them.
227 498 02-A
CardioSys V 4.1
69
The Resting ECG / Comparing Resting ECGs
Comparing Median Complexes from Multiple Resting
ECGs
Hellige
Patient
Procedure
System Services Help
Baker, Dave, 41yrs
REST ECG / Comparison of Medians
10mm/mV
I...aVF
I
1
II
2
ST values
3
Click
aVL
aVR
III
4
5
.
aVF
10 mm/mV 25 mm/s
12.10.1996
11:08:14
A window opens showing all resting ECGs of the patient in
question (Figure 4.1-29).
6
12.10.1996
10:13:09
Select 2 to 5 ECGs and click on
window.
OK
to clear the
08.10.1996
10:43:43
The next screen shows the median complexes of the selected
procedures (Figure 4.1-32).
Figure 4.1-32. Comparing median complexes
1 Changes the signal size
2 Displays the other 6 leads
3 Displays/removes the ST values
4 Activates the zoom function
5 Prints the screen
6 Procedure date
The signal size (amplitude) can be changed with
Figure 4.1-32). Other leads can be selected with
(1,
(2).
If you wish to have the ST values annotated, check
ST values
.
Another useful function is the presentation of a large-scale
single median complex together with the same ST beat of the
other leads in the form of a so-called 3D graph:
First, click on
, then on the ST beat you wish to see.
A display similar to Figure 4.1-33 will appear.
70
CardioSys V 4.1
227 498 02-A
The Resting ECG / Comparing Resting ECGs
On this screen you can check 3D graph (4, Figure 4.1-33) to
view a three-dimensional presentation of the beat (Figure
4.1-34).
Hellige
Patient
Procedure
System Services Help
Baker, Dave, 41yrs
REST ECG / Comparison of Medians
3D graph
12.10.1996 - 11:08:14
40 mm/mV 200 mm/s
II
0,05 mV
0,10 mV/s
1
2
3
4
Figure 4.1-33. Zoomed display
1 For display of the median complex as shown
from the other leads
2 To return to the ST comparison screen
3 To print out the screen display
4 To activate the 3D presentation
Hellige
Patient
Procedure
System Services Help
Baker, Dave, 41yrs
REST ECG / Comparison of Medians
+
12.10.1996 - 11:08:14
3D graph
-
40 mm/mV 200 mm/s
II
1
2
3
4
5
08.10.1996 - 08:08:15
09.10.1996 - 12:25:04
12.10.1996 - 11:08:14
227 498 02-A
Figure 4.1-34. 3D presentation
1 For display of the same beat as shown from the
other leads
2 To return to the ST comparison screen
3 To increase or reduce the distance between the
waveforms
4 To return to the zoomed display
5 To select another viewing angle
CardioSys V 4.1
71
The Resting ECG / Printing the Resting ECG
4.1.6 Printing the Resting ECG
Print
Sütterlin, Franz, 48 J
Pages to print
Aufnahme 1
Aufnahme
X Standard
Page2
Ruhe-EKG / Vergleichen / 10 Sekunden
1
Procedure Date:
10.08.1994 · 11:32:51
10.08.1994
Dom.· 11:32:51
Median
Subdom. Median
ECG Format
10
2
10-sec. ECG segment
Measurements
Gain
10
mm/mV
10
mm/mV
Interpretation
(Physician/Program)
(Physician/Program)
Click
0
mm/s
10 mm/mV 25 mm/s
35Hz
0
Print
II
ECG Grid
5 mm
Number of Copies
1
The scope of the printed report is determined on the print
setup screen (Figure 4.1-35).
mm/mV
25
0
Rhythm Lead
50 Hz
Speed
Interpretation
1
Interpretation
Leads/Page10 mm/mV 25 mm/s 35Hz
System
12
X Physician
Gain
Display Format
continuous 10 sec.
Gain
1
01.08.94 · 11:40:23
Barcode/Patient ID (22 chrs)
EPSON EPL 5700 (LPT1)
50 Hz
The report includes the following documents:
Cancel
Save
Modify…
Figure 4.1-35. Resting ECG print setup screen
1 Number of pages of the entire report
2 Document selected for printout
to call up the print setup screen.
Help
–
–
–
–
Standard Page
Medians
10-second ECG segments
Interpretation
Clicking the box in front of each of these documents includes
them in or excludes them from the report (check mark =
included). The length of each document and of the overall
report is also indicated.
The
The
Print
Save
button initiates the printout.
button saves the current settings.
Standard Page (Figure 4.1-36)
For the ECG display you can choose between:
continuous 10 sec:
first 5-second segment of the first set of
six leads, second 5-second segment of
the second set of six leads or
sync 5 sec/
sync 2.5 sec:
synchronized segments of all 12 leads
(the first 5 seconds or the first 2.5 seconds)
Figure 4.1-36. Report page, standard format
72
CardioSys V 4.1
227 498 02-A
The Resting ECG / Printing the Resting ECG
medians:
the dominant average beats (medians)
will be printed
continuous 2.5 sec:
3 leads each of second 1 to 2.5, 2.5 to
5, 5 to 7.5, 7.5 to 10
2 x 6 ch. 50 mm/s:
2 pages, the first set of 6 leads from
second 1 to 5, the second set of 6 leads
from second 5 to 10
w/o. Arrhy 25 mm/s: without rhythm strip
w/o. Arrhy 50 mm/s: without rhythm strip
portrait:
the standard page is printed in the
vertical (portrait) format.
H1:
12 median complexes + V1, II, V5, V2,
V3, V4
H1:
12 median complexes + I, II, III, V1,
V2, V5
Dom. Median/Subdom. Median (Figure 4.1-37)
You can print a page with the dominant average medians and
with the subdominant medians, if these were found as well.
For more information, you may add either the measurements
or the ST profile.
Figure 4.1-37. Report page, medians
227 498 02-A
CardioSys V 4.1
73
The Resting ECG / Printing the Resting ECG
10-second ECG segment (Figure 4.1-38)
Here you set up the system for printout of the full 10-second
ECG. You can choose to print either 6 or 12 leads/page and
you select the gain and paper speed. The resulting number of
pages to be printed is indicated.
Interpretation (full) (Figure 4.1-39)
In this window you set up the system for printout of the full
interpretation (interpretation as derived by the system and/or
physician’s interpretation).
Figure 4.1-38. Report page, 10-s ECG segments
Rhythm Lead
The standard page and the interpretation page include the 10second ECG strip of the rhythm lead. However, you can
select another channel to be printed.
Printer
Selection of the printer model and port (LPT) to which the
printer is connected.
Barcode/Patient ID
Figure 4.1-39. Report page, interpretation
74
The patient ID no. can be annotated on the report in the
form of a barcode. This allows you to scan the code with a
barcode reader and thus assign the report to the correct patient.
CardioSys V 4.1
227 498 02-A
The Resting ECG / System Defaults
Setup
Speed (mm/s)
25
Gain (mm/mV)
10
Lead check noise level
low
X 1-mV Cal Pulse
Audible LEAD OFF Alarm
Manual Override
QTC Calculation
Hegglin-Holzmann
Lead Sequence
STANDARD
Rhythm Lead
II
Print after Analysis
Report
4.1.7 Setup
Hellige
Setup
40-Hz Filter
Modify
50-Hz Filter
From the setup menu you can select a number of system
settings to suit your personal needs and preferences. These
settings will be retained. They are automatically activated each
time the system is turned on.
Spline
Click
Setup
(Figure 4.1-40).
Modify
to display the setup menu screen
OK
Cancel
Use this screen to select your personal system settings.
Help
Figure 4.1-40. Setup menu
Adjustments are made in three different ways:
1
There is an arrow at the end of a box ( ).
Clicking this arrow will open a window which offers
various options. Select the desired setting by clicking the
mouse button.
2
There is a check box in front of the function. Click the
box to enable or disable the function ( X function
enabled).
3
Click the Modify… button (for instance, to select the Lead
sequence).
Speed
selects the trace sweep speed
Gain
selects the signal size (amplitude)
227 498 02-A
CardioSys V 4.1
75
The Resting ECG / System Defaults
Lead check noise level
This is a measure of the quality of the acquired signal (signalto-noise ratio). When there is too much signal noise at the
electrode, the electrode is displayed yellow on the signal
acquisition screen. The setting that you select here (low,
middle, high) changes the threshold as of which the electrode
is displayed yellow (high sensitivity to noise = low threshold).
1-mV Cal Pulse
display of 1-mV calibration pulse: yes or no (
X
yes)
Audible LEAD OFF Alarm
audible signal when an electrode is disconnected: yes or no
( X yes)
Manual Override
When the function is enabled, the program will start the
signal acquisition, even if not all electrodes are applied.
QTC Calculation
Equation for calculation of the QT interval: HEGGLINHOLZMANN or BAZETT.
Hellige
Setup
Speed (mm/s)
25
Gain (mm/mV)
10
Lead check noise level
low
QTC Calculation
Hegglin-Holzmann
Lead Sequence
STANDARD
Rhythm Lead
Print after Analysis
Report
X 1-mV Cal Pulse
Audible LEAD OFF Alarm
Manual Override
40-Hz Filter
Modify
STANDARD
II
CABRERA
HIGH
Modify
NEHB
RIGHT
LEFT
50-Hz Filter
Anti-Drift System
OK
Cancel
Help
Figure 4.1-41. Lead sequence selection window
76
Lead Sequence
In the lead sequence window you can assign the leads to the
recording channels. Six lead sequences are predefined. Four of
these (sequences 3 to 6) can be modified.
STANDARD:
CABRERA:
HIGH:
NEHB:
RIGHT:
LEFT:
CardioSys V 4.1
I, II, III, aVR, aVL, aVF, V1...V6
fixed
aVL, I, -aVR, II, aVF, III, V1...V6
I, II, III, aVR, aVL, aVF, V1'...V6'
I, II, III, aVR, aVL, aVF, D, A, J, I, II, III
I, II, III, aVR, aVL, aVF, V4R, V3R, V1, V2, V3, V4
I, II, III, aVR, aVL, aVF, V4, V5, V6, V7, V8, V9
227 498 02-A
The Resting ECG / System Defaults
Modify…
HIGH
Lead
25
Speed (mm/s)
Gain (mm/mV)
1
2
Lead check noise level
3
QTC Calculation
Lead Sequence
Rhythm Lead
Print after Analysis
Report
I
Modifying the Lead Sequence
Hellige
Lead
Sequence
Defaults
Sequence
X 1-mV Cal Pulse
I
10
Click to the right of Lead Sequence to open the lead
sequence selection window (Figure 4.1-41).
Audible LEAD OFF Alarm
II
II
Manual Override
low
III
III
4
aVR
aVR
Hegglin-Holzmann
5
aVL
aVL
STANDARD
6
aVF
II
aVF
7
V1
V1'
8
V2
V2'
9
V3
V3'
10
V4
V4'
11
V5
12
V6
40-Hz Filter
Modify
50-Hz Filter
Anti-Drift System
Click the sequence that you wish to modify (lead sequences 3 to 6 only).
Modify
OK
OK
V5'
Cancel
Cancel
V6'
Help
Help
Click Modify… to open a window showing all channels
(Figure 4.1-42). There is a window for each of the
channels indicating the lead currently assigned to that
channel. To select another lead click to display all
available leads (Figure 4.1-43).
Figure 4.1-42. Modifying the lead sequence
Select the new lead to be recorded in the respective
channel.
HIGH
Speed (mm/s)
Lead25
Hellige
Lead
Sequence
Defaults
Enter up to 4 characters in the “Designation” column to
label the lead.
Sequence
X 1-mV Signal
I
Gain (mm/mV)
Lead check noise level
QTC Calculation
Lead Sequence
Rhythm Lead
Print after Analysis
Report
10
I
II
low
III
aVR
aVL
Hegglin-Holzmann
aVF
V1
STANDARD
V2
V3
II
V4
V5
V6
D
A
J
Audible LEAD OFF Alarm
Once you have assigned a new lead to each of the channels,
you can enter a name for the lead sequence in the headline.
40-Hz Filter
Modify
Anti-Drift System
Move the cursor to the text box and click.
Modify
Enter a name and select
OK
OK
Cancel
Cancel
Help
Help
Figure 4.1-43. Modifying the lead sequence
227 498 02-A
50-Hz Filter
OK
to clear the window.
OK
Click
(modifications are saved) or Cancel
(modifications are ignored) to clear the configuration
screen.
CardioSys V 4.1
77
The Resting ECG / System Defaults
Rhythm Lead
rhythm or reference lead
Print after Analysis
Do you wish to print the report set up on the screen mentioned above immediately after the ECG analysis or not.
Report Modify
Here you determine the scope of the report printed with the
“Print after Analysis” command. The special configuration
screen is described in detail in section 4.1.6 “Printing the
Resting ECG”.
40-Hz Filter
enables or disables muscle filter (
50-Hz/60-Hz Filter
enables or disables AC filter (
X
X
muscle filter on)
AC filter on)
Spline
Enables or disables the Cubic Spline algorithm (automatic
baseline correction, X Spline on); the algorithm causes a
signal delay of 4 seconds. On the signal acquisition and
control screen the algorithm can be disabled temporarily to
view the undelayed ECG signal.
78
CardioSys V 4.1
227 498 02-A
The Resting ECG / Brief Operating Instructions
4.1.8 Recording a Resting ECG
(Brief Operating Instructions)
Turn on system and display the resting ECG
screen
Enter new patient or retrieve patient from the
database
Apply electrodes and check signal quality
OK
mm/mV
Enter test information
Select procedure parameters (sweep speed, sensitivity, lead sequence)
Watch ECG traces and – when the most recent 10
seconds are without artifacts – start recording
Save procedure (when patient data were entered,
the system saves the recording automatically)
The ECG traces are displayed
Scroll through the procedure report pages or call
them up directly from the table of contents
Print the ECG
Proceed to next procedure or
Quit program
227 498 02-A
CardioSys V 4.1
79
The Resting ECG
For your notes
80
CardioSys V 4.1
227 498 02-A
The Exercise ECG
4.2 The Exercise ECG
This section describes the operating steps necessary to
conduct an exercise test. You will learn how to
–
apply the electrodes and connect the patient
–
enter the test demographics (indication, medication,
comments, etc.)
–
select a protocol and run the exercise test
–
call up the report pages for on-screen review
–
print reports
–
specify system defaults that will be activated each time
the system is turned on
–
monitor remote test stations
–
conduct an exercise test, using the function keypad
The brief operating instructions at the end of the section
sum up what you have to do to record an exercise ECG.
227 498 02-A
CardioSys V 4.1
81
The Exercise ECG / Some Basic Facts
4.2.1 Some Basic Facts
Test Information
Library: Reason for Test
ABE
History of chest discomfort
Evaluate effect of medication
Evaluate effect of CABG
Evaluate effect of PTCA
Evaluate functional capacity
Stress echo study
Stress thallium study
Rule out/confirm CAD
Post-MI study
...
Blood Press [mmHg]
Medication
Reason for Test
F
A
B
A
C
»
☞
Protocol
Bruce
Target HR(%) 100
sys
180/min
dia
…
Click on
Comment
OK
Physician:
Cancel
Technician:
Help
Referring Physician:
Figure 4.2-1. Dialog window for entry of the test information
82
Before recording your first exercise ECG, go to the
defaults screen and choose the basic system settings
(section 4.2.7 “Exercise Test Setup”). These settings will be retained and are automatically
activated each time the system is turned on.
to start the program
After you have selected the patient, the system displays the
dialog window for entry of the test information (Figure 4.2-1)
(unless this option was deselected in the System configuration). We recommend applying the electrodes to the patient,
following the instructions given in section 4.2.2, before
entering the test demographics.
CardioSys V 4.1
227 498 02-A
The Exercise ECG / Applying the Electrodes
4.2.2 Applying the Electrodes
C1
C3R
C4R
C2
C3
Careful application of the electrodes is a prerequisite for
obtaining an interference-free ECG. The signal acquisition
screen immediately gives you a visual indication of your
electrode technique and of the signal quality, provided the red
R electrode is applied.
C5
C4
C8
C6
C7
For quick, reliable and trouble-free application of the electrodes we recommend our Electrode Application System (refer
to the Electrode Application System operator’s manual).
C6
C4R
C3R C1 C2 C3 C4
C5
As an alternative you can use our disposable electrodes
(919 200 31, pkg. of 200).
Skin Preparation
Figure 4.2-2. Electrode application points
C1 in the 4th intercostal space at the right
sternal edge
C2 in the 4th intercostal space at the left sternal
edge
C3 at the level of the 5th rib midway between
C2 and C4
C4 in the 5th intercostal space on the left
midclavicular line
C5 on the left anterior axillary line between C4
and C6
C6 on the mid-axillary line at the level of C4
C7 in the 5th intercostal space on the left
posterior axillary line
C8 in the 5th intercostal space on the left
scapulary line
R, L on the right and left shoulders
N, F above the right and left kidneys
227 498 02-A
*
Shave the electrode application points, if necessary.
*
Carefully degrease the application points with a cotton
swab soaked in benzine.
*
Prep the application points with skin prepping paste
(EPICONT). To do so, apply a small amount of paste to
the tip of a cotton swab. Place the tip against the skin at
the electrode site and twirl the swab 4 to 5 times between
your thumb and index finger, lightly pressing on the swab.
*
Connect the electrode leads to the electrodes.
*
Remove the backing paper from the electrodes and press
the electrodes firmly into place.
*
Secure each electrode lead with surgical tape.
CardioSys V 4.1
83
The Exercise ECG / Applying the Electrodes
*
N black
R red
above right kidney
Secure the patient cable with a holder 303 441 61 (bicycle ergometer) or with a strap 923 096 72 (treadmill).
on right shoulder
C1 white
C1
C2 white
C3 white
C2
C3
C5
C6
C4
Electrode Application Points for Standard Leads
C4 white
(I, II, III, aVR, aVL, aVF, V1 to V6)
C5 white
C6 white
C8
L yellow
C7
on left shoulder
F green
C6
above left kidney
C1 C2 C3 C4
C5
Figure 4.2-3. Connecting the patient cable (10-wire, standard
ECG leads)
☞
☞
84
Please observe the information given in sections
7.1 “Artifact Due to Poor Electrode Application”,
7.2 “ECGs of Pacemaker Patients” and 7.3 “ECG
Recording During Defibrillation” in the appendix.
The red R electrode is the reference electrode.
Placement and signal quality of all other electrodes can be assessed on the signal acquisition
screen only when this electrode is applied.
Four limb and six chest electrodes are usually required for the
acquisition of the standard leads. In stress testing, however,
we recommend attaching the limb electrodes on the shoulders
(where there are no muscles) or above the kidneys (Figure
4.2-2).
*
Connect the patient cable as shown in Figure 4.2-3.
*
Secure the electrode distributor of the patient cable
(chest strap or holder).
*
Connect the patient cable to the device (type CF signal
input: highly isolated, suitable for intracardiac application, defibrillation-proof).
CardioSys V 4.1
227 498 02-A
The Exercise ECG / Entering the Test Information
4.2.3 Entering the Test Information
Test Information
Library: Reason for Test
ABE
History of chest discomfort
Evaluate effect of medication
Evaluate effect of CABG
Evaluate effect of PTCA
Evaluate functional capacity
Stress echo study
Stress thallium study
Rule out/confirm CAD
Post-MI study
...
1
Reason for Test
F
»
Protocol
dia
Medication
Technician:
C
3
180/min
4
These are:
–
the reason(s) for the test
–
the test protocol
–
the target heart rate
–
the blood-pressure readings
–
the medication(s)
–
comments
–
the names of the physician, of the referring physician
and/or user (ECG technician).
OK
7
Cancel
Help
Referring Physician:
Figure 4.2-4. Test Information dialog window
1 The standard reasons for test
2 The patient’s reason for test
3 Test protocol
4 Target HR in %
5 Blood-pressure readings
6 Medication
7 Dialog boxes for comments, the physician’s name
and the technician’s (user’s) name
227 498 02-A
The test information window allows you to make all entries
and settings relevant to the test.
…
Comment
Physician:
A
Bruce
Target HR(%) 100
5
sys
B
2
6
Blood Press [mmHg]
A
CardioSys V 4.1
85
The Exercise ECG / Entering the Test Information
ABE
F
Copying Reasons for Test to the Patient Indication Window
Modify Library: Reason for Test
History of chest discomfort
Evaluate effect of medication
Evaluate effect of CABG
Evaluate effect of PCTA
Evaluate functional capacity
Stress echo study
Stress thallium study
Rule out/confirm CAD
Post-Ml study
…
…
…
Highlight the statement by clicking.
Click the
OK
button.
Cancel
If you wish to delete a copied statement or part of it,
highlight the words in question and click
A .
Help
Figure 4.2-5. Window for entry of standard reasons for test
☞ A reason for test is easily copied from the library
to the right window by double-clicking!
The deleted words can be inserted in another position by
placing the cursor there and clicking B A C .
You can also enter a reason for test directly by moving
the cursor to the desired position and typing the text.
Editing the Library
Click
ABE
F
.
This will open the library window (Figure 4.2-5).
Move the cursor to the desired position in the list and
click the mouse button.
Enter a reason for test, and press
on the keyboard.
The cursor moves to the beginning of the next line.
In this manner you may enter up to 12 standard reasons.
When the window is full, it will not accept any more
OK
entries. Click
to clear the window.
86
CardioSys V 4.1
227 498 02-A
The Exercise ECG / Entering the Test Information
Selecting a Test Protocol
Test Information
Library: Reason for Test
ABE
History of chest discomfort
Evaluate effect of medication
Evaluate effect of CABG
Evaluate effect of PTCA
Evaluate functional capacity
Stress echo study
Stress thallium study
Rule out/confirm CAD
Post-MI study
...
Blood Press [mmHg]
Reason for Test
F
A
B
A
C
»
Protocol
The program defaults to the test protocol specified in the
Exercise Test Setup (section 4.2.7). On this screen, however,
you can choose another protocol for the present test.
Bruce
Bruce
Bruce
Target HR(%) 100
sys
dia
Medication
…
180/min
ModBruce
Naughton
Ellestad
ModBalke
USAFSAM
SlowUSAFSAM
Cornell
Comment
OK
Physician:
Cancel
Technician:
Help
Click on
.
The protocol list box opens (Figure 4.2-6).
Click on the protocol you wish to use.
Referring Physician:
Adjusting the Target HR
Figure 4.2-6. Protocol selection window
The target heart rate that the patient is expected to attain
during the test can either be adjusted manually, or the system
will calculate this value automatically (section 4.2.7 “ExerciseTest Setup ”). Furthermore, you can change the calculated or
entered value (e.g. 90% of 180 = 162). This setting will be
retained.
Entering Blood-Pressure Readings
Blood-pressure readings are either entered directly via the
keyboard or they are selected and changed in steps of 5 mmHg
by clicking on the arrow boxes. In the systolic box, the values
start from 120 mmHg, in the diastolic box, from 80 mmHg.
☞
Click on
click on
to display and increase the value, or
to decrease the value.
Move the cursor to the “sys” box and click the left mouse
button.
Enter the value via the keyboard.
Proceed in the same manner to enter the diastolic value.
227 498 02-A
CardioSys V 4.1
87
The Exercise ECG / Entering the Test Information
Test Information
Library: Reason for Test
ABE
Blood Press [mmHg]
Reason for Test
F
History of chest discomfort
Evaluate effect of medication
Evaluate effect of CABG
Evaluate effect of PTCA
Evaluate functional capacity
Stress echo study
Stress thallium study
Rule out/confirm CAD
Post-MI study
...
Physician:
Technician:
Referring Physician:
B
C
Selecting a Medication, Assigning a Drug Name to a
Medication Group
»
Protocol
Bruce
Target HR(%) 100
sys
180/min
dia
Medication
Comment
A
A
You can select a medication from a list of medications . You
can also select 4 more medications and assign specific drugs to
the medication groups to include these in the list instead of
the group name. The window permits entry of the medication
dose … .
…
none
unknown
medication stopped
nitrates
beta-blockers
…
Making a Selection
OK
Cancel
Help
Click on
4.2-7).
to open the medication list box (Figure
Figure 4.2-7. List of medication groups
Select one of the medications.
☞
The physician is responsible for assigning drugs to a
medication group.
To select additional medications, to enter a medication
dose or to assign drug names to medication groups, click
… .
Assigning Drugs to a Medication Group
Medications…
Medication
Medication Group
Click on
Medications…
.
Drug Name
none
–>
unknown
–>
medication stopped
–>
nitrates
–>
beta-blockers
–>
diuretics
–>
anti-hypertensives
–>
digitalis
–>
Ca antagonists
–>
antiarrhythmics
–>
OK
glycoside
–>
Cancel
A window opens, showing several medication group names
(Figure 4.2-8). There is a drug name window for each of these
groups. Click on the respective text box, if you wish to enter a
name. Then type the drug name.
Furthermore, you are free to arrange the medication groups
any way you want. To do so
–>
Click on the
at the end of the group name box.
Figure 4.2-8. Assigning a drug to a medication group
88
CardioSys V 4.1
227 498 02-A
The Exercise ECG / Entering the Test Information
This brings up a new window where you can choose one of
the group names (Figure 4.2-9).
Medication
Medication Group
Drug Name
none
none
unknown
unknown
medication stopped
nitrates
nitrates
beta-blockers
diuretics
beta-blockers
anti-hypertensives
diuretics
digitalis
Ca
antagonists
anti-hypertensives
antiarrhythmics
digitalis
glycoside
–>
Ca antagonists
–>
antiarrhythmics
–>
OK
glycoside
–>
Cancel
–>
Click on the drug name box and enter the name
–>
–>
–>
Click on
–>
OK
to clear the window.
–>
–>
–>
Entering Comments
If you wish to enter a comment on the test procedure, click in
the “Comment” text box and key in the text.
Figure 4.2-9. Editing the medication group
Physician’s/User’s Name
The names of the physician and user can either be entered
here (click in the text box and type the name), or they can be
selected from the list of the registered system users (section
6.1 “System Configuration”).
Click on
on it.
and choose a name from the list by clicking
Exiting the Test Information Screen
Once you have entered all test information, you can either
227 498 02-A
–
clear the window with
the exercise test or
–
clear the window with Cancel
(in this case the test
demographics will be ignored and are not assigned to the
test) to display the preacquisition screen
CardioSys V 4.1
OK
and start conducting
89
The Exercise ECG / Entering the Test Information
From the preacquisition screen, you can
–
check the signal quality
–
return to the test information screen
–
access the system setup screen
–
temporarily modify the selected phase with Modify…
(enter test information before modifying the test phase,
otherwise the changes will be lost).
Please refer to section 4.2.7 for a detailed explanation of the
preacquisition screen and the exercise-test setup.
If you select
to clear the window, the entries just
made will be assigned to the present test procedure and the
preacquisition screen will appear. In the next section we will
explain how an exercise test is conducted.
90
CardioSys V 4.1
OK
227 498 02-A
The Exercise ECG / Running an Exercise Test
I
Baker, Dave, 41 yrs.
00:421
2
00:42
4.2.4 Running an Exercise Test
Exercise Test
W
+
0 +
-
HR[BPM]
4 Phase>>
6
WHO
3 Hold5 Stage>> RPM 7
Lead Check
12
10 BP/Comment
15
14 Freeze ECG
Event Mark
13 ST/Medians 16 Trends
11Print
#1
% of 179
RPP
8 85
SYS/DIA (mm/Hg)
Interpretation
9
ECG Strips
VPB/min
QRSL
1
V2
V3
V4
2
3
4
1,88 mV/s
0,07 mV
E
J
10 mm/mV
X
ADS
5s
18
19
V6/Scan
V5
V6
1
17
V1
1,88
Rest
0,07
J+60 ms
20
25 mm/s
21
Figure 4.2-10. Signal acquisition screen for a bicycle exercise test
1 Time elapsed in current phase
2 Time elapsed in stage
3 Stage number
4 Current phase and button to modify the protocol
5 Buttons to hold the stage and to proceed to the next stage
6 Button to proceed to the next phase
7 Current load and revolutions/minute, buttons to increase or
decrease the load in steps of 5 Watts
8 Windows indicating the heart rate and the rate-pressure
product (RPP) (HR in red when max. HR is exceeded),
diagram of the % of the max. HR
9 Blood-pressure values (with some ergometers the cuff pressure
is indicated here during a BP measurement)
10 Button to abort the test
11 Button to initiate a printout (laser printer or thermal-array
printer)
12 Button for entry of comments and blood pressure
13 Button to mark an event episode (the episode is saved at the
same time)
14 Button to verify the ECG signal quality (all leads)
15 Button to freeze and release the signal traces
227 498 02-A
The signal acquisition screen appears when you have entered
the test information and clear the dialog window with
OK
. For bicycle ergometers the screen is similar to
Figure 4.2-10, for treadmills it is similar to Figure 4.2-11.
Please take a few seconds to become familiar with all the
details shown on this screen, before proceeding to start the
test.
16 Buttons to display the ST profiles and medians, the trends
and the stored ECG
17 Results of the arrhythmia analysis (complex ectopy in red)
and number of VPB/min
18 ST median beat window and ST analysis results (resting
beat analysis results are shown with a different color)
19 Button for selection of another lead
20 Buttons for adjustment of the E, J, and J+X point (only
when “Manual” has been selected in the Defaults menu)
21 Procedure parameters and buttons to modify the signal
sensitivity and to temporarily disable the ADS (anti-drift
system)
CardioSys V 4.1
91
The Exercise ECG / The Signal Acquisition Screen of an Exercise Test
I
Baker,Dave, 41 yrs.
Exercise Test
+
6 mph
00:421 P-Bruce 4 Phase>>
+
% 7
3
Hold
Stage
>>
Supine
2
5
00:42
Lead Check
12
10 BP/Comment
15
14 Freeze ECG
Print Rhythm
Event Marker
13 ST/Medians 16 Trends
11
HR[BPM]
Stop Treadmill
8
9 85
Start Treadmill
RPP
Interpretation
SYS/DIA (mm/Hg)
ECG Strips
VPB/min
VPB
17
V1
1
V2
V3
V4
2
3
4
5s
18
19
V6/Scan
1,88 mV/s
0,07 mV
E
J
1,88
Rest
0,07
J+60ms
J+60
ms
20
V5
10 mm/mV
V6
1
X
ADS
25 mm/s
21
Figure 4.2-11. Signal acquisition screen for a treadmill exercise
test
1 Time elapsed in current phase
2 Time elapsed in current stage
3 Stage number/name
4 Current phase and button to modify protocol
5 Buttons to hold the stage and to proceed to the next stage
6 Button to proceed to the next phase
7 Current speed and grade, buttons to increase or decrease the
speed and the grade
8 Buttons to start and stop the treadmill (protocol continues)
9 Windows indicating the heart rate, rate-pressure product
(RPP) and the blood pressure
10 Button to abort the test
11 Button to initiate a printout (laser printer or thermal-array
printer)
12 Button for entry of comments and blood pressure
13 Button to mark an event episode (the episode is saved at the
same time)
14 Button to verify the ECG signal quality (all leads)
15 Button to freeze and release the signal traces
92
The Signal Acquisition Screen of an
Exercise Test
The signal acquisition screen (Figure 4-11) of the exercise test
presents the following information:
–
the current load and RPM or speed and grade (7)
–
the current stage (3) and the time elapsed in that stage (2)
–
the current phase (4) and the time elapsed in that phase (1)
–
the heart rate, RPP and blood pressure (9)
–
the results of the arrhythmia analysis (complex ectopy in
red) and number of VPB/min (17)
–
the ST analysis results compared with the resting beat
analysis results (18) (“Scan” indicates that the lead with
the most prominent ST depression is displayed (leads I,
aVR, aVL, V1 and V2 are not considered))
–
various procedure parameters (21)
16 Buttons to display the ST profiles and medians, the trends
and the stored 12-lead ECG
17 Results of the arrhythmia analysis (complex ectopy in red)
and number of VPB/min
18 ST median beat window and ST analysis results (resting
beat analysis results are shown with a different color)
19 Button for selection of another lead
20 Buttons for adjustment of the E, J, and J+X point (only
when “Manual” has been selected in the Defaults menu)
21 Procedure parameters and buttons to modify the signal
sensitivity and to temporarily disable the ADS (anti-drift
system)
CardioSys V 4.1
227 498 02-A
The Exercise ECG / The Elements of an Exercise Test
The Elements of an Exercise Test
Ergometers without Digital Communication Interface
(e.g., MEDITRONIC M 400)
With these ergometers, the test follows the stored test phases.
This is to say that the initial load and load increase displayed
in the protocol have to be adjusted manually at the ergometer.
Manual modifications of the protocol (load increase or selection of the next test phase) must also be repeated at the ergometer.
On the setup screen (section 4.2.7) select the “internal”
ergometer.
If you wish to obtain a recording at the end of each load
stage only, set the “ECG Rec. Inter. EI” to the duration
of the load stage.
Select a protocol and adjust the required initial load at
the ergometer.
Click the
button. Wait for the first ST measurement to be displayed which is to be saved as the
reference beat at rest (option) (18, Figure 4.2-10 and
Figure 4.2-11).
As trend values are saved at 30-second intervals, we recommend that you wait approx. 30 seconds before starting to
pedal.
Then press the
start pedalling.
227 498 02-A
CardioSys V 4.1
Phase
>>
button and ask the test subject to
93
The Exercise ECG / The Elements of an Exercise Test
Window (2) in Figure 4.2-10/4.2-11 indicates the remaining
time in the current stage, while window (1) shows the time
elapsed in that phase.
During the test you can
advance to the next load stage with
At the end of the load stage, the load increase displayed by the
program must be adjusted at the ergometer. As a general rule
you are required to repeat all load changes at the ergometer as
demanded by the program.
continue at the same load with
Stage
>>
Hold
modify the load in steps of 5 Watts with
+5
and
-5
advance to the recovery phase with Phase >> (upon completion of the last stage, the program automatically activates
the recovery phase)
terminate the test with
Pre-Test
.
Test Phase
Recovery Phase
Change load as
required by
protocol
Adjust initial load
of selected
protocol
Test Information
Prot. 1
Select protocol.
Check recording
interval
Phase
>>
Pedal!
When analyzing
ST segment, wait
for 1st results to
be displayed
Stage
>>
Hold
Phase
>>
Automatic, when
last stage is
completed, or
manual
Figure 4.2-12. Program sequence with MEDITRONIC M 400
94
CardioSys V 4.1
227 498 02-A
The Exercise ECG / The Elements of an Exercise Test
Ergometers without Digital Communication Interface but with Remote Start Capability (e.g., MEDITRONIC M 40)
As above, but there is no need to select the next phase manually at the ergometer, as this is done by the remote start signal.
As trend values are saved at 30-second intervals, we recommend
that you wait approx. 30 seconds before starting to pedal.
Then press the Phase >> button and ask the test subject to
start pedalling. If your ergometer sends a remote start
impulse when the patient starts pedalling, there is no
need to click the Phase >> button.
On the setup screen (section 4.2.7) select the “intern.
remote start” ergometer.
If you wish to obtain a recording at the end of each load
stage only, set the “ECG Rec. Inter. EI” to 00:00 min.
For “Time in stage” (TS) enter a time which is considerably longer than the corresponding value at the ergometer.
Window (2) in Figure 4.2-10 indicates the remaining time in
the current stage, while window (1) shows the time elapsed in
that phase.
During the test you can
Select a protocol and adjust the corresponding initial
load at the ergometer.
modify the load in steps of 5 Watts with + 5 and
-5
; do not forget to make the same adjustments at the
ergometer
Click the
button. Wait for the first ST measurement to be displayed (option) (18, Figure 4.2-10/
4.2-11).
advance to the recovery phase with Phase >> (upon completion of the last stage, the program automatically activates
the recovery phase)
terminate the test with
Pre-Test
.
Test Phase
Recovery Phase
Interactive load
change (+5 W) and
adjust load for
recovery phase
Adjust initial load
and load increase /
stage of selected
protocol
Test Information
Prot. 1
Select protocol.
Check recording
interval
Phase
>>
Pedal!
When analyzing
ST segment, wait
for 1st results to
be displayed
+5
Phase
>>
Automatic, when
last stage is
completed, or
manual
Figure 4.2-13. Program sequence with MEDITRONIC M 40
227 498 02-A
CardioSys V 4.1
95
The Exercise ECG / The Elements of an Exercise Test
Ergometers with Digital Communication Interface (ERGOCOMP EC 560/ECB 561 / ERGOLINE 900/900L, EC 1200 V3.52)
The EC 1200 will display the version number when turned
on. The following explanations refer to version 3.52 or higher
(upgrade, if possible). For older versions, see section “M 700
and EC 1200”.
With ERG 900, select the recovery phase “recovery ERG
900” (25 W, 1 minute, then 0 W) only if you expect to
do a low-impact test. The BP meter will then respond
more promptly to the load decrease.
With these ergometers the selected protocol fully controls the
test procedure. The ergometer operating controls are inoperative. Only blood pressure measurements can be taken manually. Refer to Appendix 6 “Connecting External Devices”.
Select a protocol.
EC 1200
Blood pressure intervals are valid only for external BP meters
(appendix, section 6). BP meters must be connected directly
when used with EC 1200 version 3.52 and higher. They are
controlled by the stage time. The BP intervals are ignored.
On the setup screen (section 4.2.7) select
“ERGA” for EC 560/ECB 561,
“ERG 900” for ERGOLINE 900/900L and
“EC 1200 (V3.52)” for EC 1200 version 3.52 or higher.
Click the
A blood pressure measurement is now taken automatically, if
configured. Wait until the readings are available or until the
first ST measurement is displayed (option) (18, Figure 4.2-10).
As trend values are saved at 30-second intervals, we recommend that you wait approx. 30 seconds before starting to
pedal.
*
Ask the test subject to start pedalling.
Pre-Test
Test Information
Test Phase
Prot. 1
Select protocol.
Check recording
interval
button.
Pedal
When analyzing
ST segment, wait
for 1st results to
be displayed
+5
Hold
Recovery Phase
Phase
>>
Automatic, when
last stage is
completed, or
manual
Figure 4.2-14. Program sequence with ERGOCOMP EC 560 / ECB 561
96
CardioSys V 4.1
227 498 02-A
The Exercise ECG / The Elements of an Exercise Test
Window (2) in Figure 4.2-10 indicates the remaining time in
the current stage, while window (1) shows the time elapsed in
that phase.
During the test you can
hold the stage with Hold (must be pressed 5 s before the
end of a stage at the latest).
☞
When the number of revolutions is low, the
EC 1200 will automatically activate a load of
15 Watts and increase the load to the old value
when the speed picks up again. During that time,
the buttons Stage >> , + and – are inactive and the
program will not proceed to the next load stage.
advance to the next load stage with
(ERGOLINE 900/900L only)
Stage
>>
modify the load in steps of 5 Watts with + 5 and - 5
(with EC 1200 V3.52: next stage, previous stage, but
never below initial load)
advance to the recovery phase with Phase >> (upon completion of the last stage, the program automatically activates
the recovery phase)
terminate the test with
227 498 02-A
CardioSys V 4.1
.
97
The Exercise ECG / The Elements of an Exercise Test
M 700 and EC 1200
M 700
During the test you can
In conjunction with M 700 ergometers too, the selected
protocol fully controls the test procedure. During a test, load
changes are only possible at the ergometer and only for the
user-programmed phases. If you wish to create custom
protocols you will have to use the phases stored in the ergometer.
*
modify the load at the ergometer, but only for your own
custom-programmed phases
*
advance to the recovery phase with
*
terminate the test with
On the setup screen (section 4.2.7) select the “ERGS”
ergometer.
If you wish to obtain a recording at the end of each load
stage only, set the “ECG Rec. Inter. EI” to 00:00 min.
Ask the test subject to start pedalling.
Window (2) in Figure 4.2-10 indicates the remaining time in
the current stage, while window (1) shows the time elapsed in
that phase.
98
.
EC 1200
This ergometer comes with 7 preprogrammed phases (6
exercise phases, 1 recovery phase). In addition there are five
free phases.
button.
A blood pressure measurement is now taken automatically, if
configured. Wait until the readings are available or until the
first ST measurement is displayed (option) (18, Figure 4.2-10).
*
>>
In the program, 10 protocols have been created from these
phases. You are free to modify these protocols as needed.
Select a protocol.
Click the
Phase
Phase No.
8
9
10
11
12
1
2
3
4
5
6
7
32
CardioSys V 4.1
Name on Ergometer Display
OWN PROGRAM 1
OWN PROGRAM 2
OWN PROGRAM 3
OWN PROGRAM 4
OWN PROGRAM 5
WHO
ICSPE
ST. FRANCE
WHO NEW
HOLLMANN
REHA
not available for EC 1200
RECOVERY
227 498 02-A
The Exercise ECG / The Elements of an Exercise Test
If you call up an unconfigured phase (see above), the ergometer runs idle.
On the setup screen (section 4.2.7) select the “ERGS”
ergometer.
Window (2) in Figure 4.2-10 indicates the remaining time in
the current stage, while window (1) shows the time elapsed in
that phase.
During the test you can
If you wish to obtain a recording at the end of each load
stage only, set the “ECG Rec. Inter. EI” to 00:00 min.
modify the load at the ergometer
advance to the recovery phase with
Phase
>>
Select a protocol.
terminate the test with
Click the
.
button.
Wait until the first ST measurement is displayed (option)
(18, Figure 4.2-10).
As trend values are saved at 30-second intervals, we recommend that you wait approx. 30 seconds before starting to
pedal.
*
Ask the test subject to start pedalling.
Pre-Test
Test Phase
Interactive load changes only
at ergometer (with M700 only
for user-defined protocols)
Adjust initial load
and load increase /
stage of selected
protocol
Test Information
Prot. 1
Select protocol.
Check recording
interval
Recovery Phase
Pedal
Phase >>
When analyzing
ST segment, wait
for 1st results to
be displayed
Figure 4.2-15. Program sequence with MEDITRONIC M 700 / ERGOCOMP EC 1200
227 498 02-A
CardioSys V 4.1
99
The Exercise ECG / The Elements of an Exercise Test
☞ The treadmill can be stopped at any time with the
emergency stop button.
☞ When using the treadmill model TM400E, it is
important to adjust the same unit of speed measurement at the ergometer and at the CardioSys
system (km/h or mph).
☞ If the speed is “0” in one of the stages, the treadmill switches off and can only be restarted with
the Start Treadmill button.
☞ If the treadmill is stopped with the
Treadmills
From the setup menu (section 4.2.7), item “Ergom./
Treadmill” select:
– “Internal Treadmill” for treadmills without digital
interface
– “Series 2000” for treadmills 1800, 1900, T2000
– “TM 400E” for Trackmaster treadmills TM 310,
TM 400E
Select a test protocol.
Click on
At the beginning the program invokes the first stage (supine)
of the pre-test phase.
Stop Treadmill
button or with the emergency stop button, the
speed and grade readout is “**.*”. Wait until this
readout disappears before restarting the treadmill
with Start Treadmill .
At this stage, the resting ECG of the supine patient is recorded. Continue collecting the ECG signal until you see the
first ST analysis results (18, Figure 4.2-11) or the results of
the first BP measurement.
Pre-Test
Exercise Phase
Stage
Test Information
Select protocol.
Check recording
interval
.
>>
Start Treadmill
When analyzing
ST segments or measuring
the blood pressure, wait for
1st results to be displayed
Phase
>>
Stage
>>
Recovery Phase
Hold
Phase
>>
Automatically
on completion
of last stage, or
manually
Figure 4.2-16. Program sequence for the treadmill test
100
CardioSys V 4.1
227 498 02-A
The Exercise ECG / The Elements of an Exercise Test
☞
☞
Pressing the + or – button cancels the automatic
program sequence and activates the manual mode
(phase name “Manual”). The program maintains
the current stage for reasons of safety and the
Hold
and Stage >> buttons are locked. The test can
only be controlled manually with the + and –
keys (speed, grade). When you activate + and –
again after a pause of approx. 15 seconds, the
program displays the next higher stage number.
With the Phase >> button you advance to the next
test phase.
If the treadmill is stopped with the Stop Treadmill
button or with the emergency stop button, the
speed and grade readout is “**.*”. Wait until this
readout disappears before restarting the treadmill
with Start Treadmill .
Then you can proceed to the next stage ( Stage >> button, 5,
Figure 4.2-11) to record the ECG of the patient standing
upright.
The next stage is reserved for recording the ECG of the
hyperventilating patient.
Then the warm-up stage follows, in which the patient gets
used to the treadmill exercise.
Proceed to the next stage and start the treadmill with the
Start Treadmill
button (8, Figure 4.2-11).
Once the patient is familiar with walking on the treadmill,
initiate the actual test by clicking on Phase >> or by pressing the
“start exercise” button on the function keypad.
From now on, the program controls the entire test including
the recovery phase.
You can abort the test at any time by clicking the
button.
227 498 02-A
CardioSys V 4.1
101
The Exercise ECG / The Elements of an Exercise Test
Name:
Date of Birth:
P-Bruce
Supine
Dave Baker
05/05/1955 (41 yrs.)
Male, Caucasian, 145.0 lb, 79 in
00:31
Total Time 00:31
00:31
0.0 mph 0.0%
During the test you can:
Rhythm Report
Patient ID 12345
HR [BPM] 60
BP [mmHg]
(the reference numbers refer to Figures 4.2-10 and 4.2-11)
I
II
III
–
increase or decrease the speed and grade (7) (if you
interrupt the automatic program, the Hold and Stage >>
buttons are disabled and you have to control the rest of
the test manually) or prevent an automatic increase or
decrease with Hold (5)
–
proceed to the next stage with
–
proceed to the next phase with
–
briefly stop the treadmill during the test and restart it
with Stop Treadmill and Start Treadmill (8)
–
abort the test with
–
initiate a printout with Print Rhythm (11) (the laser
printer will print 1 page with approximately 4 seconds of
ECG data and the median beats, the thermal array
printer will print continuous rhythm (Figure 4.2-17)
until stopped again with Stop Rhythm ).
–
verify the ECG signal quality (14)
–
freeze the ECG (15) (the screen display only, one realtime lead continues to be displayed for monitoring)
–
display an event marker (13) (an event episode is stored
at the same time comprising a segment 5 seconds before
and 5 seconds after the mark)
AVR
AVL
AVF
V1
V2
V3
V4
Stage
>>
(5)
V5
V6
09/11/1996 09:51:09
10 mm/mV 25 mm/s
Figure 4.2-17. Example of a 12-lead rhythm report initiated
with Print Rhythm (thermal printer)
102
CardioSys V 4.1
Phase
>>
(6)
(10)
227 498 02-A
The Exercise ECG / The Elements of an Exercise Test
BP/Comment
Baker, Dave, 41yrs.
01:02
01:02
Pretest
Supine
Print Rhythm
–
display ST measurement results of the other acquired
leads (19), “Scan” indicates that the lead with the most
significant ST depression is displayed automatically
(leads I, aVR, aVL, V1 and V2 are ignored)
–
adjust the reference points E, J and J+X (if the corresponding option was set to “Manual” in the setup menu)
–
modify the sensitivity (21)
–
enter comments and/or BP readings. To do so
Exercise Test
Phase >>
Hold
Stage >>
mph
%
+
0.0 +-
HR [BPM]
0.0
85
Stop Treadmill
Start Treadmill
BP/Comment
Lead Check
Freeze ECG
Interpretation
Event Mark
ST/Medians
Trends
ECG Strips
RPP
SYS/DIA (mm/Hg)
SVPB
VPB/min
3
44
5s
5s
V1
1
1Comments
22
V2
Phase:
»
V3
P-Bruce
V5/auto
V4
0.0 mph
Chest discomfort
Dyspnea
1,88 mV/s
Leg discomfort 0,07 mV
Fatigue
I
Nausea
Syncope
...
10 mm/mV
V4
V5
V6
OKX
33
ADS
00:23
BP
1,88
Ruhe
0,07
dia:
J+60ms
J+60
ms
sys:
J
6
6
25 mm/s
Cancel
Click on
4.2-18).
Figure 4.2-18. Dialog box for entry of comments and blood
pressure
BP/Comment
to open the dialog box (Figure
Click on a comment, then click on
to copy
>>
the comment to the text box (or double-click on a
comment).
Lead Check
Baker, Dave, 41yrs
00:24
00:24
Print Rhythm
Exercise Test
Pretest
Supine
Phase >>
Hold
Stage >>
mph
%
+
0.0 +-
HR[BPM]
0.0
98
Stop Treadmill
% of 142
RPP
Start Treadmill
BP/Comment
Lead Check
Freeze ECG
Interpretation
Event Mark
ST/Medians
Trends
ECG Strips
SYS/DIA (mm/Hg)
SVPB
Click on
VPB/min
3
4
5s
V1
V2
1
Recall
2
Enter the blood-pressure readings by clicking on the
arrows (systolic value, TAB, diastolic value,
).
3
OK
to clear the dialog box.
click on Lead Check to display the lead segments for
verification of the signal quality (Figure 4.2-19).
12-Lead
V3
aVR*
aVL
aVF
1 2
V4
V1
3
V2
V6
V5
LA
RL
LL
V3
V5
V4
4 5 6
RA
V6
Recall
12-Lead
The
and
buttons are displayed only
when the thermal-array printer is connected. These buttons
are used to initiate an ECG printout. The print format is
defined in the setup (section 4.2.7 “Exercise-Test Setup”,
“In-Test Reports”).
Figure 4.2-19. Lead check screen
227 498 02-A
CardioSys V 4.1
103
The Exercise ECG / The Elements of an Exercise Test
Name:
Date of Birth:
P-Bruce
Supine
I
Dave Baker
05/05/1955 (41 yrs.)
Male, Caucasian, 145.0 lb, 79 in
01:17
Total Time 01:17
01:17
0.0 mph 0.0%
prints the most recent 10 seconds of the ECG (3,
6, or 12 leads) (Figure 4.2-20).
Recall Report
Patient ID 12345
Recall
HR [BPM] 60
BP [mmHg]
II
prints the 10-second ECG acquired after clicking
on the button in the preconfigured format (4x2.5s, 2x5s,
1x5s) (Figures 4.2-21, 4.2-22, 4.2-23).
III
12-Lead
AVR
AVL
AVF
V1
Click on
V2
to clear the lead check screen.
V3
☞
V4
V5
V6
09/11/1996 09:51:09
10 mm/mV 25 mm/s
Recall and 12-Lead reports are printed only when
option “print” or “print & save” is selected for
“Manual Recording” in the Setup menu.
Figure 4.2-20. 12-lead recall report
Name:
Date of Birth:
P-Bruce
Supine
Dave Baker
05/05/1955 (41 yrs.)
Male, Caucasian, 145.0 lb, 79 in
00:19
Total Time 00:20
00:19
0.0 mph 0.0%
12-Lead Report
Patient ID 12345
HR [BPM] 60
BP [mmHg]
I
aVR
V1
V4
II
aVL
V2
V5
III
aVF
V3
V6
09/11/1996 09:51:09
10 mm/mV 25 mm/s
Figure 4.2.21. 12-lead report (4 x 2.5 s)
104
CardioSys V 4.1
227 498 02-A
The Exercise ECG / The Elements of an Exercise Test
Name:
Date of Birth:
P-Bruce
Supine
Dave Baker
05/05/1955 (41 yrs.)
Male, Caucasian, 145.0 lb, 79 in
00:16
Total Time 00:16
00:16
0.0 mph 0.0%
12-Lead Report
Patient ID 12345
Name:
Date of Birth:
HR [BPM] 60
BP [mmHg]
P-Bruce
Stagel
Rest
I
Current Beat
I
V1
Dave Baker
05/05/1955 (41 yrs.)
Male, Caucasian, 145.0 lb, 79 in
00:09
Total Time 02:33
00:09
1.7 mph 10.0%
I
-0,01
0,07
II
V2
II
V3
II
III
V2
0,01
0,00
III
V3
0,00
0,03
AVR
0,01
0,02
aVL
V2
0,01
0,00
V3
0,00
0,07
V3
0,00
0,02
AVR
V4
0,01
0,00
V4
0,00
0,05
V4
0,00
0,03
V5
AVL
AVL
-0,01
0,00
aVF
AVL
V5
-0,01
0,00
V5
-0,01
0,00
V5
-0,01
0,00
V6
AVF
AVF
-0,01
0,12
09/11/1996 09:51:09
10 mm/mV 25 mm/s
Dave Baker
05/05/1955 (41 yrs.)
Male, Caucasian, 145.0 lb, 79 in
01:37
Total Time 01:38
01:37
0.0 mph 0.0%
AVF
-0,05
0,08
V6
V6
-0,01
-0,03
V6
-0,01
0,00
09/11/1996 09:53:19
Figure 4.2-24. Comparative medians report
Figure 4.2-22. 12-lead report (2 x 5 s)
P-Bruce
Supine
I
V2
V1
0,01
0,00
V4
AVR
Name:
Date of Birth:
V1
0,01
0,00
II
III
Current Beat
V1
-0,01
0,10
0,00
0,05
aVR
Rest
I
-0,01
0,05
-0,01
0,05
III
Comparative Medians Report
Patient ID 12345
HR [BPM] 60
BP [mmHg]
12-Lead Report
Patient ID 12345
HR [BPM] 60
BP [mmHg]
II
III
AVR
AVL
AVF
V1
V2
V3
V4
V5
V6
09/11/1996 09:51:09
10 mm/mV 25 mm/s
Figure 4.2-23. 12-lead report (1 x 5 s, the system saves 1 x 5 s but
prints 1 x 10 s)
227 498 02-A
CardioSys V 4.1
105
The Exercise ECG / The Elements of an Exercise Test
ST/Medians
Baker, Dave, 41yrs
00:42
00:42
Pretest
Phase >>
Supine
Print Rhythm
–
Exercise Test
Stage>>
Hold
+
0.0 0.0 +-
mph
%
HR [BPM]
Stop Treadmill
% of 142
BP/Comment
Lead Check
Freeze ECG
Interpretation
Event Mark
ST/Medians
Trends
ECG Strips
98
RPP
Start Treadmill
SYS/DIA (mm/Hg)
SPB
VPB/min
3
4
5s
V1
V2
1
aVR
Comp.Median
V3
2
3
V4*
ST Profile
I
0.06 mV
-0.13 mV/s
V4 II
0.06 mV
-0.12 mV/s
aVL
0.01 mV
0.25 mV/s
V2
-0.06 mV
-0.05
1,88mV/s
V5*
0,07
V5III
-0.02 mV
-0.07 mV/s
0.03 mV
0.03 mV/s
aVF
0.12 mV
0.32 mV/s
V3
V6
0.26 mV
2.28 mV/s
V6*
X
-0.01 mV
1.38 mV/s
0.07 mV
1.30 mV/s
0.15 mV
1.13 mV/s
0.00 mV
-0.12 mV/s
Figure 4.2-25. ST analysis results
Trends
HR/min
240–
BO/mmHg
180–
7
1
120–
60–
0–
HR/min
240–
15–
–3
4
60–
5
10
15
PACE
–40
–30
2
10–
–2
–1
5–
–0
0–
–75
120–
0–
0
VPB
20–
–4
ART%
–100
180–
6
mph
–5
–50
–0
20
METS
5–
RPP
–200
4–
–160
3–
–120
5
1–
0–
0
–10
–0
2–
–25
–20
5
10
15
–80
–40
–0
20
Level. mV
–
0,4–
–
0,2–
–
0–
–
-0,2–
–
-0,4–
–
I*
Ampl. mV
–
0,4–
–
0,2–
–
0–
–
-0,2–
–
-0,4–
–
0
5
aVR*
Slope. mV/s
–
–4
–
–2
–
–0
–
–-2
–
–-4
–
3
Slope. mV/s
–
–4
–
–2
–
–0
–
–-2
–
–-4
–
15
20
3
10
Figure 4.2-26. Graphic trends
1 Heart rate, blood pressure, speed
2 VPB, pacer pulses
3 ST level/slope (slope and level of the 2 leads
with the most significant ST changes, all other
leads are accessible with button 6)
4 Heart rate, artifact
5 METS, RPP
6 Arrow buttons to call up the graphic ST trends
of the other leads
7 Button to clear the trend window
106
review the ST analysis results (medians and profile) of all
leads (Figure 4.2-25) with the ST/Medians buttons. The
first screen shows the medians. With the ST Profile
button you can toggle to the ST histogram screen (clear
display with
).
The Comp. Median or Linked Median button is displayed only when
a thermal printer is connected to the system. The button
actually shown depends on the system setup (section 4.2.7
“Exercise-Test Setup”).
The Comp. Median button initiates a printout showing:
– the resting beat for reference
– the current median complex
– a 2.5-second ECG segment
for all 12 leads.
The Linked Median button initiates a printout showing the
current median complex and the corresponding RR interval
linked by the computer to form a computer-synthesized
rhythm strip for all 12 leads. The raw data of an additional
rhythm lead are also printed for reference (this will be the first
manually selected rhythm lead (item “Select Arrhythmia
Lead” in the “Setup” menu)).
If the system is not able to analyze the ST segment, it will
output the 12-lead report instead of the linked medians.
Click on
–
to clear the ST screen.
display trends (Figure 4.2-26) with the
button
☞
CardioSys V 4.1
Trends
The displayed ST analysis results and graphic
trends are updated every 30 seconds.
227 498 02-A
The Exercise ECG / The Elements of an Exercise Test
ECG Strips
–
Baker, Dave, 41yrs
01:02
01:02
Pretest
Stage1
Print Rhythm
display segments of the stored 12 leads (Figure 4.2-27) with
Exercise Test
Phase
Hold
Stage
>>
mph
>>
%
+
- Stop Treadmill.
+
- Start Treadmill
BP/Comment
Lead Check
Freeze ECG
Interpretation
Event Mark
ST/Medians
Trends
ECG Strips
00:32 P-Bruce : Supine
HR[BPM]
RPP
SYS/DIA (mm/Hg)
120/80
VPB.VBIG
VPB/min
3
4
5s
V1
1
V2
V3
V4
2
3
V6/scan
1,88 mV/s
0,07 mV
I
J
ECG Strips
85
The recordings are annotated with time and load. The first
recording represents the 0 Watt level. With
you can
display the other recordings. The button allows you to
access the current segment directly. Click on
to clear the
window.
1,88
Rest
0,07
J+60ms
J+60
ms
Click on
Interpretation
V5
10 mm/mV
V6
X
ADS
25 mm/s
–
to view the “Statement Library” page (refer to Figure
4.2-38).
–
to select another test protocol. To do so, click on the
label of the current test phase (“Pretest” in Figure
4.2-27) and choose the new protocol from the displayed
list box. The program will switch to the new protocol
when it proceeds to the next phase (this function is not
possible with the following ergometer/treadmill selections (setup menu):
ERGA
intern., remote start
EC 1200
Figure 4.2-27. Stored 12 leads
227 498 02-A
CardioSys V 4.1
107
The Exercise ECG / Reviewing the Final Report
Reviewing the Final Report
☞ The full-disclosure ECG takes up an enormous
amount of the storage capacity, therefore delete it
as soon as possible.
☞ In the presence of complex ectopy it is advisable to
record the full-disclosure ECG.
At the end of the test you will be informed whether complex
ectopy has been identified and given the opportunity to delete
or store the full-disclosure ECG.
If you made the recording without assigning it to a patient
(Unnamed), you can enter a patient name now.
When you click on “Yes” or “No” the Test Summary
will appear.
METS Calculation
METS =
(V [m/min] · (0.1 + (grade [%]/100) · 1.8) + 3.5)
3.5
METS values are interpolated between two stages. The full
METS value of a test stage is attained after the test subject has
exercised for a period of 2 minutes in that stage.
108
The complete exercise test report includes the following
documents. They are described in detail on the following
pages:
–
–
–
–
–
–
–
–
–
Test Summary (Figure 4.2-28)
Tabular Summary (Figure 4.2-31)
Trend Reports (Figure 4.2-32)
Sample Cardiac Cycles (Figure 4.2-34)
QRS Morphologies (Figure 4.2-35)
ECG strips (Figure 4.2-36)
Arrhythmia Review (Figure 4.2-37)
Interpretation (Figure 4.2-38)
Full Disclosure ECG (Figure 4.2-39)
CardioSys V 4.1
227 498 02-A
The Exercise ECG / Reviewing the Final Report
The Test Summary
HELLIGE
Patient
Procedure
System Services
Baker, Dave, 41yrs
The Test Summary (Figure 4.2-28) includes:
Exercise Test/Test Summary
Reasons for Termination
Test Data
Date/Time
Total Exercise Test
Duration Preset
Dauer
Bruce
Dauer
Recovery
Artifact Time
Help
Test Information
12/06/ - 04:54:53pm
35:28 min
15:00 min
20:00 min
0:00 min
0s
Reasons for Termination
Interpretation
HR/RPP/METS:
HR at rest: 85 BPM
Max. HR: 86 PBM
(48 % of Target HR: 179 BPM)
Max. METS: 1.00
BP:
BP at rest: 120/90 mmHg
Max. BP
Patient Data
Age
41 years
Sex
Male
Race
Caucasian
Height
188
Weight
90.0 kg
BP
Reason for Test
–
–
–
–
Test Information
Medication:
Physician:
Dr. Bouvier
User:
Claudine
Comment:
A window in the middle is provided for entry of the reasons
for terminating the test.
Events:
QRS 689, VBIG, VPB: 38
CPLT: 8
Significant ST Change:
Click on Reasons for Termination . This brings up a window
where you select the reasons by clicking (Figure 4.2-29).
Figure 4.2-28. Test Summary
Reasons for Termination
If you have entered the test information as described in section 4.2.3 “Entering the Test Information ”, these will be
shown here along with the reason for test. If required, they
can be modified.
Reasons for Termination
Library
Selected Reasons for Termination
Patient fatigue
Leg dicomfort
Chest discomfort
Syncope
Dyspnea
Target HR attained
Frequent ectopy
ST segment depression
Hypertensive BP response
Hypotensive BP response
…
…
the test data (date, time, test duration)
the patient data
the test information
the interpretation
»
A
B
A
C
To do so, click on the
Test Information
button.
OK
Cancel
Modify
Help
Figure 4.2-29. Reasons for Termination window
☞
Enter the reasons for termination in the same
manner as the test information (section 4.2.3
“Entering the Test Information”).
227 498 02-A
CardioSys V 4.1
109
The Exercise ECG / Reviewing the Final Report
HELLIGE
Patient
Procedure
System Services
Baker, Dave, 41yrs
Reasons for Termination
Help
Exercise Test/Test Summary
Go to…
Test Demographics
Patient Data
Reason for Test
Test Summary
41 years
12/06/ - 04:54:53pm Age
Tabular
Sex
Male
35:28
min Summary
Caucasian
15:00 min Race
Trend Reports
188
20:00 min Height
Weight
90.0 kg
0:00 minCard.
Sample
Cycles
0 s BP
QRS Morphologies
Reasons for Termination
Test Demographics
Medication:
ECG Strips
Physician:
Dr. Bouvier
Claudine
ArrhythmiaUser:
Review
Comment:
Interpretation
Interpretation
HR/RPP/METS:
Events:
Full Disclosure ECG
HR at rest: 85 BPM
QRS 689, VBIG, VPB: 38
Max. HR: 86 PBM
Cancel CPLT: 8
(48 % of Target HR: 179 BPM)
Significant ST Change:
Max. METS: 1.00
BP:
BP at rest: 120/90 mmHg
Max. BP
Test Data
Date/Time
Total Exercise Test
Duration Preset
Dauer
Bruce
Dauer
Recovery
Artifact Time
Figure 4.2-30. Documents of the exercise test report
Data Export
Using the export function
you can save the relevant
test data to the clipboard or to a file. When data are saved to
the clipboard, they can be inserted in a text file, for instance.
Click on
.
Select either “Export data to clipboard” or “Export data
to file”.
Select
OK
to confirm your choice.
When you export the data to the clipboard, you can insert
them in a text file for further editing (commands “Edit” —>
“Paste”).
If you choose the second option you will have to specify the
directory and the file name. Confirm the export command
OK
with
.
Displaying the Report Pages
You can either scroll through the entire final report, or access
specific pages directly.
Click on
to scroll forward or on
backward through the report pages.
to scroll
Click on
to display the table of contents where you
can select a specific document for review (Figure 4.2-30).
Click on the title of the document you wish to display.
110
CardioSys V 4.1
227 498 02-A
The Exercise ECG / Reviewing the Final Report
Tabular Summary
Patient
Procedure
System Services
Baker,Dave, 41yrs
Exercise Test/Tabular Summary
*significant ST change (default)
X Stages
Phase:
Stage
Time
Speed
Grade
METS
HR
P-Bruce
Supine
Standing
Hypervent
Warm-Up
Stage1
1.30
1.30
1.30
1.30
1.30
0.0
0.0
0.0
0.0
1.9
0.0
0.0
0.0
0.0
10.0
0.0
1.0
1.0
1.0
1.7
85
85
85
85
85
Manual
The Tabular Summary
Help
Sys/Dia RPP
V4*
For each stage of the test the tabular summary (Figure 4.2-31)
shows:
VPB
0.07
0.07
0.07
0.07
0.07
Figure 4.2-31. Summary Table for treadmill test
☞
Only the stage format of the Tabular Summary is
transmitted to MUSE.
Bicycle Ergometer
– phase
– time
– load
– RPM
– heart rate
– blood pressure
– RPP
– ST level
– number of VPBs
– comments, if entered
Treadmill
– phase/stage
– time
– speed
– grade
– METS
– heart rate
– blood pressure
– RPP
– ST level
– number of VPBs
– comments, if entered
If the data in the table are to represent intervals of 30 seconds
instead of test stages, uncheck the “Stages” check box.
Click on the arrows at the top and bottom of the scroll
bar to scroll the lines one by one (Figure 4.2-31), or drag
the scroll box up and down to cover greater distances
and scroll to specific data.
227 498 02-A
CardioSys V 4.1
111
The Exercise ECG / Reviewing the Final Report
Trend Reports
Patient
Procedure
Baker,Dave, 41 yrs
HR[BPM]
240–
BP/mmHg
Speedmph
–5
–4
1
120–
60–
0–
HR[BPM]
240–
120–
4
60–
10
15
VPS
20–
PACE
–40
–30
15–
2
10–
–2
–1
5–
–0
0–
–75
180–
Phase
Time
HR
Speed
–3
ART%
–100
5
Help
Exercise Test/Trend Reports
180–
0–
0
The Trend Reports
System Services
–50
–0
20
mIn
/min
km/h
–10
–0
Mets
5–
RPP
–200
4–
–160
3–
–120
5
2–
–25
–20
1–
0–
0
Grade
Level
Slope
5
10
–80
–40
–0
20
15
%
mV
mV/s
Level mV
–
0,4–
–
0,2–
–
0–
–
-0,2–
–
-0,4–
–
V3
Level[mV]
–
0,4–
–
0,2–
–
0–
–
-0,2–
–
-0,4–
–
0
5
I
Total Exercise Time
Duration P-Bruce
Duration Manual
Slope mV/s
–
–4
–
–2
–
–0
–
–-2
–
–-4
–
3
10
Slope[mV/s]
–
–4
–
–2
–
–0
–
–-2
–
–-4
–
15
20
6:49 min
1:25 min
5:24 min
Figure 4.2-32. Trend Reports, page 1
Figure 4.2-32 shows page 1 of the trend reports. Here you see
heart rate, blood pressure and speed (1)
VPBs and pacer pulses (2)
ST amplitude and slope (of the two leads with the most
significant ST changes) (3)
heart rate and artifacts (4)
METS and RPP (5)
The program will show you the exact values for any point on
the trend graph. When, in the selected trend period, the
system could measure neither ST level nor slope, both values
are set to zero.
Move the cursor which turns into a cross to the region of
interest on the trace and click.
☞
With
and
you scroll through the report.
With
and
you scroll through the selected
document of the report.
☞
The system automatically selects the leads with the
most significant ST changes and labels them with
an asterisk * (except leads I, aVR, aVL, V1 and
V2). You are free, however, to select any other two
leads (place cursor on arrow, click and select
lead). The leads that you select yourself do not
have the *. The leads also appear in the Tabular
Summary.
112
A vertical time line appears. The values corresponding to this
point in time are displayed in the bottom part of the screen.
As soon as you select another point on any of the trend
curves, the old time line disappears and a new one is displayed. The bottom line shows comments that you have
entered at the selected time. When no comment exists for the
new selected time, the previous one is displayed.
With the
icon, you can cross-reference to the
segment of the full-disclosure ECG which corresponds to
the position of the time line on the trend graph (with
you can return to the trend graphs).
A dash in the upper margin of the trend windows indicates
the change to the next test phase.
CardioSys V 4.1
227 498 02-A
The Exercise ECG / Reviewing the Final Report
Patient
Procedure
System Services
Baker, Dave, 41yrs
Click
or
to display the other trend graphs.
They show the ST trends from all recorded leads.
Help
Exercise Test/Trend Reports
ST/HR Slope(I)
AVF
Lead
Slope
[uV/min]
N
r
I
II
III
(AVR)
(AVL)
AVF
(V1)
V2
V3
V4
V5
V6
0.000
1.74
2.40
(0.00)
(0.00)
2.03
(0.00)
2.17
2.61
0.00
0.67
1.06
0
7
7
0
0
7
0
3
3
0
4
7
0.000
0.798
0.865
0.000
0.000
0.826
0.000
1.000
1.000
0.000
0.956
0.892
r
[p<0.05]
0.000
0.754
0.754
0.000
0.000
0.754
0.000
0.997
0.997
0.000
0.950
0.754
-500
ST/HR = 2.027
There is a total of three graphic trend reports. Page number 4
shows the ST/HR slope according to R.J. LINDEN (Figure
4.2-33).
-400
Here you will automatically see the lead with the most significant slope (except leads I, aVR, aVL, V1). The graph indicates:
-300
-200
-100
0
0
60
120
Figure 4.2-33. ST/HR slope according to R.J. LINDEN
180 HR[EFM] 240
–
the slope
–
the number of points (N)
–
the correlation quotient r
–
the correlation quotient r for p < 0.05 (error probability
less than 5%).
For details on the ST/HR slope, please refer to section 7.4 in
the Appendix.
227 498 02-A
CardioSys V 4.1
113
The Exercise ECG / Reviewing the Final Report
Sample Cardiac Cycles
Patient
Procedure
System Services
Baker,Dave, 41yrs
Help
Exercise Test/Sample Cardiac Cycles
X ST values
Supine 0:30
METS 1.00
Stage2 3:39
METS 4.90
I
0.00 mV
0.31 mV/s
0.06
0.00
0.00
0.03
0.05
0.00
0.00
0.23
0.01
0.00
0.00
-0.21
-0.06
-0.00
0.00
0.00
0.02
0.00
0.00
0.13
0.03
0.00
II
III
aVR
aVL
aVF
Figure 4.2-34. Sample Cardiac Cycles, page 1
Sample Cardiac Cycles
The Sample Cardiac Cycles page presents the median beats
including the ST measurement points and ST results. Up to
6 leads are displayed per screen. The beats on the far left are
the QRS complexes at rest, those following to the right are the
median beats for each load stage (Figure 4.2-34). The program can display up to 20 median beats. When this number is
reached, the program proceeds as follows: The beat on the far
left is retained, while the latest beat overwrites the oldest beat
in the section on the right. The last beat before a phase
change is not overwritten.
Click
or
Click
or
ous load stage.
to display the next set of 6 leads.
to move to the next or to the previ-
With the check box next to “ST values” you can select
display of the ST values.
X or deselect
114
CardioSys V 4.1
227 498 02-A
The Exercise ECG / Reviewing the Final Report
QRS Morphologies
Hellige
Patient
Procedure
System Services
Baker, Dave, 41 yrs.
QRS:
PVC
1891
0
Help
Exercise Test / QRS Morphologies
113
113
QRS Morphologies
The system can save up to 10 different QRS templates and
display them in all acquired leads. If more than 10 templates
are encountered in the course of an exercise test the oldest one
which occurred infrequently will be overwritten (Figure
4.2-35). Above each template, the display shows the overall
number of beats belonging to that category (incl. PVCs). The
number below indicates the PVCs only.
aVR
aVL
aVF
Figure 4.2-35. QRS Morphologies
227 498 02-A
Use
and
and left.
Use
and
templates.
CardioSys V 4.1
to shift the columns to the right
to display the other leads of the same
115
The Exercise ECG / Reviewing the Final Report
ECG StripsHELLIGE
Patient
Procedure
System Services
Baker, Dave, 41 yrs.
Exercise Test / ECG Strips
X
0:31 P-Bruce #1
10.0mm/mV
25 mm/s
HR 84Hz
10 mm/mV 25 mm/s
I
III
ECG Strips
Help
35Hz
60Hz
AVR
V1
V4
AVL
V2
V5
AVF
V3
V6
Figure 4.2-36. ECG recordings, 4 x 2.5 s
This document shows the ECG traces as recorded with the
selected recording interval or with the setting at the ergometer. Up to 30 ECG strips may be recorded. The data above
the ECG are the corresponding workload and recording time.
The print formats (4 x 2.5 s, 2 x 5 s, 1 x 5 s) are selected on the
defaults screen. The format 1 x 5 s consists of two windows
showing two recordings side by side. Formats 2 x 5 s and
4 x 2.5 s (cont.) consist of only one recording.
The check box next to the printer icon indicates whether or
not the ECG strip will be printed later on. The default setting
is X .
Click on
printout,
to deselect the printout (
no ECG printout).
X
X
ECG
You can perform measurements on the recorded ECG as
described in section 4.1.5.
Use
and
recording.
Use
116
CardioSys V 4.1
to display the next or the previous
and
to change the signal size and
to change the sweep.
and
227 498 02-A
The Exercise ECG / Reviewing the Final Report
Arrhythmia Review
Arrhythmia Review
Hellige
Patient
Procedure
System Services
Baker, Dave, 41 yrs.
Help
Exercise Test / Arrhythmia Review
X
0:15 min
Event 1 (5 s)
If one of the events listed in the table on the left occurs during
the test, the program records and saves a 5-second ECG
episode. If multiple events occur, this period extends by
5 seconds for each event. Furthermore, a 10-second episode is
recorded, when you press the Event Mark button during the
test. The duration of an episode is also indicated.
X
0:18 min
Event 1 (10 s)
I
II
III
aVR
The system can save up to 20 episodes of 5 seconds each
(Figure 4.2-37). When the memory is full, the system decides
which episodes to overwrite, observing certain priorities.
aVL
aVF
Figure 4.2-37. Arrhythmia Review
Use
sodes.
Arrhythmic Events (acc. to priority)
learned QRS complex
asystole, limit value
ventricular fibrillation/flutter
ventricular tachycardia (>3 VPBs)
ventricular run (3 VPBs)
ventricular couplet (2 VPBs)
pause of 2 missed beats
pause of 1 missed beat
ventricular bigeminy
pacer error
ventricular escape beat
premature ventricular contraction
pacemaker capture
absolute pause, limit value
artifact*
learn phase*
QRSL
ASYSTO
VFIB
VTAC
RUN
CPLT
PAU2
PAU1
VBIG
PERR
ESC
PVC
PCAP
PAUA
A
L
Click on
complex
ectopy
–
–
–
–
–
–
–
–
–
–
–
–
–
–
–
–
and
Use
ings.
and
Click on
printout,
to display the next two event epi-
to delete an episode.
to display the other leads of the record-
to deselect the printout (
no ECG printout).
X
X
ECG
You can perform measurements on the ECGs as described for
the “ECG Strips”.
☞
Manually stored event episodes always have the
highest priority.
* not on the event window and no episodes (full-disclosure ECG only)
227 498 02-A
CardioSys V 4.1
117
The Exercise ECG / Reviewing the Final Report
Interpretation
HELLIGE
Patient
Procedure
System Services
Baker, Dave, 41yrs
ABE
Interpretation
Help
Exercise Test/Interpretation
A
F
Measurements Summary
Statement Library
HR/RPP/METS:
HR at rest: 85 BPM
Max. HR: 86 PBM
(48 % of Target HR: 179 BPM)
Max. METS: 1.00
BP:
BP at rest: 120/90 mmHg
Max. BP: 120/80 mmHg
Events:
QRS 689, VBIG, VPB: 38
CPLT: 8
Significant ST Change:
V6: 0.00 mV
2
B
A
In order to generate the physician’s interpretation of the test
procedure you can choose both from the system-generated
measurements and from the statement library which you
entered yourself.
C
Interpretation
3
4
1
You can copy statements from both libraries by clicking on
the respective lines and on the copy icon
.
»
Select “System Evaluation“ or “Statement Library”.
Figure 4.2-38. Interpretation
1 Selection of system-generated measurements or
statement library
2 Button to edit the statement library
3 Button to confirm interpretative statements
4 Buttons to edit the report
Highlight the phrase you wish to copy, then click the
button.
☞
Copy a line by just double-clicking on it!
Confirming Tests
☞ If your PC is equipped with a sound card and a
microphone, the program supports voice recording.
A test is considered confirmed, when a physician has reviewed
the test interpretation and “signed” it electronically with his/
her name. Tests that have been reviewed and confirmed by a
physician are marked with x.
Click on
to display the window where you can
enter your name (3, Figure 4.2-38).
Select the physician’s name from the list box (click on
) or enter it via the keyboard.
118
CardioSys V 4.1
227 498 02-A
The Exercise ECG / Reviewing the Final Report
Full Disclosure ECG
Full Disclosure ECG
Hellige
Patient
Procedure
System Services
Baker, Dave, 41 yrs.
Help
Exercise Test / Full Disclosure ECG
QRSL
12,5 mm/s
00:14
QRSL
V4
Spline
00:04
Each lead of the stored 3, 6 or12-channel full disclosure ECG
can be displayed. The events identified by the rhythm analysis
algorithm are highlighted. The times are shown in the left
margin (Figure 4.2-39).
CPLT
00:21
1
2
3
4
5 6 7
00:38
PSVC
00:55
01:12
01:29
Figure 4.2-39. Full Disclosure ECG
1 Buttons to call up additional leads
2 Buttons to select the sweep speed
3 Button to activate the zoom function
4 Button opening the event selection window
5 Button to delete the full disclosure ECG
6 Button to print out a trace segment
7 Button to cross-reference to the trend display
☞
Typing the first letter of an event (e.g. “P” for
PVCs) takes you from one occurrence of this event
to the next.
You can choose between perusing the entire recording (by
dragging the scroll box in the scroll bar at the right), jumping
from one event to the next (with the cursor keys), and selecting a specific event category from the event list (button (4)
Figure 4.2-39). You can also zoom important sections of the
ECG and save them as episodes. This allows you to pick
particularly interesting segments from the full disclosure ECG
and save them, discarding the rest, because it takes up too
much storage capacity (button
).
Furthermore you can mark segments of special interest and
print them out:
Click on the beginning of the trace segment (which will
then be marked by a flag ).
Click on the end of the trace segment (which will also be
marked by a flag ).
A printout of the segment is obtained by clicking on
.
Click on
227 498 02-A
CardioSys V 4.1
if you wish to return to the trend display.
119
The Exercise ECG / Reviewing the Final Report
Displaying Zoomed Segments
Hellige
Patient
Procedure
System Services
Baker, Dave, 41 yrs.
Help
Exercise Test / Full Disclosure ECG
QRSL
01:18
01:20
Spline
You can choose regions of special interest and display them at
a larger scale. Here too you can jump from one event to the
next.
V1
V2
1
2
3
4
Click
5
(Figure 4.2-39).
V3
Move the cursor which turns into a magnifying glass to
the trace segment of interest and click. Figure 4.2-40 will
appear.
V4
V5
6
V6
Figure 4.2-40. Display of a zoomed segment
1 Buttons to display the other leads of the same
segment
2 Button to quit the zoomed segment and return
to the full disclosure ECG
3 Button to open the event selection window
4 Button to save the segment as an episode
5 Button to print the zoomed segment
6 Buttons to display another time window
The cursor keys will take you to the neighboring episode
(before or after the present one).
If you drag the scroll box (6), you can quickly select any
segment of the entire ECG.
The
button allows you to save the segment as an
event episode.
☞ On the zoomed display the ECG is shown with
4 times the original speed.
☞ Manually stored event episodes always have the
highest priority.
120
CardioSys V 4.1
227 498 02-A
The Exercise ECG / Printing an Exercise-Test Report
4.2.5 Printing an Exercise-Test
Report
Print
Pages to Print:
1
X Standard Page
Procedure Date:
1
Trend Reports
Sample Card.Cycles
Survey
incl. table
ST/HR I
2
The scope of the printed report is determined on the print
setup screen (Figure 4.2-41).
0
1
0
Arrhythmia Review
ECG Strips
QRS Morphologies
6 lines
Click
3
25 mm/s
0
0
to call up the print setup screen.
0
Print
ECG Grid:
Cover Page
Bar Code / Patienten ID
EPSON EPL 5700 (LPT1)
5 mm
Gain:
10.0 mm/mV
Number of Copies:
1
The report includes the following sections:
Cancel
Save
–
–
–
–
–
–
Modify
Help
Figure 4.2-41. Exercise ECG print setup screen
1 Number of pages of the entire report
2 Document selected for printout
3 Dialog boxes appear only when “1 x 5s” has
been selected in the “In-Test Report” menu
Name:
Date of Birth:
Test Information
Date/Time
Total Exercise Time
Duration P-Bruce
Duration Bruce
Duration R-Bruce
Artifact Time
08/05/1996 - 10:14:22
6:18 min
2:04 min
2:49 min
1:25 min
0s
Clicking the box in front of each of these documents includes
them in or excludes them from the report (check mark =
included). The length of each document and of the overall
report is also indicated.
EXERCISE TEST / Test Summary
Patient ID 1726712676
Dave Baker
05/05/1955 (41 yrs.)
Male, Caucasian, 145.0 lb, 79 in
Standard Page
Trend Reports
Sample Cardiac Cycles
Arrhythmia Review
ECG Strips
QRS Morphologies
Page 1
Medication
beta-blockers
Phase:
Stage:
P-Bruce
2:04
0.0
Rest ECG
>>> P-Bruce 00:20
>>> P-BRUCE Rest ECG
>>> BRUCE Stage 1
0.0
1.0
85
P-Bruce
Stage 1
1:20
>>> Stage2 135/80
10.0
1.0
86
R-Bruce
Reason for Test
Evaluate functional capacity
Time:
min
Speed
mph
0.0
Grade
%
METS HR
Sys/Dia
BPM mmHg
120/80
RPP
1/100
V5*
mV
VPB
0.00
3
0.00
3
Print
Stage 2
1:29
0.0
>>> R-BRUCE Recovery
12.0
1.0
86
135/80
0.00
2
Recovery
0.0
1.0
86
100/60
0.00
3
1:25
0.0
Save
>>> Recovery 100/60
Reasons for Termination
Serious arrhythmias
initiates the printout.
stores the print setup so that the next time the
screen is retrieved the settings will be the same.
Standard Page
Comment
Interpretation
HR/RPP/METS:
HR at rest: 85 BPM
Max. HR: 86 BPM
(66% of Target HR: 130 BPM)
Max. RPP: 114
Max. METS: 1.00
BP:
BP at rest: 120/80 mmHg
Max. BP: 135/80 mmHg
Events:
QRS: 522, VBIG: 5, VPB: 28,
SVPB: 18, CPLT:6,
Significant ST Change:
V6: 0.00 mV
08/05/1996 10:14:22
Physician: Dr. Williams
Technician: Dorothy, RN
The standard page (Figure 4.2-42) shows, at left, the patient
data, reason for test, reasons for termination, medication,
comments and ECG interpretation. The right side of the page
shows either the table of all measured data or the ST beats, as
selected.
Figure 4.2-42. Standard page
227 498 02-A
CardioSys V 4.1
121
The Exercise ECG / Printing an Exercise-Test Report
Dave Baker
05/05/1955 (41 yrs.)
Male, Caucasian, 145.0 lb, 79 in
Name:
Date of Birth:
240
HR(BPM);BP(mmHg)
Speed mph
5
4
180
20
EXERCISE TEST / Trend Report
Patient ID 1726712676
Page 2
VPB
PACE
40
7,5
30
10
20
3
120
2
60
0
0
5
Level (mV)
10
15
I
Slope (mV/s)
0,4
0
0,2
2
0
0
-0,4
5
0
10
15
II
Level (mV)
10
AVR
15
2
0
-4
-0,4
120
80
1
40
5
0
10
AVL
Level (mV)
15
240
HR(BPM)
ART(%)
100
180
75
120
50
25
60
0
0
5
Level (mV)
0
20
160
2
Slope (mV/s)
0,2
-0,2
200
3
0
4
-2
RPP 1/100
4
20
0,4
Slope (mV/s)
0,4
5
Level (mV)
4
-0,2
0
0
20
METS
10
5
1
0
5
10
15
V1
Slope (mV/s)
0,4
0
2
0
0
-0,2
-4
-0,4
20
5
0
Slope (mV/s)
Level (mV)
10
15
V2
Slope (mV/s)
5
10
15
V4*
Level (mV)
4
0,2
-2
0
0
20
20
Slope (mV/s)
0,4
4
0,2
2
0
0
-2
-0,2
-4
-0,4
20
-2
-4
5
0
10
V5*
Level (mV)
15
4
0,4
4
0,4
4
0,4
2
0,2
2
0,2
2
0,2
2
0
0
0
0
0
0
0
0
4
-0,2
-2
-0,2
-2
-0,2
-2
-0,2
-2
-0,4
-4
-0,4
-4
-0,4
-4
-0,4
-4
4
0,4
4
0,4
4
0,4
0,2
2
0,2
2
0,2
2
0,2
2
0
0
0
0
0
0
0
0
5
0
10
15
III
Level (mV)
20
-0,2
-0,4
5
0
10
15
5
0
Slope (mV/s)
10
AVF
Level (mV)
-2
-0,2
-4
-0,4
20
15
20
Level (mV)
-2
-4
5
0
10
08/05/1996 10:14:22
15
20
5
0
Slope (mV/s)
10
15
V3
Slope (mV/s)
20
-0,2
-0,4
10
15
10
V6
Level (mV)
-4
5
0
15
20
Slope (mV/s)
4
-0,2
-2
-0,4
20
Physician: Dr. Williams
5
0
-2
-4
0
5
10
15
20
Technician: Dorothy, RN
Figure 4.2-43. Trend report – overview
Dave Baker
05/05/1955 (41 yrs.)
Male, Caucasian, 145.0 lb, 79 in
Name:
Date of Birth:
240
EXERCISE TEST / Trend Report
Patient ID 1726712676
Page 1
HR(BPM);BP(mmHg)
VPB
Speed mph
5
40
30
10
20
3
120
2
60
10
5
1
0
0
0
5
5
10
15
METS
0
5
10
15
HR(BPM)
RPP 1/100
200
4
0
0
20
20
100
180
75
120
50
60
25
120
2
80
1
40
0
0
0
5
08/05/1996 10:14:22
10
15
20
0
0
0
Arrhythmias, Full Disclosure ECG (Recording Interval),
QRS Morphologies, Sample Cardiac Cycles
You can choose the documents (Figures 4.2-45 trough
4.2-48) that you want to print, and you determine whether
you wish to have a 12 or 6-channel recording (window below).
ART (%)
240
160
3
You can choose between “Overview” and “Detail”. In the
overview (Figure 4.2-43), all trend graphs are printed on a
single page. When you select “Detail”, you obtain several
pages of trend graphs (Figure 4.2-44). The number of pages
to be printed changes accordingly. (Click and select format). Check the ST/HR box to obtain a printout of the ST/
HR slope page.
PACE
20
7,5
4
180
Trend Reports
20
Slope (mV/s)
0,2
0,4
The ST beats page shows the resting ST beats in the first
column, the ST beats with the max. ST depression in column
no. 2 and in the following columns the ST beats at max. load
and for the recovery phase.
5
10
Physician: Dr. Williams
Figure 4.2-44. Trend report – detailed format
15
20
Technician: Dorothy, RN
In the windows at the bottom of the screen you select the
printer (printer port), the number of copies, whether the
patient ID no. will be annotated in the form of a barcode on
the report and whether an ECG grid is to be printed along
with the ECG traces. If you deselect the grid, the printout will
take less time.
Cover Page
Check to print a cover page in portrait format.
122
CardioSys V 4.1
227 498 02-A
The Exercise ECG / Printing an Exercise-Test Report
Name:
Date of Birth:
Dave Baker
05/05/1955 (41 yrs.)
Male, Caucasian, 145.0 lb, 79 in
EXERCISE TEST / Arrhythmia Review
Patient ID 1726712676
QRS:
VPB:
I
I
II
II
III
III
AVR
AVR
AVL
AVL
CPLT
V1
V2
V2
V3
V3
V4
V4
V5
V5
2:47 Episode 9
10 mm/mV 25 mm/s 20 Hz Spline
III
AVR
AVL
AVF
Physician: Dr. Williams
3:16 Episode 10
Technician: Dorothy, RN
08/05/1996 10:14:22
Figure 4.2-45. Arrhythmia review report page
Name:
Date of Birth:
Dave Baker
05/05/1955 (41 yrs.)
Male, Caucasian, 145.0 lb, 79 in
I
AVR
Page 3
VPB, VBIG
V6
V6
EXERCISE TEST / QRS Morphologies
Patient ID 1726712676
II
VPB
V1
494
0
I
AVF
AVF
08/05/1996 10:14:22
Dave Baker
05/05/1955 (41 yrs.)
Male, Caucasian, 145.0 lb, 79 in
28
28
Name:
Date of Birth:
Page 1
Physician: Dr. Williams
Technician: Dorothy, RN
Figure 4.2-47. QRS morphologies report page
EXERCISE TEST / ECG Strips
Patient ID 1726712676
Dave Baker
05/05/1955 (41 yrs.)
Male, Caucasian, 145.0 lb, 79 in
Bruce
Bruce
Stage1
Stage2
3:20
4:49
85 BPM
89 BPM
135/80 mmHg
METS 1.00
METS 1.00
METS 1.00
EXERCISE TEST / Sample Cardiac Cycles
Patient ID 1726712676
Name:
Date of Birth:
Page 2
2:00 P-Bruce Rest-ECG 0.0 km/h 85 BPM
V1
10 mm/mV 25 mm/s 20 Hz Spline
P-Bruce
Rest ECG
2:00
85 BPM
V4
Page 3
R-Bruce
Recovery
5:44
85 BPM
METS 1.00
I
0,05 mV
0,25 mV/s
0,05 mV
0,10 mV/s
0,05 mV
0,10 mV/s
0,05 mV
0,10 mV/s
0,05 mV
-0,03 mV/s
0,05 mV
-0,10 mV/s
0,05 mV
-0,10 mV/s
0,05 mV
-0,10 mV/s
0,01 mV
0,26 mV/s
0,01 mV
0,31 mV/s
0,01 mV
0,31 mV/s
0,01 mV
0,31 mV/s
-0,05 mV
-0,16 mV/s
-0,05 mV
-0,05 mV/s
-0,05 mV
-0,05 mV/s
-0,05 mV
-0,05 mV/s
0,02 mV
0,03 mV/s
0,02 mV
-0,10 mV/s
0,02 mV
-0,10 mV/s
0,02 mV
-0,10 mV/s
0,03 mV
0,11 mV/s
0,03 mV
0,06 mV/s
0,03 mV
0,06 mV/s
0,03 mV
0,06 mV/s
II
II
AVL
V2
V5
III
AVR
III
AVF
V3
V6
AVL
AVF
08/05/1996 10:14:22
10 mm/mV 25 mm/s 20 Hz Spline
Physician: Dr. Williams
Figure 4.2-46. ECG Strips report page
227 498 02-A
Technician: Dorothy, RN
08/05/1996 10:14:22
10 mm/mV 25 mm/s 20 Hz Spline
Physician: Dr. Williams
Technician: Dorothy, RN
Figure 4.2-48. Sample cardiac cycles report page
CardioSys V 4.1
123
The Exercise ECG / Verifying the Exercise-Test Settings
Cancel
Patient
System Services
Baker, Dave, 41 yrs.
Help
1
Exercise Test
P-Bruce
50 + 25 03:00 #5 03:00
Modify
Bruce
I
Test Information
Lead Check
Freeze ECG
Interpretation
Setup
Event Mark
ST/Medians
Trends
ECG Strips
2
3
aVR
aVF
Clear the test information dialog window with
Cancel
to display the exercise-test control screen.
1 2
3
4
aVL
4.2.6 Verifying the Exercise-Test
Settings
Hellige
Procedure
4 5 6
R
L
N
F
poor signal quality
L
5
The control screen (Figure 4.2-49) shows:
–
the selected protocol (1)
–
the applied electrodes and the signal quality (3) (for the
standard and CABRERA leads on the body as shown on the
picture at left, for all other leads, there is a schematic
representation of the electrodes). Furthermore an arrow
(4) points to the leads which are impaired by improper
electrode application or which cannot be recorded due to
disconnected electrodes (or due to a break in the patient
cable)
–
the selected gain (the 1-mV calibration pulse (5) is valid
for all channels)
–
the most important system settings (6).
10 mm/mV 25 mm/s
Spline
50 Hz
Figure 4.2-49. Exercise-test control screen
1 Selected protocol
2 Control buttons
3 Applied electrodes
green: properly applied
yellow: poor signal
red: electrode off or lead break
white: electrode not used
4 Leads impaired by poor signal quality
5 Calibration pulse
6 System settings
6
Other operations possible on the control screen are
–
temporary modification of the test phase with Modify…
(enter the test information before changing the phase,
otherwise the changes will be lost)
–
verification of the ECG signal quality with
–
display of the setup menu (section 4.2.7) with
Lead Check
Setup
System settings and operating steps are explained on the
following pages.
124
CardioSys V 4.1
227 498 02-A
The Exercise ECG / Exercise-Test Defaults
Setup
Page 2
Speed (mm/s)
25
Gain (mm/mV)
10
Lead Check noise level
low
none
4.2.7 Exercise-Test Setup
Setup/ Exercise Test
Page 1
Filter (Hz)
In-Test Reports
Auto. Report Format
12-Lead
Manual Recording
Print&Save
Printmanuell
Arrhythmia Lead Select Save
Scan
50 Hz
X Spline
Save full disclosure ECG
Manual
J+X-Point (ms)
Modify
V2
6
V6
6
60
F
Auto
Blood Pressure Limit [sys] 300
Manual
Max. pred. HR
CORINA analog output
Before running the first stress test, select several system settings on the setup screen. These settings are saved and loaded
automatically on power up. The setup menu is displayed from
the exercise-test control screen (section 4.2.6).
no
Writer
I
Auto
Cancel
OK
180
Select
Setup
(Figure 4.2-50).
6
WHO100%
Help
to display page 1 of the menu
Adjustments can be made in four different ways:
Figure 4.2-50. Exercise-Test Setup, page 1
1
There is an arrow at the end of a box. Clicking this
arrow will open a window which offers various options.
Select the desired setting by clicking the mouse button.
2
There is a two-ended arrow
to the right of a box.
Clicking one of the arrowheads increases or decreases a
numeric value.
3
There is a check box in front of the function. Click on
the box to enable or disable the function ( X function
enabled).
4
Click on the Modify… box and proceed as described for
each individual case.
Setup/ Exercise Test
Page 1
Page 2
X 1-mV Cal Pulse
Monitored Leads
12
Audible LEAD OFF Alarm
Displayed Leads
6
Audible HR Alarm
Lead Sequence
STANDARD
Modify…
Diagram: HR in % of max. HR
X Remote View
X RPP Readout
Modify…
Protocol
Bruce
Phases
A P-Bruce
B Bruce
Start clock at pretest
C R-Bruce
BP Monitor
BP Meter 1
Ergometer Model Internal Treadmill
Port
COM2
Port
Thermal Writer
(AR200P) local
none
COM1
OK
Figure 4.2-51. Exercise-Test Setup, page 2
227 498 02-A
Modify…
Library: Comments
Cancel
Help
CardioSys V 4.1
125
The Exercise ECG / Exercise-Test Defaults
Page 1 (Figure 4.2-50)
Speed mm/s
selects the trace sweep speed.
Save full disclosure ECG
Enables or disables continuous storage of the incoming ECG
which can be edited retrospectively and deleted, for instance
to save storage capacity. The max. storage time is 30 minutes.
Gain mm/mV
selects the signal size (amplitude).
Lead Check noise level
This is a measure of the quality of the acquired signal (signal
to noise ratio). When there is too much signal noise at the
electrode, the electrode is displayed yellow on the signal
acquisition screen. The setting that you select here (low,
middle, high) changes the threshold as of which the electrode
is displayed yellow (high sensitivity to noise = low threshold).
☞
Please remember that a filter may also suppress
diagnostically relevant information, as it limits
the frequency bandwidth. Therefore you should
not switch the filters on indiscriminately.
Filter
Enables or disables muscle filter (none, 20 Hz, 40 Hz)
50/60-Hz Filter
Enables or disables AC filter (
X
AC filter on)
Spline
Enables or disables the Cubic Spline algorithm (automatic
baseline correction, X Spline on); the algorithm causes a
signal delay of 4 seconds. On the signal acquisition and
control screen the algorithm can be disabled temporarily to
view the undelayed ECG signal.
126
Blood Pressure Limit (sys)
Here you enter the max. systolic blood pressure. When,
during the test, the blood pressure exceeds this value, the
pressure reading is highlighted with a different color.
CORINA analog output
To select the lead for the analog output
In-Test Reports
Here you select the printer for reports generated during the
test (in-test reports). You can choose among thermal-array
writer, laser printer and no printer. For the thermal writer,
you can specify and create your own automatic report format
( Modify… button).
This button brings up a window where you choose the format
of the 12-lead report (4 x 2.5 s, 2 x 5 s, 1 x 5 s). The format
selected here also determines the way the “ECG Strips” report
page is presented.
With “Recall” and “Rhythm” you determine the report
format of the printouts initiated with the
and
Recall
buttons (section 4.2.4 “Running an Exercise
Rhythm
Test”). The menu item “Median Report” allows you to
choose whether the comparative medians or the linked medians will be printed.
CardioSys V 4.1
227 498 02-A
The Exercise ECG / Exercise-Test Defaults
Auto. Report Format
Here you select the report generated at the selected recording
interval: 12 lead or comparative medians (possible only with
the thermal writer).
Manual Recording
Here you choose whether a manual recording will be
– printed,
– saved, or
– printed and saved.
HR Limit
The max. heart rate is either entered by the user or calculated
automatically by the program.
The automatic calculation is performed according to one of
the following rules:
–
–
–
–
Arrhythmia Lead Select
The two leads used for arrhythmia analysis are selected either
by the system (Scan) or by the user (Manual).
The first of the manually selected leads will be added to the
linked medians report as the rhythm lead. To change the lead
select “Manual” and choose the lead. Afterwards you may
reactivate the “Scan” mode.
WHO 80 (max. HR = 180 – age)
WHO 90 (max. HR = 200 – age)
WHO 100 (max. HR = 220 – age)
AHA (max. HR = 160 (for patients under 25 years of
age) or 115 (for patient over 75 years of age) or
160 – ((age – 25) x 45/50) (for patients between 25 and
75 years of age)
We recommend using WHO 100 and modifying the target
HR on the test demographics screen, if required.
J+X Point
The measurement point J+X for ST analysis may be determined by the program or manually by the user.With
“manual”, you can make a preliminary adjustment of the J+X
point on this screen and then shift the E, J and J+X points
during the exercise test. In the automatic mode, the J+X point
is calculated in dependence of the heart rate (for HR of
60 BPM, X=60 ms, X becomes smaller with increasing heart
rates). For calcuation of the ST/HR slope, the “manual”
method must be selected and the reference point should be set
at J + 60 ms.
227 498 02-A
CardioSys V 4.1
127
The Exercise ECG / Exercise-Test Defaults
Page 2 (Figure 4.2-51)
1-mV Cal Pulse
Display of 1-mV calibration pulse: yes or no (
X
yes)
Audible LEAD OFF Alarm
Audible signal when an electrode is disconnected: yes or no
( X yes)
Audible HR Alarm
Audible signal when heart rate limit is exceeded: yes or no
( X yes)
Diagram: HR in % of max. HR
Do you wish to have this diagram displayed on the exercisetest screen (section 4.2.4 “Running an Exercise Test”)?
Remote View
Enables or disables transfer of the procedure data from a
remote exercise-test station to the local station (section 4.2.8
“Monitoring Remote Exercise-Test Workstations”).
RPP Readout
Display of the RPP (rate pressure product)? Select or deselect.
Start clock at pretest
Check this box if you want the clock to start with the pretest
phase.
128
BP Monitor
For selection of BP monitor to be used:
– no: no blood-pressure monitor available (you will be
asked to take the blood pressure manually)
– in ergometer: a monitor is integrated in the ergometer
– BP Meter 1: the SunTech 4240 monitor is connected, in
this case you have to select the interface (Port: COM1
through COM4).
– BP Meter 2: Marquette Hellige bosotron 2
– if your system is not equipped with a BP monitor and
you do not wish to be prompted for a BP measurement,
set the BP interval for all test stages in the list to “0”.
Thermal Writer
For selection of the interface where the thermal printer is
connected (LPT1 through LPT4). After the configuration,
restart the Windows program.
Monitored Leads
Allows you to select the number of leads to be monitored (3,
6, 12).
Displayed Leads
Allows you to select the number of leads to be displayed (3 or
6).
CardioSys V 4.1
227 498 02-A
The Exercise ECG / Exercise-Test Defaults
Setup/ Exercise Test
Page 1
Page 2
X 1-mV Cal Pulse
Monitored Leads
12
Audible LEAD OFF Alarm
Displayed Leads
6
Audible HR Alarm
Lead Sequence
Diagram: HR in % of max. HR
Protocol
X Remote View
Phases
X RPP Readout
Modify…
STANDARD
STANDARD
Bruce CABRERA
NEHB
HIGH
A P-Bruce
Modify…
Lead Sequence
The lead sequences change with the number of recorded
channels (3, 6, or 12). You can choose from 6 different sequences. Two of these (sequence 1 and 2) are fixed. The
others can be modified as follows (also you can differentiate
between the sequence on screen and on the printout):
B Bruce
Start clock at pretest
C R-Bruce
BP Monitor
BP Meter 1
Click the arrow to the right of Lead Sequence to
open the lead sequence window (Figure 4.2-52).
Ergometer Model Internal Treadmill
Port
COM2
Port
Thermal Writer
(AR200P) local
none
COM1
Modify…
Library: Comments
Cancel
OK
Select the sequence that you wish to modify (any sequence, except 1 and 2).
Help
Figure 4.2-52. Lead sequence selection window
Select
Modify…
X 1-mV Cal Pulse
Page 2
Label
Screen Sequence
I
Monitored LeadsI
12
Audible LEAD OFF AlarmII
II
Displayed LeadsII
6
Audible HR Alarm
III
Lead Sequence III
STANDARD
III
Diagram: HR in % of max.
aVRHR
aVL
X RPP Readout
Start clock at pretest
Port
Thermal Writer
(AR200P) local
aVR
Modify…
Modify…
Bruce
aVL
aVL
Phases
A P-Bruce
aVF
aVF
aVF
V1
V1
V1
V2
V2
V2
V3
V3 Ergometer Model V3Internal Treadmill
V4
V4 Port
V4
V5
V5
V5
V6
V6
BP Meter 1
A window opens showing all channels (Figure 4.2-53). There
is one window for each of the channels indicating the lead
currently assigned to that channel.
aVR
Protocol
X Remote View
BP Monitor
.
Setup/
Exercise
Test
Modify
Lead
Sequence
STANDARD
Report
Sequence
I
Page 1
Modify…
B Bruce
C R-Bruce
COM2
none
OK
COM1
Modify…
Library: Comments
V6
Cancel
OK
Help
Cancel
Help
Figure 4.2-53. Modifying the lead sequence
227 498 02-A
CardioSys V 4.1
129
The Exercise ECG / Exercise-Test Defaults
Click the box or the arrow
leads (Figure 4.2-54).
Setup/
Exercise Test
Modify Lead
Sequence
NEHB
Report
Sequence
I
X 1-mV Cal Pulse
II
Audible LEAD OFF Alarm
III
aVR
Audible HR Alarm
aVL
Diagram: HR in % of max. HRaVF
V1
X Remote View
V2
V3
X RPP Readout
V4
V5
Start clock at pretest
V6
D
BP Monitor
BP Meter 1 A
J
Page 1
Port
Thermal Writer
(AR200P) local
COM2
Label
Page 2
Screen Sequence
I
Monitored
Leads
I
12
II
Displayed
Leads
II
6
III
Lead
Sequence
III
STANDARD
aVR
aVR
Bruce
Phases
A P-Bruce
aVL
aVL
aVF
D
BD Bruce
A
CA R-Bruce
Enter up to 4 characters in the “Label” column to label
the lead.
J
J
Ergometer
Model Internal
Treadmill
I
Port
I
II
II
OK
Select the new lead to be recorded in the respective
channel.
aVF
II
III
Modify…
Protocol
I
none
Modify…
to display all available
COM1
Modify…
Library:
Comments III
III
Cancel
OK
Help
Cancel
Help
Once you have assigned a lead to each of the channels, you
can enter a name for the lead sequence in the headline.
Figure 4.2-54. Modifying the lead sequence
Move the cursor to the text box at the top and click.
Enter a name and click on
dow.
OK
to clear the win-
The “Print Sequence” column allows you to assign the acquired leads to the printer channels.
Protocol
A protocol comprises up to three phases. These are the pretest phase, the exercise phase and the recovery phase. The
program comes with several preconfigured protocols for the
various patient categories (for instance: BRUCE protocol). In
the “Protocol” window you select the default protocol, specify
a new protocol or modify existing protocols.
Click
to open the window, then select the protocol.
The test phases of this protocol appear in boxes A, B,
and C. This concludes selection of the default protocol.
130
CardioSys V 4.1
227 498 02-A
The Exercise ECG / Exercise-Test Defaults
Modify…
Click Modify… if you wish to modify an existing protocol or to define a new one. This will open the entry
window (Figure 4.2-55).
Modify Protocol
Protocol
Bruce
Phases
A Pretest
Ramping
B Bruce
Ramping
C Recovery
Ramping
Existing Phases
P-Bruce
Bruce
R-Bruce
P-ModBruce
ModBruce
New
Modify…
Select phases B and C in the same way.
Delete
Cancel
OK
Click in the box for phase A, then select one of the
phases in the window by clicking.
Help
Select “Ramping” if you wish the load to increase gradually over the specified time of the phase.
Figure 4.2-55. Protocol entry window
☞
The program can save up to 10 different test
protocols.
Modify…
Position the cursor on the parameter to be changed and
click.
Modify Phase
Phase
P-Bruce
Type:
TM Square
Stage
Speed
Grade
ST Time in Stage
Supine
0.0
0.0
1
99:00
2
Stage
If you wish to modify specific parameters of one of the
phases, or create a new phase, click Modify… or New .
This will open the window allowing you to define a test
phase (Figure 4.2-56).
ECG Rec.Int
BP Interval
00:00
00:00
Enter the new value. It is possible to leave a box blank or
to remove a parameter.
3
Supine
Modify the other parameters in the same way.
Speed
SP 0.0
mph
Grade
GR 0.0
%
Time in Stage
TS 99:00
min
OK
ECG Rec.Inter.
EI
00:00
min
Cancel
BP Interval
PI
00:00
min
Help
If you wish to create a new phase, enter a (new) name
under which the phase will be saved.
Click on
Figure 4.2-56. Window for definition of a test phase
1 Phase
2 Phase parameters
3 Entry boxes
227 498 02-A
OK
to clear the window.
A modified phase stored under a new name is not automatically included in a test protocol. For this, it must be selected
from the list.
CardioSys V 4.1
131
The Exercise ECG / Exercise-Test Defaults
Modify…
Modifying Square-Wave Tests
Modify Phase
Phase
P-Bruce
Type:
TM Square
Stage
Speed
Grade
ST Time in Stage
Supine
0.0
0.0
1
99:00
2
Stage
ECG Rec.Int
BP Interval
00:00
00:00
Click the stage to be modified (reverse video, 2, Figure
4.2-56). The corresponding values will be displayed at 3
(Figure 4.2-56).
3
Click the value to be modified and type the new value
(you are free to leave entry boxes open and to delete
values).
Supine
Speed
SP 0.0
mph
Grade
GR 0.0
%
Time in Stage
TS 99:00
min
OK
ECG Rec.Inter.
EI
00:00
min
Cancel
BP Interval
PI
00:00
min
Help
OK
Having made all necessary changes, click
to
clear the window or click the next stage to be modified.
Figure 4.2-56. Window for definition of a test phase
1 Phase
2 Phase parameters
3 Entry boxes
☞
If you wish to add a stage, click ... below the last stage.
Enter the new values as described above.
Some of the test phases, such as WHO, cannot be
modified. When you change any of its parameters
you must save it under a new name.
Warning
Do not specify BP intervals < 2 min. This may
result in wrong values and may damage the
tissue.
☞ The results of BP measurements that take longer
than 60 s to complete are entered in the next line
of the table. You can avoid this effect by selecting
a shorter interval for the first BP measurement
which will then start earlier.
Example: measurement duration 90 s
interval
3 min
1st BP interval
2:30 min
132
Enter a name for the phase and click on
clear the window.
OK
to
–
A test stage suitable for inclusion in a test protocol
must comprise the parameters speed, grade and
stage time.
–
You may add any number of stages that consist of a
recording interval and a BP interval only.
–
Stage names are adopted only when they include all
required parameters.
–
Up to 120 values can be entered, irrespective of the
number of stages. Blank entry boxes will not be
counted.
CardioSys V 4.1
227 498 02-A
The Exercise ECG / Exercise-Test Defaults
☞
If the basic load or load duration is missing for one
of the square-wave or treadmill tests, the system
will skip this stage during the actual stress test.
–
if your system is not equipped with a BP monitor
and you do not wish to be prompted for a BP
measurement, set the BP interval for all test stages
in the list to “0”.
Ergometer/Treadmill
Allows you to select the ergometer/treadmill model used for
the test.
Port
Allows you to select the communications port to which the
ergometer/treadmill is connected (default: COM 2).
Comments Library
Here you may enter or modify comments to be added to the
procedure “during the test” (section 4.2.4 “Running an
Exerise Test”).
Modify…
Select Modify… : A window opens showing the library of
existing comments (Figure 4.2-57).
Setup/ Exercise Test
Page 1
Page 2
X 1-mV Cal Pulse
Monitored
Library:Leads
Comments 12
Audible LEAD OFF Alarm
Displayed Leads
6
During Test
Audible HR Alarm
Lead Sequence
Chest discomfort
Diagram: HR in % of max. HR Dyspnea
Leg discomfort
Protocol
Fatigue
X Remote View
Nausea Phases
X RPP Readout
Syncope
Contrast agent administered
Start clock at pretest
Modify…
STANDARD
Modify…
Bruce
Enter the modification.
A P-Bruce
B Bruce
C R-Bruce
BP Monitor
Select
BP Meter 1
Ergometer Model Internal Treadmill
Port
COM2
Thermal Writer
(AR200P) local
none
Port
Move the cursor to the item you wish to change and click.
OK
to clear the window.
COM1
Cancel
OK
Help
Modify…
Library: Comments
OK
Cancel
Help
Figure 4.2-57. Standard comments entry window
227 498 02-A
CardioSys V 4.1
133
The Exercise ECG / Monitoring Remote Exercise-Test Workstations
Cardio Sys (Supervisor)
Baker, Dave, 41yrs
Remote Exercise Test Screen
mph
01:251Bruce
01:25 Stage 2
1
4
I
2
3
•••
%2
5
HR/min
0.0
3
6
84
% of 181
RPP
110
SYS/DIA (mm/Hg)
The program allows you to monitor exercise tests at remote
stations from your PC. Click
to call up the monitoring
screen (Figure 4.2-58). The function is available only when
you have entered a station name in the system setup menu at
both stations (section 6).
Return
Station:
Stress Lab 1
II
III
0.15 mV/s
0.01 mV
aVR
4.2.8 Monitoring Remote ExerciseTest Workstations
V4
0.15 mV/s
-0.01 mV.63 mV
7
Values
at rest
aVL
Click on
to display the procedure selection menu.
10 mm/mV
aVR
25 mm/s
Figure 4.2-58. Monitoring of a remote exercise-test station
1 Durations, phase name, stage number
2 Speed and grade
3 Heart rate, blood pressure, RPP
4 Key to call up further ECG leads
5 Buttons to call up further remote stress-test
stations
6 Button to terminate the monitoring function
7 ST measurement results (resting beat, current
beat)
☞
134
Conditions for monitoring of remote exercise-test
workstations are:
– a station name was entered
– the monitoring function is enabled
– the correct communication protocol (netbios.exe
or TCP/IP) is installed and selected (System
Services –> System Configuration –> Remote
Test Screen).
Select the remote exercise-test monitoring screen (button
).
In the selection window, click the station you wish to
OK
monitor. Then click
to clear the window.
The remote station screen is made up in the same way as the
exercise-test acquisition screen: durations, phase name and
stage number (1), speed and grade (2), heart rate, blood
pressure (3), buttons to display more ECG leads (4), buttons
for selection of other remote exercise-test stations (5) and the
button which is used to quit the monitoring
Return ...
function (6).
☞
CardioSys V 4.1
When data are lost while transferred via the network (slow PC), you will be alarmed by a red bar.
227 498 02-A
The Exercise ECG / Using the Function Keypad
1
2
3
4
4.2.9 Using the Function Keypad
5
Power
new patient
start exercise
load/
speed +
grade +
next
stage
retrieve patient
start recovery
load/
speed -
grade -
hold
stage
prepare final report
start
system defaults
stored
ECG <<
stored
ECG
stored
ECG >>
comments
BP
lead
check
freeze
ECG
close window
ST
medians
ST
profilr
trends
Start the program.
*
Press new patient or retrieve patient (1) and enter the
patient data.
*
Start the test with
*
Start the exercise phase with (2) start exercise and ask the
patient to start pedalling or start the treadmill with
start (5).
STOP treadmill
.
12 lead
rhythm
system setup
*
comparative
medians
writer
STOP
recall
Now you can:
12 11 10 9
8
Figure 4.2-59. The function keypad
227 498 02-A
7
6
*
Advance to the next stage (next stage (5)) or continue at
the same stage (hold stage (5)).
*
Start and stop the treadmill with STOP treadmill and
start (5).
*
Increase or decrease the speed (load/speed +/– (5)).
*
Increase or decrease the elevation of the treadmill belt
(grade +/– (5)).
*
Display and review the ECG strips (stored ECG (9)).
Press close window (11) to clear the window from the
screen.
*
Enter BP readings and comments (BP/comments (7)).
Press close window (11) to clear the window from the
screen.
CardioSys V 4.1
135
The Exercise ECG / Using the Function keypad
1
2
3
4
5
*
Check the ECG signal quality (lead check (7)). Press
close window (11) to clear the window from the screen.
*
Freeze and release the ECG signal traces with freeze ECG
(7).
*
Display the ST measurement results with ST medians,
ST profile (8). Press close window (11) to clear the
window from the screen.
*
Display graphic trends with trends (8). Press close window (11) to clear the window from the screen.
*
Start and stop the thermal-array printer with keys (6).
*
Initiate the recovery phase with start recovery (3).
*
End the exercise test with prepare final report (4).
Power
new patient
start exercise
load/
speed +
grade +
next
stage
retrieve patient
start recovery
load/
speed -
grade -
hold
stage
prepare final report
start
system defaults
stored
ECG <<
stored
ECG
stored
ECG >>
STOP treadmill
12 lead
rhythm
system setup
comments
lead
check
freeze
ECG
close window
ST
medians
ST
profilr
trends
12 11 10 9
BP
8
comparative
medians
writer
STOP
7
Figure 4.2-59. The function keypad (repeated)
136
recall
6
CardioSys V 4.1
227 498 02-A
The Exercise ECG / Short-Form Operating Instructions
4.2.10 Short-Form Operating Instructions
MEDITRONIC M 400
Test Information
MEDITRONIC M 40
Start program
Start program
Call up the exercise-test screen
Call up the exercise-test screen
Admit new patient or select patient from list
Admit new patient or select patient from list
Apply electrodes and check signal quality
Apply electrodes and check signal quality
Enter the test information
Test Information
Select protocol
Select protocol
Adjust initial load at the ergometer as required by
the selected protocol
Adjust initial load and load increase/stage
as required by the protocol selected at the ergometer
Click
button and wait for ST values to
be displayed (option)
Phase
Click
button and wait for ST values to
be displayed (option)
Click button and start pedalling
>>
Phase
Click button and start pedalling
>>
Repeat all load changes of the selected program at
the ergometer
Stage
>>
Interactive load changes (+5W) and adjustment of
load for recovery phase
Selects the next stage
+5
-5
Modifies the load in 5-Watt increments
Maintains the stage
Hold
Phase
+5
Enter the test information
-5
>>
Selects the recovery phase
Modifies the load in 5-Watt increments
Quits program
Phase
>>
Selects the recovery phase
Quits program
227 498 02-A
CardioSys V 4.1
137
The Exercise ECG / Short-Form Operating Instructions
ERGOCOMP EC 560/ECB 561, ERGOLINE 900/900L,
EC 1200 V3.52
Test Information
Hold
Stage
MEDITRONIC M 700, ERGOCOMP EC 1200
Start program
Start program
Call up the exercise-test screen
Call up the exercise-test screen
Admit new patient or select patient from list
Admit new patient or select patient from list
Apply electrodes and check signal quality
Apply electrodes and check signal quality
Enter the test information
Test Information
Select protocol
Select protocol
Click
button and wait for ST values to
be displayed (option)
Click
button and wait for ST values to
be displayed (option)
Start pedalling
Start pedalling
Maintains the load stage
Load changes can be made at the ergometer only
(with M700 only for the custom-programmed
protocols)
Switches to the next load stage (only with
>>
ERGOLINE 900/900L)
Phase
+5
Phase
-5
>>
Enter the test information
>>
Modifies the load in 5-Watt increments
Selects the recovery phase
Quits program
Selects the recovery phase
Quits program
138
CardioSys V 4.1
227 498 02-A
The Exercise ECG / Short-Form Operating Instructions
Treadmill
Start program
Phase
>>
Starts exercise test
Activate exercise-test mode
Stage
>>
Advance to the next load stage
Enter new patient data or select patient from list
Apply electrodes and check signal quality
Test Information
Hold
+
–
Maintains the stage
Modifies the speed and grade (note: interrupts
automatic program control)
Enter the test information
Stop Treadmill
Stops treadmill (without interrupting the test)
Start Treadmill
Restarts treadmill
Select test protocol
OK
Record resting ECG (supine patient)
Phase
Stage
>>
>>
Selects the recovery phase
Record resting ECG (standing patient)
Quits program
Stage
>>
Record ECG of hyperventilating patient
Stage
>>
Starts pre-test phase
Start Treadmill
227 498 02-A
CardioSys V 4.1
139
The Exercise ECG
For your notes
140
CardioSys V 4.1
227 498 02-A
The STAT ECG
4.3 The STAT ECG
The STAT ECG function allows you to record a resting
ECG and save an ECG of up to 30 minutes duration. The
first 10 seconds of the recording will be analyzed and you
will obtain the same report (on screen and via the printer) as
for the resting ECG.
This section describes the operating steps necessary to
record a STAT ECG, namely how to
–
apply the electrodes to the patient and connect the
patient
–
record the ECG
–
call up the report pages for on-screen review
–
select the default system settings
–
Printing the report and comparing two ECGs is described in sections 4.1.5, 4.1.6 and 4.1.7 (this is identical with the resting ECG). In these sections you will
also be informed on how to display the stored fulldisclosure ECG.
The brief operating instructions at the end of this section
sum up what you have to do to record a STAT ECG.
227 498 02-A
CardioSys V 4.1
141
The STAT ECG
4.3.1 Applying the Electrodes
Careful application of the electrodes is a prerequisite for
obtaining interference-free ECGs. The signal acquisition
screen immediately gives you a visual indication of your
electrode technique and of the signal quality (provided the red
R electrode is applied).
For quick, reliable and trouble-free application of the electrodes we recommend our Electrode Application System (refer
to the Electrode Application System operator’s manual).
As an alternative you can use the conventional plate electrodes on the limbs and the suction electrodes on the thorax.
Figure 4.3-1. Applying plate electrodes
Applying Plate Electrodes (Limbs)
☞
142
The red R electrode is the reference electrode.
Placement and signal quality of all other electrodes can be assessed on the signal acquisition
screen only when this electrode is applied.
Plate electrodes are applied by means of a rubber strap; electrode paper is the recommended contact medium for this type
of electrode.
*
Moisten the electrode paper with tap water and place it
between skin and electrode.
*
Secure the electrode with the rubber strap (Figure 4.3-1)
so that it cannot shift during the recording; take care not
to strangulate blood vessels in the process.
CardioSys V 4.1
227 498 02-A
The STAT ECG
Applying Suction Electrodes (Thorax)
C1
C3R
C4R
C2
C3
Shave application points, if necessary.
*
Moisten electrode paper with tap water and place it
between skin and electrode. Electrode cream or gel can
be used here instead of the paper. Especially when the
chest is a little hairy, cream or gel helps to seal.
C5
C6
C4
Electrode Application Points for Standard Leads
(I, II, III, aVR, aVL, aVF, V1 to V6)
C8
C7
Four limb and six chest electrodes must be applied for acquisition of the standard leads. Attach the limb electrodes above
the wrists and ankles. Figure 4.3-2 shows the chest lead
application points:
C6
C4R
*
C5
C3R C1 C2 C3 C4
Figure 4.3-2. Chest electrode application points
N black
R red
C1
C2
C3
C4
C5
C6
C7
right leg
right arm
C1 white
C1
C2 white
C3 white
C2
C3
C5
C4
C6
C4 white
C5 white
C6 white
C8
L yellow
left arm
F green
C7
C6
left leg
C1 C2 C3 C4
in the 4th intercostal space at the right sternal edge
in the 4th intercostal space at the left sternal edge
at the level of the 5th rib midway between C2 and C4
in the 5th intercostal space on the left midclavicular line
on the left anterior axillary line between C4 and C6
on the mid-axillary line at the level of C4
in the 5th intercostal space on the left posterior axillary
line
C8 in the 5th intercostal space on the left scapulary line
C3R opposite C3, on the right side of the thorax
C4R opposite C4, on the right side of the thorax
C5
*
Connect the 10-wire patient cable as shown in Figure 4.3-3.
Figure 4.3-3. Connecting the patient cable
(10-wire, standard ECG leads)
227 498 02-A
CardioSys V 4.1
143
The STAT ECG
*
correct
Arrange the patient cable as shown in Figure 4.3-4 and
connect it to the system (type CF signal input: highly
isolated, suitable for intracardiac application, defibrillation-proof).
incorrect
Figure 4.3-4. Arranging the patient cable
144
CardioSys V 4.1
227 498 02-A
The STAT ECG
Electrode Application Points for NEHB Leads
Figure 4.3-5 shows the application points for the NEHB
electrodes. Connect the 12-wire patient cable as shown in
Figure 4.3-6 (Nap is identical with C4).
*
As an alternative the NEHB leads can also be acquired with the
10-wire patient cable. In this case, select the sequence High,
Right or Left as described in section 4.1.7 (“Modifying the
Lead Sequence”) and change:
I
to
D
II
to
A
III
to
J.
Figure 4.3-5. Electrode application points for NEHB leads
Nst attachment point of the 2nd rib to the right
sternal edge
Nax in the 5th intercostal space on the left posterior
axillary line (identical with C8)
Nap in the 5th intercostal space on the left midclavicular line (identical with C4)
N black
R red
If necessary disable the anti-drift system and the filters
(muscle and AC line filter) to view the unfiltered “raw”
ECG signal (sections 4.3.2 and 4.3.4).
Apply the R electrode to Nst
the L electrode to Nax (C8)
the F electrode to Nap (C4).
☞
It is not possible to record chest leads at the same
time as NEHB leads.
☞
Please observe the information given in sections
7.1 “”Artifact Due to Poor Electrode Application”, 7.2 “ECGs of Pacemaker Patients” and 7.3
“ECG Recording During Defibrillation” in the
appendix.
right leg
right arm
C1 white
Nst
C2 white
C1
C3 white
C2
C3
C5
C4
Nst
C6
(Nap)
C4 white (Nap)
C8 Nax
Nax
C8
C5 white
C7
C6 white
C6
L yellow
left arm
F green
left leg
C1 C2 C3 C4
Nst
Nap
C5
Figure 4.3-6. Connecting the patient cable (12-wire, NEHB leads)
227 498 02-A
CardioSys V 4.1
145
The STAT ECG
4.3.2 The STAT ECG Acquisition
Screen
Hellige
Patient
Procedure
System Services
Baker, Dave, 41 yrs
Help
STAT ECG / Signal Acquisition
Measurements
Freeze Traces
Options
2
1
3
HR(BPM)
»
81
V1
00:00
The signal acquisition screen (Figure 4.3-7) shows:
1 2
3
6
4
aVF
V4
V5
aVL
7
4 5 6
R
L
N
F
the current heart rate (2) and the remaining storage time
for the full-disclosure ECG (3)
–
the applied electrodes and the signal quality (4). Furthermore an arrow (6) points to the leads which are impaired
by improper electrode application or which cannot be
recorded due to disconnected electrodes (or due to a
break in the patient cable).
–
the selected lead sequence (5) (click on
another lead sequence)
–
the selected gain (the 1-mV calibration pulse (7) is valid
for all channels).
Lead Sequence
5
STANDARD
V6
Spline
Figure 4.3-7. Signal acquisition screen for the STAT ECG
1 Control buttons
2 Current heart rate
3 Remaining full-disclosure ECG storage time
4 Applied electrodes
green: properly applied
yellow: not properly applied
white: site not used
red: electrode off or lead break
5 For selection of the lead sequence
6 Leads impaired by poor signal quality
7 Calibration pulse
146
–
Poor Signal Quality
L
ON
☞
to display the STAT ECG signal acquisi-
V2
V3
aVR
Click on
tion screen.
ECG Storage(min:s)
The applied electrodes are shown on the torso
only for the ”Standard” and ”CABRERA” lead
sequences. In all other cases there is only a
schematic representation of the electrodes. The
reference electrode R (red) must be applied for
the lead-check function to work properly.
to select
This program allows you to select specific system settings
similar to a conventional ECG recorder. You can enable or
disable muscle and AC line filters, select different sweep
speeds and sensitivities, etc. Furthermore, you can set up the
system to suit your personal needs and preferences. These
settings will be retained and are activated each time the system
is turned on (section 4.3.4 “Setup”). From the setup menu
you also choose the format for the in-test reports.
CardioSys V 4.1
227 498 02-A
The STAT ECG
☞
☞
Click
tons.
The system can be set up to display the patient
selection screen when the STAT ECG is activated.
Select
4.3.4).
Please remember that a filter may also suppress
diagnostically relevant information, as it limits
the frequency bandwidth. Therefore you should
not switch filters on indiscriminately.
Options >>
Setup
to display the system settings but-
to display the setup menu (section
The 40 Hz box switches a muscle filter on and off
The 50 Hz check box switches an AC filter on and off
( X = AC filter on).
The arrows at ... mm/mV select the gain (2.5, 5, 10, 20,
40 mm/mV).
☞
Settings selected from the setup menu will be
retained and are automatically activated each
time the system is turned on.
The arrows at ... mm/s select the trace sweep speed
(25 or 50 mm/s).
The entire ECG recording is controlled with the four buttons:
☞
The test information screen appears automatically
when you check the “Patient Selection Prior to
STAT ECG” box in the system setup menu. The
same screen can also be displayed by clicking on
the Test Information button.
227 498 02-A
Test Information
Freeze Traces
Options >>
The following pages explain the operating steps required to
record a STAT ECG.
CardioSys V 4.1
147
The STAT ECG
4.3.3 Recording a STAT ECG
Hellige
Patient
Procedure
Baker, Dave, 41 yrs
System Services Help
STAT ECG / Signal Acquisition
HR [BPM]
Measurements
Setup
X 40 HZ X 50 HZ
Freeze Traces
10 mm/mV
94
Options >>
25 mm/s
ECG Storage [min:s]
19:29
V1
V2
1 2
3
V3
aVR
V4
aVL
V5
aVF
V6
4 5 6
R
L
N
F
Analyzing
When you click
, the program starts analyzing the
first 10 seconds of the ECG. The analysis results are displayed
in the lower portion of the screen. Then the program continues collecting the ECG, at the same time scanning it for
arrhythmias such as fibrillation/flutter, ventricular tachycardia, either until the set time has elapsed or until you click
.
Click the
button: The signal acquisition
screen appears (Figure 4.3-8).
Figure 4.3-8. STAT ECG acquisition screen
☞ The system may be configured to display the
patient selection screen before the signal acquisition screen.
In the bottom right-hand corner the system informs you of its
current activities. Below the heart rate you see the time remaining for ECG storage. At the end of the analysis the
results are automatically displayed.
Click Freeze Traces to freeze and release the ECG trace
(except channel 1).
Click Measurements to display or suppress the results of the
ECG analyis.
Click
to terminate full-disclosure ECG acquisition (when the set time has elapsed, the program stops
automatically collecting the ECG).
☞
148
At the end of the analysis the
button
Setup
turns into the Event Mark button and the
Start Rhythm
button appears instead of the filter
check boxes.
Click Options >> to display or suppress the second line
of control buttons.
Click
CardioSys V 4.1
Event Mark
to display a marker.
227 498 02-A
The STAT ECG
The Start Rhythm button initiates the thermal writer. It
will record the ECG displayed on the monitor screen
until stopped with the Stop Rhythm button.
At the end of the session the program asks you whether or not
you wish to save the results (select a patient).
You obtain the same report documents as those described in
section 4.1.4 “Recording a Resting ECG”) as well as the fulldisclosure ECG as described in section 4.2.4 “Running and
Assessing an Exercise Test” (Figures 4.2-39 and 4.2-40).
☞ However, in the STAT ECG mode it is not possible to save episodes.
It is possible to compare two or more STAT ECG
recordings (section 4.1.5 “Comparing Two ECGs”).
227 498 02-A
CardioSys V 4.1
149
The STAT ECG
Setup
4.3.4 Setup
Hellige
Setup
Speed (mm/s)
25
Gain (mm/mV)
10
Lead Check noise level
low
X 10-s-ECG Analysis
QTC Calculation
Hegglin-Holzmann
X 1-mV Cal Pulse
Manual Override
Lead Sequence
STANDARD
Rhythm Lead
II
X Print after Analysis
Report
X Save full disclosure ECG
Terminate after (min)
Click
4.3-9).
Audible LEAD OFF Alarm
Setup
to call up the setup menu (Figure
X 40-Hz Filter
Modify …
X 50-Hz Filter
Use this screen to select your personal system settings.
X Spline
Modify
Adjustments are made in three different ways:
20
Number of Leads
12
Lead Sequence
STANDARD
Rhythm Lead
II
Thermal Writer (AR200P)
LPT1
OK
1
There is an arrow at the end of a box .
Clicking this arrow will open a window which offers
various options. Select the desired setting by clicking the
mouse button.
2
There is a check box in front of the function. Click the
box to enable or disable the function ( X function
enabled).
3
Click the Modify… button (for instance, to select the Lead
sequence).
Modify …
Cancel
Help
Figure 4.3-9. The setup menu
Top Window
Speed
selects the trace sweep speed.
1-mV Cal Signal
display of 1-mV calibration pulse: yes or no (
Gain
selects the signal size (amplitude)
Lead Check noise level
This is a measure of the quality of the acquired signal (signal
to noise ratio). When there is too much signal noise at the
electrode, the electrode is displayed yellow on the signal
acquisition screen. The setting that you select here (low,
middle, high) changes the threshold as of which the electrode
is displayed yellow (high sensitivity to noise = low threshold).
150
X
yes)
Audible LEAD OFF Alarm
audible signal when an electrode is disconnected: yes or no
( X yes)
Manual Override
When the function is enabled, the program will start the
signal acquisition, even if not all electrodes are applied.
CardioSys V 4.1
227 498 02-A
The STAT ECG
Middle Window
Hellige
Setup
Speed (mm/s)
25
Gain (mm/mV)
10
Lead Check noise level
low
X 10-s-ECG Analysis
QTC Calculation
Lead Sequence
Rhythm Lead
X Print after Analysis
Report
X Save full disclosure ECG
Terminate after (min)
X 1-mV Cal Pulse
Audible LEAD OFF Alarm
Manual Override
Hegglin-Holzmann
STANDARD
STANDARD
X 40-Hz Filter
Modify …
STANDARD
II
CABRERA
HIGH
NEHBModify
X 50-Hz Filter
X Spline
10-s ECG Analysis
Here you determine wheter or not an ECG analysis is to be
made prior to the recording ( X yes,
no). An analysis is
possible only when all 10 electrodes are applied. All adjustments made in this field only refer to the 10-s ECG analysis
(e. g. lead sequence).
20
Number of Leads
12
Lead Sequence
STANDARD
Rhythm Lead
II
Thermal Writer (AR200P)
LPT1
OK
Modify …
Cancel
Figure 4.3-10. Lead sequence selection window
Help
QTC Calculation
Equation for calculation of the QT interval: HEGGLINHOLZMANN or BAZETT.
Lead Sequence
In the lead sequence window you can assign the leads to the
recording channels. Six lead sequences are predefined. Four of
these (sequences 3 to 6) can be modified.
STANDARD:
CABRERA:
HIGH:
NEHB:
LEFT:
RIGHT:
227 498 02-A
CardioSys V 4.1
I, II, III, aVR, aVL, aVF, V1...V6
aVL, I, -aVR, II, aVF, III, V1...V6
I, II, III, aVR, aVL, aVF, V1'...V6'
I, II, III, aVR, aVL, aVF, D, A, J, D, A, J
I, II, III, aVR, aVL, aVF, V4, V5, V6, V7, V8, V9
I, II, III, aVR, aVL, aVF, V4R, V3R, V4, V1, V2, V3
151
The STAT ECG
Modify…
Modifying the Lead Sequence
ModifyHellige
Lead Sequence
Setup
Lead25
Speed (mm/s)
Gain (mm/mV)
Lead Check noise level
X 10-s-ECG Analysis
QTC Calculation
Lead Sequence
Rhythm Lead
Lead
1
I
2
II
3
III
4
Hegglin-Holzmann
aVR
aVR
5
STANDARD aVL
aVL
10
low
Audible LEAD OFF Alarm
II
Manual Override
II
aVF
7
V1'
Modify V1'
8
X Save full disclosure ECG
Terminate after (min)
9
Number of Leads
10
Lead Sequence
11
Rhythm Lead
V2'
V2'
X 40-Hz Filter
Modify …
20
V3'
V3'
12
V4'
V4'
STANDARD
V5'
V5'
II
V6'
X 50-Hz Filter
X Spline
aVF
12 V6'
Thermal Writer (AR200P)
LPT1
OK
OK
Modify …
Cancel
Cancel
Help
Help
Click the arrow
(Figure 4.3-12).
Lead 25
1
I
I
II
3 III
aVR
X 10-s-ECG Analysis
QTC Calculation
4 aVL
aVF
Lead Sequence
5 V1
V2
Rhythm Lead
6 V3
V4
X Print after Analysis 7
V5
Report
V6
8
X Save full disclosure ECG D
Terminate after (min)
A
9
J
Number of Leads
10 V4'
Lead Sequence
11 V5'
Rhythm Lead
12 V6'
Thermal Writer (AR200P)
Lead Check noise level
2
Label
10
low
X 1-mV Cal Pulse
I
Audible LEAD OFF Alarm
II
Manual Override
Enter up to 4 characters in the “Label” column to label
the lead.
III
Hegglin-Holzmann
aVR
STANDARDaVL
II
to display all available leads
Select the new lead to be recorded in the respective
channel.
Hellige
Modify Lead
Sequence
Setup
Gain (mm/mV)
Click the sequence that you wish to modify (lead sequences 3 to 6 only).
Click Modify… to open a window showing all channels
(Figure 4.3-11). There is a window for each of the
channels indicating the lead currently assigned to that
channel. To select another lead
Figure 4.3-11. Modifying the lead sequence
Speed (mm/s)
Click the
box to the right of Lead Sequence to open
the Lead Sequence selection window (Figure 4.3-10).
III
6
X Print after Analysis
Report
X 1-mV Cal Pulse
I
X 40-Hz Filter
Modify …
X 50-Hz Filter
X Spline
aVF
V1'
Modify
Once you have assigned a lead to each of the channels, you
can enter a name for the lead sequence in the headline.
V2'
20
V3'
12
V4'
STANDARD
V5'
II
LPT1
V6'
OK
Modify …
Cancel
Help
OK
Move the cursor to the text box and click.
Cancel
Help
Enter a name and select
OK
to clear the window.
Figure 4.3-12. Modifying the lead sequence
152
CardioSys V 4.1
227 498 02-A
The STAT ECG
Rhythm Lead
Selection of the rhythm or reference lead.
Lead Sequence
Here you determine the lead sequence for the ECG saved
online.
Print after Recording
After analysis of the 10-s ECG, a report is printed automatically, yes/no. The scope of the printout is determined with
menu item “Report Modify”.
Rhythm Lead
Selection of the rhythm or reference lead (Save FD ECG).
40-Hz Filter
enables or disables muscle filter (
Thermal Writer
Selection of the thermal printer port (for printout of the
online ECG, refer to section 4.3.4 “Recording a STAT
ECG”). Select “none”, when no printer is connected.
50-Hz/60-Hz Filter
enables or disables AC filter (
X
X
muscle filter on)
AC filter on)
Audible LEAD OFF Alarm
Audio signal when an electrode is disconnected, yes/no.
Spline
enables or disables the Cubic Spline algorithm (automatic
baseline correction, X Spline on); the algorithm causes a
signal delay of 4 seconds.
Bottom Window
Save full disclosure ECG / Terminate after [min]
You can choose a time interval after which the program
automatically stops collecting the ECG signal (30 min max.).
Number of Leads
Selection of the number of leads to be stored (6 or 12).
227 498 02-A
10-s ECG Analysis
ECG analysis at the beginning of the recording ( X yes,
no). Possible only when all 10 electrodes are connected.
Report Modify
Here you determine the scope of the printed report. The
special configuration screen is described in detail in section
4.1.6 “Printing the Resting ECG”.
Print after Analysis
Do you wish to print the report configured on the screen
mentioned above after each STAT ECG recording or not?
CardioSys V 4.1
153
The STAT ECG
4.3.5 Recording a STAT ECG
(Brief Operating Instructions)
Turn on system and activate the STAT ECG
program
Apply electrodes and check signal quality
mm/mV
Test Information
Select procedure parameters (sweep speed, gain,
lead sequence)
Enter the test information
Watch ECG traces and – when the most recent
10 seconds are without artifacts – start recording
(the first 6 s are analyzed, then the system starts
signal acquisition)
The recording ends automatically when the
selected time has elapsed or when you press the
button
The 10-s ECG segments are displayed
Scroll through the report or
access documents directly
Proceed to next procedure or
Quit program
154
CardioSys V 4.1
227 498 02-A
The Spirometry Test
4.4 The Spirometry Test
A spirometry test includes
–
measurement of the expiratory and inspiratory vital
capacity (VC) plus presentation of the expiratory
volume-time curve
–
measurement of the expiratory and inspiratory forced
vital capacity (FVC) plus presentation of the volumetime and flow-volume curves
A parameter table lists all measured values, the normal
values and the percentage deviation of each parameter.
You can also run two procedures as a so-called bronchodilation test. For this purpose two tests (one before and one
after medication) are compared.
This section tells you how to
227 498 02-A
–
connect the respiration flow sensor
–
enter the test information and patient data (reason for
test, medication, comments, etc.)
–
conduct a test
–
call up and print the report pages
–
compare two tests
–
set up the system to suit your needs (setup menu)
CardioSys V 4.1
155
The Spirometry Test / Connecting the Respiration Flow Sensor LF 501
4.4.1 Connecting the Respiration
Flow Sensor LF 501
The respiration flow sensor is connected to the interface
selected from the setup menu (section 4.4.7 “Setting up the
Spirometry System”). The factory-set interface is COM2.
For detailed user instructions and specifications, please refer
to the LF 501 operator’s manual 227 362 02.
Figure 4.4-1. Respiration Flow Sensor LF 501
156
CardioSys V 4.1
227 498 02-A
The Spirometry Test / The Basics
Patient
Untersuchung
4.4.2 The Basics
ProcedureHellige
Selection Menu
Hilfsfunktionen
Hilfe
ECG
External Programs
(Unbenannt)
Rest ECG
Exercise Test
STAT ECG
Right-Heart
Catheterization
Holter ECG
Monitoring
External Programs
120/80
HELLIGE CARDIOSOFT
Ambulatory Blood
Pressure
Late Potentials
T1.0a
Click
to display the spirometry procedure screen. You
will find this icon on the procedure selection screen, unless
you have configured the icon bar to include that symbol
(section 6. “System Services”).
Setup
Click
to display the procedure selection screen
(Figure 4.4-2).
Spirometry
…
Spirometry
Bronchodilation
Cancel
Figure 4.4-2. Procedure Selection screen
227 498 02-A
Help
Click
to display the spirometry procedure screen.
Once you select a patient, the system will display the test
information entry screen (Figure 4.4-3).
CardioSys V 4.1
157
The Spirometry Test / Entering the Test Information
Test Information
4.4.3 Entering the Test Information
Test Information
Library: Reason for Test
ABE
Respiratory problems
Shortness of breath
Pain
Follow-up
A
Reason for Test
F
B
A
C
2
»
The test information screen provides space for entry of important information pertaining to the spirometry test.
1
3
Medication
…
OK
Comment
Physician:
Dr. Williams
Technician:
Dorothy
4
These are:
– the reasons for test
– the medication
– comments
– the technician’s and the physician’s names.
Cancel
Help
Figure 4.4-3. The test information entry screen
1 Standard reasons for test
2 The patient’s reason for test
3 Medication
4 Boxes for entry of comments and of the physician’s and technician’s names
Copying Statements from the Library to the Patient
Window
The system provides a library whose statements can be easily
copied to the patient’s window. You can add statements or
edit existing ones as required.
Highlight a statement by clicking.
Click the
button.
If you wish to delete a copied statement or part of it,
highlight the words in question and click
A .
The deleted words can be inserted in another position by
placing the cursor there and clicking B A C .
You can enter a statement directly by moving the cursor
to the desired position and typing the text.
158
CardioSys V 4.1
227 498 02-A
The Spirometry Test / Entering the Test Information
ABE
F
Editing the Library
Modify Library: Reason for Test
Respiratory problems
Shortness of breath
Pain
Follow-up
–
–
–
–
–
–
–
–
–
Click
ABE
F
.
This will open the library window (Figure 4.4-4).
OK
Cancel
Move the cursor to the desired position in the list and
click the mouse button.
Help
Figure 4.4-4. Editing the Reason for Test
Enter the statement and press
on the keyboard. The
cursor moves to the beginning of the next line.
☞
A statement is easily copied to the window at right
by double-clicking!
227 498 02-A
In this manner you may enter all reasons for test. Click
OK
to clear the window.
CardioSys V 4.1
159
The Spirometry Test / Entering the Test Information
Test Information
Library: Reason for Test
ABE
Reason for Test
F
Respiration problems
Shortness of breath
Pain
Follow-up
B
A
A
C
Selecting a Medication, Assigning a Drug Name to a Medication Group
»
You can select a medication from a list of 14 items . You
can also assign specific drugs to the medication groups to
include these in the list instead of the group name.
none
beta-blockers
betamimetics
xanthine derivates
corticoids
atropine
cromoglycinic acid
fenoterole
amiodarone
unknown
see Comment
Making a Selection
Medication
…
Comment
OK
Physician:
Cancel
Technician:
Hilfe
Click on
4.4-5).
to open the medication list box (Figure
Select one of the medications.
Figure 4.4-5. List of medication groups
1 Allows you to assign a drug to a medication
group
☞
The physician is responsible for assigning drugs to
a medication group.
If you wish to select a second medication or to assign a
drug name to a medication group, click on … and
select the medication as described above.
Assigning Drugs to a Medication Group
Click on
Medications…
.
Medications…
Medication
Medication Group
A window opens, showing medication group names (Figure
4.4-6). There is a drug name window for each of these groups.
Click on the respective text box, if you wish to enter a name.
Then type the drug name.
Drug Name
none
->
beta-blockers
->
betamimetics
->
xanthine derivates
->
corticoids
->
atropine
->
cromoglycinic acid
->
fenoterole
->
amiodarone
->
unknown
->
see Comment
->
Help
Furthermore, you are free to arrange the medication groups
any way you want. To do so
->
->
OK
->
Cancel
Click on the
at the end of the group name box.
Figure 4.4-6. Assigning a drug to a medication group
160
CardioSys V 4.1
227 498 02-A
The Spirometry Test / Entering the Test Information
This brings up a new window where you can choose one of
the group names (Figure 4.4-7).
Medication
Medication Group
Drug Name
none
none
beta-blockers
beta-blockers
->
betamimetics
xanthine derivates
xanthine derivates
corticoids
->
atropine
corticoids
cromoglycinic acid
atropine
fenoterole
amiodarone
cromoglycinic acid
unknown
fenoterole
see
Comment
->
amiodarone
->
unknown
->
see Comment
->
->
Click on the drug name box and enter the name
->
->
->
Click on
->
Help
OK
->
Cancel
to clear the window.
Entering Comments
->
->
OK
If you wish to enter a comment on the test procedure, click in
the “Comment” text box and key in the text.
Figure 4.4-7. Editing the medication group
Physician’s/Technician’s Name
☞
Simply press
on the keyboard to save the data
and clear the window.
The names of the physician and technician can either be
entered here (click in the text box and type the name), or they
can be selected from the list of the registered system users
(section 6.1 “System Configuration”).
Click on
on it.
and choose a name from the list by clicking
Exiting the Test Information Screen
Once you have entered all test information, you can either
227 498 02-A
–
clear the window with
–
clear the window with Cancel
(in this case the information will be ignored and is not assigned to the test) to
display the test control screen.
CardioSys V 4.1
OK
or
161
The Spirometry Test / Running and Evaluating a Spirometry Test
4.4.4 Running and Evaluating a
Spirometry Test
Hellige
Patient
Procedure
System Services
Baker, Dave, 41 yrs
Spirometry / Recording VC
Test Information
VC Measure
Help
FVC Measure
End
Patient Data
Animation
Setup
150 cm
Male
Interpretation
Miller Sq.
0
Scale
–
+
7
V (I)
Normal Values (ECCS)
1
6
2
3
5
4
3
4
2
1
0
-1
-2
-3
-4
-5
-6
-7
t(s)
1
2
3
4
5
6
7
8
9 10 11 12 13 14 15 16 17 18 19
Value
Act.
Norm.
EVC (l)
FEVC (l)
FEV1 (l)
FEV1/VC (%)
PEF (l/s)
MEF75 (l/s)
MEF50(l/s)
MEF25 (l/s)
MMF (l/s)
IVC (l/s)
FIVC (l/s)
FIV1 (l/s)
FIV1/IVC (%)
PIF (l/s)
MIV75 (l/s)
MIV50 (l/s)
MIV25 (l/s)
MVV (l/min)
3.14
2.68
2.63
2.25
81.0
5.86
5.35
3.76
1.61
3.34
2.68
2.63
2.23
5
2.46
Figure 4.4-8. Spirometry procedure screen
1 Control buttons
2 Patient data
3 Field for interpretation, MILLER square
4 Respiration trace
5 Parameter table
162
0+R
The Spirometry Test Screen
R
%
117
92
Once you enter the test information, the system will display
the spirometry test screen (Figure 4.4-8).
On this screen you see
–
the control buttons (1)
–
the patient data (2)
–
a field for interpretation and the MILLER square (3)
–
a window for display of the recorded trace (4)
–
a table listing the normal values, the actual values and
the deviation as a percentage (5).
92.0
CardioSys V 4.1
227 498 02-A
The Spirometry Test / Running and Evaluating a Spirometry Test
Patient Data
Modifying Patient Data
Select patient (local database)
Search for …
Last Name
Patient ID
Last Name
First Name
Date of Birth
Patient ID
Master
Miller
Richards
Roberts
Shields
Stevenson
Thompson
next page…
Jim
Jane
Chantal
Jennifer
Stuart
Robert
Anthony
10/05/1949
06/04/1943
03/12/1977
07/27/1977
11/11/1912
11/22/1966
09/19/1932
8738999
654987
7766699
543876
765321
333999
665544
Select
New Patient
Delete
Unnamed
Help
Cancel
Close
New Patient…
Last Name
Master
First Name
Jim
Patient ID
8738999
Date of Birth
10/05/1949
Gender
Male
Height
176
in
Weight
66/0
lb
Race
Figure 4.4-9. Patient data screen
For calculation of the spirometric normal values, the program
needs the following patient data:
MM/DD/YYYY
Pacemaker
Accept
age
height
gender.
Without these data which are adopted from the patient file
(section 3. “Selecting and Admitting a Patient”) the normal
values cannot be derived. Height, age and gender are displayed on the spirometry procedure screen (Figure 4.4-8).
If you wish to verify or modify these data, click
Patient Data
to display the patient data screen
(Figure 4.4-9).
Change height and/or weight by clicking the respective
box, then enter the new value(s) via the keyboard.
Enter the patient’s gender by clicking the arrow and
selecting the appropriate option.
OK
Select
to terminate entry or modification of
the patient data.
227 498 02-A
CardioSys V 4.1
163
The Spirometry Test / Running and Evaluating a Spirometry Test
Running a Spirometry Test
Before conducting the first test, specific system settings should
be selected from the setup menu (section 4.4.7 “Spirometry
System Setup”).
The test is conducted with the control buttons (1, Figure
4.4-8).
You can measure the vital capacity VC and the forced vital
capacity FVC and combine both to form a bronchodilation
test (section 4.4.5). Click
to select the bronchodilation
test, or
to select a standard spirometry test.
…
If the first procedure of a bronchodilation test was run as a
normal spirometry test, the program asks you before the
second test, whether the first one is to be taken as the reference measurement.
☞
Before each test, attach a new mouthpiece with
bacterial filter to the sensor.
Before the test, we recommend that you give the patient an
idea of the test by demonstrating the animation.
Click
Animation
to start the demonstration.
When the patient is familiar with the test procedure, you can
start the test.
Attach the nose clip, so that the entire tidal volume flows
through the sensor.
164
CardioSys V 4.1
227 498 02-A
The Spirometry Test / Running and Evaluating a Spirometry Test
Hellige
Patient
Procedure
System Services
Baker, Dave, 41 yrs
Spirometry / Recording VC
Test Information
VC Measure
Help
FVC Measure
End
Patient Data
Animation
Setup
188 cm
Male
Interpretation
Miller Sq.
0
Scale
0+R
–
+
Normal Values (ECCS)
7
V (I)
Value
Act.
Norm.
EVC (l)
FEVC (l)
FEV1 (l)
FEV1/VC (%)
PEF (l/s)
MEF75 (l/s)
MEF50 (l/s)
MEF25 (l/s)
MMF (l/s)
IVC (l/s)
FIVC (l/s)
FIV1 (l/s)
FIV1/IVC (%)
PIF (l/s)
MIV75 (l/s)
MIV50 (l/s)
MIV25 (l/s)
MVV (l/min)
3.14
2.68
2.63
2.25
81.0
5.86
5.35
3.76
1.61
3.34
2.68
2.63
2.23
6
5
4
3
2
1
t(s)
0
1
-1
2
3
4
5
6
7
8
9 10 11 12 13 14 15 16 17 18 19
-2
-3
-4
-5
-6
-7
3.14
Click
and ask your patient to inhale, exhale
and inhale again as deeply as possible through the sensor,
when the orange indicator on the sensor lights up. Then
your patient may resume normal breathing.
R
%
118
The maneuver must be concluded within 20 s of clicking
. The program terminates the measurement when it
does not detect a flow reversal within 4 s of two identified
inversion points, or after five full breaths.
117
The recording area shows the volume-time curve (expiration
only) and the table lists the parameter readings and percentage
deviations from the normal values.
92.0
Figure 4.4-10. VC measurement
Click
to initiate further measurements. The next
curve is depicted with another color and displayed on top of
the first one. The best results for EVC and IVC, which are
not necessarily taken from the same test, give VCmax.
Hellige
Patient
Procedure
System Services Help
Click Scale
Baker, Dave, 41 yrs
Test Information
VC Measure
FVC Measure
End
Patient Data
Animation
Setup
188 cm
7
Flow/Volume
+
Miller Sq.
0
Volume/Time
Normal Values (ECCS)
F (I/s)
6
5
4
3
2
1
0
-1
V(l)
1
2
3
4
+
if you wish to change the curve size.
Male
Interpretation
Scale
–
–
Spirometry / Recording FVC
5
6
7
8
9 10 11 12 13 14 15 16 17 18 19
-2
-3
-4
-5
-6
-7
0+R
Value
Act.
Norm.
EVC (l)
FEVC (l)
FEV1 (l)
FEV1/VC (%)
PEF (l/s)
MEF75 (l/s)
MEF50 (l/s)
MEF25 (l/s)
MMF (l/s)
IVC (l/s)
FIVC (l/s)
FIV1 (l/s)
FIV1/IVC (%)
PIF (l/s)
MIV75 (l/s)
MIV50 (l/s)
MIV25 (l/s)
MVV (l/min)
3.14
2.68
2.63
2.25
81.0
5.86
5.35
3.76
1.61
3.34
2.68
2.63
2.23
3.14
R
Select FVC Measure to measure the forced vital capacity.
You will see a screen similar to Figure 4.4.-11.
%
118
Demonstrate the FVC procedure as well (
117
Animation
).
Start the procedure, when the patient knows what to do.
Check the nose clip is in place.
92.0
Figure 4.4-11. FVC screen
227 498 02-A
CardioSys V 4.1
165
The Spirometry Test / Running and Evaluating a Spirometry Test
Click
and ask the patient to inhale deeply
through the sensor when the orange indicator at the
sensor lights up. Then the patient should exhale as
quickly and completely as possible and inhale again as
deeply as possible. Afterwards your patient may resume
normal breathing.
This maneuver too must be concluded within 20 s of clicking
. The program terminates the measurement when it
does not detect a flow reversal within 4 s of two identified
inversion points, or after five full breaths.
The recording area shows the flow-volume curve and the table
lists the parameter readings and percentage deviations from
the normal values. The program also presents an interpretation (obstruction/restriction) and marks the results in the
Miller square (Figure 4.4-11).
Click
to initiate further measurements. The next
curve is depicted with another color and displayed on top of
the first one. The best results for FEVC are used. The interpretation, the mark in the Miller square and the results in the
parameter table are always those of the most recent measurement.
The best result is the measurement giving the highest sum of
FEVC + FEV1.
Click Scale
–
+
if you wish to change the curve size.
Select Volume/Time to return to the volume-time curve of
the FVC measurement.
166
CardioSys V 4.1
227 498 02-A
The Spirometry Test / Running and Evaluating a Spirometry Test
End
Hellige
Patient
Procedure
System Services
Baker, Dave, 41 yrs
Click
Help
188 cm
1
–
14
Flow/Volume
+
Volume/Time
12
2
10
8
6
4
2
0
-2
V(l)
1
2
3
4
5
6
7
8
Male
Interpretation
Miller Sq.
Obstruction
0
Normal Values (ECCS)
F (I/s)
9 10 11 12 13 14 15 16 17 18 19
-4
-6
-8
-10
-12
-14
0+R
Norm.
Act.
%
EVC (l)
FEVC (l)
FEV1 (l)
FEV1/VC (%)
PEF (l/s)
MEF75 (l/s)
MEF50 (l/s)
MEF25 (l/s)
MMF (l/s)
IVC (l/s)
FIVC (l/s)
FIV1 (l/s)
FIV1/IVC (%)
PIF (l/s)
MIV75 (l/s)
MIV50 (l/s)
MIV25 (l/s)
MVV (l/min)
2.68
2.63
2.25
81.0
5.86
5.35
3.76
1.61
3.34
2.68
2.63
2.23
3.14
2.93
2.57
76.0
5.62
5.56
5.25
1.94
4.23
3.34
3.28
2.61
78.0
3.48
2.93
3.28
2.63
74.5
117
111
114
94
96
104
140
120
127
125
125
117
92.0
81
System Services
Baker, Dave, 41 yrs
Help
the reason for test
the interpretation made by the program
the patient data
medication, comments, physician, technician.
You can enter your own interpretation in the “Interpretation” window by placing the cursor in the window
and typing the text.
Male
Interpretation
F
Miller Sq.
0
Normal Values (ECCS)
Interpretation
Reason for Test
Respiratory problems
Shortness of breath
Medication
Comment
Physician
Technician
–
–
–
–
Spirometry / Display / Test Information
188 cm
ABE
The test information screen shows:
You can record a spoken comment (button
) and play it
back later (button
). For this feature you need a microphone, and a sound card must be implemented in your PC.
Hellige
Procedure
Click
to display the test information screen
(Figure 4.4-13).
R
Value
Figure 4.4-12. Report page
1 Button to call up the test information
2 Button to display the volume/time or the flow/
volume curve
Patient
to terminate this part of the test and
display the report (Figure 4.4-12).
Spirometry / Display / FVC Measurement
Scale
End
Dr. Williams
Dorothy
0+R
R
Value
Norm.
Act.
%
EVC (l)
FEVC (l)
FEV1 (l)
FEV1/VC (%)
PEF (l/s)
MEF75 (l/s)
MEF50 (l/s)
MEF25 (l/s)
MMF (l/s)
IVC (l/s)
FIVC (l/s)
FIV1 (l/s)
FIV1/IVC (%)
PIF (l/s)
MIV75 (l/s)
MIV50 (l/s)
MIV25 (l/s)
MVV (l/min)
2.68
2.63
2.25
81.0
5.86
5.35
3.76
1.61
3.34
2.68
2.63
2.23
3.14
2.93
2.57
76.0
5.62
5.56
5.25
1.94
4.23
3.34
3.28
2.61
78.0
3.48
2.93
3.28
2.63
74.5
117
111
114
94
96
104
140
120
127
125
125
117
92.0
If you wish to enter or edit the test information, click on
to display the corresponding dialog window.
ABE
F
81
Figure 4.4-13. Test information
227 498 02-A
CardioSys V 4.1
167
The Spirometry Test / Running and Evaluating a Spirometry Test
Data Export
Confirming Tests
The
icon allows you to export the most important data
pertaining to the spirometry test to the clipboard or to any
file. Data exported to the clipboard, for instance, can be
inserted in a text file with the “Edit” —> “Paste” command.
A test is considered confirmed, when a physician has reviewed
the test evaluation and “signed” it electronically with his/her
name. Tests that have been reviewed and confirmed by a
physician are marked with x.
Click
.
Click on
(Figure 4.4-13) to display the window
where you can enter your name.
Select either “Export data to clipboard” or “Export data
to file”.
Click on
OK
Select the physician’s name from the list box (click on
) or enter it via the keyboard.
.
Data from the clipboard can be inserted in a text file.
For data exported to a file you will have to specify the target
OK
directory and confirm it with
.
168
CardioSys V 4.1
227 498 02-A
The Spirometry Test / The Bronchodilation Test
4.4.5 The Bronchodilation Test
The bronchodilation test always consists of two measurements, one before and one after medication.
Click
…
to select the bronchodilation procedure.
The screen for VC measurement before medication will be
displayed.
Perform the measurement as described in section 4.4.4.
The screen for VC measurement after medication will be
displayed.
Perform measurement of VC and FVC again.
Click
End
to terminate the measurement.
You will now see both examinations on one screen so that you
can compare the effects of the medication (section 4.4.6
“Comparing Two Spirograms”).
Measure FVC in the same manner.
Click
End
If you decide to run a bronchodilation test on a patient whose
spirogram was recorded earlier that day you will be asked
whether the first spirogram is to be taken as the reference test.
to terminate the measurement.
These tests are saved and annotated as measurement “before
bronchodilation”.
Administer the medication and select the
bronchodilation procedure again.
227 498 02-A
CardioSys V 4.1
169
The Spirometry Test / Comparing Two Spirograms
4.4.6 Comparing Two Spirograms
Hellige
Patient
Procedure
Hilfsfunktionen
re
Compare Procedure
Procedure 1
Baker, Dave 48 10.08.1996
J
11:32:23 Ruhe-EKG / Interpretation
You can compare the present spirogram with another one
recorded earlier. For the example below we assume that you
wish to compare the recent spirogram with an earlier recording of the patient. Of course, you are free to call up any
spirogram (section 3.3 “Editing Stored Tests”) and compare it
with any other spirogram as described below:
Procedure 2
10.08.1996
09.08.1996
08.08.1996
11:32:51
11:12:45
11:07:42
Spirometry
Interpretation (Analyseprogramm)
Spirometry
Spirometry
»
OK
Click
Cancel
.
Help
A window will open listing all of the patient’s spirograms
(Figure 4.4-14).
Figure 4.4-14. Spirometry selection window
Select a spirogram.
OK
Hellige
Patient
Procedure
System Services
Baker, Dave, 41 yrs
Test 1:
Test 2:
Help
Spirometry / Compare / FVC Measurement
188 cm
08.07.1994 · 10:32:54
09.07.1994 · 11:26:22
Male
Miller Sq.
0
Scale
–
14
Flow/Volume
+
Volume/Time
Normal Values (ECCS)
F (I/s)
12
10
8
6
4
2
0
-2
-4
-6
-8
-10
-12
-14
V(i)
1
2
3
4
5
6
7
8
9 10 11 12 13 14 15 16 17 18 19
0+R
R
Value
Norm. Act. 1 % 1
Act. 2 % 2
EVC (l)
FEVC (l)
FEV1 (l)
FEV1/VC (%)
PEF (l/s)
MEF75 (l/s)
MEF50 (l/s)
MEF25 (l/s)
MMF (l/s)
IVC (l/s)
FIVC (l/s)
FIV1 (l/s)
FIV1/IVC (%)
PIF (l/s)
MIV75 (l/s)
MIV50 (l/s)
MIV25 (l/s)
MVV (l/min)
2.68
2.63
2.25
81.0
5.86
5.35
3.76
1.61
3.34
2.68
2.63
2.23
2.10 78
1.88 71
1.85 82
86.0 106
3.86 66
3.82 71
3.40 90
2.17 135
3.20 96
2.15 80
2.22 84
1.83 82
85.0
2.35
1.92
2.26
1.88
53.7 58
92.0
3.14
2.93
2.57
76.0
5.62
5.56
5.25
1.94
4.23
3.34
3.28
2.61
78.0
3.48
2.93
3.28
2.63
74.5
117
111
114
94
96
104
140
120
127
125
125
117
81
OK
Click
. You will then see a report screen
showing the respiration curves and parameter readings
from both tests (Figure 4.4-15).
At the top of the screen you will see the most important
results from both tests.
Click on
pages.
and
to display the other report
Figure 4.4-15. Comparing Two Spirograms
170
CardioSys V 4.1
227 498 02-A
The Spirometry Test / Setting up the Spirometry System
Setup
4.4.7 Spirometry System Setup
Setup
Equation for Normal Value Calculation:
ECCS
Austrian
Local Settings
Before running the first spirometry test, you will have to select
several system settings from the setup menu. These settings
are saved and loaded automatically on power up.
X Automatic printout after test
Enter Ambient Conditions for Spirometry Tests:
Atmospheric Press. (800 – 1090 hPa):
1013
Rel. Humidity (10 – 90 %):
70
Resp. Air Temp. VC Test (30 – 37°C):
31
Resp. Air Temp. FVC Test (30 – 37°C):
34
Click
4.4-16).
Spirometry Sensor Interface:
Setup
to display the defaults screen (Figure
COM3
OK
Cancel
First you choose the equation to be used for calculation of the
normal values for patients between 18 and 80 years of age:
either ECCS (European Community Carbon & Steel) or the
Austrian equation (for patients between 7 and 70 years of
age). If the patients are older they are assumed to have the
maximum age.
Help
Figure 4.4-16. The setup screen
☞
Check the ambient conditions. The program needs
these values for the BTPS correction (Body Temperature Pressure Saturated, i.e., the values are
referred to an ambient pressure and saturation
with water vapor at a body temperature of
37 °C). For BTPS correction, click the arrow
button to the right of the respective value (arrow
up selects a higher value, arrow down selects a
lower value). The respiration flow sensor measures the ambient temperature, so you don’t have
to enter this value manually.
227 498 02-A
Having selected the ECCS equation, the normal values for
patients between 7 and 17 years of age will be calculated
according to QUANJER and TAMMELING. There are no normal
values for patients < 7 years. Patients between 18 and 25 years
of age are evaluated like patients of 25.
Select an equation by clicking the button.
Eventually check that the correct interface has been
selected. To change the interface, click the arrow button
, then select the appropriate interface name.
Click
CardioSys V 4.1
OK
to terminate the configuration session.
171
The Spirometry Test / Printing a Spirogram
4.4.8 Printing a Spirogram
Print Spirogram
Procedure Date:
08.07.1994 – 10:32:38
Printer:
Modify …
Windows Printing System (LPT1:)
Click
to display the print setup screen
(Figure 4.4-17).
X Interpretation
X Patient ID as Bar Code
Number of Copies: 1
Check that the correct procedure is selected.
Print
Figure 4.4-17. Print setup screen
Cancel
Help
Check the “Interpretation” box, if it is to be included in
the printed report.
To select another printer, click Modify… in the printer
window and select the new one with the mouse.
Click
Cancel
172
CardioSys V 4.1
to initiate the printout, or click
to quit the print screen.
Print
227 498 02-A
The Spirometry Test / Brief Operating Instructions
4.4.9 Running a Spirometry Test (Brief Operating Instructions)
Turn on system
Bronchodilation Test
Display spirometry screen
Display bronchodilation test screen
…
Admit new patient or select patient from list
Perform VC and FVC measurements as described
above
Enter test information
End
End measurement
Attach nose clip
Administer medication and display
bronchodilation test screen again
…
Initiate VC measurement and ask patient to
breathe in, out and in again as deeply as possible
through the mouthpiece
FVC Measure
Repeat measurement or end this part of the test
with FVC Measure
Repeat VC and FVC measurements
End
End test
Initiate FVC measurement and ask patient to
breathe in deeply through the mouthpiece. Then
the patient is to breathe out and in again as deeply
and quickly as possible
End
Repeat measurement or end the test with
End
Display report
227 498 02-A
CardioSys V 4.1
173
The Spirometry Test
For your notes
174
CardioSys V 4.1
227 498 02-A
Ambulatory Blood-Pressure Measurement
4.5 Ambulatory Blood-Pressure
Measurement
In this section you will learn how to perform ambulatory
blood-pressure measurements, i.e.
–
how to set up the recording unit
–
how to configure the recording protocols
–
how to download data from the recording unit to the
PC and which report documents you may view
–
how to print out the examination report
The brief operating instructions at the end of this section
sum up what you have to do to perform ambulatory bloodpressure measurements.
227 498 02-A
CardioSys V 4.1
175
Ambulatory Blood-Pressure Measurement
2
1
2
3
AU
S
9
4
E
ST IN
STO ART
P
TES
TON
ma
T
H
-1
ett
eH
3
4
E
ST IN
STO ART
P
AU
rqu
S
D/m /mm
m Hg
OPOF min Hg
RT
IV
4.5.1 General Information
1
S
TES
TON
EL
ma
T
H
rqu
S
D/m /mm
H
ett
OPOF minmHg g
RT
IV
LIG
E
15
90.0 .40
9
-1
eH
EL
LIG
E
15
90.0 .40
9
5
6
The recording unit employed for ambulatory blood-pressure
measurement is the TONOPORT IV/IVa unit. While the
TONOPORT IV units only use the oscillometric measuring
method, TONOPORT IVa units also offer the auscultatory
method. Moreover, TONOPORT IVa units store the heart
rate and ECG strips.
6
8
7
8
7
Figure 4.5-1. Displays, controls and connectors of the recording
units (left: TONOPORT IV,
right: TONOPORT IVa)
1 ON button to turn on the recording unit. After the self test,
this button is used to start and stop a measurement
2 OFF button to turn off the recording unit
3 TEST button to recall the most recently measured values. The
values will be displayed in the following order:
– systolic
– diastolic
– mean pressure
– pulse rate
This button is also used to program the recording unit, when
it is set up without a PC
4 Liquid-crystal display
5 Patient cable connection (microphone, ECG)
6 Cuff connection
7 Battery compartment cover
8 Port for connection of PC, printer or power supply unit
9 Microphone sensitivity switch (TONOPORT IVa)
176
For information on how to set up and operate the recording
unit, please refer to the TONOPORT IV/VIa operator’s
manual.
☞
Disconnect TONOPORT from the patient when it
is connected to the PC!
☞
When you see the message “Inconsistent data in
patient monitor! Procedure cannot be saved!”,
turn off the patient monitor before downloading
data.
Caution
CardioSys V 4.1
Switch off the patient monitor before connecting it to the PC. Furthermore, it is recommended to delete old data before starting a new
ambulatory blood-pressure measurement.
227 498 02-A
Ambulatory Blood-Pressure Measurement
Patient
ProcedureHellige
Selection Menu
Untersuchung
Hilfsfunktionen
4.5.2 Setting Up the Recording Unit
Hilfe
ECG
External Programs
(Unbenannt)
Rest ECG
STAT ECG
Exercise Test
The Signal Acquisition Screen
Right-Heart
Catheterization
Holter ECG
Connect PC and recording unit with the cable provided, and
turn on the recording unit. Before using the recording unit
for the first time, you should specify the PC interface to
which it is connected. This can be done via the signal acquisition screen.
Monitoring
External Programs
120/80
HELLIGE CARDIOSOFT
Ambulatory Blood
Pressure
T1.0a
Late Potentials
Setup
Spirometry
…
Bronchodilation
Spirometry
The signal acquisition screen is displayed with the
key.
This key, in turn, is found on the procedure selection menu,
unless you have configured the icon bar to include this icon
(section 6 “System Configuration”).
120/80
Cancel
Help
Figure 4.5-2. Procedure selection menu
120/80
Hellige
Patient
Procedure
System Services
Baker, David, 41 yrs
Help
Click on
to display the procedure selection menu
(Figure 4.5-2).
Ambulatory Blood Pressure Recording
Setup
Programming
Download data
Date/Time
Clear
Click on
to display the signal acquisition screen for
ambulatory blood-pressure measurements.
120/80
Patient Monitor Status
Date:
07.12.1995
Time: 14:11:59
Data stored in patient monitor
1
2
Period
from
to
BP Interval
(min) Defl. Rate Infl. Press
Qty
1
07:00:00
21:59:00
exact
30
4
200
30
2
22:00:00
06:59:00
exact
30
4
200
18
3
Duration
Number of BP Measurements
Number of ECG Strips
ECG Strip Length
Ratio of ECG strips to BP measurements
4
5
On the signal acquisition screen you will see
24:00 h
48
24
3s
1:2
Figure 4.5-3. Ambulatory blood-pressure measurement, signal
acquisition screen
1 Control buttons
2 Message indicating the memory status
3 Date and time of downloading from the recording unit
4 Memory status details
5 Summary of the stored data
227 498 02-A
Once the you have selected the patient, the signal acquisition
screen (Figure 4.5-3) will be displayed.
–
the control buttons (1)
–
information on whether or not the recording unit contains data (2)
–
a separate field for details of the memory status (3)
–
a summary of the memory status (4)
The memory status field indicates the configuration of the
recording unit.
CardioSys V 4.1
177
Ambulatory Blood-Pressure Measurement
Setup
Specifying the Interface
Hellige
Patient
Procedure
System Services
Baker, David, 41 yrs
Setup
Interface
1
2
Click on
Ambulatory Blood Pressure Recording
Programming
Patient
Monitor
Setup
Hellige
Download
data
Date/Time
Data stored in patient monitor
Modify
Program0
Time: 14:11:59
from
to
BP Interval
(min)
Stat. Night Time
22:00:00
until
07:00:00
21:59:00
exact
30
Wake-up Time
04:00:00
until
22:00:00
06:59:00
exact
30
BP Limits (sys/dia)
135
OK
Cancel
Duration
Number of BP Measurements
Number of ECG Strips
ECG Strip Length
Ratio of ECG strips to BP measurements
.
Setup
Clear
COM 2
Patient Monitor Status
Protocol
Date:
07.12.1995
Period
Help
Defl. Rate Infl. Press
06:00:00
4
200
06:00:00
4
200
85
Qty
Figure 4.5-4 will appear.
Click on
to open the interface list box.
30
18
Select the interface.
Help
Click on
24:00 h
48
24
3s
1:2
OK
or
Cancel
to clear the window.
Setting Up the Recording Unit
Figure 4.5-4. Window for entry of the interface and for protocol
selection
Before setting up the recording unit, click on Clear
delete all data stored in the memory (Figure 4.5-3).
to
You can choose between two protocols to set up the recording
unit. The protocol is selected with a mouse click. Both
protocols can be edited to suit your patient’s symptoms.
☞ The recording unit can be programmed only when
it contains no data.
Click on
Setup
.
Figure 4.5-4 will appear.
Open the protocol selection window by clicking on
.
Select one of the protocols.
Enter the blood-pressure limits (
to increase the
value,
to decrease the value). After evaluation of the
procedure data, the percentage of measurements which
exceeded these limits is shown on the statistics summary
page.
178
CardioSys V 4.1
227 498 02-A
Ambulatory Blood-Pressure Measurement
Hellige
Patient
Procedure
System Services
Help
Setup
Baker, David, 41 yrs
Ambulatory
Langzeit-Blutdruck-Aufnahme
Blood Pressure Recording
No. of BP Periods
Defaults
0
Setup
to
Period from
1
1
2
3
4
Download data
BP Interval
Patient Monitor Status
1
07:00:00
exact
Date:
07.12.1995 21:59:00
Time: 14:11:59
06:59:00
2
22:00:00
Period
from
to
1
8
3
07:00:00
21:59:00
2
ECG Strip Length 22:00:00
(0 to 10 s; 0 =06:59:00
none)
Protocol
Date/Time
(min)
2
Program0
Clear
Defl. Rate Infl. Press
30
4
200
30
exact
30
4
200
BP Interval
(min) Defl. Rate Infl. Press
4
exact
exact
3
30
4
30
4
5
6
7
200
200
18
QTY
30
OK
Click on
OK
or
Cancel
to clear the window.
18
Click on
Cancel
1:2
Ratio of ECG strips to BP measurements
Qty
Data stored in patient monitor
In order to view the setup of the recording unit for a specific
protocol, click on Modify… . You will then see the setup window (Figure 4.5-5) showing all the relevant data (see
OK
“Configuring Protocols” below). Click on
to clear
the window.
to verify the date and the time.
Date/Time
Help
Duration
Number of BP Measurements
Number of ECG Strips
ECG Strip Length
Ratio of ECG strips to BP measurements
9
24:00 h
48
24
3s
1:2
To correct the displayed values, highlight the numbers
and enter the correct value.
10
Figure 4.5-5. Protocol configuration menu
1 Number of BP periods
2 Protocol name
3 Beginning and end of period 1
4 BP interval, period 1
5 Deflation rate, period 1
6 Cuff inflation pressure for initial measurement, period 1
7 Number of measurements taken during period 1
8 Details of period 2
9 ECG strip length (for TONOPORT IVa only)
10 Ratio of BP measurements to ECG recordings
(for TONOPORT IVa only)
Click on
Programming
.
If the date and the time of the recording unit differ from
those of the PC, they can be corrected via the Date/Time
function.
This completes the setup of the recording unit.
Turn off the recording unit and disconnect it from the
PC.
Connect it to the patient (please refer to the
TONOPORT IV/IVa operator’s manual).
Turn on the recording unit and initiate the first measurement.
227 498 02-A
CardioSys V 4.1
179
Ambulatory Blood-Pressure Measurement
Configuring Protocols
The two protocols can be configured to suit the clinical
picture of the patient to be monitored. The recording unit
retains these modifications even when switched off.
Display the setup screen as described above (Figure
4.5-5).
First of all, select the number of blood-pressure periods
for the protocol.
The BP interval (exact, approx.) and the deflation rate
can be changed by clicking on the list box . Then you
can select the desired setting.
For TONOPORT IVa you can also specify the length of the
ECG strips (0 to 10 s) and whether an ECG strip is to be
recorded for every, every second or every third blood-pressure
measurement.
☞
The day can be subdivided into up to 4 different periods, and
different measuring intervals can be selected for each of these
periods. Furthermore, you can choose whether the measurements are to be taken at “exactly” or at “approximately” the
selected intervals. Selecting the approximate intervals is advisable for apprehensive patients who may be stressed knowing
when a measurement is being taken. The deflation rate and
the cuff inflation pressure are also adjusted in this menu.
The storage capacity for ECG strips is limited: the
longer the strips, the less strips can be stored (232
1-second strips or 23 10-second strips).
Select
OK
to clear the setup menu.
The deflation rate can be set to any value between 1 and 8
mmHg (between oscillations). The deflation rate is fixed for
auscultatory measurements.
The inflation pressure is the maximal pressure for cuff inflation.
If you wish to modify the intervals or pressures click on
to increase the value or on
to decrease the value.
180
CardioSys V 4.1
227 498 02-A
Ambulatory Blood-Pressure Measurement
120/80
4.5.3 Data Output
Hellige
Patient
Procedure
System Services
Baker, Dave, 41 yrs
Help
Ambulatory Blood Pressure Recording
Setup
Programming
Patient Monitor Status
Date:
07.12.1995
Download data
Date/Time
Downloading data to the PC
Clear
Data stored in patient monitor
Time: 14:11:59
Period
from
to
BP Interval
(min) Defl. Rate Infl. Press
QTY
1
07:00:00
21:59:00
exact
30
4
200
30
2
22:00:00
06:59:00
exact
30
4
200
18
The data stored in the recording unit must be downloaded to
the PC for evaluation.
Caution
Duration
Number of BP Measurements
Number of ECG Strips
ECG Strip Length
Ratio of ECG strips to BP measurements
24:00 h
48
24
3s
1:2
Figure 4.5-6. Signal acquisition screen, Download data button
Test Summary Hellige
Patient
Procedure
Baker, Dave, 41yrs
System Services
Connect the recording unit to the PC and turn it on.
Display the signal acquisition screen for ambulatory
blood-pressure measurements (Figure 4.5-6).
Help
Ambulatory Blood Pressure / Procedure Summary
Test Information
Statistics Intervals
Recording Periods
Date
07.12.1995 - 14:19:36
Total Recording Time
9:10h
Duration Day Time
9:10h
Duration Night Time
0:00h
Measuring Method
auscultatory
Patient Data
Age
41 years
Sex
Male
Race
Caucasian
Height
188 cm
Weight
77.0 kg
Test Information
Medication
Comment
Physician
User
1
2
Click on
Reason for Test
3
4
Dr. Williams
Dorothy
Interpretation
24h Average sys/dia (mmHg)
101.5/75.1
syst. BP readings above 135 mmHg (%)
2.1
diast. BP readings above 85 mmHg (%)
0.0
Day-Time Average sys/dia (mmHg)
101.5/75.1
5
Download data
(Figure 4.5-6).
An icon indicates how the transfer proceeds. At the end you
will be asked whether you wish to clear the data from the
patient monitor. It is recommended always to delete old data
so that the memory is free for collection of the new data.
Then you will see the Test Summary (Figure 4.5-7).
☞
Figure 4.5-7. Test Summary
1 Button for data export
2
3
4
5
Switch off the patient monitor before connecting it to the PC. Furthermore, it is recommended to delete old data before starting a new
ambulatory blood-pressure measurement.
When you see the message “Inconsistent data in
patient monitor! Procedure cannot be saved!”,
turn off the patient monitor before downloading
data.
Button for entry of the test information
Button for entry of the statistics intervals
Buttons to display the other report documents (paging)
Button to directly access the other report documents
227 498 02-A
CardioSys V 4.1
181
Ambulatory Blood-Pressure Measurement
Test Information
Test Information
Library: Reason for Test
ABE
Reason for Test
F
Respiratory problems
Shortness of breath
Pain
Follow-up
A
B
A
»
C
On the test summary page you find the test information,
reasons for test, medications and patient data as well as the
statistics intervals (night time, wake-up time, Statistics Intervals
button).
Select
Test Information
.
The test information entry screen will be displayed
(Figure 4.5-8).
Medication
…
OK
Comment
Physician:
Dr. Williams
Technician:
Dorothy
Enter the procedure data as described in section 4.1.3.
Cancel
Help
Data Export
Figure 4.5-8. Test information
The
icon allows you to export the most important data
pertaining to the spirometry test to the clipboard or to any
file. Data exported to the clipboard, for instance, can be
inserted in a text file with the “Edit” —> “Paste” command.
Click
.
Select either “Export data to clipboard” or “Export data
to file”.
Click on
OK
.
Data from the clipboard can be inserted in a text file.
For data exported to a file you will have to specify the target
OK
directory and confirm it with
.
All other report documents can be accessed directly via the
table of contents, or you can page through the report.
182
CardioSys V 4.1
227 498 02-A
Ambulatory Blood-Pressure Measurement
Click on
(forward) or
through the report.
Go to …
Test Summary
(backward) to page
Graphics
Click on
to display the table of contents of the
procedure report and select the document you wish to
see (Figure 4.5-9).
Hourly Averages
Statistics Summary
Day Time
Night Time
Wake-up Time
Interpretation
Cancel
Figure 4.5-9. Table of contents of the ambulatory blood-pressure
report
227 498 02-A
CardioSys V 4.1
183
Ambulatory Blood-Pressure Measurement
BP Graph
Hellige
Patient
Procedure
Baker, Dave, 41 yrs
System Services
Help
The blood-pressure graph (Figure 4.5-10) shows all bloodpressure values measured during the monitoring period.
Ambulatory Blood Pressure / Graphics
Tabular
sys. BP: 88
dia. BP: Error 21
HR: 106
Date: 30.08.1995
For measurements taken with TONOPORT IVa, the ECG
strips are displayed as well.
Time 07:54:48
300
HR
BP 250
200
150
100
50
0
06:00 08:00 10:00 12:00 14:00 16:00 18:00 20:00
22:00 00:00 02:00 04:00 06:00 08:00 10:00
Figure 4.5-10. Graphic representation of the BP values
By clicking on
you can display the other
ECG strips one by one, or you can cross-reference to an
ECG strip by clicking on the corresponding BP measurement on the graph.
Tabular
The
ure 4.5-11).
button takes you to the BP table (Fig-
Tabular
Hellige
Patient
Procedure
Baker, David, 41 yrs
System Services
Help
Ambulatory Blood Pressure / Tabular
Return
Time
HR
sys. BP
dia. BP
Measuring Interval 1 from 07:51:13 bis 12:50:13 auscultatory
07:51:48
106
88
Error 21
07:53:48
75
98
80
08:07:48
74
89
76
08:23:48
75
82
Error 15
08:37:48
78
109
79
08:52:48
73
97
77
09:07:48
73
116
79
09:22:48
71
89
79
09:37:48
72
92
68
09:52:48
83
96
70
10:07:48
76
99
73
10:16:48
87
101
70
10:22:48
80
124
81
10:39:48
76
88
Error 15
10:55:48
79
94
72
11:07:48
76
105
74
11:23:48
80
89
77
11:38:48
69
92
79
11:53:48
74
106
79
12:07:48
69
105
75
12:22:48
84
123
74
mn. BP
86
80
89
83
91
82
76
78
81
80
95
79
84
81
83
88
85
90
Figure 4.5-11. Tabular representation of the BP values
184
CardioSys V 4.1
227 498 02-A
Ambulatory Blood-Pressure Measurement
Hourly Averages
Patient
Baker, Dave, 41 yrs
Graphic Representation of the Hourly Averages
Hellige
Procedure
System Services
Help
Ambulatory Blood Pressure / Hourly Averages
Figure 4.5-12 shows the hourly averages of all measurements
taken during the monitoring period.
Tabular
300
Tabular
Click on
to display the same values in
tabular form (Figure 4.5-13).
250
HR
BP
200
150
100
50
0
06:00 08:00 10:00 12:00
14:00
16:00 18:00 20:00
22:00 00:00 02:00 04:00 06:00 08:00 10:00
Figure 4.5-12. Hourly averages of blood pressure and heart rate
Tabular
Hellige
Patient
Procedure
Baker, Dave, 41 yrs
System Services
Help
Ambulatory Blood Pressure / Hourly Averages
Return
Time Period
HR
sys. BP
07:00
08:00
09:00
10:00
11:00
12:00
13:00
14:00
15:00
08:00
09:00
10:00
11:00
12:00
13:00
14:00
15:00
16:00
80.1
74.6
75.0
78.3
75.6
80.8
75.3
68.9
68.3
93.080.0
94.277.3
98.274.0
101.274.0
98.077.2
111.571.5
100.873.1
107.877.8
115.072.6
86.0
84.0
81.7
83.7
84.0
84.5
81.8
88.4
86.3
2
4
4
5
4
4
6
6
3
08:00 – 09:00
09:00 – 10:00
73.3
72.5
91.876.0
105.778.5
84.0
95.0
5
4
–
–
–
–
–
–
–
–
–
dia. BP
mn BP
Qty
Figure 4.5-13. Hourly averages of blood pressure and heart rate
227 498 02-A
CardioSys V 4.1
185
Ambulatory Blood-Pressure Measurement
Statistics Summary
Statistics Summary
Hellige
Patient
Procedure
Baker, Dave, 41 yrs
System Services
Help
The statistics summary (Figure 4.5-14) shows one histogram
each for the systolic values (left) and the diastolic values
(right) as well as the frequency distribution given in percent.
Ambulatory Blood Pressure / Statistics Summary
Statistics Summary from 7:51 bis 9:46 (2 day)
47 Blood Pressure Measurement(s)
Systolic Blood Pressure
Diastolic Blood Pressure
80%
80
60%
65
The table below indicates the maximal, minimal and mean
values.
40%
20%
8
<
110 120 130 140 150 160 170 180 190 200
sys. BP
dia. BP
mn BP
Heart Rate
Minimum
8:29 2. day
76
57 15:16 1. day
69 15:16 1. day
62
>
0%
mmHG <
Maximum
9:18 2. day
149
85 14:56 1. day
9:18 2. day
105
112
21
10
60
70
80
90 100 110 120 130 140 150
Average
101.5
75.1
84.8
74.7
SD
14.8
5.4
6.7
6.1
21% of systolic blood-pressure readings exceeded 135 mmHg
0.0% of diastolic blood-pressure readings exceeded 85 mmHg
>
The percentage of readings which exceeded the set limits is
shown at the bottom.
Figure 4.5-14. Statistics summary
Similar report pages exist for the day time, the night time and
the wake-up time.
Interpretation
Interpretation
Hellige
Patient
Procedure
System Services
Baker, Dave, 41 yrs
ABE
Help
Ambulatory Blood Pressure / Interpretation
A
F
Measurements Summary
Statement Library
24h Average sys/dia (mmHg)
101.5/75.1
syst. BP readings above 135 mmHg (%)
2.1
diast. BP readings above 85 mmHg (%)
0.0
Day-Time sys/dia(mmHg)
101.5/75.1
B
A
Interpretation
C
To write the test interpretation, you can choose from the
system-generated measurements or from the Statement
Library which, in turn, may be edited as needed.
From both “libraries” the appropriate texts can be copied into
the evaluation window at right by clicking.
»
Select “Measurements Summary” or “Statement
Library”.
Figure 4.5-15. Interpretation
Highlight the line to be copied by clicking on it, then
click on
.
☞
186
CardioSys V 4.1
An alternative method is to copy lines by doubleclicking.
227 498 02-A
Ambulatory Blood-Pressure Measurement
Confirming Tests
A test is considered confirmed, when a physician has reviewed
the test evaluation and “signed” it electronically with his/her
name. Tests that have been reviewed and confirmed by a
physician are marked with x.
Click on
(Figure 4.5-15) to display the window
where you can enter your name.
Select the physician’s name from the list box (click on
) or enter it via the keyboard.
227 498 02-A
CardioSys V 4.1
187
Ambulatory Blood-Pressure Measurement
Hellige
Patient
Untersuchung
Pages to Print
Sütterlin, Franz, 48 J
Hilfsfunktionen
Print
Hilfe
Procedure Date: 07.12.1995 · 14:22:10
1
Baker, Dave
Langzeit-Blutdruck / Gesamtstatistik
Standard Page
Tabular
00.00.0000 · 00:00:00
Hourly Averages
2
1
Gesamtstatistik )7:51 9:46O
0
Statistics Summary
0
Phases
Day Time
Night Time
Wake-up Time
0
0
110 120 130 140 150 160 170 180 190 200
ECGBD
Grid
sys.
dia. BD
mit. BD
76 8:29 2.
none
57 15:16 1.
69 15:16 1.
62
Number of Copies
1
3
80%
60%
4.5.4 Documenting the Ambulatory
Blood-Pressure Measurement
Procedure
You can determine the scope of the printed report by selecting
or deselecting the individual documents. This is done on a
special screen (Figure 4.5-16).
1
ECG Strips
40%
20%
0%
mmHG
60
70 80
4
0
Print
90 100 110 120 130 140 150
Barcode / Patient
ID [22chrs]
149 9:18 2.
101.5
85 14:56EPSON
1. EPL-5600 [LPT1:]
75.1
105 9:18 2.
84.8
112
74.7
Modify…
2.1% 135 mmHg
0.0% 85 mmHg
14.8
5.4
6.7
6.1
Cancel
Click on
to display the setup screen.
Save
Help
Figure 4.5-16. Printer setup screen for documentation of the
ambulatory blood-pressure measurement procedure
1 Number of pages
2 Recording date
3 Document included in the printout
4 Selected printer
If you want to include a document in the report, click on the
check box next to the respective title, so that a check mark is
displayed. Click again, to deselect a document. At the same
time the little text box at the top indicates the number of
pages to be printed (1, Figure 4.5-16). The printout is initiPrint
ated with the
button.
Save
will save the printer setup.
Standard Page
Recording periods, medication, reason for test, comments, BP
graph
Phases
Same as “Statistics Summary”, but subdivided into day time,
night time and wake-up time
Tabular
BP table
ECG Strips
All ECG strips consecutively.
Hourly Averages
Printout of the hourly averages in the form of tables and graphs
To select another printer, click on Modify… . The printer setup
window will open and you can click on another printer.
Statistics Summary
Printout of the procedure statistics in the form of histograms,
minimum, maximum and average values
188
CardioSys V 4.1
227 498 02-A
Ambulatory Blood-Pressure Measurement
4.5.5 Ambulatory Blood-Pressure
Measurement
(Brief Operating Instructions)
Start program
120/80
Activate ambulatory blood-pressure measurement
mode
Admit new patient or select patient from database
Connect recording unit to PC
Setup
Programming
Display the setup menu and select a measurement
protocol
Program the recording unit
Connect recording unit to patient and initiate
measurement
Download data
Test Information
Connect recording unit to PC and download data
Enter the test information
Review the report documents
227 498 02-A
CardioSys V 4.1
189
Ambulatory Blood-Pressure Measurement
For your notes
190
CardioSys V 4.1
227 498 02-A
Late Potentials
4.6 Late Potentials
In this section you will learn
–
some general facts about late potentials
–
how to apply the electrodes and acquire the signals for
late potential analysis
–
how to enter procedure data (reason for test, medication, blood pressure)
–
which report documents can be displayed
–
how to print out the examination report
The brief operating instructions at the end of this section
sum up what you have to do to record late potentials.
227 498 02-A
CardioSys V 4.1
191
Late Potentials
4.6.1 General Information
4.6.2 Electrode Application
Having an amplitude in the microvolt range, late potentials
occur in the terminal QRS complex and in the early ST
segment. Proof of the existence of late potentials is obtained
by signal averaging. For this method, the correlating QRS
complexes are summed up. Since signal noise is the noncorrelating portion, this method assures the required high
sensitivity. A correlation coefficient can be set to any value
between 1 and 99 (default: 95), thus determining the accuracy
of the measurement: The higher the coefficient, the more
accurate is the measurement. Furthermore, an upper noise
limit for the averaged signal is preset. When the noise drops
below this limit, averaging stops and the measurement begins.
The analysis method used is the SIMSON method. A
SIMSON algorithm is also used for determination of the
QRS offset.
Due to the small size of late-potential signals, a very careful
electrode technique is required. In most cases a resting ECG
will be recorded before the ECG is analyzed for late
potentials. Therefore the electrodes for the 12 standard leads
are applied. Late potential analysis is performed on the uncorrected leads X, Y and Z. To obtain these leads, chest electrodes C1, C3 and C5 must be moved to other sites (see
below) and all 6 electrodes must be carefully applied:
The ECG leads are the uncorrected, orthogonal leads X, Y
and Z, they are acquired via chest electrodes attached at the
corresponding pick-up points.
After the analysis, the vector diagram is displayed, showing
the measured values and the average beats. Also included is
the procedure summary comprising the patient data, measured values, interpretation and medication.
The overall gain of the vector representation is 20 µV/cm,
which is equivalent to a 50-fold gain of the standard sensitivity of 10 mm/mV. Alternative settings selectable on the vector
screen are 5, 10, 20 and 40 µV.
192
–
clean and degrease the skin at the application sites, using
benzine
–
massage the application sites with EPICONT cream
until the perfusion increases (reddening of the skin)
–
use only silver-silver chloride electrodes
–
after electrode application, wait for about 5 minutes
before acquiring the ECG signal.
Apply the electrodes as follows:
C1 on the back, opposite C2 (signal across C1 and C2 = Z)
C3 parasternal site, below the clavicula (signal across C3 and
C4 = Y)
C5 at the right, opposite C6 (signal across C5 and C6 = X)
CardioSys V 4.1
227 498 02-A
Late Potentials
Patient
4.6.3 The Late Potential Signal
Acquisition Screen
ProcedureHellige
Selection Menu
Untersuchung
Hilfsfunktionen
Hilfe
ECG
External Programs
(Unbenannt)
Rest ECG
STAT ECG
Exercise Test
Right-Heart
Catheterization
Holter ECG
The signal acquisition screen for late potential analysis is
displayed with the
button which is located on the procedure selection screen, unless you have reconfigured the standard icon bar (section 6 “System Services Menu”).
Monitoring
External Programs
120/80
HELLIGE CARDIOSOFT
Ambulatory Blood
Pressure
Late Potentials
T1.0a
Setup
Spirometry
Entering the Test Information
…
Bronchodilation
Spirometry
Cancel
Click on
to display the procedure selection menu
(Figure 4.6-1).
Help
Figure 4.6-1. Procedure selection menu
Click on
to display the signal acquisition screen for
late potential analysis.
When you have selected a patient, the test information dialog
window opens (Figure 4.6-2).
Enter the test information as described in section 4.1.3.
Test Information
Test Demographics
Library: Reason for Test
CAD
Myocardial Infarction
Syncope
documented VT
documented VF
–
–
–
–
–
ABE
2
F
»
1
4
A
Reason for Test
B
A
3
5
5
6
Blood Press. [mmHg]
dia
sys
Medication
…
OK
Comment
Physician:
Dr. Williams
Technician:
Dorothy
227 498 02-A
7
Cancel
Help
C
Figure 4.6-2. Test information entry screen
1 Reason for Test library
2 Allows you to edit the Reason for Test library
3 Patient indications
4 Blood pressure readings
5 Medication selection
6 Allows you to select another medication and to
assign drug names to medication groups
7 Boxes for entry of comments and of the physician’s and technician’s names
CardioSys V 4.1
193
Late Potentials
The Signal Acquisition Screen
Hellige
Patient
Procedure
Baker, Dave, 41 yrs
System Services
Late Potentials / Signal Acquisition
Test Information
Setup
Help
Reset QRS
Freeze Traces
Options
2
10mm/mV
1
Corr. Beats
100 % QRS
Noise (<1.0 µV)
1.7 µV %Corr. Beats (200)
43
»
HR
60
25mm/s
3
Once you close the test information window, the system will
display the signal acquisition screen (Figure 4.6-3).
SYS/DIA (mm/Hg)
The signal acquisition screen shows:
3
4
X
5
1
2
4
6
R
L
N
F
–
information on the ongoing analysis (2):
number of correlating beats in %
the noise limit as configured
the number of correlating QRS complexes
a bar graph illustrating the acquired correlating beats as a
percentage of the required beats as configured
–
the current heart rate and blood pressure readings (3) (if
entered manually, section 4.1.3)
–
the applied electrodes and the signal quality (4) (provided the red R electrode is applied). Furthermore an
arrow (6) points to the leads which are impaired by
improper electrode application or which cannot be
recorded due to disconnected electrodes (or due to a
break in the patient cable)
–
the selected lead sequence (5)
Y
6
Z
5
Lead Sequence
XYZ - uncorrected
HFLA Treshold [µV]
40
Figure 4.6-3. Signal acquisition screen for late potential analysis
1 Control buttons
2 Details on late potential analysis
3 Current heart rate and blood-pressure readings
4 Applied electrodes
green: properly applied
yellow: not properly applied
white: site not used
red: disconnected (lead break)
5 Lead sequence
6 Lead impaired by poor signal quality
The functions of the control buttons are explained on the
following pages.
194
CardioSys V 4.1
227 498 02-A
Late Potentials
I
Patient
Procedure
Baker, Dave, 41 yrs
Help
Click on
Late Potentials / Signal Acquisition
Test Information
Setup
Performing a Late Potential Analysis
Hellige
System Services
Reset QRS
Freeze Traces
Options
10mm/mV
»
60
25mm/s
SYS/DIA (mm/Hg)
Corr. Beats
100 % QRS
Noise (<1.0µV)
1.7 µV %Corr. Beats (200)
to initiate the analysis.
The signal acquisition screen shows
43
3
5
X
1
2
4
R
L
N
F
Lead Sequence
XYZ - uncorrected
Z
–
the percentage of correlating beats
–
the selected noise limit in µV
–
the number of correlating beats
–
a bar graph representing the acquired, correlating beats
as a percentage of the necessary beats
6
Y
HFLA Treshold [µV]
40
Figure 4.6-4. Late potential signal acquisition screen
You can display the test information screen with
Test Information
☞
I
HR
After every fifth correlating QRS complex the
program checks whether the signal noise lies below
the limit. If so, signal averaging is terminated,
even when the set number of QRS complexes has
not yet been reached.
.
You can stop the 2nd and 3rd ECG trace with
Freeze Traces
.
You can enable and disable the 2nd row of control buttons
with Options >> .
You can display the setup menu (section 4.6.5) with
.
Setup
You can reject the correlating QRS complexes summed up so
far and start over with Reset QRS .
You can change the signal size with the
(2.5 – 5 – 10 – 20 – 40 mm/mV).
You can change the sweep speed with the
(25 – 50 mm/s)
227 498 02-A
CardioSys V 4.1
buttons
buttons
195
Late Potentials
The ECG signal acquisition stops automatically either when
the signal noise drops below the preset noise limit or when the
specified number of correlating complexes has been reached.
Hellige
Patient
Procedure
Baker, Dave, 41 yrs
System Services
Help
Late Potentials / Vector / Medians
500 µV/cm
400 mm/s
1
2
XYZ uncorrected
43
1.6 1.6
7
7
128 128
52 52
Number of QRS
Noise [µV]
RMS40 [µV]
QRS Duration [ms]
HFLA Duration [ms]
100 mm/s 20 mm/mV
X
3
5
Y
4
The first report screen displayed is the vector diagram (Figure
4.6-5).
Other documents of the procedure report are the interpretation (Figure 4.6-7) and the test summary (Figure 4.6-8).
40 µV
Z
6
40 ms
Vector Diagram
7
Figure 4.6-5. Vector diagram
1 Buttons to adjust the gain
2 Buttons to adjust the sweep speed
3 Buttons to display other report documents
4 Parameter table
5 Medians (non-amplified)
6 QRS onset
7 QRS offset
☞
This noise value (4) may differ from the one
shown on the signal acquisition screen, as it is
calculated over all acquired beats.
Figure 4.6-5 shows the vector diagram with the marks identifying onset (6) and offset (7) of the QRS complex set by the
program as well as the resulting measured values (4). The
HFLA threshold is a dashed line and the HFLA duration is
displayed with a different color.
The signal size can be changed with the
buttons.
The sweep speed can be changed with the
buttons.
Furthermore, you can correct the position of QRS onset
and offset as follows:
Position the cursor on the upper portion of the caliper
and press the left mouse button, when the cursor turns
into a double-headed arrow pointer.
Holding the mouse button depressed, drag the caliper to
its new position and release the button.
The corrected values corresponding to the new caliper position appear in the right column (4) of the table.
196
CardioSys V 4.1
227 498 02-A
Late Potentials
RMS
Hellige
Patient
Procedure System Services Help
Baker, Dave, 41 yrs
RMS (40 ms): mean voltage in µV within the most recent
40 ms of the QRS complex.
Late Potentials / Vector / Medians
500 µV/cm
400 mm/s
Go to …
Test Summary
XYZ uncorrected
43
Vector / Medians Number of QRS
1.6 1.6
Noise [µV]
7
7
Interpretation RMS40 [µV]
QRS Duration [ms] 128 128
HFLA Duration [ms] 52 52
Cancel
100 mm/s 20 mm/mV
X
Displaying Other Report Pages
You can display the other report pages either by paging
through the report or by accessing them directly.
Y
40 µV
Z
Click on
or
through the report.
40 ms
Figure 4.6-6. Table of contents of the late potential analysis
report
227 498 02-A
to page forward or backward
Click on
to display the table of contents and select
a document (Figure 4.6-6).
CardioSys V 4.1
197
Late Potentials
Test Summary
Test Summary
Hellige
Patient
Procedure System Services Help
Baker, Dave, 41 yrs
ABE
Late Potentials / Test Summary
The test summary (Figure 4.6-7) contains the following
information:
F
Reason for Test
Age
Gender
Race
Height
Weight
Blood Pressure
HR
Interpretation
41 yrs
male
Caucasian
178 cm
75.0 kg
130/80mmHg
60 BPM
Number of QRS
100
Noise [µV]
1.6
RMS40 [µV]
7
QRS Duration [ms] 128
HFLA Duration [ms] 52
Medication
Comment
Physician
Technician
Dr. Williams
Dorothy
Figure 4.6-7. Test summary
Reason for Test: from the test information screen
Interpretation: excerpt of the interpretation
Medication: from the test information screen
Patient data
Measured values
If you wish to add or edit test demographics, click on the
icon to display the corresponding dialog window.
ABE
F
Data Export
The
icon allows you to export the most important data
pertaining to the spirometry test to the clipboard or to any
file. Data exported to the clipboard, for instance, can be
inserted in a text file with the “Edit” —> “Paste” command.
Click
.
Select either “Export data to clipboard” or “Export data
to file”.
Click on
OK
.
Data from the clipboard can be inserted in a text file.
For data exported to a file you will have to specify the target
OK
directory and confirm it with
.
198
CardioSys V 4.1
227 498 02-A
Late Potentials
Interpretation
Interpretation
Hellige
Patient
Procedure
System Services
Baker, Dave, 41 yrs
ABE
Help
Late Potentials / Interpretation
A
F
Measurement Results
Statement Library
Number of QRS
Noise [µV]
RMS40 [µV]
QRS Duration [ms]
HFLA Duration [ms]
1
B
A
C
Interpretation
43
1.6
7
128
52
»
Figure 4.6-8. The interpretation screen
The interpretation screen is split into two windows. The one
on the left shows the interpretation as derived by the system.
Here you can choose between the program’s measurement
results and the statement library (see below). The window on
the right is reserved for the physician’s interpretation. Only
when the procedure is assigned to a patient can the physician’s
interpretation be entered.
When writing the physician’s interpretation you can copy the
measurement results or statements from the library to the
right window. Then you may edit these statements again,
using the A icon to cut text and the B A C icon to reinsert
the text in any other place. You may also add any comments.
Furthermore, you can record a spoken comment, using the
icon, provided that a sound card has been implemented
in your system and that you have a microphone. This comment will be saved to the corresponding patient file. It can be
played back by clicking on the
icon.
First of all, select the information to be displayed: the
Measurement Results or the Statement Library (1,
Figure 4.6-8).
If you wish to copy information to the right, highlight
the respective passages, then click on
.
To enter text directly into the window on the right,
move the cursor to the desired position, click the mouse
button and type the text.
227 498 02-A
CardioSys V 4.1
199
Late Potentials
Confirming Tests
A test is considered confirmed, when a physician has reviewed
the test evaluation and “signed” it electronically with his/her
name. Tests that have been reviewed and confirmed by a
physician are marked with x.
Click on
(Figure 4.6-8) to display the window
where you can enter your name.
Select the physician’s name from the list box (click on
) or enter it via the keyboard.
Editing the Statement Library
When you display the statement library (1, Figure 4.6-8), the
icon becomes active.
ABE
F
Click on ABE F to open the window for editing the
statement library.
Enter new texts or edit existing statements via the keyboard.
Click on
200
CardioSys V 4.1
OK
to clear the window.
227 498 02-A
Late Potentials
Hellige
Patient
Procedure
Pages to Print
Bauer, Erna, 30 yrs
System Services
Print
Dave Baker
1
Late Potentials / Procedure SummaryProcedure Date: 07.12.1996
07.12.1995· ·16:02:24
11:40:23
Speed
ABE
Help
Gain
F
Vector
Indication
2
1
400 mm/s
Speed
Medians
Gain
100 mm/s
Interpretation
3
20 mm/mV
Interpretation
Age
48 yrs
Sex
female
Race
Height
168 cm
Weight
56.0 kg
Blood Pressure
HR
60 BPM
Number of QRS
43
Print
Noise [µV]
1.6
RMS40 [µV]
7
Cancel
Barcode / Patient ID [22chrs] QRS Duration [ms] 128
HFLA Duration [ms] 52
EPSON EPL-5600 [LPT1:]
Save
4
ECG Grid
Number of Copies
Medication
Comment
Physician
Dr. Braun
User
Moessner
4.6.4 Documenting the Analysis
Results
5 mm
1
Modify…
Figure 4.6-9. Printer setup screen
Help
Click on the
analysis results.
The printer setup screen displays (Figure 4.6-9) where you
can change the signal size and the sweep speed of the vector
diagram and the median complexes before the printout.
On the same screen you include or exclude the interpretation,
you select or deselect the ECG grid and you choose the
number of copies as well as the printer.
Print
Save
227 498 02-A
button to obtain a document of the
CardioSys V 4.1
will initiate the printer.
will save the printer setup.
201
Late Potentials
Setup
Patient
Procedure
4.6.5 Setup
Hellige
System Services
Help
SetupAcquisition
Late Potential / Signal
Baker, David, 48 yrs
Test Demographics25
Speed (mm/s)
Defaults
Gain (mm/mV) Reset QRS
10
Freeze ECG
Options
10mm/mV
»
Click on
buttons.
HR
60
25mm/s
SYS/DIA (mm/Hg)
Lead Check noise level
Corr. Beats
low
100 % QRS
X
1.0
(0.1…5.0)
Click on
ure 4.6-10).
3
1
2
Correlation Coefficient (%) 95
(1…99)
HFLA Treshold (µV)
40
(5…99)
R
L
Number of QRS
200
(20…500)
N
F
5
4
6
X 1-mV Cal Pulse
Audible LEAD OFF Alarm
Print after Recording
Setup
to call up the setup screen (Fig-
Use this screen to select your personal system settings. These
settings will be saved.
OK
Y
Z
to display the second line of control
43
Cut-off Frequency (Hz)
40
Noise (<1.0µV)
1.7 µV %Corr.
Beats (200)
Noise Limit (µV)
Options >>
Cancel
Help Lead Sequence
XYZ - uncorrected
HFLA Treshold [µV]
40
Adjustments are made in three different ways:
Figure 4.6-10. The defaults menu
202
1
There is an arrow at the end of a box. Clicking this
arrow will open a window which offers various options.
Select the desired setting by clicking the mouse button.
2
There is a text box next to the respective parameters.
Click on this box and key in the desired text.
3
There is a check box in front of the function. Click the
box to enable or disable the function (check mark =
function enabled).
CardioSys V 4.1
227 498 02-A
Late Potentials
Speed
selects the trace sweep speed
Gain
selects the signal size (amplitude)
Lead Check noise level
This is a measure of the quality of the acquired signal (signalto-noise ratio). When there is too much signal noise at the
electrode, the electrode is displayed yellow on the signal
acquisition screen. The setting that you select here (low,
middle, high) changes the threshold as of which the electrode
is displayed yellow (high sensitivity to noise = low threshold).
Cut-off Frequency
Adjustment of the cut-off frequency of the high-pass filter
(25 Hz, 40 Hz; default: 40 Hz).
Noise Limit
Here you can enter an upper limit value for signal noise of the
ECG after averaging and filtering. Any value between 0.1 and
5.0 µV is possible (default: 1.0 µV). When the signal noise
falls below this limit, the system starts measuring the QRS
complexes if, at the same time, at least 50 complexes have
been collected.
Correlation Coefficient
The correlation coefficient entered in % is a measure of the
congruence of the QRS complexes (settings between 1 and
99%, default: 95%).
227 498 02-A
HFLA Threshold
For entry of the HFLA threshold (high frequency low amplitude). Any value between 5 and 99 µV is possible (default:
40 µV). In the vector diagram this threshold is marked by a
dashed line. The HFLA duration is the period of time from
the end of the QRS complex towards the middle, during
which the signal amplitudes were below the selected threshold.
Number of QRS
Number of QRS complexes to be averaged (also refer to
“Noise Limit”). Possible settings: 20 to 500, default: 200.
1-mV Cal Pulse
Display of 1-mV calibration pulse: yes or no (check mark =
yes).
Audible LEAD OFF Alarm
Audible signal when an electrode is disconnected: yes or no
(check mark = yes).
Print after Recording
Printout immediately at the end of the analysis.
Click on
(modifications are saved) or
Cancel
(modifications are ignored) to clear the
defaults menu.
CardioSys V 4.1
OK
203
Late Potentials
For your notes
204
CardioSys V 4.1
227 498 02-A
External Programs
4.7 External Programs
This section explains
227 498 02-A
–
general points to note when running external programs
–
how to install external programs for activation from
CardioSys/Soft
CardioSys V 4.1
205
External Programs
4.7.1 General Information
The Marquette Hellige program has a special BDT interface
for communication with external programs.
Dialog between Marquette Hellige program and external
program:
☞ Marquette Hellige is not in a position to guaran-
–
start Marquette Hellige program
tee the correct communication between the
Marquette Hellige program and the external
program in all cases.
–
select patient
–
select external program from the procedure selection
menu (the program in question must have been set up
first; refer to section 4.7.2 “Setting Up External Programs”)
–
perform the examination (e.g., Holter ECG,
sonography)
–
return to the Marquette Hellige program, adopt procedure summary and assign it to the patient’s procedure
list
In situations where the external program and the Marquette
Hellige program are operated together, the patient file is
handled by the Marquette Hellige program while the procedure data are managed by the external program. At the end,
the Marquette Hellige program only adopts a summary of the
“external procedure” and assigns it to the procedure list of the
patient concerned.
Prior to calling up an external program, you should select a
patient in the Marquette Hellige program. If you wish to
change to another patient during an external procedure, you
have to leave the external program to select the new patient in
the Marquette Hellige program.
206
CardioSys V 4.1
227 498 02-A
External Programs
Patient
Untersuchung
ProcedureHellige
Selection Menu
Hilfsfunktionen
4.7.2 Setting Up External Programs
Hilfe
ECG
External Programs
(Unbenannt)
Rest ECG
Exercise Test
STAT ECG
Right-Heart
Catheterization
Click on
to display the procedure selection menu
(Figure 4.7-1).
Holter ECG
Monitoring
External Programs
120/80
All icons of the external programs are dimmed, which means
that they are inactive. To activate an icon, the corresponding
program must be set up first.
HELLIGE CARDIOSOFT
Ambulatory Blood
Pressure
Late Potentials
T1.0a
Setup
Spirometry
Display the setup screen with
4.7-2).
…
Spirometry
Bronchodilation
Cancel
Help
Setup
Untersuchung
Hellige
Procedure
PPG
Selection
Hellige
Menu
Hilfsfunktionen
ECG
(Figure
In the list box, click on the program to be configured,
then type the program path and name in the text box
below (e.g., c:\ecg\holter.exe). For “External Program”
you will have to add a name for the examination under
which it will be saved.
Figure 4.7-1. Procedure selection menu
Patient
Setup
Hilfe
External Programs
External Program Setup
Baker
RestPrograms
ECG
External
STAT ECG
Holter ECG
Ultrasound
Stress Echocardiography
X-Ray
Stress Test
Monitoring
Cardiac Catheterization
Cath Lab Data
External
Program
120/80
Holder ECG
Ultrasound
Stress
Echocardiography
X-Ray
Select
Ambulatory Blood
Late Potentials
Cardiac
Program
path and name
c:\|ecg\holter.exe
Pressure
Catheterization
Spirometry
Cancel
to clear the window.
Cath. Lab. Data
pay attention to the compatibility with archived
procedures.
CARDIOSYS
OK
Cancel
external Program
…
Spirometry
or
☞ When changing the external program setup, please
HELLIGE CARDIOSOFT
T1.0a
OK
Help
Configuration
Bronchodilation
Cancel
Help
Figure 4.7-2. Setup of external programs
227 498 02-A
CardioSys V 4.1
207
External Programs
For your notes
208
CardioSys V 4.1
227 498 02-A
Deleting Examinations, Quitting the Program
5. Deleting Examinations, Quitting
the Program
Deleting Examinations
An examination can be deleted only when it is currently
displayed. This will be
–
either the examination that you have just concluded
–
or the examination that you have just called up from the
database (3.3 “Editing Stored Tests”).
To delete an examination click
. As as safety precaution you will be asked if you really wish to delete this
examination. Select Yes or No, as required.
marquette HELLIGE CardioSoft 4.1 - Authorization
User Name
Quitting the Program
Supervisor
Select
.
Password
The dialog box shown in Figure 5-1 will appear.
Start program
Figure 5-1. Identification window
227 498 02-A
Quit program
Click on
CardioSys V 4.1
Quit Program
to exit.
209
Deleting Examinations, Quitting the Program
For your notes
210
CardioSys V 4.1
227 498 02-A
System Services Menu
6. System Services Menu
This section explains
227 498 02-A
–
how to configure the system
–
how to use the voice recorder
–
how to copy procedures to other storage media
(e.g. for house calls)
–
how to transfer resting ECGs from an ECG recorder
–
how to compress data
–
how to archive data
–
how to save your preferred system setting under your
name and how to load it
CardioSys V 4.1
211
System Services Menu
6.1 System Configuration
Hellige
Patient
Procedure
(Unbenannt)
System Services
SystemPPG
Services
HelligeMenu
Procedure
Help
Archiving
Setup
Click
: the window showing the system services
opens (Figure 6-1).
System
Configuration
Compression
Copy Patient
Records
Load
Click
: you will see the system configuration screen
(Figure 6-2).
HELLIGE CARDIOSOFT
from ECG
System/ECG
Recorder
Voice
Recorder
T1.0a
Archive Patient
Save
Records
General Tab
Cancel
Help
Institution Name and Address
– For entry of the hospital/practice name and address
(“Remote Cart Name” is enabled only when the system
is connected to a network).
– For entry or selection of the physician and technician
(names appear on Test Information screen) or their ID.
Figure 6-1. System services selection window
System Configuration
General Modem MUSE Option Code Country Settings
Institution Name and Address
Name
Database…
Street
City
Remote Cart Name
Physician
ID
Technician
ID
User List…
Default Procedure
Modify password…
Trace Background
black-yellow (antial.)
Windows control menu
(Restart program for changes to become
effective)
Screen Diagonal
15 in
Menu labels
Remote Test Screen
NETBIOS-Protocol
Test Patient (temporary)
Enable Password Function
Anti-Aliasing of ECG Waveforms
Patient Selection prior to STAT ECG
Default Procedure
Here you select the procedure which the system selects automatically when turned on. Click the arrow , then click the
desired procedure.
Trace Background
You can select various colors for the background on which the
signal traces are displayed. Click the arrow , then click the
desired color.
Enable Test Information Window
Icon Bar…
System Configuration
Save
Load
Print
For Service only
Help
OK
Figure 6-2. System configuration screen
212
Cancel
Screen Diagonal
Select the screen size of your PC system’s monitor to assure
that the traces are displayed true to scale. Click the arrow ,
then click the dimension.
CardioSys V 4.1
227 498 02-A
System Services Menu
Remote Test Screen
For selection of the network communication protocol.
NETBIOS possible only when working in a network installation..
System Configuration – Save, Load, Print
– to save the configuration to a floppy
– to load the configuration from a floppy
– to print the configuration
Remote Cart Name
Designates the workstation in the network (required for
NETBIOS).
Database
As soon as the storage capacity of the selected drive drops to a
certain percentage the system displays a warning. The percentage can be entered in this window.
Test Patient (temporary)
This feature allows you to view recordings from a test patient
for all test procedures. To avoid misunderstandings, you must
deliberately select this feature each time you call up the program (check mark in box). Although the word _TEST is
added to the patient’s name, it is recommended, for reasons of
safety, to open a new patient file and enter the patient name
TEST.
Anti-Aliasing of ECG Waveforms
When this function is enabled X , the displayed ECG will be
smoothed.
Enable Test Information Window
When you check this box, the test demographics window will
appear automatically.
Enable Password Function
User registration dialog appears at program start yes/no.
Patient Selection prior to STAT ECG
Here you choose whether or not the patient selection window
will appear when you start recording a STAT ECG.
227 498 02-A
CardioSys V 4.1
213
System Services Menu
6 4 5
User List ...
1
Via the user list, you define the persons authorized to use the
program, and their rights.
User
User Name
ID
Group
Technician
Setup
2
User List…
Click on the
button to display the list of
registered users (technician, physician, privileges).
3
External User
Privileges
Edit Data
Configure System
To register a new user,
Password …
OK
Cancel
Click on
Help
Figure 6-3. Dialog window
New...
.
A user registration form (Figure 6-3) will appear.
Enter the user’s name or ID (1).
☞
Only the supervisor is authorized to modify the
user list.
In the “Group” list box, choose the “Technician” or
“Physician” category (2).
Select the user’s personel setup (see 6.6 “Loading and
Saving Custom Setups” (3).
If you wish to assign privileges to the user, check the
appropriate box.
Checking “Edit Data” means that the user is authorized to
retrieve all stored procedures including the interpretative
statements and patient data, to modify them and to delete
them.
Checking “Configure System” means that the user is authorized to configure the system.
214
CardioSys V 4.1
227 498 02-A
System Services Menu
Password (5)
To change the user’s password.
External User (6)
System users who wish to receive test data from other stations
must be registered as “External Users”. Furthermore the
names and passwords of these users must be entered at the
sending stations.
Windows control menu
You can choose to display the Windows control menu and the
“minimize” arrow which allows you to quit the program and
to shrink the window to an icon.
Menu labels
Above the icons you can display the menu labels, which
allows you to click the words and select options from the
drop-down menus.
Icon Bar
Here you choose the icons that will appear in the icon bar and
the order of icons.
227 498 02-A
CardioSys V 4.1
215
System Services Menu
Modem Tab
System Configuration
General Modem MUSE Option Code Country Settings
Setup for Modem
Port
COM2
Baud Rate
19200
Modem Type
MultiTech
Initialization
AT&FMO&E7X3VO&Q1S
Dial Mode
ATDT
Hang-up Prefix
+++
Hang-up Suffix
ATHO
If you wish to send data via a modem, select the port, the
baud rate and the modem model here (set sender and receiver
to the same baud rate).
For Multitech and ELSA modems, the system automatically
enters all other necessary data. If you choose another modem,
you will have to enter them yourself.
Init string for MultiTech modem (14400):
AT&FM0&E7X3V0&Q1S0=1
Help
OK
Cancel
Figure 6-4. Modem setup
Warning
Caution
216
Init string for ELSA modem:
AT&FM0\X1X3V0S0=1
The init string must include the following commands
Only modems complying with the requirements
of IEC 60950 or UL1950 may be connected to
the system. Furthermore, the regulations applicable in the respective countries must be observed.
The modem must be set up inside the medically
used room, but outside the patient environment.
For baud rates higher than 19200 an interface
component with buffer (16550) must be installed and activated in Windows.
1.
factory defaults
2.
response code in digital form
3.
for telephone system with extensions: display additional
BUSY message
4.
modem answers after 1st ring
Please observe the information given in the modem’s user
manual.
CardioSys V 4.1
227 498 02-A
System Services Menu
Here are some of the important commands:
AT
D
precedes each command
Start dialling in sender mode.
The following parameters may be used in a dial
command:
0-9, A-D, #, *
P pulse dialing
T touch tone dialing
, wait for 1 s, e.g. to obtain an outside line dial
tone
! flash
@ wait for silent answer
W wait for dial tone
&F fetch configuration profile (copies factory defaults
from the ROM to the RAM)
H0
disconnect
M0 speaker always off
M1 speaker on until connection is established
&D0 ignore DTR on-to-off transition
&Q1 use standard AT commands
Q0
modem sends response codes
Q1
modem will not send response codes
S0=1 modem will auto-answer call after first ring
V0
modem will display response codes in digital form
(required setting!)
X1
modem displays CONNECT response, disables
dial tone and BUSY message
X3
as X1, but modem displays BUSY message (for
dialling from extensions)
227 498 02-A
CardioSys V 4.1
217
System Services Menu
MUSE Tab
System Configuration
General Modem MUSE Option Code Country Settings
Setup for MUSE
1
2
3
4
5
6
7
8
9
10
11
12
MUSE site
Request MUSE data
1
On this tab you make all selections for the transfer of data to a
MUSE CV database. First of all you should obtain the following information: MUSE server network address, login name,
and password. Verify that the network configuration is OK
and that the Internet Explorer and Acrobat Reader are properly installed. The same applies to the modem setup when
using RAS.
MUSE Web Server
MUSE User Name
MUSE Password
Store procedure for MUSE
No data transfer to MUSE
Save MUSE data to medium
Drive
A
Data transfer to MUSE via the network
MUSE FTP Server
MUSE FTP User Name
MUSE FTP Password
MUSE FTP Proxy Server
Data transfer to MUSE via Shared Directory
Shared Directory
Directory User Name
1
Patient data and orders are requested from MUSE.
2
Entry fields for MUSE database queries.
3
Entry field for MUSE site number.
4
Click radio button if you do not want to transfer data to
MUSE.
5
Click radio button to transfer data to MUSE via a
storage medium (floppy disk): select disk drive.
6
Click radio button to transfer data to MUSE via the
network.
7
Entry fields for MUSE FTP server (MUSE version 5).
8
Click radio button to transfer data to MUSE via a shared
directory.
9
Enter the directory names here.
Directory Password
Delete local test data after transfer to MUSE
Start modem connection before transfer
Location Number
0
Cart Number
0
Help
OK
Cancel
Figure 6-5. MUSE tab
Caution
☞
To transfer data to the MUSE CV database,
please contact Marquette Hellige service for
advice and for the necessary system setup.
MUSE only accepts ASCII characters A to Z,
0 to 9.
10 Check box if data are to be deleted on the local hard
drive after transfer to MUSE.
11 Check box to establish a modem connection.
12 Enter or select the location and cart number.
218
CardioSys V 4.1
227 498 02-A
System Services Menu
Option Code Tab
System Configuration
General Modem MUSE Option Code Country Settings
RESB: Rest ECG Standard
If you purchased additional software options, enter the option
code(s) on this screen to activate the option(s). The code
number is supplied with the purchase.
RESM: Rest ECG Measurement
RESI: Rest ECG Interpretation
ERG1: Exercise Test S (Standard)
ERG2: Exercise Test AT (ST Measurement, Arrhythmia, 6/12
Leads)
ERGM: Remote View
EGMO: Storage of Full Disclosure ECG
NETS: Data Storage on File Server
If the code numbers are stored on a disk, insert the disk and
Load
click
. The code numbers will automatically be
entered in the appropriate field.
ERG3: Exercise Test Expert Mode (requires Exercise Test AT;
ECG Strips window, adjustable E/J point)
ESTA: Exercise Test Stage Report (only with 486 100 MHz min.
or Pentium 75 MHz))
AVER: Late Potentials
OMAN: Process Order List
REVM: Review Manager (requires CORINA/dongle)
ECGH: ECG History (requires CORINA/dongle)
CBOX: Cardio Mailbox (requires CORINA/dongle)
Load
Help
OK
Cancel
Figure 6-6. Option Code tab
Caution
If the Test Patient is enabled, the software
options can be activated with the code number
“123”.
227 498 02-A
CardioSys V 4.1
219
System Services Menu
1 2
3 4
5 6 7 8 9 10
System Configuration
On this screen you select all country-specific system settings.
General Modem MUSE Option Code Country Settings
Language
English
Time Format
24-Hour Format
Date Format
DD.MM.YYYY
Unit of Measure
cm, kg
Speed Unit
km/h
ST Level
mV
Line Frequency
50 Hz
Lead Label
IEC
Country Settings Tab
1
Enable or disable the Swedish patient ID.
2
Enable or disable the Card Reader function (patient data
acquired from patient ID card).
3
Select the electrode lead label convention: IEC or AHA.
4
Select the AC line filter frequency (50/60 Hz).
5
Select the language.
6
Select the time format.
7
Select the date format.
8
Select the units for height (cm, inches) and weight (kg,
lb).
9
Select the speed unit (km/h, mph). Ensure that the same
unit is selected at the treadmill.
Enable Swedish Patient ID
Enable Card Reader
Help
OK
Cancel
Figure 6-7. Country Settings tab
10 Select the ST level unit (mm, mV).
220
CardioSys V 4.1
227 498 02-A
System Services Menu
6.2 The Voice Recorder
Hellige
Patient
Procedure
(Unbenannt)
System Services
SystemPPG
Services
HelligeMenu
Procedure
System
Configuration
Help
Archiving
Setup
Compression
Copy Patient
Records
Load
HELLIGE CARDIOSOFT
Voice
Recorder
from ECG
System/ECG
Recorder
T1.0a
Archive Patient
Save
The voice recorder feature allows you to record comments,
save them with the date and under a specific heading, and
play them back. If the program runs in a network environment, you can call up the comments from all connected
stations.
Records
Cancel
Help
Click
: the window showing the system services
opens (Figure 6-8).
Click the
icon: you will see a list of all stored voice
recordings (Figure 6-9).
Figure 6-8. System Services Menu
Hellige
Patient
Procedure
System Services
Voice
PPGRecorder
Hellige
Help
Date / Time of Recording, Category
(Unbenannt)
07.08.1994
14:01:00
Info to personnel
HELLIGE CARDIOSOFT
Modify…
Cancel
Help
T1.0a
Figure 6-9. List of stored voice recordings
227 498 02-A
CardioSys V 4.1
221
System Services Menu
Recording New Comments/Modifying Existing Comments
Hellige
Patient
Procedure
System Services
Help
Modify/New
PPG Hellige
Recording
Standard Categories
(Unbenannt)
Personal note
Category
Click
>>
to record a new comment.
Doctor's letter
Referral
Info to telephone switchboard
Info to staff
Private
Modify…
HELLIGE CARDIOSOFT
T1.0a
OK
Cancel
Help
Figure 6-10. Voice recording window
The voice recording window appears (Figure 6-10). The
Standard Categories box contains up to 6 categories or headings for standard texts that you may want to record. To copy
one of these standard headings into the Category box, simply
double-click it in the left-hand column. It is possible to copy
more than one standard heading into the Category box.
To edit one of the standard headings, highlight it and
select Modify… .
Entering/Modifying Standard Categories
Display the voice recording window (Figure 6-10).
Click
Modify…
.
Move the cursor to the entry point and click.
Type the text.
Click
OK
to clear the window.
Creating Categories and Recording a Comment
Double-click one of the standard categories to copy it to
the Category box.
222
CardioSys V 4.1
227 498 02-A
System Services Menu
As an alternative, you can also write a category directly
into the Category box or add something to an existing
category via the keyboard.
Click the
icon and follow the instructions displayed
on the screen.
Click the
Click
icon if you wish to verify the recording.
OK
to quit the screen.
You will now see the table of contents, including the new
recording.
Playing Back or Deleting Recordings
Click
opens.
: the window showing the System Services
Click the
recordings.
icon: you will see a list of all saved speech
Highlight the desired recording by clicking.
227 498 02-A
Click
or
Click
Cancel
CardioSys V 4.1
, as required.
to quit the voice recorder function.
223
System Services Menu
6.3 Copying Patient Records
to/from Storage Medium
Hellige
Patient
Procedure
(Unbenannt)
System Services
System
PPG
Services
HelligeMenu
Procedure
System
Configuration
Help
Archiving
Copy Patient
Records
Setup
Compression
Load
HELLIGE CARDIOSOFT
Voice
Recorder
from ECG
System/ECG
Recorder
T1.0a
Archive Patient
Save
Records
Cancel
Help
Click
: the window showing the System Services
opens (Figure 6-11).
Figure 6-11. System Services Menu
Click
: you will see the procedure selection window
(Figure 6-12).
Hellige
Patient
Baker
Procedure
System Services
Copy PPG
Patient
Hellige
Records
Patient
Help
4
Modify…
Check that the correct patient is selected.
1
HELLIGE CARDIOSOFT
»
2
3
5
»
Patient Records
10.08.1998,
10.08.1998,
10.08.1998,
10.08.1998,
10.08.1998,
10.08.1998,
10.08.1998,
10.08.1998,
10.08.1998,
Copying Records from the PC to the Storage Medium
Medium Directory
Find…
Jane Miller, 42 yrs.
13:22:01,
12:24:13,
12:05:05,
12:03:48,
11:45:19,
11:41:42,
11:32:36,
11:21:07,
11:12:45,
Records on Storage Medium
Spirometry
Stress Test
Stress Test
Stress Test
Stress Test
Rest ECG
Rest ECG
Stress Test
Rest ECG
This function allows you to copy one or more examination
procedures from the PC to another storage medium, such as
magneto-optical disks (e.g., for house calls). You can also copy
data from another storage medium back to your PC database.
Restore procedures to your PC only if changes were made to
them.
Click
Find ...
, if you wish to select another patient.
T1.0a
Cancel
This opens the patient selection window. Select a patient as
described in section 3.1. All records of this patient appear in
the list below.
Help
Click the record(s) to be copied.
Figure 6-12. Patient records selection window
(Copy Patient Records)
1 Selected patient
2 Records saved for selected patient
3 Transfer buttons
4 Storage medium directory
5 Records stored on selected storage medium
224
Check that the correct drive/directory is selected.
Click Modify… , if you wish to select another drive or
directory.
CardioSys V 4.1
227 498 02-A
System Services Menu
☞
Error messages may be displayed when:
– the storage medium is write-protected
– the storage medium is unformatted
Click
OK
to clear the window.
>>
Click
to initiate transfer of the selected file(s).
The copied record(s) will appear in the “Records on
Storage Medium” window.
– the storage capacity is insufficient
– the storage medium is defective
Restoring Files from the Storage Medium to the PC
Proceed as follows to copy modified records or new records to
the PC:
Display the system services menu and the transfer function as described above.
Select the patient.
Select the appropriate drive/directory.
Click the record(s) to be copied.
Click
<<
to initiate transfer of the selected file(s).
The copied record(s) will appear in the “Patient
Records” window.
Click
227 498 02-A
CardioSys V 4.1
Cancel
to quit the function.
225
System Services Menu
6.4 Transferring Resting ECGs from
the ECG Recorder
Hellige
Patient
Procedure
(Unbenannt)
System
Configuration
System Services
SystemPPG
Services
HelligeMenu
Procedure
Copy Patient
Records
Help
Archiving
Setup
Compression
The system allows you to transfer ECG recordings made with
a Marquette Hellige recorder (CARDIOTEST,
CARDIOGNOST, CardioSmart) to the PC database.
Load
HELLIGE CARDIOSOFT
Voice
Recorder
from ECG
System/ECG
Recorder
T1.0a
Archive Patient
Save
Records
Assigning Records to Patients
Cancel
Help
In general, the system will automatically assign the incoming
records to the appropriate patients, if they exist in the database.
Figure 6-13. System Services Menu
☞
☞
Some of the patient data are not transferred (e.g.
the medication). Always verify the records sent
from an ECG system/recorder.
If a user ID was not entered, the ECG recorders
will ocasionally send the record with a number of
blanks in place of the ID.
If the incoming record is without patient ID (and without
blanks), the patient ID 000000 will be entered.
If the patient ID of the incoming record exists in the database,
the record will be assigned to that patient. The patient data of
the record will be updated with those in the database.
“Automatically assign procedure to patient” disabled:
If the patient ID of the incoming record does not exist in the
database, the record will be registered to the list of received
records and the user has to assign it manually to the correct
patient.
“Automatically assign procedure to patient” enabled:
If the patient ID of the incoming record does not exist in the
database, a new patient file will automatically be generated
with the patient data of the incoming record and the record
will be assigned to that patient.
226
CardioSys V 4.1
227 498 02-A
System Services Menu
Data from ECG System / ECG Device
Click
: the window showing the System Services
opens (Figure 6-13).
ECG system connected to modem port
ECG recorder connected to modem port
Automatically assign procedure to patient
ECG recorder connected to serial interface
Baud Rate
19200
Port
COM2
Click the
icon: you will see the transfer setup
window (Figure 6-14).
Data from storage medium
Medium Directory
First of all, select the transfer system
(ECG system = CardioSys/Soft,
ECG recorder = Marquette Hellige electrocardiograph).
Modify…
OK
Cancel
Help
Figure 6-14. Transfer setup window (from ECG recorder)
☞
Select the appropriate baud rate (19200, if possible; refer
to section “Specifications” in the ECG recorder manual).
A device number (e.g. number 12) can be entered
for ECG recorders, by writing “Hospital %12%”
in the Hospital/Practice box.
Select the communications port
.
Select the directory, if you wish to transfer data from a
storage medium.
OK
Click
to initiate file transfer, and observe the
instructions displayed on the screen.
Press the Copy key on the ECG recorder.
Click Cancel to terminate ECG transfer. Figure 6-15
will be displayed where you can assign the transferred
ECG(s) to the patient(s) concerned.
Click on ECG (e. g. Resting ECG, Baker, Dave).
Click on Find ... to select the patient or admit a new
patient, if the name does not yet exist in the database.
Click on
227 498 02-A
CardioSys V 4.1
<<
to assign the ECG to the patient.
227
System Services Menu
If the same resting ECG is repeatedly transmitted from
CardioSmart, an error message is displayed when you attempt
to assign the ECG. In this situation the redundant ECG can
be deleted.
Hellige
Patient
Procedure
System Services
Help
Assign records from
PPG
ECG
Hellige
system / ECG recorder
Patient
Baker
Find …
Baker, Dave, 41 yrs
Patient Records
Records from ECG system / ECG recorder
13:48:14,
10:15:56,
08:45:44,
15:14:47,
14:46:45,
12:43:17,
11:02:36,
08:49:03,
08:48:08,
15:25:48,
15:18:42,
15:39:11,
Resting ECG
Resting ECG
Resting ECG
Resting ECG
Stress Test
Stress Test
Stress Test
Resting ECG
Resting ECG
Stress Test
Stress Test
STAT ECG
05.12.1998, 10:25:40, Resting ECG, Baker, Dave
ECG Transfer via Communication Server
HELLIGE CARDIOSOFT
»
09.11.1998,
27.10.1998,
27.10.1998,
26.10.1998,
26.10.1998,
26.10.1998,
26.10.1998,
26.10.1998,
26.10.1998,
25.10.1998,
25.10.1998,
25.10.1998,
T1.0a
Cancel
Figure 6-15. Assigning transferred ECGs
228
Help
It is possible to simultaneously send the ECGs from several
ECG recorders (max. 4) via modem to CardioSoft/CardioSys.
To utilize this features, an extra PC is required as the communication server. This server is part of the network through
which the ECG can be transferred to the CardioSys or
CardioSoft computer and/or to a MUSE CV system. Please
contact Marquette Hellige service for advice.
CardioSys V 4.1
227 498 02-A
System Services Menu
6.5 Data Compression,
Archiving Patient Records
Hellige
Patient
Procedure
(Unbenannt)
System Services
Help
SystemPPG
Services
HelligeMenu
Procedure
Archiving
Setup
Data Compression
System
Configuration
Copy Patient
Records
Compression
Load
Older data files which are seldom used can be compressed to
free storage capacity for new data files. If you call up the
compressed files, they uncompress automatically. They take
only a little longer than normal files to be displayed.
HELLIGE CARDIOSOFT
Voice
Recorder
from ECG
System/ECG
Recorder
T1.0a
Archive Patient
Save
Records
Cancel
Help
Click
: the window showing the System Services
opens (Figure 6-16).
Figure 6-16. System Services Menu
☞
In a network environment, the program must be
terminated at all other workstations.
Click the
icon. The compression setup screen
appears (Figure 6-17).
Enter the procedure date up to which you want to have
the files compressed.
Data Compression
Compress Exercise Test/STAT ECG procedure data that are
older than the date shown:
01.01.1999
Compress…
Click Compress… to initiate data compression. As a safety
precaution, the system asks you if you really wish to
proceed. Click Cancel , if you decide to abort the
procedure.
Cancel
Help
Click on
Cancel
to terminate data compression.
Figure 6-17. Data compression setup screen
☞
Run a backup of all data (Appendix 3) before
compressing or exporting it.
227 498 02-A
CardioSys V 4.1
229
System Services Menu
Hellige
Patient
Procedure
(Unbenannt)
System
Configuration
System Services
System
PPG
Services
HelligeMenu
Procedure
Copy Patient
Records
Archiving Patient Records (e. g. to a magneto-optical disk)
Help
Archiving
Setup
Compression
An even more efficient way to free storage capacity is the
export of data to external storage media. These files are still
included in the table of contents, but they are marked with an
asterisk*.
Load
HELLIGE CARDIOSOFT
Voice
Recorder
from ECG
System/ECG
Recorder
T1.0a
Archive Patient
Save
Records
Cancel
If you select one of these files for display, the program tells
you where they are stored. Before archived records can be
transferred to MUSE, they must be restored to the system.
Help
Figure 6-18. System Services Menu
☞ In a network environment, the program must be
terminated at all other workstations.
Click
: the window showing the System Services
opens (Figure 6-18).
Click the
icon. The archive setup screen appears
(Figure 6-19).
Enter the date up to which you want to have the files
exported.
Patient Records Archive
Click
Import
Export
Import all patient records from
archive
Export all patient records that are older
than the date shown:
Import…
01.01.1999
Export…
Cancel
Export…
.
Insert the storage medium and, after the archive procedure, label it with the number displayed.
Help
Figure 6-19. Data export setup screen
☞ In the “Virtual memory” window the “32-bit
access” must be disabled.
Select the target drive (e. g. d:\). Do not export data to
the root directory, but to the subdirectory d:\data, for
instance.
OK
Click
to initate file transfer, and observe the
instructions displayed on the screen.
Proceed in a similar manner to import files into the PC
system, using the Import… functions.
230
CardioSys V 4.1
227 498 02-A
System Services Menu
6.6 Saving and Loading Custom
Setups
Hellige
Patient
Procedure
(Unbenannt)
System Services
SystemPPG
Services
HelligeMenu
Procedure
System
Configuration
Copy Patient
Records
Help
Archiving
Setup
Compression
The program allows you to save setups and text libraries under
a user or ward name and to quickly load these settings whenever needed (exceptions to this rule are explained at the end of
this chapter). With this feature you can adjust the system to
suit a specific user’s requirements in a matter of seconds.
When running in a network environment, the program
settings, including the factory settings, can be called up at any
connected station.
Load
HELLIGE CARDIOSOFT
Voice
Recorder
from ECG
System/ECG
Recorder
T1.0a
Archive Patient
Save
Records
Cancel
Help
Click
: the window showing the System Services
opens (Figure 6-20).
Figure 6-20. System Services Menu
☞
It is not possible to save exercise protocols or test
phases.
☞
Before loading a stored system setup you must save
the setup currently active.
☞
When reactivating the factory settings, the exercise
test protocols and phases that you created yourself
will be deleted with some ergometer models.
Click
to save the setup and
to load a setup.
Save
1.
Select the drive.
2.
In the “Save As” field, enter the name for this setup.
3.
Click the
Save
button.
Load
227 498 02-A
1.
Select the drive.
2.
Click on the setup name.
3.
Click the
CardioSys V 4.1
Load
button to load the setup.
231
System Services Menu
The following parameters cannot be loaded, saved or reset to
factory settings:
exercise test
–
–
–
–
–
–
ergometer model
ergometer port
remote view
BP monitor model
BP monitor port
thermal printer port
spirometry
–
–
ambient conditions
respiration sensor port
ambulatory blood
pressure
–
BP monitor port
system
configuration/
general
–
–
–
–
–
–
–
–
access password
default mode
trace background
screen diagonal
station name
physician
user
patient selection with card reader
only
test patient
icon bar configuration
option codes
Windows configuration
baud rate/electrocardiograph
interface
–
–
–
–
–
232
CardioSys V 4.1
227 498 02-A
Cleaning, Disinfection and Maintenance
7. Cleaning, Disinfection and
Maintenance
7.1 Instrument Surface
In addition to the information below observe the instructions
for use enclosed with the electrodes.
*
Before cleaning and disinfecting the device, disconnect it
from the power line.
*
Discard disposable electrodes immediately after use to
prevent their being reused.
*
Clean the instrument surface with a cloth moistened in a
cleaning solution. Take care that the solution does not
enter the device. All hospital-grade cleaning solutions
and disinfectants containing up to 70% alcohol are
suitable.
*
Clean reusable electrodes immediately upon removal
from the patient.
*
Peel off the adhesive foil before cleaning them (residual
adhesive can be removed with benzine).
Disinfectants with a phenol base or peroxide compounds
are not suitable for disinfection of the instrument surface.
*
Use warm water and a small brush to remove electrode
cream. Do not use pointed metal objects to remove solid
particles of dirt from the electrodes.
*
Disinfect the electrodes with alcohol-free disinfectants.
Make sure that plugs and sockets do not become wet.
Disconnect the cable from the device before cleaning or
disinfecting it. To do this, pull on the plug, not on the
cable itself.
*
Use only gas to sterilize the electrodes (frequently sterilizing the electrodes with ethylene oxide shortens the life of
the plastic material).
Rub the cable clean with a cloth soaked in soapy water.
To disinfect the cable, rub it down with disinfectant. Do
not immerse the cable in liquids!
*
For information on cleaning, disinfection and sterilization of other sensors and transducers, please refer to the
instructions for use included with these devices.
*
7.2 Patient Cable and Electrodes
*
*
227 498 02-A
CardioSys V 4.1
233
Cleaning, Disinfection and Maintenance
7.3 Respiration Flow Sensor LF 501
Please refer to the Operator’s Manual of the Respiration Flow
Sensor LF 501 for more details on cleaning and disinfection.
Cleanliness and hygiene of the sensor is of the utmost importance as the patients breathe in and out through the sensor
during the test. Use a new mouthpiece for each new patient.
The use of mouthpieces with bacteria filters is imperative!
When using mouthpieces with bacteria filter in compliance
with their instructions for use, it is not necessary to clean and
disinfect the sensor after each measurement.
This applies on the condition that the patient does not suffer
from infections of the respiratory tract and that not more than
15 respirations are measured on the patient.
When a test is performed on a patient with a manifest or
suspected infection of the respiratory tract, cleaning and
disinfection of the sensor is imperative.
For average use of the sensor, i.e., up to 5 tests of patients
with no infections of the respiratory tract per day, it is sufficient to clean and disinfect the sensor once a day.
Even when the sensor is not in use, we recommend that it be
cleaned and disinfected once a week.
The Respiration Flow Sensor LF 501 does not require routine
maintenance.
234
CardioSys V 4.1
227 498 02-A
Cleaning, Disinfection and Maintenance
7.4 Maintenance
Checks Before Each Use
Technical Inspections
Visually inspect the system, all cables, and electrodes for signs
of mechanical damage before each use.
For safety, the devices require regular maintenance. To ensure
functional and operational safety of the system, technical
inspections should be carried out annually.
If you detect defects or malfunctions which may impair the
patient’s or the user’s safety, the system must be repaired
before being used again.
The system does not require other regular maintenance.
These inspections should be referred to independent persons
with adequate training and experience.
Within the framework of a service contract Marquette Hellige
service representatives would be pleased to carry out these
preventive maintenance inspections for you.
The Technical Inspections include:
*
visual inspection of the device and accessories for mechanical damage that may impair their function
*
verification of the safety-related device labelling for
readability
*
verification of the device platform
*
measurement of the resistance of the non-fused earthed
conductor and of the equivalent leakage current according to the local regulations.
The system does not require other regular maintenance
inspections.
227 498 02-A
CardioSys V 4.1
235
Cleaning, Disinfection and Maintenance
For your notes
236
CardioSys V 4.1
227 498 02-A
Troubleshooting Tips
8. Troubleshooting Tips
System Messages
227 498 02-A
Message:
CORINA not connected/not switched on!
(audible alarm sounds)
Remedy:
– Exit program (chapter 5) and start over
(section 2.4).
– Delete the entry “load=…” in the [window]
section of the WIN.INI file.
– Implement additional parallel interface for
CORINA.
– If the message recurs, contact the nearest
sales-service office.
Message:
Internal CORINA malfunction! (at the same
time, the system emits 3 beeps)
Remedy:
– Contact the nearest sales-service office.
Message:
CORINA malfunction: Data transfer!
Remedy:
– Exit program (chapter 5) and start over
(section 2.4).
– If the message recurs, contact the nearest
sales-service office.
CardioSys V 4.1
237
Troubleshooting Tips
Malfunctions
Interference: regular AC interference (50/60 Hz)
Cause:
interference from the power line
Remedy:
– Ground bed and system, verify electrode
placement.
– Switch on AC filter, if necessary.
Figure 8-1. Regular AC interference
Interference: irregular interference signals
Cause:
muscle artifact due to patient movements,
trembling, hiccough, coughing
Remedy:
– The patient should be warm enough and rest
comfortably (place cushions under patient’s
knees or arms).
– Divert patient’s attention or distract him/her.
– Switch on muscle filter, if necessary.
Figure 8-2. Irregular AC interference
238
CardioSys V 4.1
227 498 02-A
Technical Specifications
9. Technical Specifications
ECG Processing
Lead selection
manual selection of individual lead sequences or automatic
lead sequencing
*
lead sequences: EINTHOVEN, GOLDBERGER, WILSON,
NEHB, CABRERA lead sequence and custom-configured
sequences
Automatic functions
assist and simplify system operation with
*
automatic blocking function
*
formatted reports
*
automatic baseline adjustment
*
cubic spline algorithm for compensation of variations in
polarization voltage
Heart rate readout
derivation of the heart rate from all ECG signals:
227 498 02-A
*
display range 30 to 300 BPM (measurement and
interpretation up to 240 BPM)
*
display update with every heart beat, or every 2 s
CardioSys V 4.1
239
Technical Specifications
Signal transmission
*
identification of pacing pulses in C2 or another C
electrode and marks in all channels for signals referred to
patient input: duration > 0.1 ms, amplitude > 5 mV
*
noise of signal transmission path less than specified in
IEC and AHA recommendations: < 2.5 µV rms
*
common-mode rejection for 50 or 60-Hz signals
(depending on model) with AC filter enabled >140 dB
Patient signal input to recording
simultaneous transmission of all electrode signals to digital
signal processing system after lead derivation and digitization;
a muscle filter and an AC filter can be activated simultaneously for all leads, pacing pulse detection, automatic or
manual sensitivity adjustment, automatic baseline adjustment,
drift compensation by cubic spline
ECG calibration
*
*
lower cut-off frequency (-3-dB limits) 0.04 Hz, corresponding to a time constant of 4 s
automatic recording of a defined voltage jump, valid for all
channels
upper cut-off frequency (-3-dB limits)
resting ECG/STAT ECG: 150 Hz (IEC/AHA)
stress-test: 75 Hz (IEC)
*
*
signal sampling rate: 1000/s
Baseline
*
resolution, referred to the input: 5 µV
automatic adjustment to the optimal writing range, in
dependance of signal amplitude
*
sensitivity simultaneously adjustable for all leads:
40 – 20 – 10 – 5 mm/mV
Cubic Spline
*
3-dB drop of the amplitude frequency response with
active muscle filter (low-pass) at about 40 Hz
automatic compensation of baseline fluctuations caused by
variations of the polarization voltage at the pick-up electrodes
*
with active AC filter identification and compensation of
regular 50-Hz or 60-Hz frequency components (depending on frequency of power line): attenuation >40 dB
Blocking
*
240
calibration voltage, referred to the ECG signal input:
1 mV
automatic rapid charge reversal of the coupling capacitors in
the preamplifiers upon electrode application
non-linear distortion better than specified in IEC and
AHA recommendations
CardioSys V 4.1
227 498 02-A
Technical Specifications
ECG signal input
*
isolated patient connection type CF according to IEC, all
pick-up electrode connections and N-connection highvoltage-proof, electrodes are monitored for signal quality and
lead breaks
*
*
electrode connections for R, L, F, N, C1 to C6, Nax,
Nst, Nap (=C4)
input impedance for differential signals between any two
electrodes at 10 Hz > 10 MOhms
*
input impedance for common-mode signals referred to
N up to 60 Hz > 50 MOhms
*
dynamic range for differential signals between any
electrode connections ±10 mV for AC voltage, ±600 mV
for superimposed DC voltage (polarization voltage)
*
dynamic range for common-mode signals referred to
N ±1V, referred to chassis 264 V rms
*
quiescent input current via any electrode connection for
1-kOhm termination referred to N < 50 nA
*
patient leakage current (rms values) according to IEC
class CF: in normal condition <10 µA, in single-fault
condition (e.g., patient in contact with line voltage)
<20 µA
non-destructive load at pick-up electrode connections and Nconnection referred to N ±50 V, referred to chassis ±1500 V
227 498 02-A
pulse voltage resistance of all pick-up electrode connections and N-connection referred to chassis of either
polarity (e.g., defibrillation) 5000 V
ECG signal output
ECG signal output for synchronization of ultrasonic units
(not for diagnostic purposes)
The initialization that takes place each time a test mode is
started briefly blanks the ECG signal at the analog output.
The medical system created by connection of external devices
must fulfill the requirements of standard IEC 60601-1-1/
EN 60601-1-1
–
–
–
–
–
–
–
–
–
ECG lead selectable
electrically isolated (±1500 V referred to chassis)
input signal of 1 mV results in 1-Volt output signal
Uoutmax ±10 V
offset accuracy < 300 mV (typical, full scale)
accuracy over entire width < 3% (typical)
R l min. 2 kOhms
delay <10 ms
pacing pulses removed by filtering
(The low-pass characteristic of the input stage of the connected trigger detection circuit should be fg <500 Hz.)
3 1
2
ECG
ground
CardioSys V 4.1
241
Technical Specifications
Lead fail detection
Monitor
Visual and audible indication of disconnected electrodes and
broken leads. Individual monitoring of each electrode.
15-inch or 17-inch monitors can be connected
(only the monitor models supplied by Marquette Hellige are
allowed to be installed on the system cart)
Interfaces
Power supply
PS/2
mouse
from the power line, system design in compliance with
IEC 60601 protection class I
Serial interface
COM1
COM2
COM3
COM4
Version for 230 V
ergometer, treadmill
Respiration Flow Sensor LF 501
unassigned, free for ECG recorder, for instance
Parallel interface
LPT1
LPT2
printer
CORINA
*
rated voltage range 220 to 240 VAC, 50/60 Hz
*
operating voltage range 198 to 264 V, 49 to 63 Hz
*
rated current with 17 inch monitor 1.5 A
*
power consumption
w/o. monitor 60 W
with 15-inch monitor 130 W
with 17-inch monitor 140 W
Printer
EPSON EPL 5700 with at least 4 MB of memory
HP 6P with at least 5 MB of memory
(only the printer modified by Marquette Hellige is allowed to
be installed on the system cart)
Keyboard
CHERRY keyboard G 81-3000
with card reader: CHERRY G 80-1501
Marquette Hellige function keypad for routine operation
during exercise test
242
Version for 115 V
*
rated voltage range 110 to 120 VAC, 50/60 Hz
*
operating voltage range 98 to 132 V, 49 to 63 Hz
*
rated current with 17 inch monitor 2.5 A
*
power consumption
w/o. monitor 60 W
with 15-inch monitor 130 W
with 17-inch monitor 140 W
CardioSys V 4.1
227 498 02-A
Technical Specifications
Environment
Operation
*
ambient temperature between +10 and +40 °C
*
rel. humidity between 30 and 75%
*
atmospheric pressure between 700 and 1060 hPa
Storage and transport
*
ambient temperature between -30 and +60 °C
*
rel. humidity between 20 and 95%
*
atmospheric pressure between 500 and 1060 hPa
Dimensions and weight
height:
width:
depth:
weight:
1150
680
825
60
227 498 02-A
mm
mm
mm
kg (w/o. monitor and printer)
CardioSys V 4.1
243
Technical Specifications
For your notes
244
CardioSys V 4.1
227 498 02-A
Equipment
10. Equipment
Subject to modification. Always refer to latest list of accessories!
101 121 06
CardioSys ECG analysis system including
system cart, PC, 15-inch monitor, keyboard,
mouse, standard software package and exercise
test S software
Accessories
General accessories
227 498 02
Operator’s Manual
System carts
202 306 40
System cart, 230-V version, with pump for
electrode application system, incl. Windows
NT 4.0, language: optional
202 306 41
System cart, 230-V version, without pump for
electrode application system, incl. Windows
NT 4.0, language: optional
227 498 02-A
202 306 42
System cart, 230-V version, with analog output
and pump for electrode application system,
incl. Windows NT 4.0, language: optional
202 306 43
System cart, 230-V version, with analog
output, incl. Windows NT 4.0, language:
optional
CardioSys V 4.1
245
Equipment
Optional PC components
Optional software programs
701 180 72
Network board
455 023 01
Resting ECG measurement
701 249 16
Controller for MO or streamer drive
455 024 01
Resting ECG interpretation
384 018 07
640 MB MO drive
455 039 01
Review Manager
384 018 75
2.4 GB streamer drive
455 040 01
ECG History
455 025 01
Exercise test SW, 3-lead ECG
455 026 01
Exercise test SW upgrade, 12-lead ECG
455 027 01
Full-disclosure ECG storage, data handling,
data compression
455 029 01
Monitoring of remote stress-test stations
455 030 01
Storage on central file server
455 032 01
Exercise test, expert mode
455 033 01
Exercise test, in-test reports
455 041 01
Cardio mailbox
455 034 01
Task list processing
455 035 01
Late potential analysis
Peripheral devices
701 247 02
Keyboard, English
220 092 07
Function keyboard for exercise tests, English
220 093 07
Function keyboard for exercise tests, English,
with barcode reader
701 181 34
Mouse
701 245 03
Monitor, 15"
701 245 11
Monitor, 17"
701 242 79
Laser printer EPSON EPL 5700
834 005 09
Toner cartridge for EPL 5700
701 249 25
Thermal printer AR 200
226 169 01
Paper for thermal printer AR 200
System cart accessories
384 018 92
Network option PCI (upgrade)
915 418 12
Adapter 9/25 pole, D-SUB interface
384 015 80
Network option BNC (requires system PC
with network board 701 180 66)
915 418 11
Adapter (AT keyboard to PS2)
919 202 47
Mouse pad
701 244 01
Printer cart
384 017 33
246
Network option TP (requires system PC with
network board 701 180 72)
CardioSys V 4.1
227 498 02-A
Equipment
Cables
919 062 00
Power cord, Euro
919 203 37
Power cord, UK
401855-107 Power cord, CH
223 418 06
Patient trunk cable, 10-lead, IEC Multi-Link,
4.5 m
223 418 07
Patient trunk cable, 10-lead, AHA Multi-Link,
4.5 m
384 018 16
Set of 10 leadwires, 4-mm connector, defibprotected, IEC
384 018 17
Set of 10 leadwires, 4-mm connector, defibprotected, AHA
919 201 81
Power cord, USA
919 200 37
Potential equalization cable
223 330 03
Connection cable for M 700
223 366 03
Connection cable for EC 1200
Electrodes
223 362 03
Connection cable for EC 560/ECB 561/
CardioSmart
217 225 03
223 368 01
Connection cable for TM 400 E
Adhesive electrode for babies, 13 mm diameter,
with 4-mm connector, 60-cm lead, to be
attached with adhesive rings 927 224 00
223 380 01
Connection cable for ERGOLINE ERG 900
217 110 03
223 381 01
Connection cable for SUNTECH 4240
Adhesive electrode for children, 22 mm
diameter, 4-mm connector, to be attached with
adhesive rings 217 123 01
223 390 01
Connection cable for T2000 (RS 422)
217 320 01
Adhesive electrode for children, 22 mm
diameter, with press-stud connector, to be
attached with adhesive rings 217 123 01
217 321 01
Adhesive electrode for adults, 35 mm diameter,
with press-stud connector, to be attached with
adhesive rings 217 123 01
303 442 96
Adapter for electrode with press-stud connector
to patient cable with 4-mm connector
504 648 56
Limb-lead electrode for adults (stainless-steel
plate electrode), 31 x 40 mm, with 4-mm
socket
700609-001 Connection cable for T2000 (RS 232)
223 372 01
Connection cable for EK 51, EK 56, EK 512
223 298 04
Network connection cable
223 363 03
Connection cable for bosotron BP monitor
Patient Cables
223 418 01
Patient trunk cable, 10-lead, IEC Multi-Link,
2.2 m
223 418 02
Patient trunk cable, 10-lead, AHA Multi-Link,
2.2 m
227 498 02-A
CardioSys V 4.1
247
Equipment
301 340 00
Button-shaped electrode for adults, 30 mm
diameter, with 4-mm socket
923 096 47
Rubber strap for attachment of electrodes
504 648 56 and 301 340 00
217 194 01
217 196 01
217 144 01
Chest electrode for chest belt, 30 mm diameter,
with 4-mm socket
Chest strap for electrodes 217 194 01 and
301 340 00
Chest suction electrode, 22 mm diameter, small
suction ball, with 4-mm socket
217 144 02
Chest suction electrode, 22 mm diameter, large
suction ball, with 4-mm socket
919 202 32
Clamp electrode for limbs, pkg. of 4 electrodes
(red, yellow, green, black)
9033-015
Suction electrode, small, German silver
9623-003P
Tab electrode SILVER MACTRODE plus,
1000 electrodes
9490-210
Clip adapter for SILVER MACTRODE, 10
adapters
NEHB Accessories
Exercise Test Accessories
223 418 01
Patient trunk cable, 10-lead, IEC Multi-Link,
2.2 m
223 418 02
Patient trunk cable, 10-lead, AHA Multi-Link,
2.2 m
223 418 06
Patient trunk cable, 10-lead, IEC Multi-Link,
4.5 m
223 418 07
Patient trunk cable, 10-lead, AHA Multi-Link,
4.5 m
384 018 08
Set of 10 leadwires, IEC, Multi-Link, for
electrodes with press stud
384 018 09
Set of 10 leadwires, AHA, Multi-Link, for
electrodes with press stud
923 096 72
Exercise test belt
303 441 61
Patient cable hanger for ergometer
919 200 31
Disposable electrodes for adults, 200 electrodes
ECG Accessories, Cava Catheter
223 408 04
Patient trunk cable, 5-lead, for cava catheter
384 017 78
Set of 5 leadwires, IEC, for electrodes with
press stud
223 403 03
Patient trunk cable, 12-lead, NEHB, IEC
384 017 65
Set of 10 leadwires, IEC, with 4-mm connector
Consumables
384 017 66
Set of 2 leadwires, NEHB, IEC, with 4-mm
connector (in addition to 384 017 65)
217 123 01
Adhesive rings, pkg. of 500, for electrodes
217 110 .., 217 320 .. and 217 321 ..
927 224 00
Adhesive rings, pkg. of 500, for electrodes
217 178 ..
248
CardioSys V 4.1
227 498 02-A
Equipment
217 083 18
Electrode cream, 250-ml refill bottle
Spirometry
217 083 14
Electrode cream, 5-liter container
208 019 01
Respiration Flow Sensor LF 501
930 115 82
Dispenser, 30 ml
928 056 62
Support for Respiration Flow Sensor
217 083 06
Electrode gel, pkg. of 10 tubes, 100 ml each
303 440 83
Disposable respiration filters (100 pcs.)
217 083 05
Electrode cream, 10 tubes, 100 ml each
217 307 01
Electrode contact spray, 200-ml bottle
217 307 05
Electrode contact spray, 2-l bottle
217 007 01
Electrode paper, 200 sheets, for electrode
504 648 56
701 217 37
Connection cable TONOPORT IV to PC
(9 pin)
217 148 01
Electrode paper, 200 sheets, for electrode
217 144 01/02
710 217 31
TONOPORT IV recording unit
710 217 32
TONOPORT IVa recording unit
217 043 02
Ambulatory Blood Pressure Measurement
701 217 36
Connection cable TONOPORT IV to PC
(25 pin)
ECG Filing Cards (50 pcs.)
Electrode Application Systems
216 121 01
Electrode Application System KISS 10
(10-lead, without pump)
216 122 01
Electrode Application System KISS 12
(12-lead (NEHB), without pump)
303 443 77
Swivel arm for KISS
384 015 84
Table-top clamp with pole
384 013 30
Wall fixture for swivel arm
303 444 21
Clip adapter for adhesive electrodes
227 498 02-A
CardioSys V 4.1
249
Equipment
For your notes
250
CardioSys V 4.1
227 498 02-A
Appendix
1. Installing the Program On A Stand-Alone PC
Do not install CardioSoft on your PC if you are not familiar
with the Windows NT operating system!
Prerequisite for operation in conjunction with MUSE:
Install the Internet Explorer 4.0 and the Acrobat Reader, if
you want to view test data stored in the MUSE CV database.
*
*
Switch on the PC and the monitor. Exit ALL applications.
*
Select “Start” —> “Settings” —> “Control Panel”.
*
Double-click “Printer”.
*
Select the printer you will use.
*
Select “File” —> “Properties” —> “Scheduling”.
*
Select “Print directly to the printer” and confirm with
“OK”.
Insert the CardioSoft CD in the CR ROM drive.
*
Select “Start” —> “Run”.
*
At the command line, enter
X:\setup
(X = CD ROM drive letter)
We recommend a resolution of 800 x 600 (15" monitor) or
1024 x 768 (17" monitor). For resolutions of 1024 x 768 or
better we recommend to select “large font” in Windows –
Setup – Display.
☞
*
Click “OK”.
*
Select “Next” to confirm the suggested directory (when
reinstalling the program, be sure to select the same
drive).
The file V24.DLL is protected under the provisions of the copyright law. Copyright © 19921996 Langner GmbH. All rights reserved. Permission is granted to use the file V24.DLL only in
combination with the CardioSoft program, and
not in combination with any other program.
Copying and making the file V24.DLL available
to third parties is prohibited.
CardioSoft will now be installed on your computer.
*
Be sure to properly terminate the program before switching
off the PC.
Restart Windows.
We recommend to disable the Windows Print Manager to
speed up printouts.
227 498 02-A
CardioSys V 4.1
251
Appendix
2. Operating the Program in Conjunction with a Medical Reimbursement
Program / Clinical Information System (CIS)
CardioSys/Soft is supplied with a special BDT interface
which allows it to be operated in conjunction with a medical
reimbursement program or clinical information system. Please
contact the supplier of these programs to find out about the
conditions for full compatibility.
When running the program in conjunction with a medical
reimbursement program, the patient data file is handled by
the reimbursement program, whereas the procedure data files
are handled by the Marquette Hellige program (CardioSys/
CardioSoft). In this case patients are selected via the reimbursement program. The patient’s height and weight should
be entered in the reimbursement program, but they can also
be added in CardioSys/CardioSoft.
Having selected the patient, you choose the procedure to be
performed. This takes you automatically to the Marquette
Hellige program, which is handled as described in this
manual.
You can call up previous examinations of the selected patient
and compare them or conduct new procedures, but you
cannot select another patient. To do this, you have to quit the
examination program first. Then you can choose a new
patient in the reimbursement program.
After the procedure and quitting the examination program the
most important procedure results (not the signal traces!) are
transferred to the reimbursement program. Some of the
reimbursement programs automatically suggest a bill.
252
Communication between reimbursement program and
examination program:
–
start of the reimbursement program
–
selection of a patient
–
display of file card
–
selection of a procedure (start of the examination
program)
–
new procedures (ECG, spirogram, etc.)
–
termination of examination program
–
data transfer to reimbursement program.
When the Marquette Hellige program runs in conjunction
with a reimbursement program, the following functions are
disabled:
–
selecting another patient, admitting a new patient
The following patient data are adopted by the reimbursement
program: last name, first name, patient ID, date of birth,
height, weight.
CardioSys V 4.1
227 498 02-A
Appendix
CIS Order List
Contact the supplier of the clinical information system to find
out whether the program fulfills the requirements of the
special Marquette Hellige data interface (BDT interface) and
whether the program is capable of generating the so-called
task list. Also, please contact Marquette Hellige to see whether
the compatibility of the CIS has been determined by
Marquette Hellige . If so, patients from the CIS database can
be added to the task lists for the respective examination
procedure types.
Upon activation of a procedure type, CardioSys/Soft will
then allow you to select one of the patients from the corresponding task list (click on the “Order List” button).
At the end of the examination the clinical information system
will adopt the data of the examination procedure, and the
patient will be removed from the task list.
☞ Marquette Hellige is not in a position to guarantee full compatibility of all medical reimbursement programs/CIS with CardioSys/Soft.
227 498 02-A
CardioSys V 4.1
253
Appendix
3. System Maintenance
The backup procedure described in the text below refers to
the Marquette Hellige program only. The data of external
programs, however, can be backed up in the same way.
3.1 Data Backup with Tape Streamer
We recommend making one backup of the operating system,
and making daily backups of the CardioSys/Soft program and
patient files.
*
Select the backup method (for backups of the operating
system “normal“, for the first backup of CardioSys/Soft
data “normal“, for subsequent backups “differential”.
When making a “differential” backup, select “append“,
for normal backups select “replace”.
*
Click the
Use the Windows backup application and refer to the online
help for instructions.
*
*
button.
Insert the tape.
On the Windows screen, select “Start” —> “Programs”
—> “Administrative Tools (Common)” —> “Backup”.
The backup session begins. After the session, the backup will
be verified.
*
*
Select drive C or drive D.
*
Click the
*
Enter the tape name.
*
Check the “Verify after backup” checkbox.
*
Enter some kind of information, such as “Backup
date ...”.
254
OK
Backup
Click the
OK
button to clear the window.
button.
CardioSys V 4.1
227 498 02-A
Appendix
3.2 Formatting Optical Disks
Restoring Data from a Tape Streamer
*
Insert the tape.
Before saving data to an optical disk, the disk must be
formatted.
*
On the Windows screen, select “Start” —> “Programs”
—> “Administrative Tools (Common)” —> “Backup”.
*
Open the Tapes window (icon in the bottom left-hand
corner of the screen).
*
Select the appropriate tape.
*
Insert the disk.
*
On the Windows screen, select “Start” —> “Programs”
—> “Administrative Tools (Common)” —> “Disk
Administrator”.
The disk administrator displays symbols for the different
drives:
drive 0 = hard drive
drive 1 = optical disk (with free storage capacity)
*
Click the
*
Select the target drive.
*
When restoring the operating system, select “Restore
registry” and “Restore file authorization”. When restor-
*
Click the “Drive 1” box.
ing CardioSys/Soft and patient files, select “Restore file
authorization”.
*
In the “Partition” menu select “Create” and confirm the
max. storage capacity shown with OK.
*
Click the
The field for drive 1 now says “unformatted xxx MB”.
*
After the restore, click the
window.
Restore
OK
button.
button.
OK
button to clear the
*
In the “Partition” menu, select “Make changes now” and
click “OK”.
The field for drive 1 now shows the drive letter, e.g. E.
227 498 02-A
*
Check that the correct drive is selected (drive E in our
example), because the formatting process will clear all
data on the disk.
*
In the “Options” menu, select “Format”.
CardioSys V 4.1
255
Appendix
*
At “File system“, select “NTFS”.
*
Enter a name for the optical disk.
4. The ECG Measurement and
Analysis Programs
Refer to the following publications:
*
*
Click “Start” to initiate the formatting process.
Click “OK” to confirm the message “All data will be
cleared”.
–
ECG Interpretation Program HEART
–
Marquette 12 SL Physician’s Guide
Formatting takes about 5 minutes. A progress bar illustrates
the process.
*
Click “Close” to end the session.
*
Close the Disk Administrator window.
256
CardioSys V 4.1
227 498 02-A
Appendix
5. Direct FAX Transmission of Printer Documents
The documents usually sent to the printer can be directly
routed to another PC or to a fax machine. Required accessories are a modem (recommended model: ELSA Microlink
14.4TQ) and the WINFAX Pro 4.0 fax software.
When installing the fax software from the program disk, you
can configure the fax port as the standard printer. With this
setting, every print command is sent to the fax program.
Enter frequently used fax numbers in the “telephone directory”.
Select the “high” printer resolution, the A4 format and the
landscape orientation. If the same image is transferred
between 2 PC’s more than twice, you must select the portrait
orientation after the second transfer.
If the modem is reserved for communication with the fax,
there is no need for any special programming.
However, if it is also used for transmission of data from the
ECG recorder to the PC, the init string should be modified
accordingly (menu, fax program setup, fax modem):
example for the ELSA modem
Explanations: AT
&F
X3
&C1
&DO
S=3
\Q3
Sending the FAX
*
Display the image to be printed.
*
Initiate the printout.
The program converts the ECG into an image file. Depending on the computer model, this procedure may take several
minutes. The printer status box indicates the page currently
being converted. The fax software is activated automatically
after the conversion.
*
Select the addressee (entries in telephone directory).
*
Select “Send”. The status window and the audible signals
from the modem inform you of the transfer procedure.
After the transmission, the program hangs up automatically.
AT&FX3&C1&D0S0=3\Q3\X0\:D1\ for telephone systems
with extensions
AT&F&C1&D0S0=3\Q3\X0\:D1\ for direct dialling
227 498 02-A
command start
default setting
for telephone systems with extensions
identify connection
ignore DTR status change
fax answers after 3rd ring
RTS-CTS handshake, bidirectional
Warning
CardioSys V 4.1
Only modems complying with the requirements of
IEC 60950 or UL1950 may be connected to the
system. Furthermore, the regulations applicable
in the respective countries must be observed.
The modem must be set up inside the medically
used area, but outside the patient environment.
257
Appendix
6. Connecting Peripheral Devices
Connecting the SunTech 4240 Sphygmomanometer
Connecting the ERGOLINE 900/900L Ergometer
The sphygmomanometer needs to be configured once.
Adjust the following settings at the ergometer:
*
–
EKG model P10
–
baud rate
When the program screen is displayed, select “Change
Test Parameters”.
LAST
You move the cursor with the
confirm entries with
.
and
NEXT
keys. You
The ergometer software must be version V436 or higher, or
version V236 (call in an ERGOLINE specialist to install the
latest version).
YES
*
Confirm your selection with
*
Select “Set BP Reading Interval” and press
confirm the selection.
*
Set PRE, TEST and POST to MAN (using the
key, 1 to 90 minutes, MAN).
YES
4800
.
to
YES
The round plug of the connecting cable is inserted in the
“J10/RS232” connector at the ergometer. The other connector is plugged into CardioSys or the PC.
or
YES
NO
OK
*
Display the program screen again (press
select “Utilities”.
*
Confirm your selection with
*
Select “Select System Interface” and push
*
Select SUNTECH (with
*
Display the program screen again (press
YES
YES
or
twice) and
.
NO
YES
.
).
OK
twice).
The setup is now complete (make a backup copy of the setup
disk). From now on the Marquette Hellige program will start
the sphygmomanometer.
258
CardioSys V 4.1
227 498 02-A
Appendix
7. Application Tips
7.1 Artifact Due to Poor Electrode
Application
This program is equipped with state-of-the-art electronic
utilities to insure artifact-free recording. Among these are the
automatic baseline adjustment and the cubic spline algorithm.
At the beginning of the recording the automatic baseline
adjustment verifies the incoming signal and adjusts the
baseline position accordingly.
Remedy
*
Apply the electrodes according to instructions.
*
Do not apply the electrodes on top of clothing.
*
Use a contact agent (electrode cream, spray, etc.).
*
Wait approx. 10 s before initiating a recording. After the
10-s period the automatic functions are enabled and the
polarization voltages have stabilized, provided that all
electrodes are properly applied.
*
If it becomes necessary to verify the unprocessed “raw”
ECG signal, switch off the Cubic Spline algorithm and
all filters (40 Hz, AC filter) (refer to “Setup” in section
4.1.7).
During recording the cubic spline algorithm continuously
checks the baseline position and returns the baseline to its
normal level if it wanders.
When electrodes are not properly applied these measures may
not fully compensate for artifact. High polarization voltages
induced by electrodes applied without conductive gel may
cause the amplifier to overrange, so that a straight line will be
recorded instead of the ECG. Cubic spline will return this
line to its normal position, and a baseline ensues for approx.
1 second (message Excess DC Offset).
227 498 02-A
CardioSys V 4.1
259
Appendix
7.2 ECGs of Pacemaker Patients
7.3 ECG Recording During
Defibrillation
It is not possible to display pacing pulses directly. At a sweep or
paper speed of 50 mm/s and a pulse duration of just 0.5 ms, the
width of the recorded pacing pulse would be a mere 0.025 mm.
For this reason the device reduces the pulse amplitude and
expands the pulse width, so that the pacing pulse is easier to
identify. The pulse is displayed with the correct polarity and a
width of 5 ms (depending on the polarity of the pacing pulse
in leads I and II, the pacing pulse in lead III may be suppressed). Figure 7-1 shows an ECG recording with pacing
pulses.
The patient signal input is defibrillation-proof. Therefore it is
not necessary to remove the ECG electrodes during defibrillation.
When using stainless steel or silver electrodes, however, the
defibrillator discharge current may cause complete polarization at the electrode/skin interface. This will block acquisition
of the ECG signal for several minutes. This can be avoided by
using silver/silver-chloride electrodes.
If electrodes made of other materials are used, we recommend
disconnecting the patient cable from the recorder while the
shock is applied.
Disable the Cubic Spline algorithm that would cause a signal
delay of 4 seconds, if defibrillation will be carried out during
ECG recording (section 4.2.7 “Exercise-Test Setup”).
Figure 7-1. Display of pacing pulses
☞
260
☞
If several adverse conditions exist at once, the
possibility of pacing pulses being interpreted as
QRS complexes should be considered. At the same
time, however, QRS complexes might be suppressed in certain situations. For safety, always
watch pacemaker patients closely.
CardioSys V 4.1
Use only silver/silver-chloride electrodes for ECG
acquisition to ensure optimal performance during
defibrillation.
227 498 02-A
Appendix
7.4 ST/HR Slope Value
The ST/HR slope was originally developed by Dr. R.J.
Linden at the University of Leeds, United Kingdom in the
late 1970s. It is reported to yield more accurate electrocardiographic determination of the presence and severity of coronary heart disease. While originally applied only to bicycle
ergometry testing, it has recently been adapted for treadmill
exercise by Dr. Paul Kligfield and colleagues at Cornell
University.
The criteria are based on the near parallel increase of myocardial oxygen demand and heart rate with increasing effort.
Essentially, the exercise electrocardiogram is evaluated by
linear regression analysis of the rate-related change in ST
depression as measured at 60 ms post J point. Originally, the
12 classical leads and bipolar lead CM5 were evaluated.
Changes in leads aVR, aVL, and V1 have been found to be
poorly specific and are currently ignored. The addition of lead
CM5 improves sensitivity appreciably.
A plot of ST segment depression versus heart rate is drawn for
all measured leads. Linear regression analysis is used to best fit
a line beginning at peak exercise and extending backward
through at least three points until significance is obtained
(p < 0.05). The points are taken from the ST level and heart
rate at the end of each 2-minute exercise stage. The slope of
this line is then determined and presented in units of
µV/BPM. The steepest slope of all the leads is reported and
graphed.
227 498 02-A
The large increments in heart rate between stages of the Bruce
protocol were found to yield an inadequate number of points
for proper slope evaluation. A modification of the Bruce
protocol (half work loads in 2-minute exercise stages) more
closely approximate the roughly 10 beats per minute increments found in ergometry testing. This protocol, developed at
Cornell University by Okin, et al, is reproduced here and is
strongly recommended for the highest predictive accuracy.
Exercise Stage
(min)
Speed
(mph)
Grade
(%)
2
1.7
0
2
1.7
5
2
1.7
10
2
2.1
11
2
2.5
12
2
3.0
13
2
3.4
14
2
3.8
15
2
4.2
16
2
4.6
17
2
5.0
18
2
5.5
19
Table 1. Cornell Treadmill Protocol for ST/HR Slope
CardioSys V 4.1
261
Appendix
7.5 External Sphygmomanometers
CardioSys supports blood-pressure measurement with the
following sphygmomanometers:
–
SunTech 4240 (BP Meter 1), specially suitable for
treadmill applications
–
bosotron 2 (BP Meter 2), specially suitable for bicycle
applications
The sphygmomanometer is connected to a serial interface.
Select the appropriate port on page 2 of the defaults menu
(section 4.2.7 “Exercise-Test Setup”).
The sphygmomanometer must be ready for use before the
exercise test is activated. If this is not done, the system will
not recognize the BP meter and prompt you to take a manual
blood-pressure measurement.
If the system takes longer than 60 seconds to complete a
measurement, the readings may appear at the next stage or
phase. You can avoid this problem by waiting at least 40 seconds after display of the BP readings before starting the
exercise test.
☞
262
If the systolic pressure is expected to exceed
200 mmHg, increase the deflation rate at the
sphygmomanometer to reduce the measuring time.
The bosotron 2 device aborts measurements after
90 s.
If an external sphygmomanometer is not connected, select the
blood-pressure meter integrated in or connected to the
ergometer from the defaults menu.
CardioSys V 4.1
227 498 02-A
Appendix
EC Declaration of Conformity
227 498 02-A
CardioSys V 4.1
263
Appendix
For your notes
264
CardioSys V 4.1
227 498 02-A
Index
Index
Symbole
3D presentation ................................................................. 71
A
AC line filter frequency .................................................... 220
Accessories ....................................................................... 245
Acitvate program options ................................................. 219
Admitting new patients ...................................................... 32
Ambulatory blood pressure measurement ......................... 175
Arrhythmia episodes ........................................................ 117
Arrhythmia results ............................................................. 64
Assigning records to patients ............................................ 226
B
Backup ............................................................................ 254
Bar code wand ................................................................... 31
Baud rate selection ................................................... 216, 227
Blood pressure
Graphic presentation (Amb. blood pressure) .............. 184
Hourly averages (diagram) .......................................... 185
Blood pressure readings
Entry ............................................................................ 49
Entry during exercise test ..................................... 87, 103
Brief operating instructions
Ambulatory blood pressure......................................... 189
Bronchodilation test ................................................... 173
Exercise test ................................................................ 137
Resting ECG ................................................................ 79
Spirometry ................................................................. 173
STAT ECG ................................................................ 154
Bronchodilation test ........................................................ 169
C
Calibration pulse ........................................ 76, 128, 150, 203
Card reader ................................................................ 32, 220
227 498 02-A
CE marking ......................................................................... 2
Chart-paper loading ........................................................... 17
Cleaning and disinfection
Instrument surface ..................................................... 233
Patient cable and electrodes ........................................ 233
Respiration flow sensor LF 501 .................................. 234
Clinical information system ............................................. 252
Combined report ............................................................... 37
Comments entry
during Exercise tests ..................................................... 89
during Resting ECG .................................................... 51
Comp. Median (button) .................................................. 106
Comparing examinations ................................................... 68
Comparing tests
Spirometry ................................................................. 170
Compression of data ........................................................ 229
Configuration of test protocols
Ambulatory blood pressure......................................... 180
Confirming test results ................................. 35, 67, 118, 168
Connecting peripheral devices ......................................... 258
Consumables ................................................................... 248
Copying procedures to/from storage media ...................... 224
Correlation coefficient ..................................................... 203
Country settings .............................................................. 220
Cubic spline ............................................... 78, 126, 153, 240
Custom setup (save/load) ................................................. 231
Cut-off frequency ............................................................ 203
D
Data backup .................................................................... 254
Data compression ............................................................ 229
CardioSys V 4.1
265
Index
Data export
Ambulatory blood pressure ......................................... 182
Exercise test ................................................................ 110
Late potentials ............................................................ 198
Resting ECG ................................................................ 60
Spirometry ................................................................. 168
Data transfer .................................................................... 218
Date format ..................................................................... 220
Defibrillation ................................................................... 260
Deleting patients ................................................................ 30
Deleting tests ............................................................. 38, 209
Disinfection. See Cleaning and Disinfection
Displaying ECGs ............................................................... 55
Displaying tests .................................................................. 35
E
EC Declaration of Conformity ........................................ 263
ECCS .............................................................................. 171
ECG Interpretation (exercise test) .................................... 118
ECG measurement ............................................................ 57
ECG strips ....................................................................... 116
Editing stored tests ............................................................. 33
Electrode application
Application tips .......................................................... 259
Exercise test .................................................................. 83
Late potentials ............................................................ 192
Resting ECG .......................................................... 43–46
STAT ECG ................................................................ 142
Evaluating the resting ECG ............................................... 54
Evaluation
Ambulatory blood pressure ......................................... 186
Exercise test ....................................................................... 81
Start ............................................................................. 91
with ERGOCOMP EC 560/ECB 561 ......................... 96
with ERGOLINE 900/900L ........................................ 96
with M 700, EC 1200 .................................................. 98
with MEDITRONIC M 40 ......................................... 95
with MEDITRONIC M 400 ....................................... 93
with treadmills ........................................................... 100
Exercise test control screen ............................................... 124
Expert mode (Exercise test) .................................................. 6
External blood pressure meter .......................................... 262
External programs (setup) ................................................ 207
F
Factory settings (retrieval) ................................................ 231
FAX transmission ............................................................. 257
Full disclosure ECG ......................................................... 119
Storage ....................................................................... 126
Function keypad (exercise test) ......................................... 135
Function keys .................................................................... 25
FVC measurement ........................................................... 165
G
General information ............................................................ 4
General safety information ................................................. 10
H
Help window (call up/clear) ............................................... 22
HFLA threshold .............................................................. 203
Highlighting text ............................................................... 22
Hospital/practice name .................................................... 212
I
Icon bar (modification) .................................................... 215
Installing the program ...................................................... 251
Interpretation
Late potentials ............................................................ 199
Resting ECG ................................................................ 66
J
J+X point ......................................................................... 127
K
266
CardioSys V 4.1
227 498 02-A
Index
Keyboard .................................. 23. See alos Function keypad
L
Language selection ............................................................. 26
Late potential analysis ...................................................... 195
Late potential mode ......................................................... 191
Lead check (ECG signal qualiy screen) ............................. 103
Lead check noise level ................................ 76, 126, 150, 203
Lead Off alarm .......................................... 76, 128, 150, 203
Lead sequence (selection, modification)
Exercise test ................................................................ 129
Resting ECG ................................................................ 76
Lead sequence (selection/modification)
STAT ECG ................................................................ 151
Linden, R.J. ............................................................. 113, 261
Linked medians ....................................................... 106, 126
M
Maintenance .................................................................... 235
Malfunctions ................................................................... 238
Measurement and analysis programs ................................ 256
Measurement of the ECG .................................................. 57
Measurements result (tabular form) ................................... 61
Median complexes (dominant/subdominant) ..................... 61
Medians ........................................................................... 106
Medical reimbursement program ..................................... 252
Medication
Ambulatory blood pressure......................................... 182
Exercise test .................................................................. 88
Late potentials ............................................................ 193
Resting ECG ................................................................ 50
Spirometry ................................................................. 160
METS calculation ............................................................ 108
Modem
Setup .......................................................................... 216
227 498 02-A
Transmission .............................................................. 257
Mouse ................................................................................ 20
MUSE
Communication ......................................................... 218
Selecting patients from MUSE database ....................... 31
Sending test data to ...................................................... 38
N
Name (physician, technician, user) .............. 51, 89, 161, 214
NEHB ....................................................................... 46, 145
New patient (admission) .................................................... 32
Normal value calculation (spirometry) ............................. 171
O
Option code (entry) ......................................................... 219
Optional software modules .................................................. 6
Options, activate .............................................................. 219
Order information ........................................................... 245
Order list ......................................................................... 253
P
Pacemaker patients .......................................................... 260
Password (modification) ................................................... 215
Patient cable connection
Exercise test .................................................................. 83
Resting ECG .......................................................... 43–46
STAT ECG ................................................................ 143
Patient data
Edit ........................................................................ 30, 31
Entering ....................................................................... 32
Entering (spirometry) ................................................. 163
Patient deletion .................................................................. 30
Patient retrieval from database ........................................... 30
Patient selection window .................................................... 30
Performance test ................................................................ 15
Peripheral devices (connection) ........................................ 258
CardioSys V 4.1
267
Index
Physician. See Name
Physician and user/technician name (entry) ....................... 51
Printer driver installation ................................................... 18
Printer problems ................................................................ 18
Printing the test report
Ambulatory blood pressure ......................................... 188
Exercise test ................................................................ 121
Late potentials ............................................................ 201
Resting ECG ................................................................ 72
Spirometry ................................................................. 172
STAT ECG ................................................................ 149
Procedure list, view ............................................................ 33
Program end .................................................................... 209
Program start ..................................................................... 24
Q
QRS morphologies (exercise test) ..................................... 115
QTC calculation ........................................................ 76, 151
Quitting the program ...................................................... 209
R
Reanalysis .......................................................................... 62
Reason for test
Ambulatory blood pressure ......................................... 182
Late potentials ............................................................ 193
Reason for test library
Exercise test .................................................................. 86
Late potentials ............................................................ 193
Resting ECG ................................................................ 48
Spirometry ................................................................. 158
Recording from ECG recorder ......................................... 226
Recording problems ......................................................... 259
Registered system users .................................................... 214
Remote exercise test workstations, monitoring of ............. 134
Reports ............................................................ 104, 112, 122
268
Respiration flow sensor LF 501 ................................ 156, 234
Resting ECG mode ............................................................ 41
Resting ECG, signal acquisition ......................................... 52
Retrieving patients ............................................................. 30
Retrieving the factory settings .......................................... 231
Revision history ................................................................... 2
S
Safety information ............................................................. 10
Sample cardiac cycles (exercise test) .................................. 114
Screen diagonal (adjustment) ........................................... 212
Selecting stored tests .......................................................... 34
Self-test .............................................................................. 15
Sending procedures ............................................................ 36
Setup
Ambulatory blood pressure ......................................... 178
Exercise test ................................................................ 125
Late potentials ............................................................ 202
Resting ECG ................................................................ 75
Spirometry ................................................................. 171
STAT ECG ................................................................ 150
Software options .................................................................. 6
Sphygmomanometers ....................................................... 262
Spirometry
General ...................................................................... 155
On-screen demonstration ................................... 164–165
Running a test ............................................................ 164
Spline. See Cubic spline
Square-wave profiles ......................................................... 132
ST profile, medians (exercise test) .................................... 106
ST/HR slope ............................................................ 113, 261
Standard leads .................................................................... 44
Starting the program .......................................................... 24
STAT ECG mode ............................................................ 141
CardioSys V 4.1
227 498 02-A
Index
STAT ECG recording .............................................. 146, 148
Statement library
Exercise test ................................................................ 118
Late potentials ............................................................ 200
Resting ECG ................................................................ 67
Spirometry ................................................................. 159
Statistics summary (Amb. blood pressure) ........................ 186
Stored tests, view .......................................................... 33, 35
System configuration ....................................................... 212
System maintenance ........................................................ 254
System messages ............................................................... 237
System operating routines .................................................. 20
TONOPORT IV/IVa ...................................................... 176
Trace background (color selection) ................................... 212
Transfer of resting ECGs .................................................. 226
Trends ...................................................................... 106, 112
Troubleshooting ............................................................... 237
T
Z
Tabular summary (exercise test) ....................................... 111
Target HR .......................................................................... 87
Technical inspections ....................................................... 235
Technical specifications .................................................... 239
Technician. See Name
Test information
Ambulatory blood pressure......................................... 182
Exercise test .................................................................. 85
Late potentials ............................................................ 193
Resting ECG ................................................................ 47
Spirometry ................................................................. 158
STAT ECG ................................................................ 147
Test patient ...................................................................... 213
Test protocol (selection, modification) ............................... 87
Test results (confirming) .................................................... 35
Test summary
Exercise test ................................................................ 109
Resting ECG ................................................................ 59
Thermal printer ................................................................. 16
Time format .................................................................... 220
Zoom display
Exercise test ................................................................ 120
Resting ECG ................................................................ 56
227 498 02-A
U
Units of measurement ...................................................... 220
User list ........................................................................... 214
V
VC measurement ............................................................. 165
Vector ECG ..................................................................... 196
Voice recorder .................................................................. 221
CardioSys V 4.1
269
Index
For your notes
270
CardioSys V 4.1
227 498 02-A
World Headquarters
GE Marquette Medical Systems
8200 West Tower Avenue
Milwaukee, WI 53223 • USA
Tel. +1 414 355 5000
800.558.5120 (US only)
Fax +1 414 355 3790
Europe Region
Marquette Hellige GmbH
A GE Medical Systems Company
Postfach 60 02 65
D-79032 Freiburg • Germany
Tel. +49 761 45 43 - 0
Fax +49 761 45 43 - 233
Asia Region
26/F, Catic Plaza
8 Causeway Road
Causeway Bay
Hong Kong
Tel. +852 2804 2320
Fax +852 2804 1776