1
MP
piechart
Jens-Uwe Morawski
Preliminary
Version
May 14, 2002
piechartMP
Drawing pie-charts with MetaPost
Jens-Uwe Morawski
The piechartMP package is an easy way to draw pie-charts with METAPOST. The package implements an interface that enables even users
with few METAPOST experience to draw their charts. A highlight of
piechartMP is that the user can hide defined segments from drawing
or making them invisible in order to draw multiple different pie-charts
from one data-set. For example a presentation can be made, whereby
every slide has one more segment visible. The special support for presentations was the chief purpose for the piechartMP development.
Contents
Contents
1 Getting started
2 Basic Commands
2.1 Segment Declaration . . . . . . .
2.1.1 Basic Segment Declaration
2.1.2 Segment States . . . . . . .
2.2 Drawing Chart and Labels . . . .
2.2.1 Drawing the Pie-Chart . .
2.2.2 Drawing the Labels . . . .
4
.
.
.
.
.
.
.
.
.
.
.
.
.
.
.
.
.
.
.
.
.
.
.
.
.
.
.
.
.
.
.
.
.
.
.
.
.
.
.
.
.
.
.
.
.
.
.
.
.
.
.
.
.
.
.
.
.
.
.
.
.
.
.
.
.
.
.
.
.
.
.
.
.
.
.
.
.
.
.
.
.
.
.
.
.
.
.
.
.
.
.
.
.
.
.
.
.
.
.
.
.
.
.
.
.
.
.
.
.
.
.
.
.
.
.
.
.
.
.
.
.
.
.
.
.
.
.
.
.
.
.
.
.
.
.
.
.
.
.
.
.
.
.
.
6
6
6
7
9
9
10
3 piechartMP Setup
3.1 Numbers . . . . . . . . . . . . . . . . . . . .
3.2 Colors . . . . . . . . . . . . . . . . . . . . .
3.3 Text . . . . . . . . . . . . . . . . . . . . . . .
3.3.1 Metapost Typesetting . . . . . . . .
3.3.2 Extended Typesetting Capabilities
3.3.3 piechartMP Text Setup . . . . . . .
3.4 Labels . . . . . . . . . . . . . . . . . . . . . .
3.4.1 Label Setup . . . . . . . . . . . . . .
3.4.2 Label and Text Setup Examples . .
.
.
.
.
.
.
.
.
.
.
.
.
.
.
.
.
.
.
.
.
.
.
.
.
.
.
.
.
.
.
.
.
.
.
.
.
.
.
.
.
.
.
.
.
.
.
.
.
.
.
.
.
.
.
.
.
.
.
.
.
.
.
.
.
.
.
.
.
.
.
.
.
.
.
.
.
.
.
.
.
.
.
.
.
.
.
.
.
.
.
.
.
.
.
.
.
.
.
.
.
.
.
.
.
.
.
.
.
.
.
.
.
.
.
.
.
.
.
.
.
.
.
.
.
.
.
.
.
.
.
.
.
.
.
.
.
.
.
.
.
.
.
.
.
.
.
.
.
.
.
.
.
.
.
.
.
.
.
.
.
.
.
.
.
.
.
.
.
.
.
.
.
.
.
.
.
.
.
.
.
.
.
.
.
.
.
.
.
.
.
.
.
.
.
.
.
.
.
.
.
.
.
.
.
.
.
.
13
13
14
15
15
16
17
18
19
20
4 Fill Patterns
4.1 Defining Patterns . . . . . . . . . . . . . . . . . . . . . . . . . . . . . . . . . . . . . .
4.2 Defining a Private Pattern Method . . . . . . . . . . . . . . . . . . . . . . . . . . .
23
23
24
5 Special Features
5.1 BoundingBox for Presentations . . . . . . . . . . . . . . . . . . . . . . . . . . . . .
5.2 Enhanced Graphics with MetaFun . . . . . . . . . . . . . . . . . . . . . . . . . . .
26
26
28
6 Tips for Presentations
6.1 Presentations with minimum effort . . . . . . . . . . . . . . . . . . . . . . . . . .
6.2 Presentations in different order . . . . . . . . . . . . . . . . . . . . . . . . . . . .
6.3 Presentations not segment by segment . . . . . . . . . . . . . . . . . . . . . . . .
29
29
31
32
7 piechartMP Internals
34
.
.
.
.
.
.
.
.
.
.
.
.
.
.
.
.
.
.
3
.
.
.
.
.
.
1 Getting started
1 Getting started
In order to draw your first pie-chart you have to write an input-file for METAPOST; here
called pcfirst.mp. Then you can start METAPOST; this will convert your input in a METAPOST graphic. In order to pre-view your pie-chart, you have to embed the graphic into a
document, since only in this way labels and other text-elements will show up correctly.
An easy way for the preview is the MPtoPDF converter, see section 5.2.
Let’s start with a simple input file. The colored lines are piechartMP commands, the
others are plain METAPOST.
input piechartmp ;
SetupPercent(this, "%") ;
DefinePattern(1, 1, blue, red, (8mm, 2pt)) ;
Segment(
Segment(
Segment(
Segment(
32.5,
12.8,
22.4,
18.2,
"first"
"second"
"third"
"fourth"
,
1 )
,
auto )
, (0,0.7,0.7) )
,
auto )
;
;
;
;
SegmentState(2, hidden, this) ;
beginfig(1);
PieChart(3cm, 0.1, 65, 0, 0);
Label(0)(percent)(inwards,0) withcolor white;
Label.auto(0)(name)(outwards,0) ;
endfig;
end
Now you can convert this file using METAPOST. The program-name mpost can be different at some systems, e.g. mp or metapost.
mpost pcfirst
The result is a METAPOST-graphic in the file pcfirst.1. Depending on the TEX macro
package you are using, the graphic can now be embedded in your document. In a LATEX
document using the graphicx package it is simply:
\includegraphics{pcfirst.1}
When you use pdfLATEX the file-extension .1 is not known to the graphicx package.
\DeclareGraphicsRule{*}{mps}{*}{}
in the preamble of your LATEX document declares all unknown extension to be METAPOST
graphics.
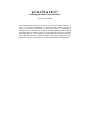
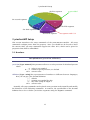
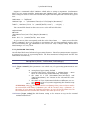
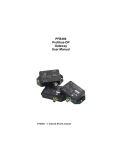
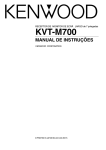
You should get the graphic shown in figure 1. If you try it yourself you will find different
fonts in your chart compared to this chart , since here the fonts of this document are used.
How you can change fonts and font attributes will be discussed in an extra section.
As you can see the input file loads first the piechartMP module using input. Thereupon follows code one would call setup section. Here you can modify defaults with
Setup... commands or define fill-patterns with DefinePattern.
Next the segments are declared. The segments are numbered according to the order
of their declaration. In the example four segments have been declared. The following
4
1 Getting started
first
44%
31%
25%
third
fourth
Figure 1: The first pie-chart
SegmentState(2, ...) modifies the state of the 2nd segment, making it hidden. This
means that the segment will be ignored when you draw the chart or labels.
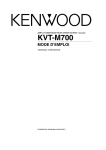
Between beginfig and endfig the drawing and labeling commands follow. Every
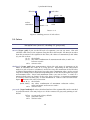
beginfig-endfig group creates one graphic. This can be used in order to create multiple graphics sharing the same segment data.
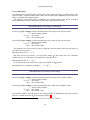
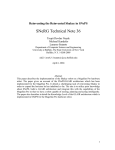
If you extend the initial example with another graphics-group, this will give two METAPOST graphics pcfirst.1 and pcfirst.2. The graphics can be seen in figure 2.
input piechartmp;
SetupPercent(this, "%");
DefinePattern(1, 1, blue, red, (8mm, 2pt)) ;
Segment(
Segment(
Segment(
Segment(
32.5,
12.8,
22.4,
18.2,
"first"
"second"
"third"
"fourth"
,
1 )
,
auto )
, (0,0.7,0.7) )
,
auto )
;
;
;
;
SegmentState(2, hidden, this) ;
beginfig(1);
PieChart(3cm, 0.1, 65, 0, 0);
Label(0)(percent)(inwards,0) withcolor white;
Label.auto(0)(name)(outwards,0) ;
endfig;
SegmentState(2, normal, this) ;
SegmentState(4, invisible, this) ;
beginfig(2);
PieChart(3cm, 0.1, 65, 0, 0);
Label(0)(name)(inwards,0) withcolor white;
endfig;
end
In the following sections all piechartMP commands will be introduced. The examples
sometimes include commands which still are unknown to you. Please refer to following
sections when necessary.
5
2 Basic Commands
first
44%
first
second
31%
25%
third
third
fourth
Figure 2: Two charts in one input file
2 Basic Commands
2.1 Segment Declaration
2.1.1 Basic Segment Declaration
Segments are defined with the command Segment. Every segment gets an identifier which
can be used to modify specific properties of a segment. The identifier is a number according to the order of the segment declarations starting with 1.
Segment(Value,FillStyle,Name,AltValue)
Value [Type: numeric] this parameter specifies the value-data of the segment. Together
with the values of the other segments it specifies the size of the segments in the
chart.
METAPOST has limited numeric capabilities, that means that METAPOST can handle
only numbers upto about 32 600. This is the reason why the sum of all Values must
not exceed this maximum value. Since only the relation of the Values is important
in order to calculate the size of a segment, the absolut values can be divided by 10,
100, 1000, . . . to keep the sum below the maximum.
But in some cases this might not be useful, since it leads to wrong displayed values in
the label command. Then you have the possibility to give one value in the parameter
Value which is used to calculate the segment size and specify the display value as
string in the AltValue parameter of the Segment command.
Segment(30.255, "large value", auto, "30225000")
Name [Type: string] the name of the segment can be specified here. It is employed in
the name-label command. The command SetupName (see section 3.4) can be used in
order to extend this text-string.
""
"?????"
an empty string
any string describing the name. It can include TEX commands when labelling commands are used in TEX text
mode, see section 3.3.3
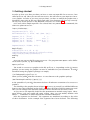
FillStyle [Type: numeric, color] the fill-style of the segment is specified with this parameter. It can either be a numeric value if a pattern-fill shall be used, a color for a solid
color-fill or the value auto, which lets piechartMP calculate the segment color.
6
2 Basic Commands
Figure 3: Automatic color specification
1...X
red, blue...
(R,G,B)
auto
the numeric ID of an already defined pattern, see 4.1
one of the default METAPOST colors
a color specification in the Red-Green-Blue color space
depending on the position of the segment in the chart
piechartMP calculates the color, see figure 3. The appearance can be modified with SetupColors, see section
3.2
AltValue [Type: string] an alternate Value that is used when the segment-value is displayed in label-commands.
Compared to other piechartMP commands the Segment command has not a fixed
number of parameters. At least the Value has to be specified. All other parameters can
be omitted if the parameter is the most right in the parameter order. An omitted AltValue
parameter is substituted by the Value converted in a text string. An ommited FillStyle is
substituted by auto and if the Name is ommited too, then the segment name is a string
including the segment number.
If one of the following declarations is the third Segment command, then all declarations
are equivalent:
Segment(32.5,
Segment(32.5,
Segment(32.5,
Segment(32.5)
"3", auto, "32.5") ;
"3", auto) ;
"3") ;
;
But even it means that when the parameter AltValue has to be specified, then the parameters Name and FillStyle cannot be omitted; or if you want specify the FillStyle then
the Name has to be given too.
2.1.2 Segment States
Chart segments can have three different states. The main purpose is to support different
appearances of one set of segment data in one input file. This can be used in order to build
a chart segment by segment in a presentation or emphasize one segment via displacement
in one but not in the following chart.
7
2 Basic Commands
SegmentState(SegmentID,State,Offset)
SegmentID [Type: numeric] this parameter is the identifier of the segment you want
change the state. As you already know the identifier depends on the declaration
order, thus for example you have to give here the value 2 to change the state of the
segment declared as second.
State [Type: numeric] one of the three supported states
normal
invisible
hidden
this
segment is visible
segment is not visible, but space is inserted instead when
PieChart draws the chart
segment will be ignored
if you want change the Offset but not State
Offset [Type: numeric] this parameter specifies the radial displacement of a segment.
The displacement depends in this parameter and the radius of the chart. A value of
0 means no displacement and a value of 1 means that the segment is shifted radial
the full radius of the chart.
0 no displacement
1 full radial displacement
X any other displacement factor
this if you want change the State but not Offset
The value of Offset will be added to the global offset, specified in PieChart, thus
you can use a global offset and using a negative segment Offset you can reset the
displacement for a segment.
input piechartmp ;
SetupColors( (0.7,0.7), this, this) ;
Segment( 52.234,
Segment( 8.5 ,
Segment(101.111,
Segment( 20.222,
"first" ,
"second",
"third" ,
"fourth",
auto,
auto,
auto,
auto,
"52234") ;
"8500") ;
"101111") ;
"approx. 20000") ;
SegmentState(2, invisible, this) ;
SegmentState(4, this, 0.3) ;
beginfig(1);
PieChart(4cm, 0.15, 60, 0, 0) ;
Label.auto(0)(value)(outwards,0) ;
endfig;
end
8
2 Basic Commands
52234
approx. 20000
101111
2.2 Drawing Chart and Labels
The commands which create real output are only two. The first mentioned PieChart has
to be the first drawing command in a beginfig-endfig-group, since it performs some
important setup and calculations for the following label commands.
2.2.1 Drawing the Pie-Chart
PieChart(Radius,Height,Observation,Rotation,Offset)
Radius [Type: numeric] That parameter specifies the radius of the pie-chart.
2cm
X
draws a pie-chart with radius 2 cm
any other valid METAPOST numeric expression
Height [Type: numeric] The height or thickness of the pie-chart can be specified with this
parameter. In contrast to Radius the parameter Height does not specify the height
directly but moreover the height is the result of the multiplication of Radius and
Height.
Observation [Type: numeric] The observation angle in degrees can be specified using
this parameter.
0
1...89
minimum value; since the observation on the pie-chart is
from above, this results in a simple 2D-chart
draws the pie-chart in 3D-parallel-projection; 89 is maximum value
Rotation [Type: numeric] The angle of rotation around the center of the pie-chart.
0...359
any numeric value in that range
Offset [Type: numeric] The third parameter of the command SegmentState specifies the
radial displacement for a single segment. Using Offset in the PieChart command an
offset is applied for all segments.
0
1
X
no displacement
full radial displacement
any other displacement factor
9
2 Basic Commands
PieChart(2cm, 0, 0, 0, 0)
PieChart(3cm, 0.4, 70, 0, 0)
PieChart(3cm, 0.1, 30, 120, 0)
PieChart(2cm, 0.3, 60, 220, 0.2)
2.2.2 Drawing the Labels
Label(Segments)(Data)(SegmentPoint,Shift)
Segments [Type: suffix] That parameter specifies for which segments a label should be
created. It can either be a comma-seperated list of segment numbers or the value 0
for all visible segments.
2
1,2,5,7
0
a single segment
a list of segments
all visible segments
Data [Type: string, predefined] Using that parameter you can specify what data the label
should contain.
value uses the segment-values
percent uses the calculated percent-values
name uses the segment-names
"a label" typesets the string a label
"..." any other text-string
You can use a comma-seperated list of above values. The data will then be concatenated to one label string. For example:
Label(0)( name , "; \textbf{" , percent , "\,\%}" )(outwards,0)
10
2 Basic Commands
will result for a segment with name first and a percent-value of 22.5 to the string
first; \textbf{22.5\,\%}
before the whole string will be typeset. For this special example you have to switch
in LATEX text mode, see section 3.3.3.
SegmentPoint [Type: pair] Specifies the location of the label in a segment-specific system
of co-ordinates. The x-co-ordinate is along the radius of the segment, whereby 0
specifies the center and 1 is at the out-side. You can give values greater than 1. The
y-co-ordinate is along the angle the segment is spawning in the chart. 0 is at begin
and 1 is at the end of the segment. For the y-co-ordinate only values in range 0 upto
1 are allowed. Figure 4 illustrates the co-ordinate system.
(X,Y)
inwards
outwards
any valid co-ordinate
predefined; equal to (0.7,0.5)
predefined; equal to (1.1,0.5)
Y 1
0.75
0.5
0.25
0
0.25
0.5
0.75
1
1.25
X
1.5
Figure 4: The segment-specific system of co-ordinates
Shift [Type: pair, numeric] If you give here a pair, that means a specification like (x,y),
the label will not be drawn at the position specified in SegmentPoint, but moreover
at the position of SegmentPoint shifted by the amount of Shift. Additionally a line
is drawn between the SegmentPoint and the shifted SegmentPoint. The line uses the
definition of defaultpen, thus you can change the linethickness using:
pickup pencircle scaled 2pt
in order to set the thickness to 2 pt.
0
(0,0)
(0,-1cm)
(-5mm,1cm)
(x,y)
this value disables the shifting and the line
this results in no shift, but it draws a line of length 0
shifts the position 1 cm down
shifts the position 1 cm up and 5 mm left
any other valid METAPOST pair
That feature is mainly implemented in order to label small segments, which give not
enough space for labels.
11
2 Basic Commands
If you use the Label command the way as mentioned before all labels will be drawn
centered at the point. In order to align the label an extended definition has to be used.
Label.Alignment(Segments)(Data)(SegmentPoint,Shift)
Alignment specifies the alignment of the label. You can use the well known METAPOST
alignments top, bot, lft, rt, llft, lrt, ulft and urt or the alignment auto, which
enables piechartMP to calculate a placement according to the specific situation.
top, bot, ...
auto
one of the default METAPOST alignments, see figure 5
some magic
ulft
lft
llft
top
•
bot
urt
rt
lrt
Figure 5: Default METAPOST alignments
input piechartmp ;
SetupColors((.7, .7),this, this) ;
SetupName("the ", " segment") ;
SetupPercent( this, " %") ;
Segment(
Segment(
Segment(
Segment(
Segment(
50,
30,
10,
20,
20,
"first" )
"second")
"third" )
"fourth")
"fifth" )
;
;
;
;
;
SegmentState(4, this, 0.3) ;
beginfig(1);
PieChart(4cm, 0.15, 60, 0, 0) ;
Label.auto(0)(name)(outwards,0) ;
Label(3,4,5)(value)(inwards,0) withcolor white;
Label(1,2)(percent)(inwards,0) withcolor (1,1,0);
Label.lrt(4)("a segment with ",percent)( (0.9,0.8), (2cm,-1cm) )
withcolor 0.8red ;
pickup pencircle scaled 2pt ;
Label.auto(1)("a green label")( (0.9,0.1), (2cm,1.5cm) )
withcolor 0.8green ;
endfig;
end
12
3 piechartMP Setup
the first segment
a green label
38 %
the second segment
23 %
20
10
the fifth segment
20
the third segment
the fourth segment
a segment with 15 %
3 piechartMP Setup
This section introduces the setup commands of the piechartMP-module. All setup
commands configure more than one property. Since you should not be forced to know
the current value, all setup commands support the value this, which can be given for
properties that shall be unmodified.
3.1 Numbers
SetupNumbers(precision,delimiter)
precision [Type: numeric] this parameter allows to set the precision of calculated percent
values
-1 value is not rounded
0...3 rounds at given precision; 0 is default
this current value
delimiter [Type: string] the representation of numbers is different between languages;
here you can give your decimal delimiter
"."
","
"?"
this
default
german users might like this
any other string of length 1
current value
Normally, all setup commands can be placed at any position in the input file and modify
the behaviour of the following commands. In contrast, the specification of the decimal
delimiter has to be set before you declare segments using the Segment command.
13
3 piechartMP Setup
side color
fill color
maxV= 0.4
0
0
reduce
saturation
reduce
value
1
maxS= 0.6
factor= 0.4
1
Figure 6: Shading process of side-colors
3.2 Colors
SetupColors(auto-SV,shading-SV,grayscale)
auto-SV [Type: pair] if you set the fill style of segments, you can say auto. This will
calculate a fill color for the segment using the HSV color model. The Hue (H) is taken
from the position of the segment in the chart, the values of saturation (S) and value
(V) you can set here.
(1,1) the default
(S,V) any other combination of saturation and value; S and V are
between 0 and 1
this current value
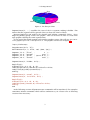
shading-SV [Type: pair] when piechartMP draws the side areas of segments in 3D
mode, it calculates the colors in a 2-step process. Depending on the observation
angle at a side a factor is calculated. In the first step the saturation of the fill color
is reduced depending on the factor, but only upto a maximum value. In the second
step the resulting color is darkened depending also on the factor but again only upto
an maximum value. These both maximum values you can set here. A value of 0
means in both cases no change of the color, that is useless. A saturation maximum
of 1 allows colors become gray. A value maximum of 1 allows colors become black.
Figure 6 illustrates the color conversion.
(0.4,0.3)
(maxS,maxV)
this
the default
any other combination of maximum reduction values;
maxS and maxV are between 0 and 1
current value
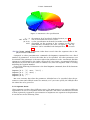
grayscale [Type: boolean] all colors calculated and used for segment-fills can be switched
in grayscale mode. This may help to see if the contrast for grayscale printing is sufficient.
false no grayscale colors; default
true grayscale colors
this current value
14
3 piechartMP Setup
default
SetupColors((.4,.6), this, this)
SetupColors(this, (.6,.7), this)
SetupColors(this, this, true)
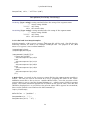
Figure 7: Examples of different color settings
In figure 7 you can see some examples outgoing from the segment definitions in the
introduction. Here all segments are in normal state.
3.3 Text
3.3.1 Metapost Typesetting
Before the text setup is discussed some words about METAPOST typesetting capabilities
are needed. METAPOST knows two ways of typesetting text; both shall be illustrated on
the METAPOST command label.
label ("this is the text", origin) ;
That command writes this is the text at a position in the graphic, here it is the origin
(0,0). This way has the disadvantage that you cannot modify text attributes of the text.
You can only modify the font of the whole text and its size. Therefore you must set the
METAPOST variables defaultfont and defaultscale. For example:
defaultfont:="ptmr8r" ; defaultscale:=1.2 ;
label ("this is the text", origin) ;
typesets the text in Times-Roman at 1.2 of the default size. Since the default size is in
most cases 10 pt it will be 12 pt. The font name ptmr8r is the name of the Times-Roman
tfm-file. Here the filename according to the Karl Berry naming-scheme was used.
As you will see, this way has some advantages. It is fast and the text string can be
concatenated from multiple strings, which is required for piechartMP.
The second way uses TEX in an external process, thus you can use TEX-commands inside
the text.
label (btex this is $\sin{x}$ etex, origin) ;
15
3 piechartMP Setup
The main disadvantage is that it is impossible to expand a variable between btex ...
etex, that means strings can not be concatenated.
One advantage is the enhanced typesetting capabilities, an other useful property is to
send TEX configurations to the external process.
verbatimtex
\documentclass{article}
\begin{document}
etex
label ( btex this is \textbf{bold} text etex , origin) ;
sends a LATEX header to the TEX process. If you now configure METAPOST to use LATEX
instead of TEX you can use LATEX commands.
In general to setup METAPOST for LATEX an environment variable with name TEX must be
set to latex. On a system with Bash shell this would be:
export TEX=latex
Some METAPOST version or TEX-systems support the definition of the TEX-format in the
input file.
verbatimtex
%&latex
\documentclass{article}
\begin{document}
etex
label ( btex this is \textbf{bold} text etex , origin) ;
This will use LATEX without the need to set the environment variable. Not all systems
support this, but it should work on the systems1 teTEX, fpTEX, MikTEX, OzTEX and CMacTEX.
Systems not supporting this feature are emTEX, DECUS-TEX and VTEX. The last mentioned
VTEX has no METAPOST included, thus you have to take METAPOST from another system.
The specification of the TEX-format shall be called TeXFormat and the following settings
in the verbatimtex...etex block shall be called TeXSettings.
3.3.2 Extended Typesetting Capabilities
piechartMP requires that text-strings can be concatenated from multiple strings. This
is no problem with the in the previous section first mentioned string-based typesetting.
But there is still a problem with TEX-based typesetting, since everything between btex
etex is typeset directly and a string-variable containing a concataneted string can not be
expanded.
The only solution is to write an external file including a verbatimtex...etex block
and the btex etex typesetting commands, since in this step everything is only a string
for METAPOST. This file can be input again and results in the typeset text. Since every
METAPOST input file has its own verbatimtex...etex block, the block of your input-file
can not be used, and you have to give your settings piechartMP, thereby piechartMP
can write your settings in the external file.
1 Thanks
to Martin Buchmann, Jürgen Göbel, Rolf Niepraschk, Henning Hraban Ramm and Walter Schmidt, who
made up that list.
16
3 piechartMP Setup
Suppose a command called TeXText which takes a string as argument. Furthermore
there are two string variables TeXFormat and TeXSettings. The command takes these
three strings in order to write an external file, inputs the file again and returns the typeset
text.
TeXFormat := "%&latex"
TeXSettings := "\documentclass{article}\begin{document}"
label ( TeXText("this is \textbf{bold} text") , origin) ;
The external file based on this METAPOST code will look like this:
verbatimtex
%&latex
\documentclass{article}\begin{document}
etex
btex this is \textbf{bold} text etex
As you can see this corresponds with the code where btex ... etex are used in the
label command. Now it is possible to concatenate the text from multiple strings, since
the text including the TEX commands is for METAPOST only a simple string. But it has a
disadvantage: it is very slow!
3.3.3 piechartMP Text Setup
Not all chart labels need advanced typesetting features. Therefore piechartMP supports
in general two ways of typesetting labels: the first mentioned string-based and the last
mentioned external way.
SetupText(Mode,TeXFormat,TeXSettings)
Mode [Type: numeric] this parameter sets which way of typesetting piechartMP utilizes
0 string based typesetting; default
1 external TEX based typesetting; a verbatimtex...etex
block is written using TeXFormat and TeXSettings
2 the same as 1 but \documentclass{minimal} and
\begin{document} are written in the external file automatically
3 the same as 2 but TeXFormat defaults to %&latex; see section 3.3.1 for a list of systems supporting this format setup
this the current value
ATTENTION: using TEX based text modes can damage data, since in these modes
an external file with name <jobname>.pct will be created. Here <jobname> is
the name of your input file without extension. In case of the file name used in
the introduction the external file will have the name pcfirst.pct.
TeXFormat [Type: string] the TEX format string to be written on top in the external
verbatimtex block.
17
3 piechartMP Setup
""
"%&latex"
"?????"
this
empty string; default
some systems support this
any other string, depending on your system
the current value
TeXSettings [Type: string] a string including TEX commands which will be written after
the TEX format in the external file.
""
"?????"
this
empty string; default
any string including TEX and LATEXpreamble commands
the current value
If you set the text mode to 0 the string based typesetting is active. That means you
cannot use TEX commands in the strings. You have only the posibility to change the font
and its size using the METAPOST variables defaultfont and defaultscale.
Text mode 1 is the most general setting. Here you have the full control and you can do
anything required for your system.
Text mode 2 gives you control over the TEX format as mode 1, but it saves you from
the LATEX specification, since it loads a minimal LATEX setup. This does not mean that the
parameter TeXSettings is useless, since the content of this parameter is written between
\documentclass and \begin{document}.
Suppose the setup:
SetupText(2, "%&latex", "\usepackage[latin1]{inputenc}")
The verbatimtex block written based on these settings will be:
verbatimtex
%&latex
\documentclass{minimal}
\usepackage[latin1]{inputenc}
\begin{document}
etex
If you need more packages or in general a long setup it makes no sence to give all in the
parameter TeXSettings. It is easier to write everything in an extra TEX file and input them.
If you need for example Latin-1 input encoding, the labels shall be written in Times and
you need some symbols from Martin Vogel’s symbol font, you can write this TEX file named
pcset.tex:
\usepackage[latin1]{inputenc}
\usepackage{times}
\usepackage{marvosym}
and use the following piechartMP text setup:
SetupText(2, "%&latex", "\input{pcset}")
The following descriptions of the label setup commands correspond to the text setup,
therefore examples can be found in section 3.4.2
3.4 Labels
18
3 piechartMP Setup
3.4.1 Label Setup
The piechartMP module knows three label types: segment names, segment values and
percent values. Segment names and values are declared using Segment and the percent
value is calculated by piechartMP.
The purpose of the label setup commands is to specify strings that will be attached
before and after the data string prior to the whole string will be typeset.
SetupPercent(PreString,PostString)
PreString [Type: string] a string attached before the string of the percent value
""
"?????"
this
empty string; default
any string
the current value
PostString [Type: string] a string attached after the string of the percent value
""
"?????"
this
empty string; default
any string
the current value
For example you can use this in order to append a percent unit to the percent value. In
text mode 0 the setup is:
SetupPercent(this, " %")
But take care of text modes. In text modes using TEX this setup uses the comment
symbol. In case of a TEX based text mode the setup has to be:
SetupPercent(this, " \%")
or if want the percent value to be typeset bold-italic in LATEX mode:
SetupPercent("\textbf{\itshape ", "\,\%}")
SetupValue(PreString,PostString)
PreString [Type: string] a string attached before the string of the segment value
""
"?????"
this
empty string; default
any string
the current value
PostString [Type: string] a string attached after the string of the segment value
""
"?????"
this
empty string; default
any string
the current value
An example could be that the unit of the segment values is million Euro and you want the
currency symbol from the LATEX marvosym package 2 .
2 take
care that the package is loaded via TeXSettings of the SetupText command
19
3 piechartMP Setup
SetupValue( this, " million \EUR")
SetupName(PreString,PostString)
PreString [Type: string]
""
"?????"
this
a string attached before the string of the segment name
empty string; default
any string
the current value
PostString [Type: string]
""
"?????"
this
a string attached after the string of the segment name
empty string; default
any string
the current value
3.4.2 Label and Text Setup Examples
In both examples a TEX or more concrete LATEX input file will be used. This file has the
following contents, its name is for example timessym.tex. The purpose of the \Ord
macro is to typeset correct ordinal numbers.
\usepackage{times}
\usepackage{marvosym}
\newcommand*{\Ord}[1]{%
\ifcase #1\relax%
#1\textsuperscript{th}%
\or%
#1\textsuperscript{st}%
\or%
#1\textsuperscript{nd}%
\or%
#1\textsuperscript{rd}%
\else%
#1\textsuperscript{th}%
\fi}
A Basic Chart As usual, in the METAPOST input file first the piechartMP module is
loaded. The font for text in text mode 0 is set by assigning the name of the TimesBoldItalic metric-file to the METAPOST variable defaultfont. Next the precision of the
percent values is set to 1 and the decimal delimiter to ,, which is more useful for german
people. The fourth statement appends the % symbol on the percent value, since the unit
should be displayed too. As you will see the percent values will be typeset in text mode 0,
thus a real % symbol is used and not the TEX command \%.
input piechartmp;
defaultfont := "ptmbi8r" ;
SetupNumbers(1, ",") ;
SetupPercent(this, " %") ;
20
3 piechartMP Setup
Next four segments are declared. The segment names are not specified, thus they default to the segment number.
Segment(32.5)
Segment(12.8)
Segment(22.4)
Segment(18.2)
;
;
;
;
Starting the first figure, the first task is always to draw the pie-chart with PieChart.
Since the text mode is still 0, that means string based typesetting, the percent values
(Label(..)(percent)(...)) will be typeset in the font declared by defaultfont.
beginfig(1);
PieChart(4cm, 0.1, 65, 0, 0);
Label(0)(percent)(inwards,0) ;
Now the LATEX text mode becomes active. You see, the Setup... commands can be
placed anywhere, and modify the behaviour starting from this moment. The command
SetupName declares the string to be attached to the segment name, thus prior to typesetting the name string for example of the first segment is: the \Ord{1} segment. In
SetupName the \Ord command from the LATEX file is used, thus the name labels have to be
typeset in LATEX mode.
SetupText (3, this, "\input{timessym}") ;
SetupName ("the \Ord{", "} segment")
Label.auto(0)(name)(outwards,0) ;
endfig;
The command Label(0)(name)(...) draws the name labels for all segments. The
result is the following figure.
the 1st segment
37,8 %
nd
the 2 segment
14,9 %
21,2 %
26,1 %
the 4th segment
rd
the 3 segment
The second figure starts as usual. Since the LATEX text mode is still active all typesetting
will be done in this mode. In the chart the segment values shall be printed. Suppose
these values are in unit million Euro, the SetupValue command declares the unit to be
attached to the value string. Furthermore LATEX font commands modify the appearance
of the text, in order to make them bold-italic. Since the Times font is used here too
(\usepackage{times} in the LATEX file), the font of the value labels is the same as of
the percent labels in the previous graphic.
beginfig(2);
PieChart(4cm, 0.1, 65, 0, 0);
SetupValue ( "\textbf{\itshape ", " million} \EUR") ;
Label(0)(value)(inwards,0) ;
Label.auto(0)(name)(outwards,0) ;
endfig;
21
3 piechartMP Setup
the 1st segment
32,5 million ¤
nd
the 2 segment
12,8 million ¤
22,4 million ¤
18,2 million ¤
the 4th segment
rd
the 3 segment
An Advanced Example One thing not mentioned before is that in the TEX commands
only commands can be used which do not need TEX specials. Since, for example, color
is not supported by the TEX DVI-format, this is implemented driver specific using TEX
specials. Here an example shall be given where in the text the color changes, in particular
the ordinal numbers of the previous figure shall be appear in red.
The first part is equal to the previous figure.
beginfig(3);
PieChart(4cm, 0.1, 65, 0, 0);
SetupValue ( "\textbf{\itshape ", " million} \EUR") ;
Label(0)(value)(inwards,0) ;
Next the segment name is setup again. Here the basic segment name is enclosed in
the TEX \phantom command. This command does not typeset the TEX code but inserts
appropriate space, therefore in this step the command Label(..)(name)(...) typeset
the label with the ordinal number replaced by space.
SetupName ("the \phantom{\Ord{", "}} segment") ;
Label.auto(0)(name)(outwards,0) ;
In the second step the name label is setup again, but here the other parts of the declaration are enclosed in the \phantom command, thus only the ordinal number will be printed
out. Using withcolor red, the label is typeset in red.
SetupName ("\phantom{the} \Ord{", "} \phantom{segment}") ;
Label.auto(0)(name)(outwards,0) withcolor red ;
endfig;
end
the 1st segment
32,5 million ¤
the 2nd segment
12,8 million ¤
22,4 million ¤
18,2 million ¤
the 4th segment
rd
the 3 segment
22
4 Fill Patterns
4 Fill Patterns
4.1 Defining Patterns
Segments can be filled in two major modes: solid color or pattern fill. Both modes have
two minor modes: direct-color and auto-color. Direct-color means that the user specifies
the color, auto-color lets piechartMP calculate the colors. Patterns have to be defined
before they can be used in the segment declaration Segment.
DefinePattern(ID,Method,FillColor,PatternColor,Dimen)
ID [Type: numeric] this parameter is the unique identifier of the pattern. The best way is
to number all patterns starting from 1.
1...X
numeric identifier
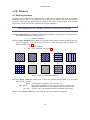
Method [Type: numeric] this parameter specifies which pattern method shall be used to
draw the pattern. You can choose between 10 basic methods and can define one
private method (see 4.2).
0
1...10
private method
basic methods; see figure 8
1
2
3
4
5
6
7
8
9
10
Figure 8: Basic pattern-fill methods
FillColor [Type: color] the color used to draw the pattern background. It is the main
color of the segment.
auto
red, blue...
(R,G,B)
piechartMP calculates the color for you
one of the predefined METAPOST colors; these can be used
multiplied with a factor: 0.4*red in order to get dark-red
a direct color specification in Red-Green-Blue color space
PatternColor [Type: color] the color used to draw the pattern foreground
23
4 Fill Patterns
auto
red, blue...
(R,G,B)
piechartMP calculates the color for you; the method
used here is different compared to the FillColor. In most
situations it should result in a good contrast between foreground and background
one of the predefined METAPOST colors; these can be used
multiplied with a factor: 0.4*red in order to get dark-red
a direct color specification in Red-Green-Blue color space
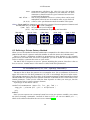
Dimen [Type: pair] the parameter specifies the spacing (S) between pattern elements and
the linewidth (W); see figure 9 for some examples.
(5mm, 2pt) the parameter used in figure 8
(S,W) any other combination of spacing and linewidth
(7mm,4pt)
(1mm,0.2mm)
(8mm,6mm)
(8mm,3mm)
(3mm,1.5mm)
Figure 9: Examples of different Dimen parameters
4.2 Defining a Private Pattern Method
When you set the Method in the DefinePattern command to the value 0, then every time
piechartMP needs a pattern with this number it calls the macro PrivatePattern.
There is already a definition included in piechartMP that defaults to the example
given below, but with some METAPOST experience you can re-define PrivatePattern in
order to employ a pattern that suits to your needs.
The macro has to return a METAPOST picture including the pattern, therefore it has to
be a METAPOST vardef macro. The macro is called with four parameters:
PrivatePattern(ULC,LRC,Spacing,Linewidth)
The macro has to draw the pattern in a rectangular area. The co-ordinates of the area’s
upper left corner are the first parameter ULC, LRC is accordingly the lower right corner.
The Spacing parameter is the first value of the Dimen parameter in DefinePattern which
should define the spacing between pattern elements. Linewidth is the second value of the
Dimen parameter. What you do with this data depends on what you want get, but the
macro always has to return a picture element.
A prototype of the macro can be:
vardef PrivatePattern (expr ulc, lrc, spc, lwd ) =
save pic ; picture pic ; pic := nullpicture ;
...
pic
enddef;
Since you not operate on currentpicture but on an own picture variable, you cannot
use direct drawing commands. Instead of draw or fill you can use addto pic ...,
which is described in detail in the METAPOST manual[Hob].
24
4 Fill Patterns
The following private pattern method draws a fill pattern based on circles. The input file
starts as usual loading piechartMP. Next starts the declaration of the private pattern
method. In contrast to the previous mentioned prototype, here some additional variables
are declared. The variable cntr gets the co-ordinates of the center of the rectangular
drawing-area. The number of circles to draw is saved in c and a path description of the
circle will be saved in k.
input piechartmp;
vardef PrivatePattern (expr ulc, lrc, spc, lwd ) =
save pic, cntr, c, k ;
picture pic ; pic := nullpicture ;
pair cntr ; numeric c ; path k ;
As mentioned before here in the first step the co-ordinates of the center are assigned to
cntr and for c is calculated how many circles are needed to fill the whole area.
cntr := 0.5*( lrc + ulc ) ;
c := ((xpart (ulc - cntr))++(ypart (ulc - cntr))) / spc ;
c := floor c ;
Next a loop starts, wherein first a circular path is declared which has an appropriate
radius depending on spc and the circular path is shifted to the co-ordinates of cntr.
Then the path with an appropriate linewidth (lwd) is added to the picture pic.
for i=1 upto c:
k := fullcircle scaled (i*2*spc) shifted cntr ;
addto pic doublepath k withpen pencircle scaled lwd ;
endfor;
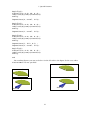
The last step of the macro is returning the picture. The area marked by the both corner
co-ordinates and the content of the picture pic can be seen on the left side in figure 10.
pic
enddef;
Now a pattern method 0 can be used. Here two patterns based on this method are
defined.
DefinePattern(1, 0, blue, red, (5mm, 3mm)) ;
DefinePattern(2, 0, auto, white, (3mm, 1pt)) ;
The following segment declaration uses these patterns in segments 1 and 3. Drawing
the pie-chart results in figure 10. As you can see the pattern picture is clipped and colored
automatically.
Segment(32.5, "", 1) ; Segment(12.8, "", auto ) ;
Segment(22.4, "", 2) ; Segment(18.2, "", red ) ;
beginfig(1);
PieChart(4cm, 0.1, 65, 0, 0);
endfig;
end
25
5 Special Features
Figure 10: A private pattern method
5 Special Features
5.1 BoundingBox for Presentations
When you want use piechartMP for for presentations in order to build charts segment
by segment, you will have the problem that with some segments invisible the graphics
have a different size. This may cause extra work to place the graphics so that they occur
always in the same place on the page. If you declare a numeric variable with the name
PiechartBBox before the piechartMP-module is loaded, then piechartMP adds extra
code to fit all figures in the same bounding box. Since piechartMP does not know the
size of following figures when it draws the first figure it requires two METAPOST runs for a
correct result. In the first METAPOST run a file with name <jobname>.pcb will be written,
which contains the maximum bounding box of all figures. <jobname> is the name of your
METAPOST input file without extension (.mp), thus take care that not an important file
with the same name is in the directory you are running METAPOST. In the second run this
bounding box will be used for all figures.
PiechartBBox := 1 ;
input piechartmp ;
SetupColors((.7, .7),this, this) ;
Segment(
Segment(
Segment(
Segment(
Segment(
50,
30,
10,
20,
20,
"first" ) ;
"second") ;
"third" ) ;
"fourth") ;
"fifth") ;
for i=2 upto 5:
SegmentState(i, invisible, this);
endfor;
beginfig(1);
PieChart(2cm, 0.15, 60, 0, 0) ;
Label.auto(0)(name)(outwards,0);
endfig;
SegmentState(3, normal, this);
26
5 Special Features
beginfig(2);
PieChart(2cm, 0.15, 60, 0, 0) ;
Label.auto(0)(name)(outwards,0);
endfig;
SegmentState(4, normal, this);
beginfig(3);
PieChart(2cm, 0.15, 60, 0, 0) ;
Label.auto(0)(name)(outwards,0);
endfig;
SegmentState(2, normal, this);
beginfig(4);
PieChart(2cm, 0.15, 60, 0, 0) ;
Label.auto(0)(name)(outwards,0);
endfig;
SegmentState(3, this, 0.3) ;
SegmentState(5, normal, this);
beginfig(5);
PieChart(2cm, 0.15, 60, 0, 0) ;
Label.auto(0)(name)(outwards,0);
endfig;
end
The resulting figures you can see below. On the left side is the figure for the case when
PiechartBBox was not specified.
first
first
first
first
third
third
27
5 Special Features
first
third
first
third
fourth
fourth
first
first
second
second
third
third
fourth
fourth
first
first
second
second
fifth
third
fifth
third
fourth
fourth
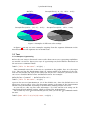
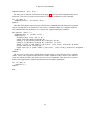
5.2 Enhanced Graphics with MetaFun
If you look on a real round 3D object you will see, that the round outside is not a solid
color. With the help of some other packages piechartMP is able to draw the segment
outsides as gradients, in order to give the chart a more realistic look.
Most recent TEX distributions include pdfTEX and ConTEXt. ConTEXt includes a METAPOST package called MetaFun. That package enables METAPOST, besides many other interesting features, to draw gradients3 . The package should work out of the box, thus no
ConTEXt setup is required, but the gradient-feature only works with pdfTEX.
MetaFun writes some special statements in the METAPOST output. This requires an extension to interpret those specials. The extension is loaded in the ConTEXt macro package
automatically, thus ConTEXt users can embed the figure directly.
The LATEX graphics package does not load that extension. Thus LATEX users have to go a
different way. ConTEXt includes a pdfTEX format called mptopdf . It can be downloaded
from the ConTEXt homepage [Con] as a independent package, called MPtoPDF. That format
can be used stand-alone in order to convert your METAPOST output to PDF. This is even
the best way to preview your METAPOST figures.
Since that pdfTEX format loads the graphics extension resulting PDF-graphics have the
segment’s outside drawn as gradients. Next LATEX users can include that PDF directly using
pdfLATEX or convert the PDF back to EPS for the LATEX-dvips way.
piechartMP automatically detects MetaFun when the package is loaded prior piechartMP.
See figure 11 to compare both ways of drawing segment outsides.
input metafun;
input piechartmp;
3 The
current version 1.0 of the PDF-Reader XPDF lacks support to display those gradients.
28
6 Tips for Presentations
Figure 11: Segment outsides with and without MetaFun
SetupColors(this, (.6,.5) , this) ;
Segment(7) ; Segment(18) ; Segment(2) ; Segment(5) ;
beginfig(1); PieChart(4cm, 0.15, 60, 0, 0) ; endfig;
end
6 Tips for Presentations
6.1 Presentations with minimum effort
The purpose to develop the piechartMP package was to be able drawing pie-charts
segment by segment for presentations. With some METAPOST experience this can be done
very easily.
The commands PieChart and Label draw segments and labels only for visible segments. That means that you can use the command Label(1,2,5)(...)(...) and when
only the segments 1 and 5 are visible no label for segment 2 will be drawn.
On page 12 you can see a complex pie-chart. Creating multiple figures for a step-by-step
presentation needs some work since many code has to be written.
With the explanation above one may have the idea that the beginfig-endfig-block only
has to be copied and occasionally SegmentState makes the next segment visible. But, it
is easier!
PiechartBBox := 1 ;
input piechartmp ;
SetupColors((.7, .7),this, this) ;
SetupName("the ", " segment") ;
SetupPercent( this, " %") ;
Segment(
Segment(
Segment(
Segment(
Segment(
50,
30,
10,
20,
20,
"first" ) ;
"second") ;
"third" ) ;
"fourth") ;
"fifth") ;
29
6 Tips for Presentations
SegmentState(4, this, 0.3) ;
The first part is already well known from page 12 where the label alignment has been
discussed. Next a loop can be used in order to switch all segments in state invisible.
for i=1 upto 5:
SegmentState(i, invisible, this) ;
endfor;
Then the whole figure expression preceded by the command that will change the segmentstate to normal has to be packed in a METAPOST command called, for example, MyChart.
The command has the parameter s to specify the segment and figure number.
def MyChart (expr s) =
SegmentState (s, normal, this) ;
beginfig(s);
PieChart(4cm, 0.15, 60, 0, 0) ;
Label.auto(0)(name)(outwards,0) ;
Label(3,4,5)(value)(inwards,0) withcolor white;
Label(1,2)(percent)(inwards,0) withcolor (1,1,0);
Label.lrt(4)("a red label")((0.9,0.8), (2cm,-1cm)) withcolor 0.8red ;
pickup pencircle scaled 2pt ;
Label.auto(1)("a green label")((0.9,0.1), (2cm,1.5cm)) withcolor 0.8green ;
endfig;
enddef;
The last step is again a loop which ships out five figures, each with one more segment
visible. Since only segments and labels of visible segments will be drawn you can first
create the whole pie-chart and pack it in a METAPOST command. Thus there is no need to
bother with appropriate segment-specification in the Label commands.
for i=1 upto 5:
MyChart(i) ;
endfor;
end
30
6 Tips for Presentations
the first segment
the first segment
a green label
38 %
the second segment
the first segment
23 %
the first segment
a green label
38 %
the second segment
a green label
38 %
a green label
38 %
the second segment
23 %
23 %
10
10
20
the third segment
the third segment
the fourth segment
the first segment
a red label
a green label
38 %
the second segment
23 %
20
10
the fifth segment
20
the third segment
the fourth segment
(The figures are scaled by factor 0.5.)
a red label
6.2 Presentations in different order
The example of the previous section has a disadvantage, since the segments have to be
presented in the order of their declaration. But what is about the order 1, 3, 5, 2, 4?
The first part is already known from the previous example. Thus this example starts
after the first loop. The order of the METAPOST figures has always to be 1, 2, 3. . . , thus
an additional counter for the figures is needed. That counter FigCounter is set to 0 and
used as figure number in the METAPOST command MyChart.
FigCounter := 0 ;
def MyChart (expr s) =
SegmentState (s, normal, this) ;
beginfig(FigCounter);
PieChart(4cm, 0.15, 60, 0, 0) ;
Label.auto(0)(name)(outwards,0) ;
Label(3,4,5)(value)(inwards,0) withcolor white;
Label(1,2)(percent)(inwards,0) withcolor (1,1,0);
Label.lrt(4)("a red label")((0.9,0.8), (2cm,-1cm)) withcolor 0.8red ;
pickup pencircle scaled 2pt ;
Label.auto(1)("a green label")( (0.9,0.1), (2cm,1.5cm)) withcolor 0.8green ;
endfig;
enddef;
In the final loop the FigCounter is incremented with each loop-step. The loop-parameter
i is only used for the segments in order to change their state.
for i=1,3,5,2,4 :
FigCounter := FigCounter + 1 ;
MyChart(i) ;
endfor;
31
6 Tips for Presentations
end
the first segment
the first segment
a green label
38 %
a green label
38 %
10
the third segment
the first segment
the first segment
a green label
38 %
a green label
38 %
the second segment
23 %
20
20
10
10
the fifth segment
the fifth segment
the third segment
the third segment
the first segment
a green label
38 %
the second segment
23 %
20
10
the fifth segment
20
the third segment
the fourth segment
(The figures are scaled by factor 0.5.)
a red label
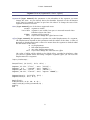
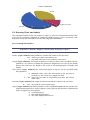
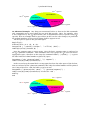
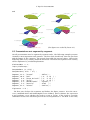
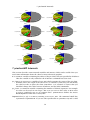
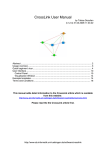
6.3 Presentations not segment by segment
Not all presentations need a segment-by-segment order. The following example presents
Germany’s most important trade partners. The first slide should only show the pie-chart
and the names of the countries. The second chart adds the percent values. Then in the
following slides every country should be discussed. Therefore the segment of the country
will be emphasize by a radial displacement.
PiechartBBox := 1 ;
input piechartmp ;
SetupNumbers (1, this) ;
SetupPercent( this, " %") ;
Segment( 11.1, "France"
,
Segment( 10.6, "USA"
,
Segment( 8.4, "Great Britain",
Segment( 7.4, "Italy"
,
Segment( 6.2, "Netherlands" ,
Segment( 5.1, "Austria"
,
Segment( 51.2, "others"
,
.6blue ) ;
(.4, .5, 0) ) ;
(.7, .7, 0) ) ;
(.6, .4, 0) ) ;
.7green ) ;
.6red
) ;
.5white ) ;
FigCounter := 0 ;
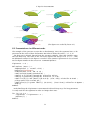
The first part declares the segments and defines the figure counter. Next the METAPOST commands DoIf and ResetSegShift are defined. DoIf evaluates the expression
e and performs a test whether the result is true or false. If the result is true the
command executes the statement given in the second parameter c. The DoIf is not really
32
6 Tips for Presentations
necessary, since a normal if...fi expression can be used too, but it can make the code
more readable. ResetSegShift sets in a loop the displacement of all segments to 0.
def DoIf(text e)(text c) =
if e:
c ;
fi;
enddef;
def ResetSegShift =
for j=1 upto 6:
SegmentState(j, this, 0) ;
endfor;
enddef;
In the command MyChart the DoIf statement is used in order to decide what segment
has to be displaced and to show the percent values starting with the second figure.
def MyChart =
DoIf(FigCounter
DoIf(FigCounter
DoIf(FigCounter
DoIf(FigCounter
DoIf(FigCounter
DoIf(FigCounter
=
=
=
=
=
=
3)(
4)(
5)(
6)(
7)(
8)(
SegmentState(1,
SegmentState(2,
SegmentState(3,
SegmentState(4,
SegmentState(5,
SegmentState(6,
this,
this,
this,
this,
this,
this,
0.3)
0.3)
0.3)
0.3)
0.3)
0.3)
)
)
)
)
)
)
;
;
;
;
;
;
beginfig(FigCounter);
PieChart(4cm, 0.15, 60, 90, 0) ;
Label.auto(0)(name)(outwards,0) ;
DoIf (FigCounter > 1)(Label(0)(percent)((.8,.5),0) withcolor white) ;
endfig;
enddef;
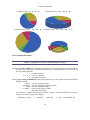
In the final loop the eight figures are drawn. In each loop-step the segment displacements are reset using ResetSegShift.
for i=1 upto 8:
FigCounter := i;
ResetSegShift ;
MyChart ;
endfor;
end
33
7 piechartMP Internals
France
France
11.1 %
USA
USA
10.6 %
51.2 %
8.4 %
others
Great Britain
Great Britain
others
7.4 %
6.2 %
Italy
Italy
Netherlands
Netherlands
Austria
France
Austria
France
11.1 %
USA
USA
10.6 %
11.1 %
10.6 %
51.2 %
8.4 %
Great Britain
6.2 %
Italy
51.2 %
8.4 %
others
7.4 %
Great Britain
others
7.4 %
6.2 %
5.1 %
Italy
Netherlands
Austria
Austria
France
France
11.1 %
USA
10.6 %
51.2 %
8.4 %
Great Britain
5.1 %
Netherlands
11.1 %
USA
5.1 %
6.2 %
Italy
51.2 %
8.4 %
others
7.4 %
10.6 %
others
Great Britain
7.4 %
6.2 %
5.1 %
5.1 %
Italy
Netherlands
Netherlands
Austria
Austria
France
France
11.1 %
USA
11.1 %
USA
10.6 %
10.6 %
51.2 %
8.4 %
51.2 %
8.4 %
Great Britain
Italy
Netherlands
others
7.4 %
others
7.4 %
6.2 %
Great Britain
6.2 %
Italy
5.1 %
Netherlands
Austria
5.1 %
Austria
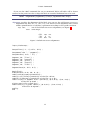
7 piechartMP Internals
This section describes some internal variables and macros which can be useful when you
need some information about the chart for more advanced graphics.
R is a numeric variable containing the radius of the pie-chart, that was specified in PieChart.
Thus the variable is only valid after the PieChart command has been used.
pc_Centre is a METAPOST variable of type pair which contains the centre of the pie-chart.
Normally this is the origin of the METAPOST co-ordinate system, but you can modify
the value in order to place the chart somewhere. It is a matter of course that you
shouldn’t change this value between PieChart and the label commands.
pc_Count is a numeric variable containing the number of defined segments. For example
its value can be used in own loops. But even you can set this value to 0 in order
to start a completely new set of segment data. piechartMP defines the macro
ResetSegments which does exactly this.
SegmentPoint(s,sp) is a macro returning a METAPOST pair. The command Label has
a parameter SegmentPoint. If you use this specification as parameter sp and a valid
34
7 piechartMP Internals
segment number for s in the SegmentPoint command then the returned pair will be
that point in the real METAPOST system of co-ordinates.
SegmentColor(s) is a piechartMP macro returning the color of the segment specified
as s.
For example the following METAPOST loop labels all visible segments in their specific
segment color.
for i=1 upto pc_Count:
Label.auto(i)(name)(outwards,0) withcolor SegmentColor(i) ;
endfor;
35
References
References
[Hob] John D. Hobby; A User’s Manual for METAPOST, Computing Science Technical Report No. 162; AT&T Bell Laboratories, Murray Hill, New Jersey; April 1992
[Con] Hans Hagen; MPtoPDF converter; http://www.pragma-ade.com
36
Index
declaration, 23
private method, 23, 24
pencircle (variable), 11
pickup (command), 11
PieChart (command), 9
PiechartBBox (variable), 26
PrivatePattern (command), 24
addto (command), 24
alignments, 12
bounding box, 26
chart
drawing, 9
co-ordinates
pattern area, 24
predefined, 11
segment, 11
color
automatic, 6, 14
conversion, 14
grayscale, 14
saturation, 14
segment sides, 14
commands
addto, 24
DefinePattern, 23
Label, 10
label, 15
pickup, 11
PieChart, 9
PrivatePattern, 24
Segment, 6
SegmentState, 8
SetupColors, 14
SetupName, 20
SetupNumbers, 13
SetupPercent, 19
SetupText, 17
SetupValue, 19
currentpicture (variable), 24
Segment (command), 6
segment
color, 6
declaration, 6
states, 8
SegmentState (command), 8
setup
color, 14
name, 20
numbers, 13
percent, 19
text, 17
value, 19
SetupColors (command), 14
SetupName (command), 20
SetupNumbers (command), 13
SetupPercent (command), 19
SetupText (command), 17
SetupValue (command), 19
variables
currentpicture, 24
pencircle, 11
PiechartBBox, 26
DefinePattern (command), 23
format
LATEX, 16
mptopdf, 28
Label (command), 10
label, 10
alignment, 12
setup, 17, 19, 20
typesetting, 15
label (command), 15
linethickness, 11
pattern
37
piechartMP - drawing 2D/3D pie-charts
with METAPOST | Jens-Uwe Morawski |
[email protected] | May 14, 2002