1
User Manual
Promis
Version 3
Jan. 2015
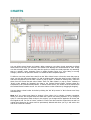
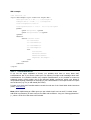
CONTENTS
CONTENTS _____________________________________________________________________________ 2
INTRODUCTION ________________________________________________________________________ 4
FEATURES ______________________________________________________________________________ 4
MINIMUM SYSTEM REQUIREMENTS __________________________________________________________ 4
OPERATION ___________________________________________________________________________ 5
LOCATIONS ____________________________________________________________________________ 6
LOCATION PROPERTIES ___________________________________________________________________ 7
LOCATION MAP _________________________________________________________________________ 8
USERS _________________________________________________________________________________ 9
USER RIGHTS ___________________________________________________________________________ 9
PARAMETERS _________________________________________________________________________ 10
TAGS _________________________________________________________________________________ 11
BASE PROPERTIES ______________________________________________________________________
ADDITIONAL PROPERTIES ________________________________________________________________
COLLECTOR PROPERTIES _________________________________________________________________
CALCULATION PROPERTIES _______________________________________________________________
TAG DATA ____________________________________________________________________________
11
13
14
15
18
RECENT VALUES ______________________________________________________________________ 19
PLAYER ______________________________________________________________________________ 19
CHARTS ______________________________________________________________________________ 21
DEFINING A CHART ______________________________________________________________________
DEFINING CHART QUERIES ________________________________________________________________
VISUAL PROPERTIES______________________________________________________________________
BINDING SERIES TO A QUERY ______________________________________________________________
BINDING SERIES TO A FUNCTION ____________________________________________________________
CHART DISPLAY PARAMETERS ______________________________________________________________
General Chart Options _______________________________________________________________
Axis Properties ______________________________________________________________________
Titles Properties ____________________________________________________________________
22
23
25
26
26
27
27
28
29
REPORTS _____________________________________________________________________________ 30
DEFINING A REPORT _____________________________________________________________________
DEFINING REPORT PARAMETERS ___________________________________________________________
DEFINING REPORT QUERIES _______________________________________________________________
XML DATA ___________________________________________________________________________
XSLT TRANSFORMATION ________________________________________________________________
DEFINING A REPORT SCHEDULE ____________________________________________________________
USE GOOGLEMAPS TO DISPLAY AND TRACK LOCATIONS _________________________________________
31
32
33
34
35
37
39
VISUAL DATA EDITOR_________________________________________________________________ 41
SINGLE POINT MODE ____________________________________________________________________ 42
RANGE OF VALUES MODE _________________________________________________________________ 42
DATA IMPORT WIZARD _______________________________________________________________ 43
DATA IMPORT WIZARD _______________________________________________________________ 43
FILE FORMAT __________________________________________________________________________ 44
Page 2 of 60
COLUMN PROPERTIES ____________________________________________________________________ 45
PREVIEW & IMPORT _____________________________________________________________________ 46
DATABASE ____________________________________________________________________________ 47
MS-ACCESS ___________________________________________________________________________
SQL-SERVER __________________________________________________________________________
Installing SQL-Server Express __________________________________________________________
ORACLE 11G __________________________________________________________________________
Installing Oracle 11g Express ___________________________________________________________
DATABASE BACKUP _____________________________________________________________________
DATABASE STRUCTURE __________________________________________________________________
48
48
48
49
49
50
50
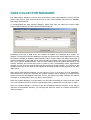
DATA COLLECTOR MANAGER _________________________________________________________ 52
COLLECTOR PROPERTIES _________________________________________________________________ 53
TCP-server connection ________________________________________________________________ 53
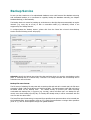
BACKUP SERVICE _____________________________________________________________________ 55
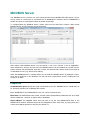
MODBUS SERVER _____________________________________________________________________ 57
PROPERTIES ___________________________________________________________________________ 57
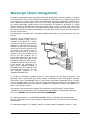
MESSENGER (ALARM MANAGEMENT) _________________________________________________ 59
INTEGRATED WEBSERVER ____________________________________________________________ 60
CUSTOMIZING _________________________________________________________________________ 60
CROSS PLATFORM ______________________________________________________________________ 60
Page 3 of 60
INTRODUCTION
Promis is an application to organize, view and visualize measurement data. You can organize your
data by location in a hierarchical-structured tree. You can define multiple 'tags' per location, which are
used to register measurements on (a/o a tag for registration a room temperature). 'Drag & Drop' can
be used to move 'tags' as well as locations to different positions in the hierarchical structure (of course
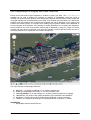
without losing the registered measurement history). Locations, tags, instruments, etc. can be mapped
on a background picture to create control panels/dashboards and/or graphic navigation. Data can be
printed saved and emailed in graphical (*.jpg) , tabular (*.xls) and report (*.html) form. Promis
comes with an integrated ‘Data Collector Manager’ to input measurements from data acquisition
sources.
Features
Define as many tags as required.
Time stamped tag values (measurements), can be collected automatically, entered manually or
being calculated using other tags as input.
Import measurements from flat text files manually (a/o csv files).
'Data Collector Manager' to collect measurements from multiple (remote) DAQ-sources
automatically.
Organize measurements by location in a hierarchical structure
Assign ‘view-only’ users to locations they are permitted to consult
Locations, tags, instruments, etc. can be mapped on a background picture to create control
panels/dashboards and/or graphic navigation.
Supports ‘Drag & Drop’ to move tags, locations, charts and reports
Search for locations based on several criteria (a/o limit exceeding values)
View recent values per location
View summary values per location (min., max., avg., count, quantity and std. dev.)
Playback measurements in time, with double time-axes to compare measurements in time
View measurements in tabular form
View measurements in graphical form
Define your own charts (data queries as well as visual properties)
More than 20 graphical types, like: line, column, bar, Gantt, pie, plane, bubble, arrow, point,
surface, polar, radar and contour
More than 15 graphical functions, like: curve fitting, standard deviation, moving average,
cumulative, and trend
Complete control of titles, legends, labels, axis, colors and other visual properties
Define your own reports (by using templates and/or SQL, XML and XSLT transformation)
Supports printing, exporting and e-mailing charts as JPEG pictures
Supports printing, exporting and e-mailing historical data as Excel compatible sheets.
Supports printing, exporting and e-mailing reports as Html documents.
Free integrated Web-Server to few recent values and simple trending.
Optional extended Web-Server to few historical data, user defined charts and reports.
Optional Report Scheduler to schedule automated report deliveries to SMTP-, FTP-, HTTP-Servers
or Local File Systems.
Minimum System Requirements
Microsoft Windows 2003, XP, preferred: 2008, W7 or W8
Display resolution 1024x768 or higher
Microsoft Internet Explorer 8
Microsoft Internet Explorer 9 to use Canvas graphics
Page 4 of 60
OPERATION
When you open Promis you are asked to login, at first
time with an empty database, you should login with
user name Administrator and a blank password.
The left window shows the hierarchical location structure, while the right window shows information
associated to the selected location. The displayed information at the right depends on the selected
page at the bottom of the Window. There are 7 pages:
1.
2.
3.
4.
5.
6.
7.
‘Tags’, showing the list of tags associated to the selected location
‘Map’, showing a geographical map or control panel/dashboard
‘Recent’, showing the most recent values of the selected location
‘Player’, playing back measurements in time
‘Charts’, showing custom defined charts
‘Reports’, showing custom defined html reports
‘History’, showing measurements of the selected location in tabular form
From the ‘File’-menu the contents of the right window can be printed, saved to file or send by e-mail.
From the ‘Edit’-menu parameters, users, locations, tags and charts can be added, deleted and
modified. From the ‘Control-menu you can pop-up the “Period selector” (to define over which period
you want to consult the measurements) and the “Search” dialog (to search for locations)
Page 5 of 60
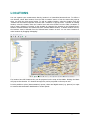
LOCATIONS
You can organize your measurement data by location in a hierarchical-structured tree. To define a
new location, select ‘New location’ from the ‘Edit->Locations’ menu or from the menu that pops-up
when you click the right mouse button. To edit an existing location, select the location from the
‘Location’-list and select ‘Properties’ from the ‘Edit->Locations’ or pop-up menu. To delete an existing
location, select the location from the ‘Location’-tree and select ‘Delete’ from the ‘Edit->Locations’ or
pop-up menu. Deleting a ‘Location’ is also possible by ‘dragging’ the location to the ‘Deleted Items’location. Deleted locations are transferred to the ‘Deleted Items’-location. To delete locations forever,
the locations must be deleted from the ‘Deleted Items’-location as well. You can move locations to
other locations by ‘dragging & dropping’.
If a location has child locations they can be projected on the map as blue-labels. Clicking the labels
will jump to that location. If a location has tags they can be projected on the map as well.
It’s also possible to place (instrumentation) reports, charts and digital assets (e.g. pictures) on maps
to construct instrumentation dashboards or control panels.
Page 6 of 60
Location Properties
A location has a/o the following fields:
Location name: Each location should obviously have a name.
Location code: As accomplishment to the name a location can have a code (the meaning of this
code is up to the user for instance a zip code or serial number). The location code is also used as a
reference when passing tag limit violations to the alarm system (See: chapter Messenger).
Refresh rate: The rate at which the ‘Recent Values’-page and ‘Tag’-values on the Map-page of this
location will be refreshed.
Display on Map-page: A location label can be displayed on the map of the parent location. The
position of the label on the parent map can be configured in the location properties of the parent. It’s
also possible to show the label to a certain type of granted user, while hiding it from another (See:
chapter users).
Collector Manager compatible data source: To let he ‘Collector Manager’ import data to this
location, please link this location to the appropriate ‘Collector Manager’ compatible data
source/collector.
Data source identified by station code: To let another type of ‘Collector’ import data to this
location, you can specify a code to identify a data source that should be linked to this location. The
code to specify depends on the rules of the ‘Collector’ and could be for instance a serial# of a remote
data acquisition station.
Its allowed to link one single data source/collector to multiple locations, not the other way
around.
When a data collector receives data from a new source (no location with a matching station
code is found in the database), it will automatically create a new location with the correct
station code.
Changing a location’s station code or the identification at the site of the source will break the
link between them.
Page 7 of 60
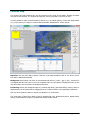
Location map
If a location has child locations they can be projected on the map as blue-labels. Clicking the labels
will jump to that location. If a location has tags they can be projected on the map as well.
It’s also possible to place (instrumentation) reports (e.g. an angular gauge), charts and digital assets
(e.g. a logo picture) on maps to construct instrumentation dashboards or control panels.
Map Size: The size of the Map in pixels, if the size of the map exceeds the size of the screen, scrollbars will be added automatically.
Backgroud: Each location can have its own background picture (*.bmp, *.jpg or *gif) , however it’s
not obliged and does not have to cover the complete map. You can specify a background color for the
map area that is not covered by the background picture.
Positioning: Items (the background picture, Location/Tag labels, (instrumentation) reports, charts or
digital assets) can be positioned by dragging them to a certain position or by specifying coordinates.
Click the ‘Item Positions’-button to specify coordinates or to resize items.
The visual order of items from back to front is: background color, background picture, digital assets,
charts, (instrumentation) reports, tag labels and finally location labels.
Page 8 of 60
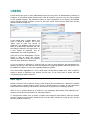
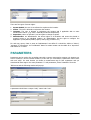
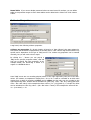
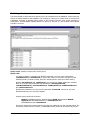
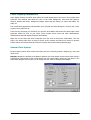
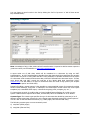
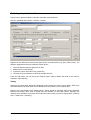
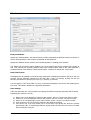
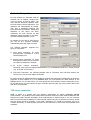
USERS
Promis knows two types of users; Administrators and View-only users. An Administrator is allowed to
configure (on a licensed system) Promis and to view all locations. View-only users are only permitted
to view granted locations. The maximum number of users is dependent of your license, the standard
license includes the right to define 4 users. To edit users, select ‘Users’ from the ‘Edit’-menu and the
following window will pop-up:
A user should have a unique ‘Name’, this
name is always in capitals. This is the
‘Name’ used to login into Promis. A
password is not obligatory and can be left
blank. If a password is specified, the user
can change it himself in the login screen. If
a user forgets its password, only an
administrator can reset the password.
If the user is not an ‘Administrator’ you can
specify a date at which the account
expires, this might by handy for temporary
accounts when hosting the Webserver.
If you are hosting a webserver it could be that you want to have different web appearances for
different (groups of) users and this can be accomplished by assigning different webserver profiles. See
the Webserver chapter for more info regarding webserver profiles.
If the first location applicable to a user is deep down the hierarchic location tree, then it might be
handy to specify a webserver root location for this user, so you don’t have to bother him with
uninteresting upper parent locations.
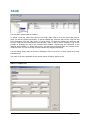
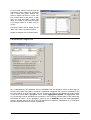
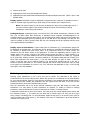
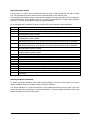
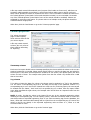
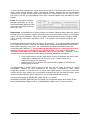
User rights
Default a new user has no rights to see any of the locations in the locations-tree. However it’s possible
to grant access to certain locations. When a user is denied access to a location, he can’t access/see
that location and underlying sub-locations, unless access is granted for an underlying location.
When a user is granted access to a location he can access/see that location and underlying sublocations, unless access is denied for an underlying location..
To ‘Deny/Permit’ certain users to access a location and underlying sub-locations, select the location
from the ‘Location’-list and select ‘Granted Users’ from the ‘Edit->Locations’ or pop-up menu and the
following window will pop-up:
Page 9 of 60
There are five types of access rights:
1. Access Denied, the user is not allowed to see/access the location.
2. Visitor. The user is allowed to see/access the location
3. Operator. The user is allowed to see/access the location and if applicable able to enter
measurement values. (e.g. enter a manually measured temperature).
4. Supervisor, same as ‘Operator’, but has rights to change set points.
5. Administrator. An ‘Administrator’ has access rights to all locations and cannot be denied or
granted access to an individual location. An ‘Administrator’ has the right to configure the
application (create/delete/modify reports, charts, tags, locations etc.)
For each tag, report, chart or asset an ‘Administrator’ can define if it should be visible to ‘visitors’,
‘operators’ or ‘supervisors’. So “Confidential” data of a certain location can be visible for a ‘Supervisor’
and hidden for a ‘Visitor’.
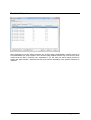
PARAMETERS
Parameters can be used to line-up similar tags with a common name and a common unit. Assume you
have to measure a flow at several locations. In this case you could define a parameter named ‘flow’
with unit ‘m3/h’. For each location you define a measurement tag for flow registration and you
associated all these tags to the same parameter. To edit parameters, select ‘Parameters’ from the
‘Edit’-menu and the following window will pop-up:
A parameter should have a unique ‘code’, ‘name’ and a ‘unit’.
Page 10 of 60
TAGS
You can define several tags per location.
To define a new tag, select ‘New tag’ from the ‘Edit->Tags’ menu or from the menu that pops-up
when you click the right mouse button. To edit an existing tag, select the tag from the ‘Tags’-list and
select ‘Properties’ from the ‘Edit->Tags’ or pop-up menu. To delete an existing tag, select the tag
from the ‘Tags’-list and select ‘Delete’ from the ‘Edit->Tags’ or pop-up menu. Deleting a ‘Tag’ is also
possible by ‘dragging’ the tag to the ‘Deleted Items’-location. Deleted tags are transferred to the
‘Deleted Items’-location. To delete tags forever, the tags must be deleted from the ‘Deleted Items’location as well. You can move tags to other locations by ‘dragging & dropping’.
You can change a tag’s order in the list by clicking the ‘Ctrl’ & ‘Up arrow’ or ‘Alt’ & ‘Down arrow’ keys
simultaneously.
The order of the list is applicable to the ‘Recent values’ & ‘History’ pages as well.
Base Properties
Page 11 of 60
A tag has a/o the following base properties:
Tag code: As accomplishment to the name a tag can have a code (the meaning of this code is up to
the user).
Tag name: Each tag should obviously have a name.
Tag ID: The tag ID is automatically generated by Promis. The ‘TagID’ is used to uniquely identify a
tag. The ‘TagID’ can be used in site report and chart queries. The ‘TagID’ is also very important when
importing measurements into the database. Measurements are stored in the ‘Measurements’-table,
this table has three fields:
Field name
TagID
TimeOfMeasurement
MeasuredValue
Field type
INTEGER
DATETIME
FLOAT
Parameter: A tag must be associated to one of the defined parameters.
Type: The type of tag can be one of the following:
Default tag visualization, presentation and calculation behavior can differ per tag type. E.g. calculating
an average wind direction is different than calculating an average temperature.
Type
Sample
Level
Quantity
Counter
Pulse
State/Step
Angle (°)
Latitude
Longitude
Description
A measurement sample of a continues signal
A level. E.g. the fuel level in a storage tank
Each registration represents an absolute quantity. E.g. a registration of
a mass from a weighting bridge.
A registration of an continues increasing counter value. E.g. a kWh
counter.
A registration of a non-continues signal. E.g. an impact.
A measurement sample of a discrete signal.
e.g. wind direction (important in case of average calculations)
Minimum range must be between 0-360°. Maximum range may exceed
360° to be able to set alarm boundaries on a Northly direction.
e.g. GPS-coordinate
e.g. GPS-coordinate
Number of Decimals: Specify the number of relevant decimals to be displayed.
Target: The target value (set point) for this tag.
Range: Specify the Min. and Max. range for the tag. Measurements outside this range will not be
displayed. The Y-axis of the ‘Player’ will be scaled to the specified range.
Limits: If a measurement is outside its limits it will be displayed in red and if required an alarm can
be passed to the Messenger for further dispatching.
Page 12 of 60
Additional Properties
A tag has a/o the following additional properties:
Calculated tag: If switched on, the measured value is a value calculated based upon the measured
values of other tags. See chapter: ‘Calculation properties’
Display option: At default a tag is displayed on the ‘Recent values’- and ‘History’-page for all granted
users. However some tags may not be that interesting to be displayed on a certain page and can
therefore be marked as invisible for that particular page. It’s also possible to show the tag to a certain
type of granted user, while hiding it from another (See: chapter users).
Alarming: If the Alarm Scanner is running (see chapter: Messenger) checking the Alarming box will
pass the alarms for this tag to the Messenger. When exceeding a low or high limit a ‘Warning’ will be
passed to the Messenger. When exceeding a low-low or high-high limit a ’Error’ will be passed to the
Messenger. To avoid bouncing alarms it is required to specify a hysteresis value.
Record rate: Promis can report an ‘Error’ if the value of a tag is not recorded in time. Please specify
a reasonable ‘record rate’. If you specify the ‘record rate’ to almost matching or higher than the real
record rate, alarming can become very nervous. If you specify a low ‘record rate’, it will take longer
before you get notified about it.
Page 13 of 60
Name Table: If you want to display measured values as texts instead of numbers, you can define
tables to map number ranges to texts. Name tables can be edited via the ‘Menu’-bar->Edit->Name
Tables.
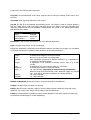
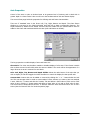
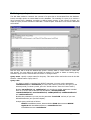
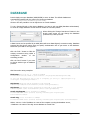
Collector Properties
A tag has a/o the following collector properties:
Collector tag properties: If a Promis location is bound to a ‘Data Collector’ then tags assigned to
this location can be linked to tags/channels of the DAQ-source. How a Promis tag can be linked is very
specific and is dependent of the type of ‘DAQ’-source. The ‘collector tag properties’ can be entered
manually, but you will need to be an expert.
By clicking the ‘…’-button you can pop-up a
‘DAQ’-Source specific properties editor, that will
help you to specify the right properties. In the
example beside, the Promis-tag is linked to a
register in a MODBUS device.
Some ‘DAQ’-source are not recording physical values in their right engineering units, but in raw ADCvalues. For instance a temperature ranging from –30 to 70 C could be recorded as an ADC-value
ranging from 0-4095. By supplying a factor and an offset, the ADC-value can be re-scaled to the
right engineering value. A factor can be calculated as: (Max. Eng. value – Min. Eng. value)/(Max. ADC
Value – Min. ADC Value) in this example the factor will be: (70 –(-30))/(4095-0) = 0.02442 The offset
can be calculated as: Min. Eng. value – (Min. ADC-value * factor) in this example the offset will be: 30 – (0*0.02442) = -30
Page 14 of 60
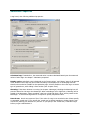
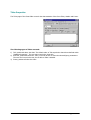
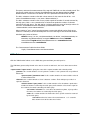
In some other cases it could be that the
engineering value couldn’t be calculated
with a factor and offset. Assume you
want to register the flow in a river, but
you measure level in ADC-values, in that
case you could first apply a factor and
offset to re-scale to (cm) and then apply
a conversion table to re-scale (cm) to
(m³/h).
Conversion tables can be edited via the
‘Menu’-bar->Edit->Conversion Tables.
Beside an example of a conversion table:
Calculation Properties
For a ‘calculated tag’ the measured value is calculated from the measured values of other tags. As
soon as one of these input tags is recorded, a calculation is triggered and a query is performed to get
the recent values of all the input tags. This can be either the most recent instantaneous recent values
or the most recent values aggregated over a certain aggregation period. The aggregated value
(e.g. an average) can be calculated over all values or over a portion (‘Median span’) of the values with
the Median as center. If the aggregation period is set to 00:00:00, then the actual aggregation
period is dynamic and will be set to the time between two successive registrations, e.g. to calculate
the delta count between two counter registrations.
Page 15 of 60
Aggregation options:
a) Multiple aggregated values per period. The aggregation will be performed over a shifting time
window, e.g. to calculate a rolling average. Each time a new input value is recorded a calculation
will be perform and a calculated record will be recorded. The aggregation will be performed over a
period right aligned in time with the timestamp of the recorded input value.
b) One aggregated value per period. The aggregation will be performed over a discreet time window
and only one value will be recorded (e.g. if the period is 1 hour only one value per hour will be
recorded). Each time a new input value is recorded a calculation will be performed and a) a new
record will be recorded if no value was recorded within the aggregation period yet or b) an
existing record in the aggregation period will be updated. The timestamp of the calculated record
can be set to the begin, middle or end time of the aggregation period.
Calculation Scripts:
When you define a calculated tag you can choose from 5 basic functions (copy, sum, subtract,
multiply and divide), but you can also load a calculation script from disk. The following standard
calculation scripts are pre-installed on your system.
Counter To Quantity.pcs, which calculates the difference between the maximum value and
minimum value over the selected aggregation period or registration interval of an input tag of
type counter. (E.g. to calculate the energy usage based on a kWh counter)
Counter To Rate.pcs, which calculates the rate per hour at which the minimum value is
changed to the maximum value over the selected aggregation period or registration interval of
an input tag of type counter (E.g. to calculate the flow rate based on a water counter)
Dewpoint.pcs, which calculates the dew point based on a Temperature (C) and Relative
humidity (%) input tag.
GPS drift.pcs, which calculates the GPS drift in meters based on the difference between a
recorded position and a target position. The script requires a latitude and a longitude input
tag.
Wet bulb temperature.pcs, which calculates the wet bulb temperature based on a
Temperature (C) , a Relative Humidity (%) and a Barometric Pressure (kPa) input tag.
Windchill.pcs, which calculates the wind chill based on a Temperature (C) and Wind speed
(m/s) input tag.
Switch on high limit.pcs, which sets the value of a tag to 1, if one of the input tags
exceeds its high limit set point. Sets the value to 0 again, if all input tags are below their high
limits.
Switch on low limit.pcs, which sets the value of a tag to 1 if, one of the input tags falls
below its low limit set point. Sets the value to 0 again, if all input tags are above their low
limits.
Page 16 of 60
Custom Calculation Scripts:
A user definable script (Microsoft J-Script) does the actual calculation. The calculation is fed by a
multi-dimensional J-Script Array supplying the data to be used in the calculation.
The Array has the following format:
var aInputData=
[
[<first inputTagID>,<tagCode>,<average or instant. Value>,<Min. value>,<Max.
value>,<Count>,<Time of min. value>,<Time of max. value>, [<Values>] ]
[<sec. inputTagID>,<tagCode>,<average or instant.
value>,<Count>,<Time of min. value>,<Time of max.
…
[<last inputTagID>,<tagCode>,<average or instant.
value>,<Count>,<Time of min. value>,<Time of max.
Value>,<Min. value>,<Max.
value>, [<Values>] ]
Value>,<Min. value>,<Max.
value>, [<Values>] ]
]
For each input tag there is a sub-array in the aInputData array. The order of the sub-array’s is
accordingly to the order of input tags. Each sub-array has the following 9 fields:
1) inputTagID, the unique ID of the tag (integer)
2) tagCode, the userid defined code of the tag (string)
3) average or instantaneous. value, the most recent average, averaged median or instantaneous
value (float). If the input tag is of type ‘Counter’, the value is the last counter value within the
aggregation period.
4) Min. value, the minimum value within the aggregation period. This value equals the instantaneous
value, if no aggregation period was specified.
5) Max. value, the maximum value within the aggregation period. This value equals the
instantaneous value, if no aggregation period was specified.
6) Count, the number of input values found within the aggregation period. Count is 1, if no
aggregation period was specified.
7) Time of min. value, the timestamp of the Minimum value. (float, the number of days that have
passed since 12/30/1899. The fractional part is the time of day).
8) Time of max. value, the timestamp of the Maximum value. (float, the number of days that have
passed since 12/30/1899. The fractional part is the time of day).
9) Values is a sub-array listing all the values within the aggregation period ordered by timestamp.
In case the input tag is of type ‘Counter’, the counts per aggregation period can be calculated by
subtracting the Minimum from the Maximum counter value or by the difference between the first and
the last value in the <Values> sub-array. (Note: to be able to calculate the correct quantity, the first
counter value before the aggregation period will be included in the calculation as well).
The calculation script as shown below, performs a multiplication of the average or instantaneous
values of all input tags.
function CalculateValue(aInputData)
{
var dResult=1.0;
for(var iTag=0; iTag<aInputData.length; iTag++)
{
if(aInputData[iTag][5]<=0) return;
dResult *= aInputData[iTag][2];
}
return dResult;
}
The function should return a number (float) as the result of the calculation. A recording will be made
to the database, if a valid number is returned only. If wished, returning nothing or a non-number can
prevent a recording to the database.
Page 17 of 60
Tag Data
Normally tag data is collected automatically, however it could be that the collected data needs to be
corrected or that you want to insert some values manually.
To edit tag data, select the tag from the ‘Tags’-list and select ‘Data’ from the ‘Edit->Tags’ or pop-up
menu.
The tag data is shown in chart and tabular form. The chart shows all the data over the selected
period. The chart has a left and a right marker (both colored maroon), which can be dragged
horizontally to mark a certain portion of the data, only this data will be displayed in tabular form. The
chart has a data cursor (colored blue), that can be used to select a particular data record in the table.
To enter a single data record manually, click the ‘+’ button below the table and enter a valid
timestamp and value.
Click the ‘Edit’-button to edit either the single selected record or all graphically marked records.
The following operations are possible:
1)
2)
3)
4)
Set the value(s) of a single record or all marked records to a fixed value.
Multiply the existing value(s) of a single record or all marked records with a certain factor.
Add an offset to the existing value(s) of a single record or all marked records.
Add an offset slope to the existing value(s) of a single record or all marked records. The slope is
linearly scaled over the graphically marked period. So a record in the middle of the marked period
will be added with an offset equal to a half of the difference between the minimum and maximum
slope value.
5) Convert the value(s) of a single record of all marked records by using a conversion table
(Conversion tables can be edited via the ‘Menu’-bar->Edit->Conversion Tables).
6) Delete a single record or all marked records.
7) Restore a single record or all records within the marked period from an archive with original
values. As soon as a record is modified/deleted for the first time, its original value will be
archived. Note: following modifications will not alter the originally archived value.
Page 18 of 60
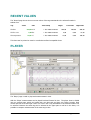
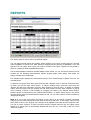
RECENT VALUES
The ‘Recent’-page shows the most recent values of the tags associated to the selected location in
tabular form.
Tag
Value
Air flow
Air Pressure
Air temperature
Unit
544,00 m³/h
8,90 Bar
72,00 °C
Timestamp
Target
Low-Limit
High-Limit
1-dec-2003 02:02:00
500,00
400,00
800,00
1-dec-2003 02:02:00
8,00
0,00
16,00
1-dec-2003 02:02:00
15,00
0,00
100,00
This sheet can be printed or saved or e-mailed as an Excel compatible sheet.
PLAYER
The ‘Player’-page is used to play back measurements in time.
With the ‘Player’ measurements can be played back and forward in time. The player chart is divided
into two vertical parts, which are having their own time-axis and their own ‘player’-controls. Each
vertical part has a left and right Y-axis. For each Y-axis a tag associated to the selected location can
be selected. Because the same tag can be selected in the upper part as well as in the lower, it is
possible to compare measurements of the same tag in time.
Page 19 of 60
The player control has the following buttons:
1.
2.
3.
4.
5.
Fast play back, when clicking this button several times the play back speed toggles from 2x,
4x, 8x to 16x
Play back with ‘1x’ speed
Stop. Terminates play back. When play back is on hold the scroll bar can be used to position
the view-port.
Play Forward with ‘1x’ speed
Fast Play Forward, when clicking this button several times the play forward speed toggles
from 2x, 4x, 8x to 16x
To define the total play back period, select the “Period Selector” from the ‘Control’-menu. Within the
total period a ‘View’-port can be defined ranging from 1 minute to many days.
Normal playing speed (1x) equals 1 view-port per 10 seconds.
Page 20 of 60
CHARTS
The ‘Chart’-page is used to show user defined charts.
You can define several charts per location. When creating a new chart, Promis generates a default
chart based on the tags you selected. The default chart displays the measurements of max. 8 tags
over the selected period. The user may alter the queries or modify the visual properties. A/o attaching
tags to a specific Y-axis, changing colors or adding function series (e.g. curve fitting or moving
average). Charts can be printed or saved or e-mailed as JPEG compatible pictures.
To define a new chart, select ‘New chart’ from the ‘Edit->Charts’ menu or from the menu that pops-up
when you click the right mouse button. To edit an existing chart, select the chart from the ‘Charts’-list
and select ‘Properties’ from the ‘Edit->Charts’ or pop-up menu. To delete an existing chart, select the
chart from the ‘Charts’-list and select ‘Delete’ from the ‘Edit->Charts’ or pop-up menu. Deleting a
‘Chart’ is also possible by ‘dragging’ the chart to the ‘Deleted Items’-location. Deleted charts are
transferred to the ‘Deleted Items’-location. To delete charts forever, the charts must be deleted from
the ‘Deleted Items’-location as well. You can move charts to other locations by ‘dragging & dropping’.
You can change a chart’s order in the list by clicking the ‘Ctrl’ & ‘Up arrow’ or ‘Alt’ & ‘Down arrow’ keys
simultaneously.
Note 1: If you create new charts by cloning it from others (or by cloning a location containing
charts), the clones and original chart will share their queries and visual properties. If you change a
query or a visual property within a clone or the original, your changes will be applied to all clones and
the original as well. You can of course “unshare” a clone from others and the original chart as well. An
original chart shared to by clones can’t be permanently deleted and when you try, it will stick in the
root of the ‘trash can’ location.
Page 21 of 60
Note 2: Charts can be included in HTML reports as well, you can do it by adding HTML img-elements
(in lower-case) to the HTML code of the concerned report as follows: <img src=”chart.jpg?chartid=x”
/>, where x is the ID of the chart to be included in the HTML-report.
Defining a chart
Note: Knowledge of SQL is required to define custom data queries!
Chart properties exist out of data queries (which are supplying the data points for the chart series)
and visual properties. Click the ‘Add’ or ‘Clone’ button to create new data queries. You may define as
much queries as required. To modify or delete an existing query, select the query from the list and
click the ‘Delete’ or ‘Change’-button. To edit the charts visual properties click the ‘Edit Chart’-button.
Display option: At default a chart is displayed to all granted users. However it’s possible to show a
chart to a certain type of granted user, while hiding it from another (See: chapter users).
Page 22 of 60
Defining chart queries
The Data needed to draw chart lines (Series) has to be extracted from the database. Promis uses SQL
queries to extract data from the database. The meaning of a query is to retrieve a list of records from
a database, according to defined search criteria. In the context of Promis, every record represents a
Series point. Consult chapter “Binding Series to a Query” to see how X, Y and Z values can be bound
to fields in a record.
Query name: Specify a unique name for the query.
Query code:
You have to specify a complete ‘SQL SELECT’ statement. You may use the parameters
:startOfPeriod and :endOfPeriod, to narrow the number of records in the Query to the
selected period (To select a period, open the “Period Selector” from the ‘Control-menu’).
Besides :startOfPeriod and :endOfperiod, you can also use similar parameters rounded
down or up to the nearest discrete time boundaries; :startDayOfPeriod,
:startMonthOfPeriod, :startYearOfPeriod, :endDayOfPeriod, :endMonthOfPeriod
and :endYearOfPeriod.
Besides time parameters you may use the parameter :locationID and any of your own
defined Parameters (see: previous chapter).
A simple query could look as follows:
SELECT timeOfMeasurement, MeasuredValue FROM Measurements WHERE
tagID=8 AND timeOfMeasurement>=:startOfPeriod AND
timeOfMeasurement<:endOfPeriod
This query retrieves the measurements of the tag with TAGID=8 over the selected period. The
list returns a table with two columns, TimeOfMeasurement, which can be used to bind to the
Page 23 of 60
X-axis of a Series and MeasuredValue that can be bind to the Y-Axis of a series. Note:
MeasuredValue is returned in the default unit of the parameter associated with the tag.
When creating a “new”-chart, Promis generates a chart with up to 8 default queries. Each
query results in a list of measurements over the selected period for one of the tags of the
concerned location.
A default query looks as follows:
SELECT timeOfMeasurement, MeasuredValue, loLim, hiLim,
(MeasuredValue*altunitfactor+altunitoffset) As AltValue,
(LoLim*altunitfactor+altunitoffset) As AltLoLim, (HiLim*altunitfactor+altunitoffset) As
AltHiLim FROM tags, params, measurements WHERE tags.parID=params.parID AND
tags.tagID=measurements.tagID AND measurements.tagID=8 AND
timeOfMeasurement>=:startOfPeriod AND timeOfMeasurement<:endOfPeriod
This query retrieves also the measurements of the tag with TAGID=8, but it accomplishes it
with some additional information. Besides the measured value it returns the low and high limit
values, which is defined in the “tags”-table. It also returns the measured value in the possible
alternative unit. E.g. level measurements could be stored in “meter” but you want display
them in “liter”. The conversion info between default units and the alternative units is stored
the “params”-table. Therefore the query uses three tables: 1) the ‘Measurements’-table, which
is connected via its “tagID” to 2) the “tags”-table, which is connected via its “ParID” to the
“params-table”.
The “measurements”-table has three fields:
TagID, TimeOfMeasurement and MeasuredValue
The “tags”-table has a/o the following fields:
TagID, ParID, TagName, Target, MinRange, LoLim, HiLim and MaxRange
The “Params”-table has a/o the following fields:
ParID, Unit, AltUnit, AltUnitFactor, AltUnitOffset
AltUnitFactor and AltUnitOffset are specifying how to convert from the default unit to
the alternative unit. The formula is as follows:
value alt. Unit = measured value * factor + offset.
Page 24 of 60
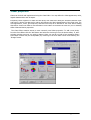
Visual properties
Charts can be built and implemented using the Chart Editor. You may define the Chart appearance, titles,
legend characteristics and 3D aspect.
Everything comes together to make the final Chart, with Chart axes being the interface between Chart
and Series. A Series has data and its values will influence the label characteristics of the Chart axes. The
axes appearance, colors, grid frequency and label fonts may all be defined for the Chart before adding
data Series. Promis will make a best estimate of most values to minimize the need for you to manually
define Chart and Series properties.
The Chart Editor contains access to most commonly used Chart properties. To add a new Series,
from the Chart Editor click the ‘Add’ button and select the Series type from the Series Gallery. If, after
selecting a Series type now, you wish to change it later you may do so (with a few exceptions where
Series data content may be incompatible) by returning to the first Editor screen and selecting the
‘Change’ button.
Page 25 of 60
Binding Series to a Query
To bind a Series to a Query, you have to take the following steps:
1. From the Chart Editor click the ‘Series’ tab and select the appropriate series name.
2. From the ‘Series’ tab click the ‘Data Source’ tab and select ‘Dataset’ from the first selection list.
3. Select the appropriate ‘Query’ from the ‘Dataset’ list. (Consult the chapter “Defining Queries” to
see how Queries can be defined)
4. Specify which fields from the Query should be used as the Series points: X, Y and Z values and
labels.
Binding Series to a Function
With the ‘Chart Editor’, on the first Chart page, click the ‘Add’ button to add a new Series to the Chart.
In the ‘Series Gallery’ choose the ‘Functions’ tab to select the Function you require. Each Function is
presented as a Line Series, you may change the Series Type associated with the Function later by
clicking the ‘Change’ button on the first Chart page. Function definitions are easily changed afterwards
on the ‘Data Source’ page of the Function Series.
Using the ‘Chart Editor’, after adding a Function,
the Function Series' ‘Data Source’ page will
show a list of available Series for inclusion in
the Function definition. Here you may change
the Function Type you wish to apply to the
Series and select Series from the ‘Available’ list
and add them to the right ‘Selected’ list.
Page 26 of 60
Chart Display Parameters
Chart display features are those which affect the overall appearance of the Chart. They include those
properties and methods that define the color of the Chart background, Titles and their position,
margins, borders and bevels, background images, frame and axis visible, pen colors and widths, 3D,
walls, etc.
The overall Chart appearance characteristics are a grouped into these categories: General, Axis, Titles,
Legend, Panel, Wall and 3D
These are the groupings you will find if you open the Chart Editor and browse the Chart pages. Other
properties affect the 'look' of your Chart. These include Series colors and mark characteristics,
individual Axis and Grid display properties and labeling.
Right click on the chart and select 'Properties' from the menu to access the Chart Editor. The first
page is the Series page which is empty of Series at the moment and which we'll look at in another
tutorial. Select the second Chart tab 'General' to access the General Chart properties page.
General Chart Options
General options include Print Preview and Chart plus the 3 following sections: Margins(%), Zoom and
Allow Scroll.
Margins: Margins are defined as the distance between the Chart Border and the Chart Frame and are
expressed as a percentage of the overall dimensions of the Chart Panel. Moving the spin boxes in the
Chart Editor Margins box will show you at design time the effect of changing each Margin.
Page 27 of 60
Axis Properties
Control of the axes is quite an involved area at its greatest level of intricacy and is dealt with in
greater depth in a later tutorial. Here we will cover the fundamentals of Axis and Frame display.
The second Chart page holds the properties for defining axis and frame characteristics.
There are 5 ‘Standard’ axes in the Chart. Left, Top, Right, Bottom and Depth. The Chart Frame
displays as a surround to the Chart's plot-able area and has no data corresponding features. The
Depth initializes by default as not Visible. All other Axes are visible from the moment that a Series is
added to the Chart and associated with those Axes (Left and Bottom as default).
The key properties to enable display of axes and frame are:
Show Axis: The Show Axis checkbox enables or disables display of all 4 axes. If the Frame is visible
then a Chart surround is still visible when the axes are hidden. The result will be the appearance of a
larger Chart as no area is reserved for axis labels.
Axis: Left, Right, Top, Bottom and Depth Visible: Select the radio button of the axis that you
wish to display or hide and toggle the Visible checkbox to control the display for that specific axis.
Custom Axis: Custom Axis can be added or removed by clicking the ‘+’ or ‘-‘ button below the Axis
list. This can amongst other be used to create stacked Y-axes. Assume you want to have two stacked
Y-axes. Click the ‘+’ button and click the ‘Position’ Tab and define a ‘Start’ value of 52% and an ‘End’
value of 00%. Click the ‘+’ button again and define a ‘Start’ value of 0% and an ‘End’ value of 48%.
The second axis is stacked above the first. To become visible the axes must be bound to one or more
Series (See the ‘General’ Tab of a ‘Series Properties’ page.
Page 28 of 60
Titles Properties
The Titles page of the Chart Editor controls the characteristics of the Chart Titles, Header and Footer.
The following types of Titles are used:
1) Title, positioned above the chart. The default value of Title equals the chart title as defined within
‘Database Properties’. The user may overrule the chart title.
2) Sub Title, positioned below the ‘Title’, is used by Promis to show the selected Query parameters.
The user can’t overrule the text, but is able to make it invisible.
3) Footer, positioned below the chart.
Page 29 of 60
REPORTS
The ‘Report’-page is used to show user defined reports.
You can define several reports per location. When creating a new report, Promis pops up a list with
report templates to choose from. After picking a template Promis pops-up (if applicable) a list with
tags and you can select which one(s) you want to include in the report. Reports can be printed or
saved or e-mailed as Html compatible documents.
The list with templates contains a standard tabular report in html, csv, xls, xml and txt format. The list
contains a/o the following instrumentation reports: angular gauge, linear gauge, tank gauge, pie
gauge, compass and a traffic light.
The standard report displays the measurement history of the selected tags in tabular form over the
selected period.
To define a new report select ‘New report’ from the ‘Edit->Reports’ menu or from the menu that popsup when you click the right mouse button. To edit an existing report, select the report from the
‘Reports’-list and select ‘Properties’ from the ‘Edit->Reports’ or pop-up menu. To delete an existing
report, select the report from the ‘Reports’-list and select ‘Delete’ from the ‘Edit->Reports’ or pop-up
menu. Deleting a ‘Report’ is also possible by ‘dragging’ the chart to the ‘Deleted Items’-location.
Deleted reports are transferred to the ‘Deleted Items’-location. To delete reports forever, the reports
must be deleted from the ‘Deleted Items’-location as well. You can move reports to other locations by
‘dragging & dropping’.
Note 1: If you create new reports by cloning it from others (or by cloning a location containing
reports), the clones and original report will share their queries and XSLT. If you change a query or the
XSLT within a clone or the original, your changes will be applied to all clones and the original as well.
You can of course “unshare” a clone from others and the original report as well. An original report
shared to by clones can’t be permanently deleted and when you try, it will stick in the root of the
‘trash can’ location.
Page 30 of 60
You can change a report’s order in the list by clicking the ‘Ctrl’ & ‘Up arrow’ or ‘Alt’ & ‘Down arrow’
keys simultaneously.
Defining a report
Note: Knowledge of SQL, HTML, XML and XSLT transformation is required to define custom reports! A
good site to start you self education is http://www.w3schools.com
A report exists out of XML data, which will be translated to a document by using an XSLT
transformation. An XSLT transformation describes how XML data should be transformed into another
data format. The power of using XML and XSLT is the possibility to separate the data from the layout
of a document. XML contains the document data, while XSLT describes the document layout. To learn
more about XML and XSLT consult the web-site of the ‘World Wide Web Consortium (W3C)’
www.w3c.org. The XML data for a report is constructed from the result of SQL queries (see: chapter
‘Defining report queries’ and ‘XML data’).
Instead of building a textual report it’s also possible to create graphical reports for instance by making
HTML5 Canvas drawings, using Java- or VB-script in an HTML-report. Promis comes with a few report
templates (a/o a standard HTML report, a Canvas linear gauge, tank, compass, pie, etc..).
If Canvas does not work, it could be that you have installed Internet Explorer 8 or older on your
system. HTML5 Canvas requires IE9 at least, unfortunately IE9 is not available for XP or W2000.
Content Type: The content type specifies the type of document that should be generated, a lot of
different content types exist, however the only content types that make sense from a Promis point of
view are XML or flat text based documents (e.g. HTML-pages, CSV filed and XML files).
The following content types are most commonly used:
a) text/html (HTML pages)
b) text/plain (Flat text files)
Page 31 of 60
c) text/csv (CSV files)
d) application/vnd.ms-excel (XML based Excel sheets)
e) application/vnd.openxmlformats-officedocument.wordprocessingml.document (Office Open XML
Spread sheet)
Display option: At default a report is displayed to all granted users. However it’s possible to show a
report to a certain type of granted user, while hiding it from another (See: chapter users).
Note: The option “Passer-by” can be used to display the report (on the Map-page only) if a
user has no access rights to the location hosting the report, but is passing by during
navigating to under laying sub locations.
Packaged Report: A packaged report is an archive file in ZIP-format containing a collection of XML
files (e.g. an Office Open XML document). A packaged report originally created/designed in an
external program (e.g. Microsoft Excel 2007), can be imported in Promis and Promis can update the
contents of the packaged report by replacing one of the XML files in the package. The edit box ‘File
name in package’ is used to specify which XML file in the package should be replaced with the result
of the performed XSLT translation.
Display report as instrument: A report looking like an instrument (e.g. a temperature gauge) can
be displayed on the Map-page. A refresh-rate can be specified to automatically refresh the instrument
for instance to display the most recent value. If an instrument report is in HTML format, the
instrument can sent action events to the application. To inform the application that the report can
initiate actions, the <body> element of the HTML should contain the action=”” string attribute. E.g.
<body action=””> The action attribute can be set by JavaScript enclosed in the HTML, e.g. triggered
by an event after clicking a button. The action attribute is a formatted string that may contain up to
three fields separated with semi-colons (;). The first field specifies the type of action: 1=Edit set
points, 2=Set tag value and 3=Change location. The second field specifies the ID of the tag or
location to perform the action on. The 3 field is optional and can be used to specify the value of a tag
to be written to the database. E.g. action=”2;1;1.23” will cause the application to log 1.23 for the tag
with tagID=1 into the database.
Defining report parameters
Defining report parameters is not a must, but can be handy. The XML-data of the report is
constructed from the result of SQL-queries. Within SQL-queries you could decide to use fixed variables
for your search and filter criteria, it could however be handy to use variables instead. Besides using a
Parameter as an SQL variable, the parameters are also copied to the XML data, so you can use the
Parameters directly in the XSLT transformation as well.
Click the ‘Parameters’ tab to list all the defined Parameters. Click the ‘Add’ button to create new
Parameters. You may define as much Parameters as required. To modify or delete an existing
Parameter, select the Parameter from the list and click the ‘Delete’ or ‘Change’-button.
A Parameter should have a name and a value. The name may only contain alphanumeric tokens and
the underscore token (_). The name may not start with a numeric digit. The value can be of type
string, integer or floating-point. To use a Parameter within an SQL-query or in the XSLT text, enter its
name preceded with a colon token (:). For instance if the name of a Parameter is x, then x should be
referred to in a query as :x
Page 32 of 60
Defining report queries
The XML data needed to construct the contents of a report has to be extracted from the database.
Promis uses SQL queries to extract data from the database. The meaning of a query is to retrieve a
list of records from a database, according to defined search criteria. In the context of Promis, the
result of a query forms a collection of XML data. Consult chapter “XML data” to see how the XML data
will look like.
Click the ‘SQL’ tab to list all the defined SQL queries. Click the ‘Add’ or ‘Clone’ button to create new
SQL queries. You may define as much queries as required. To modify or delete an existing query,
select the query from the list and click the ‘Delete’ or ‘Change’-button.
Query name: Specify a unique name for the query. This name will be used as the name in the XML
Dataset. <dataset name=”query name”>
Query code:
You have to specify a complete ‘SQL SELECT’ statement. You may use the parameters
:startOfPeriond and :endOfPeriod, to narrow the number of records in the Query to the
selected period (To select a period, open the “Period Selector” from the ‘Control-menu’).
Besides :startOfPeriod and :endOfperiod, you can also use similar parameters rounded
down or up to the nearest discrete time boundaries; :startDayOfPeriod,
:startMonthOfPeriod, :startYearOfPeriod, :endDayOfPeriod, :endMonthOfPeriod
and :endYearOfPeriod.
Besides time parameters you may use the parameter :locationID and any of your own
defined Parameters (see: previous chapter).
A simple query could look as follows:
SELECT timeOfMeasurement, MeasuredValue FROM Measurements WHERE
tagID=8 AND timeOfMeasurement>=:startOfPeriod AND
timeOfMeasurement<:endOfPeriod
Page 33 of 60
This query retrieves the measurements of the tag with TAGID=8 over the selected period. The
list returns a table with two columns (timeOfMeasurements and MeasuredValue). Note:
MeasuredValue is returned in the default unit of the parameter associated with the tag.
The XML <dataset> contains a list with column names. In this case the list will be: <col
name=”timeOfMeasurement/> <col name=”Measuredvalue”/>
The XML <dataset> contains a list of rows, which equals the number of records returned by
the SQL query. Each <row> contains a list of values that equals the number of columns
returned by the SQL query. The XML tag for a column equals the name of the SQL column. In
this case <timeOfMeasurement>timestamp</timeOfMeasurement> and
<MeasuredValue>value<MeasuredValue>
When creating a “new”-report Promis generates a report with default queries. Each query
results in a summary over the selected period for one of the tags of the concerned location.
A default query looks as follows:
SELECT Count(*) as Cnt, Min(MeasuredValue) as MinVal , Max(MeasuredValue) as
MaxValue, Avg(MeasuredValue) as AvgVal FROM measurements WHERE
measurements.tagID=8 AND timeOfMeasurement>=:startOfPeriod AND
timeOfMeasurement<:endOfPeriod
The “measurements”-table has three fields:
TagID, TimeOfMeasurement and MeasuredValue
XML Data
Click the ‘XML Preview’ tab to see the XML data generated from your SQL queries.
The XML data generated by Promis exists out of several nested levels, the levels from outer to inner
are:
<report name=”report name”> giving the name of the report, location and selected period.
<params> this section contains a list of <param> sections.> One <param> for every defined
Parameter.
<param name=”parameter name”> this section contains the name and the value of
a defined Parameter.
<datasets> this section contains a list of <dataset> sections. Each SQL query results in a
separate <dataset>
<dataset name=”query name”> this section contains a list of columns equal to the
number of columns returned by the SQL query and it contains a list of rows equal to
the number of records returned by the SQL query.
<col name=”col name”> a <col> does not contain any data, it just specifies
the name of a column as returned by the SQL query.
<row> this section contains the field values for a specific record as returned
by the SQL query.
<col name>value</col name> the name between <> is set to the
SQL column name of the concerned value.
Page 34 of 60
XML example:
<?xml version="1.0"?>
<report name="Example report" width=”120” height=”240”>
<startofperiod>2008-01-12T00:00:00</startofperiod>
<endofperiod>2008-01-13T2:00:00:00</endofperiod>
<location>Compressor</location>
<locationpath>Location A - Site 1 - Floor 1</locationpath>
<params>
<param name="parX">100</param>
<param name="parY">Some text</param>
</params>
<datasets>
<dataset name="Air flow">
<col name="Cnt"/>
<col name="MinVal"/>
<col name="MaxVal"/>
<col name="AvgVal"/>
<row>
<Cnt>615</Cnt>
<MinVal>517</MinVal>
<MaxVal>798</MaxVal>
<AvgVal>586.484</AvgVal>
</row>
</dataset>
</datasets>
</report>
XSLT Transformation
If you use the report templates of Promis, you probably don’t have to worry about XSLT
transformations. But if you want to create your own reports you might need knowledge about XSLT
transformations. It is possible to define very complex transformations, so it’s possible to create very
advanced reports. Promis makes use of the Mircosoft MSXML component, which even allows to
incorporated scripting (JavaScript en VB-Script) in your transformations. The output format of a report
can be flat-text (e.g. csv) or XML-based (like HTML).
To learn more about XSLT transformations consult the web-site of the ‘World Wide Web Consortium
(W3C)’ www.w3c.org.
Note: When implementing an HTML report you can include chart’s into it as well. To include charts
add HTML img-elements (in lower-case) to the HTML code as follows: <img src=”chart.jpg?chartid=x”
/>, where x is the ID of the chart to be included.
Page 35 of 60
A simple XSLT transformation example to list the raw result of your SQL-queries:
<?xml version="1.0"?>
<xsl:stylesheet xmlns:xsl = "http://www.w3.org/1999/XSL/Transform" version = "1.0" >
<xsl:output method="html" omit-xml-declaration="yes" media-type="text/html"/>
<xsl:template match="/report">
<html>
<style>
body
{font-family: Arial; font-size:12pt; color:black;}
table {font-family: Arial; font-size:8pt; color:black;}
h1
{font-family: Arial; font-size:16pt; font-weight:bold; color:black}
</style>
<body>
<h1><xsl:value-of select="@name" /></h1>
<table>
<tr>
<td><b>Location:</b></td><td><xsl:value-of select="location" />,
<xsl:value-of select="locationpath" /></td>
</tr><tr>
<td><b>Start of period:</b></td>
<td><xsl:value-of select="startofperiod" /></td>
</tr><tr>
<td><b>End of period:</b></td>
<td><xsl:value-of select="endofperiod" /></td>
</tr>
</table>
<xsl:for-each select="datasets/dataset">
<br/><b><xsl:value-of select="@name" /></b><br/>
<table>
<tr>
<xsl:for-each select="col">
<td><b> <xsl:value-of select="@name" /></b></td>
</xsl:for-each>
</tr>
<xsl:for-each select="row">
<tr>
<xsl:for-each select="node()">
<td><xsl:value-of select="." /></td>
</xsl:for-each>
</tr>
</xsl:for-each>
</table>
</xsl:for-each>
</body>
</html>
</xsl:template>
</xsl:stylesheet>
Page 36 of 60
Defining a report schedule
Promis has an optional module to schedule automatic report deliveries.
Click the ‘Schedule’ tab to define a delivery schedule.
Reports can be delivered to several Host types and in several formats (e.g. CSV, HTML, Excel). The
different supported Host types to delivery reports at are:
1.
2.
3.
4.
Local File System (storing report files on disk)
SMTP-Server (e-mail reports)
FTP-Server (store report files on a remote file)
HTTP-Server (post reports to a HTTP-Server/Web-Service)
From the ‘Edit’-menu you can pop-up the “Report Hosts” editor to define the Hosts to be used for
automatic report delivery.
Timing
Start time, the ‘Start time’ defines the beginning of the period you want to report about. After every
successful delivery the ‘Start time’ time is shifted with the ‘Duration’ of the report period.
Delivery time, the ‘Delivery time’ defines when a report should be delivered. After every successful
delivery the ‘Delivery time’ time is shifted with the ‘Duration’ of the report period. Normally, the
‘Delivery time’ should be a time later then ‘End time’ of the period you want to report about. (Delivery
time > (Start time + Duration)).
Page 37 of 60
Report file name format
The file name of a report file to be delivered may start with a certain prefix and end with a certain
trail. The part between prefix and trail can be formatted based on the ‘Delivery time’.
The Date/Time part format string is composed from specifiers that represent values to be inserted into
the formatted string. Some specifiers (such as "d"), simply format numbers or strings. Other specifiers
(such as "/") refer to locale-specific strings from global variables.
In the following table, specifiers are given in lower case. Case is ignored in format specifiers.
Specifier
d
dd
ddd
dddd
m
mm
mmm
mmmm
yy
yyyy
h
hh
n
nn
s
ss
/
:
'xx'/"xx"
Displays
Displays the day as a number without a leading zero (1-31).
Displays the day as a number with a leading zero (01-31).
Displays the day as an abbreviation (Sun-Sat) using the strings given by the
ShortDayNames global variable.
Displays the day as a full name (Sunday-Saturday) using the strings given by the
LongDayNames global variable.
Displays the month as a number without a leading zero (1-12). If the m specifier
immediately follows an h or hh specifier, the minute rather than the month is displayed.
Displays the month as a number with a leading zero (01-12). If the mm specifier
immediately follows an h or hh specifier, the minute rather than the month is displayed.
Displays the month as an abbreviation (Jan-Dec) using the strings given by the
ShortMonthNames global variable.
Displays the month as a full name (January-December) using the strings given by the
LongMonthNames global variable.
Displays the year as a two-digit number (00-99).
Displays the year as a four-digit number (0000-9999).
Displays the hour without a leading zero (0-23).
Displays the hour with a leading zero (00-23).
Displays the minute without a leading zero (0-59).
Displays the minute with a leading zero (00-59).
Displays the second without a leading zero (0-59).
Displays the second with a leading zero (00-59).
Displays the date separator character given by the DateSeparator global variable.
Displays the time separator character given by the TimeSeparator global variable.
Characters enclosed in single or double quotes are displayed as-is, and do not affect
formatting.
Starting the Report Scheduler
To enable the Report Scheduler select ‘Start Report Scheduler’ from the ‘Control’-menu. You need a
‘Report Scheduler’ license to be able to start the ‘Report Scheduler’.
The ‘Report Scheduler’ is a service that will run in the background and keeps running even if you close
Promis, and will start running after a re-boot automatically. To stop the ‘Report Scheduler’ select ‘Stop
Report Scheduler’ from the ‘Control’-menu.
Page 38 of 60
Use GoogleMaps to display and track locations
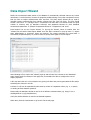
Promis comes with several report templates to visualize or report your data. The GoogleMaps.prd
template can be used to display your locations as markers on GoogleMaps. When the report is
included in a location and the location has a latitude and longitude, the last known position along with
its logged tracking trail will be displayed on the map. If the location has sub-locations, the last known
positions of all sub-locations with a latitude and longitude tag will be displayed on the map as well
(without their tracking trails). If a location has a heading tag, the position marker will be displayed as
an arrow pointing in the direction of the heading. If quality parameters (e.g. turbidity) are assigned to
the sub-locations, the color of the position markers will be displayed in yellow for a high or low limit
violation and red in case of a high-high or low-low limit violation. A marker will blink red in case one of
the quality parameters of a particular sub-location has aged out.
The report has a/o the following parameters:
a)
b)
c)
d)
e)
f)
MAPTYPE, 0 to display a roadmap or 1 to display a satellite view.
ZOOM, the GoogleMaps zoom factor or 0 to use automatic zoom.
TRACKINGENABLED, 0 to hide tracking or 1 to show (if tracking positions are logged).
TAGCODE0xx, Tag codes of the quality parameters to be checked for limit violations.
INTERVAL, if set tag values will be displayed with INTERVAL seconds in between.
TIMEOUT, the maximum allowed age of a quality parameter in seconds. 0= infinite.
ATTENTION
GoogleMaps requires Internet access.
Page 39 of 60
HISTORY
The ‘History’-page shows the measurements, over the select period of the tags associated to the
selected location, in tabular form. It also includes a summary at the bottom of the sheet.
TimeStamp
1-dec-2003 01:51:00
1-dec-2003 01:52:00
1-dec-2003 01:53:00
1-dec-2003 01:54:00
1-dec-2003 01:55:00
1-dec-2003 01:56:00
1-dec-2003 01:57:00
1-dec-2003 01:58:00
1-dec-2003 01:59:00
1-dec-2003 02:00:00
1-dec-2003 02:01:00
1-dec-2003 02:02:00
Count
Minimum
Maximum
Average
Quantity
Std. Dev.
Variance
Air flow
Air Pressure Air temperature
m³/h
Bar
°C
583,00
8,90
72,50
594,00
8,90
72,60
590,00
8,90
72,70
551,00
8,90
72,40
550,00
8,90
72,20
564,00
8,90
72,20
565,00
8,90
72,30
570,00
8,90
72,40
567,00
8,90
72,40
549,00
8,90
72,40
526,00
8,90
72,20
544,00
8,90
72,00
772
517,00
883,00
623,409
772
8,80
9,20
8,915
772
62,50
79,20
73,282
98,733
9748%
0,049
00%
2,089
004%
This sheet can be printed or saved or e-mailed as an Excel compatible sheet.
Page 40 of 60
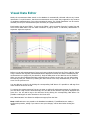
Visual Data Editor
Mostly the measurement data stored in the database is automatically collected without any human
intervention. It could however, that those measurements are not what they supposed to be, because
of equipment malfunctioning or any other exceptional reason. The ‘Visual Data Editor’ can be used to
manually correct your measurements quick and easily in a graphical manner.
Each location has its own ‘Editor’. To pop-up the ‘Editor’, select a location from the ‘Location’-list and
select ‘Visual Data Editor’ from the ‘Edit->Locations’ or pop-up menu. To edit data, administrator or
supervisor rights are required.
Before you can edit measurements of a tag you have to select the tag from the ‘Tag to edit’ list. When
a tag is selected the originally collected data will be displayed as a blue line and the modified/current
measurements as a purple line (the data line). Only the data points of the data line can be modified.
When you are done modifying/verifying a tag and want to continue to the next, you can either select
the next tag with your mouse or by clicking the ‘Alt’ & ‘Down arrow’ keys simultaneously or ‘All’ & ‘Up
arrow’ for the previous one.
You can add tags to the list by clicking the corresponding ‘Add’-button. It’s possible to add tags from
other locations to the list as well.
To compare the measurements of the tag you want to edit/verify with measurements of a similar tag,
you can select a tag from the ‘Reference tag’ list. The data of the reference tag will be displayed as a
green line. You can add a tag to the reference list by clicking the corresponding ‘Add’-button. Its
possible to add tags from other locations to the list as well
Only ‘Administrators’ are allowed to add/remove tags to/from the lists.
Note: Modifications are not posted to the database immediately. If modifications are made, a
confirmation question, asking if you want to save your changes, will be raised when closing the
‘Editor’.
Page 41 of 60
Single point mode
Data points are displayed as small dots, to change the value of a data point, select the data point with
your mouse, click and hold the left mouse button while dragging the data point to the wished value.
Data points can be dragged vertically only.
To select an individual data point, move the mouse cursor near the data point until it is snapped by
the vertical solid hairline (The ‘Data line point’ box at the right bottom site of the chart, will display its
timestamp and value). You can also select the next data point by clicking the ‘Alt’ & ‘Right arrow’
simultaneously or ‘Alt’ & ‘Left arrow’ for the previous one.
When a data point is snapped by the vertical hairline, you can delete the data point by clicking the
‘Ctrl’ & ‘Del’ keys simultaneously.
You can manually add data points, by moving your mouse to the wished X, Y position (time, value) in
the chart window followed by clicking the left mouse button or ‘Ins’ key while holding the ‘Shift’ key.
Range of values mode
If multiple points have to be modified, dragging single data points to their wished values can be time
consuming. In ‘Range of values’ mode you can specify a certain range (period of time) on which you
want to perform your modification operations. The range on which a modification operation is
performed is determined by the so-called ‘Base line’. You can add ‘Anchor point’ to the ‘Base line’, by
moving your mouse to the wished X, Y position (time, value) in the chart window followed by clicking
the left mouse button or ‘Ins’ key while holding the ‘Shift’ key.
When an ‘Anchor point’ is snapped by the vertical hairline, you can delete the ‘Anchor point’ by
clicking the ‘Ctrl’ & ‘Del’ keys simultaneously.
The range on which a modification operation is performed, is the time between the ‘Anchor point’ with
the youngest timestamp and the one with the oldest, but must be within the visible part of the charts
X-axis (time-axis).
The following 6 operations are possible:
1. Delete above base line, data points above the base line will be deleted.
2. Delete below base line, data points above the base line will be deleted.
3. Follow base line, the value of a data point will be set to the interpolated value between the two
nearest surrounding anchor points, so the data line will follow the base line.
4. Follow reference line, the value of a data point will be set to the interpolated value between
the two nearest surrounding reference points, so the data line will follow the reference line.
5. Merge from reference, the data line will be extended with points from the reference line, with
timestamps not existing in the data line
6. Restore from original, all existing data points will be deleted and replaced by the original
collected data points
Page 42 of 60
Data Import Wizard
Mostly the measurement data stored in the database is automatically collected without any human
intervention. It could however, because of equipment malfunctioning or any other exceptional reason,
that you have to import measurements from text files. The ‘Date Import Wizard can be used to
manually import measurements from tabular oriented text files (like CSV files). The files should
contain <line feed> or <carriage return> terminated rows and each row should contain an equal
number of columns, with (a) date/time column(s) and separated columns for each individual
measurement parameter. In example a separated column for ‘Temperature’ and ‘Level’.
Each location has its own ‘Import Wizard’. To pop-up the ‘Wizard’, select a location from the
‘Location’-list and select ‘Data Import Wizard’ from the ‘Edit->Locations’ or pop-up menu. To import
data, administrator or supervisor rights are required. The import properties are saved after a
successfully completed import, so you don’t have to specify them again for a next import.
After selecting a file to import the “Wizard” pops-up and will show the contents on the ‘Raw data’page. Please study the contents of this page first, its needed to be able to configure the correct
import properties.
A file may start with one or more header rows, giving info about the process generated the file and/or
describing the columns in the file.
Columns in a file can be separated by each other by means of a separation token (e.g. a ; or space)
or starting at fixed character positions.
Please study the date/time format as well. A lot of different notations exists (e.g. d/m/y h:n:s or
mmddyyhhnnss or yyyy/mm/dd hh.nn)
Verify also which character is used for the decimal separator.
When done, click the ‘Next’-button to go to the ‘File format’-page.
Page 43 of 60
File format
Data presentation
Specify the ‘Field separator’, the character that is used to separated the different columns in the file or
choose ‘Fixed positions’ if the columns are starting at fixed positions.
Specify the character that is used for the ‘Decimal separator’ in floating point numbers.
The ‘Wizard’ can be used to import numbers only, but it could be that the file contains text columns as
well. Text columns are normally (because they could contain tokens equal to the ‘Field separator’)
enclosed between ‘Text markers’. Please specify which ‘ character is used as the ‘Text marker’.
Date/Time format
Timestamps can be notated in several formats, please pick a matching format from the list or edit one
yourself. Use the following characters for the date part y (year), m (month), d (day) and use the
following characters for the time part h (hour), n (minute), s (second).
You can specify a ‘Time zone offset’ in hours, in case the timestamps in the file are not matching your
time zone. This offset is added to the imported timestamps.
Row settings
A file may start with one or more header rows giving info about the process generated the file and/or
describing the columns in the file.
1)
2)
3)
4)
5)
Names row, a row specifying a name for each column. Set to 0 if such a row does not exist.
Codes row, a row specifying a code for each column. Set to 0 if such a row does not exist.
Units row, a row specifying a unit for each columns. Set to 0 if such a row does not exist.
First record row, the row in the file where the first data record starts.
Last record row, a file may contain one or more footer rows giving info about the process
generated the file. To avoid import failures, specify where the last record row occurs counted
from the bottom of the file.
Page 44 of 60
A file may contain several informational rows (not part of the header or footer rows), which are not
containing valid importable record data. To avoid import failures while trying to import such rows,
filters can be specified to include or exclude those rows. A row is included if it contains at least one of
the “include phrases” (leave blank if all records should be included). A row is excluded if it contains
any of the “Exclude phrases” (leave blank if none of the records should be excluded). Phrases are
separated by each other with spaces. If a phrase exits out of multiple words, the phrase should be
enclosed between single quotes.
When done, click the ‘Next’-button to go to the ‘Column properties’-page.
Column properties
The ‘column properties’page is used to specify
which columns from the file
you want to import.
A file may contain several
columns, but only a few of
them could be interesting
for importing.
Timestamp columns
Each record to import should have a timestamp specifying the time at which the values in the row are
acquired, measured or recorded. Please specify which column is used for the date-part and which for
the time-part. If the data- and time-parts are combined in one column, then please specify the same
column for both of them. The example value (taken from the first record row) should show a valid
date or time value.
Tag columns
To be able to import the data of a column, the column must be assigned to a ‘Tag’ in the database.
You can select a corresponding tag from a list listing all the tags of the particular location. If a
corresponding tag is not in the list the ‘Wizard’ can create one for you during import, the new tag will
be created with the ‘Name’, ‘Code’ and ‘Unit’ as specified by you or taken from the import header
rows. When specified the right column, the ‘example value’ should show an ‘expected’ value from the
first record row.
NOTE: It might be that the values in the import file are not in the expected engineering values
matching the corresponding tag. You can specify a factor, offset and conversion table to convert the
raw device values to expected engineering units. If you select an existing tag from the database, the
factor, offset and conversion table settings will be copied from the corresponding tag. If however the
values in the file are already in the expected engineering units set factor to 1, offset to 0 and
conversion table to ‘none’.
When done, click the ‘Next’-button to go to the ‘Preview’-page.
Page 45 of 60
Preview & Import
After specifying the correct import properties, the ‘Preview page’ should display a tabular preview of
the selected data you want to import. If the ‘Preview page’ appears without any errors and you have
verified that the data is matching your expectations, you can start the actual import process by
clicking the ‘Import’-button. Importing can take a few minutes depending of the amount of data to be
imported.
Page 46 of 60
DATABASE
Promis deploys an open database (ADO/OLEDB) to store its data. The default database as
automatically installed with the setup is an Ms-Access database
(C:\ Projex\promis\database\promis.mdb).
However It’s also possible to use an SQL-Server or Oracle database.
To use a licensed Oracle or SQL-Server database, you have to ask your DBA (Database administrator)
to create an empty database. Promis itself will create the necessary tables.
When clicking the ‘Change Data Source’-button in the
Promis Login screen you can change the database
(Data Source) used by Promis.
A Data Source can be specified by its ADO (Microsoft Acces Data Objects) connection string. Database
systems like SQL-Server require that you specify authentication info to get access to the database.
Please ask your DBA for the right info.
Click the ‘Edit…’-button to Edit the
existing connection string within a
configuration
window
of
the
according provider.
Click the ‘New’’-button if you want
to choose another type of database
provider.
ADO Connection string examples:
Ms-Access (Microsoft Jet 4.0 OLE DB Provider):
Provider=Microsoft.Jet.OLEDB.4.0;Data Source=c:\ Projex\promis\database\promis.mdb;
In case your MS-access file got too big or corrupted, you can try to compact/repair it by
clicking the ‘Compact/Repair’-button.
SQL-Server (Microsof OLE DB Provider for SQL Server):
Provider=sqloledb;Data Source=<Server>;Initial Catalog=<Database>;
SQL-Server (SQL Native Client, preferred if installed on your system):
Provider=SQLNCLI.1;Data Source=<Server>;Initial Catalog=<Database>;
Oracle 11g Express(Oracle Provider for OLEDB):
Provider=OraOLEDB.Oracle.1;Persist Security Info=False;User ID=promis;Data
Source=<Server>:1521/xe
Oracle 11g (Oracle Provider for OLEDB):
Provider=OraOLEDB.Oracle.1;Persist Security Info=False;User ID=promis;Data Source=<Database>
Where <Server> is the IP address or name of the computer running the database server,
<Database> the name of the SQL-server database or Oracle TNS.
Page 47 of 60
MS-Access
When using Ms-Access, the physical database size is limited to 2GB and therefore the maximum
number of measurement records that can be stored is approximately 45 million. When logging only
one tag with a frequency of 1 measurement per minute, you will be capable to log for 85 years,
before the database reaches its limits. This looks long, but if you log 85 tags once per minute, the
database will reach its limits within 1 year. To avoid these limitations a licensed database server
should be used (e.g. SQL-Server 2012 Web Edition or Oracle 11g Standard Edition).
To prevent your database from overloading you can:
1) Regularly backup the database (see: chapter Database backup) and delete old data in order
to create space for future records.
2) Specify in the ‘conversion & logging’-properties of a tag, that you automatically want to delete
the measurement records of the concerned tag if they are older than a certain amount of
days.
Note: Ms-Access can’t reach the 45 million measurements record limit without regular database
maintenance as Ms-access does not free temporarily used disk space and is vulnerable for unexpected
power outages as well. You should perform a “Compact/Repair database” at a regular bases to
reclaim unused disk space or to try to recover from odd database behavior.
SQL-Server
When using SQL-Server Express, the physical database size is limited to 10GB and therefore the
maximum number of measurement records that can be stored is approximately 120 million. When
logging only one tag with a frequency of 1 measurement per minute, you will be capable to log for
225 years, before the database reaches its limits. This looks long, but if you log 225 tags once per
minute, the database will reach its limits within 1 year. To avoid these limitations a licensed SQLServer database server should be used (e.g. SQL-Server 2012 Web Edition).
To prevent your database from overloading you can:
1) Regularly backup the database (see: chapter Database backup) and delete old data in order
to create space for future records.
2) 2) Specify in the ‘conversion & logging’-properties of a tag, that you automatically want to
delete the measurement records of the concerned tag if they are older than a certain amount
of days.
Installing SQL-Server Express
1. From mircosoft.com download and install “SQL-Server Express with tools”. When asked for
during installation choose Express and not LocalDB.
2. Start the ‘SQL Server Management Studio’, connect to your local database engine
(<computer name>\SQLEXPRESS) using ‘Windows Authentication’.
3. In the ‘Object Explorer’ right mouse click ‘Databases’ and click ‘New database’ and give the
database a name (e.g. YOURDATABASE).
4. In the ‘Object Explorer’ right mouse click ‘Databases->Logins->sa’ and click ‘Properties’.
5. Select the ‘General’-page, choose ‘SQL-server Authentication’ and specify a password for the
‘sa’ login (e.g. yourPassword)
6. Select the ‘Status’-page, enable the login and grant it connect permission.
7. Start Promis and change the data source connection string to:
Provider=SQLNCLI11.1;Integrated Security=;Persist Security
Info=False;User ID=sa;Initial Catalog=YOURDATABASE;Data
Source=.\SQLEXPRESS;
8. Specify as database credentials, User: sa and Password: yourPassword
Page 48 of 60
Oracle 11g
When using Oracle 11g Express, the physical database size is limited to 11GB and therefore the
maximum number of measurement records that can be stored is approximately 125 million. When
logging only one tag with a frequency of 1 measurement per minute, you will be capable to log for
235 years, before the database reaches its limits. This looks long, but if you log 235 tags once per
minute, the database will reach its limits within 1 year. To avoid these limitations a licensed Oracle
database server should be used (e.g. Oracle 11g Standard Edition).
To prevent your database from overloading you can:
1) Regularly clean up the database (File menu->Database->Clean up) by deleting old data in
order to create space for future records.
2) Specify in the ‘conversion & logging’-properties of a tag, that you automatically want to delete
the measurement records of the concerned tag if they are older than a certain amount of
days.
Installing Oracle 11g Express
1. From Oralce.com download and install “Oracle 11g Express”. During installation you are
asked to specify a password for the ‘SYSTEM’ account. Please note and don’t forget it. For
now we assume the password is yourPassword.
2. From Oracle.com download the “32-bit Client Software” as well and install the “Oracle OLEDB
driver”.
3. Start the Oracle SQL command prompt:
C:\oraclexe\app\oracle\product\11.2.0\server\bin\sqlplus.exe /nolog
4. Login to Oracle
SQL>CONNECT SYSTEM as SYSDBA;
5. Enter your SYSTEM password: yourPassword
6. Create a user for the promis database
SQL>CREATE USER promis IDENTIFIED BY yourPassword DEFAULT TABLESPACE
USERS;
7. Note: The term “DEFAULT TABLESPACE USERS” is very imported, otherwise all your data
will be stored in the “TABLESPACE SYSTEM”, which has limited space causing your database
to bloat after 3 million measurement records.
8. Grant rights to the user
SQL>GRANT CONNECT, RESOURCE TO promis;
9. Optional steps to prepare Oracle Express to allow online backup (backup while the database
is in use)
a. SQL>SHUTDOWN IMMEDIATE;
b. SQL>STARTUP MOUNT;
c. SQL>ALTER DATABASE ARCHIVELOG;
d. SQL>ALTER DATABASE OPEN;
e. SQL>ALTER SYSTEM SET DB_RECOVERY_FILE_DEST_SIZE = 16G;
10. Start Promis and change the data source connection string to:
Provider=OraOLEDB.Oracle.1;Persist Security Info=False;User
ID=promis;Data Source=localhost:1521/xe;
11. Specify as database credentials, User: promis and Password: yourPassword
Page 49 of 60
Database backup
In case you don’t make use of a sophisticated database server with features like database mirroring
and automated backups, it is recommend to regularly backup the database manually or automatically
(see Chapter Backup Service).
To backup your database manually select the ‘backup’ option from the Promis ‘File’-menu.
Ms-Access: You can back up the database to or restore from ms-access files (*.mdb).
SQL-Server: You can back up the database to SQL-server backup files (*.bak) and restore from SQLserver backup files as well as ms-access files. The purpose of restoring from ms-access files is to
setup your initial database from an ms-access template database.
Oracle: You can’t backup or restore your database from Oracle backup files, please use the
backup/restore tools that comes with Oracle. You can however setup your initial database by restoring
from an ms-access template database.
Attention 1: When backing up, the entire backup database will be cleared and all existing data,
tables and indices will be erased. After a successful backup, the backup database will be an exact
copy of the original database. When using the default backup database you can copy the
promisbackup.mdb file to where ever you like in order to archive consecutive backups. If you want to
consult the data of an old backup, you could install a free version of Promis on another system and
Restore the backup on that system.
Attention 2: To avoid that your database will reach its physical size limit, you can specify that data
older then a certain time (e.g. 1 month, 2 years, etc…) should be deleted after a successful
completion of the backup operation. When using Ms-Access you should perform a “Compact/Repair”
afterwards to let Ms-Access free unused physical disk space.
Database structure
The database exists out a lot of table of which most are meant for visualization and organization of
the data. Normally a database administrator (DBA) does not have to bother about this structure as it
is maintained by Promis itself. In case of a corporate database server, all the DBA has to do is create
and empty database and assign a database user with full rights to Promis.
Filling the database is performed by Promis data collectors, which are aware of the database
structure. Filling the database with non Promis data collectors is possible but not advised as they
could cause corruption of the internal organization.
Page 50 of 60
Reading historical data from the database is easy as all collected measurements are stored in just one
table, named: “measurements”.
The “measurements” table contains records with just three fields:
1. TAGID, an integer identifying the ID of the tag of a recorded value.
2. TIMEOFMEASUREMENT, a date/time value specifying the time at which a value is recorded
by the data acquisition source.
3. MEASUREDVALUE, a floating point value representing the value recorded by the data
acquisition source at the given TIMEOFMEASUREMENT.
Information about what is measured and where measurements are taking place is stored in the tables
“tags” and “locations”.
A location specifies where measurements are taking place. The “locations” table contains records with
multiple fields, but just three of them are of interest when reading historical data.
1. LOCID, an integer value to uniquely identify each location, this ID is automatically generated
by Promis or its data collectors at initial creation of the location.
2. LOCNAME, a user defined readable string representing the name of the location
3. LOCCODE, a user defined string to uniquely identify a location by the users own codification
(e.g. TANK_001, FRIDGE_005, etc.) Not all locations have to host measurements as some of
them can be meant for (hierarchical)organization only. To make querying for locations of
interest easy, you could agree that the LOCCODE of all locations hosting actual measurements
are starting with a certain prefix (e.g. TANK_).
A tag specifies what is measured (e.g. temperature, flow, etc.). The “tags” table contains records
with a lot of fields, but just a few of them are of interest when reading historical data.
1. LOCID, an integer value to identify the location where the measurements are taking place.
2. TAGID, an integer value to uniquely identify each individual tag, this ID is automatically
generated by Promis or its data collectors at initial creation of the tag.
3. TAGNAME, a user defined readable string representing what you are measuring (e.g.
Temperature)
4. TAGCODE, a user defined code to specify what is measured (e.g. TEMP_C, VOLUME_M3,
etc.) To make querying for tags of interest easy, you could agree upon a certain codification
(e.g. TEMP_C for Temperature in °C)
5. MINRANGE, MAXRANGE, floating points giving the minimum and maximum range of the
measured values (e.g. -30 to +70°C)
6. LOLIM, LOLOLIM, HILIM, HIHILIM, floating points giving the low(-low) and high(-high)
limits of the measured values.
Example query, a query to get all temperature (TEMP_C) readings from all refrigerators (FRIDGE_)
between Aug-12-2013 10:00 and 11:00, could look like:
SELECT LOCCODE, TAGCODE, TIMEOFMEASUREMENT, MEASUREDVALUE
FROM MEASUREMENTS, TAGS, LOCATIONS
WHERE
LOCATIONS.LOCCODE like ‘FRIDGE_%’ AND
TAG.LOCID=LOCATIONS.LOCID AND TAGS.TAGCODE=’TEMP_C’ AND
MEASUREMENTS.TAGID=TAGS.TAGID AND
MEASUREMENTS.TIMEOFMEASUREMENT>=’08/12/2013 10:00:00’ AND
MEASUREMENTS.TIMEOFMEASUREMENT<’08/12/2013 11:00:00’
Page 51 of 60
DATA COLLECTOR MANAGER
The ‘Data Collector Manager’ is used to input measurements from ‘Data Acquisition’-sources, like OPC
servers, XML servers, serial devices and text files. Promis comes standard with drivers for MODBUS,
SMS, ASCII, OPC and XML
To configure/start the ‘Data Collector Manager’, please click from the ‘Menu’-bar->Control->Start
Promis Collector Manager and the following screen will pop-up:
Depending of the type of ‘DAQ’-source one collector can behave more intelligent then another. For
instance if a ‘DAQ’-source has the capability to provide the collector with device tag/channel info, then
the collector manager is capable to automatically create a Promis location and assign Promis tags to
device tags/channels. If the ‘DAQ’-source cannot provide the collector with proper device tag/channel
info (e.g. a generic MODBUS device). Then a Promis location should be created and bound to the
collector manually and Promis tags must be linked to their corresponding device tags/channels
manually as well. However locations and tags may always be bound manually. It is allowed to link
multiple Promis tags to the same device tag/channel and bind multiple Promis locations to the same
‘DAQ’-source.
After clicking ‘Start Collector Manager’ you can choose to run it as a ‘Service’ or as an ‘Application’.
When started as a ‘Service’ the first time, the ‘Collector Manager’ will be installed as a system service.
System services will automatically start after re-boot, this assures that data collection will continue
even after an un-attendant re-boot (e.g. after a power-failure).
When the ‘Collector Manager’ is running visible, you can hide it by clicking the ‘close-cross’ and a small
icon in the ‘Windows’ icon tray will occur (right bottom corner). Clicking this icon will pop it up again.
When the ‘Collector Manager’ is running it will start scheduling collection moments. If you want to
introduce an intermediate collection, you can right-click with your mouse on ‘Collector’ and initiate a
‘Manual Collection’.
Page 52 of 60
Collector Properties
For each collector an automatic read-out
schedule can be applied, ranging from
once per minute to several weeks. The
next read-out date/time specifies when
the next read-out should take place. This
date/time will automatically be shifted,
each time a scheduled collection has
been performed successfully. Setting this
date/time to the future will delay
(obviously) the next read-out till that
date/time, setting this date to the paste,
will start the data collection a.s.a.p.
De pending on the type of ‘DAQ’-source
you can let the ‘Collector Manager’
automatically add (new) tags to Promis.
The ‘Collector Manager’ supports four
types of connections.
1) Local serial connection, for serial
devices/busses connected to a local
communication port.
2) Remote serial connection, for serial
device/bussus which can be accessed
via a PSTN or GSM phone network
3) An on-line network connection,
commonly used to access TCP/IP enabled devices (e.g. a MODBUS/TCP slave) or TCP/IP services
(e.g. an E-mail or FTP-server).
4) TCP-server connection, the Collector Manager acts as TCP-server and TCP-client devices can
connect to it. See the next chapter for details.
For each collector an appropriate driver should be selected and configured. Configuration of the driver
properties is driver specific. E.g. for a MODBUS driver you must specify the ‘slave address’ of the
MODBUS device. For an OPC-Server you must specify the server and the system hosting the server.
For an XML-Server you must specify the type of transfer protocol (http, ftp or file) and the URL of the
XML-file to be processed.
TCP-server connection
GPRS or UMTS is a perfect and cost effective replacement for legacy PSTN/GSM MODEM
communication. The problem is that mobile internet devices mostly don’t have fixed IP-addresses and
therefore not easily remotely accessible. If the mobile device is smart enough, it can use “Dynamic
DNS” to link its dynamic IP-address to a fixed domain name every time it connects to internet. In that
case the device should a) maintain a “Dyn DNS” subscription, b) should be connected 24/7 to be
remotely accessible, c) needs security provisions as it’s TCP-server is 24/7 online and accessible from
anywhere.
Page 53 of 60
To solve the above situations the remote device should act as a TCP-client and connect to the TCPserver of the Collector Manager. When connected the Collector Manager will use the appropriate
collector/driver to read-out the remote device. Because the remote device does not have to host a
TCP-server it can stay (if it has sufficient power) 24/7 connected without being vulnerable for hacker
attacks.
Port# The TCP-port the Collector
Manager should listen at. You can
(and its preferable) define the same
port for all your collectors with the
same driver type.
DAQ-unit ID As IP-addresses are mostly dynamic, the Collector Manager cannot detect the origin of
the DAQ-unit by its IP-address. However some DAQ-units are foreseen with an unique or configurable
unit ID. The Collector Manager’s “DAQ-unit recognizer” mechanism can be used to recognize a DAQunit by sending a command to requests its unit ID. You can define one “DAQ-unit recognizer” per
TCP-port.
If a particular DAQ-unit protocol does not support “ID recognition” (e.g. simple humidity transponder)
or no “DAQ-unit recognizer” is defined, the remote device should sent an identification string as first
directly after connecting to the server. The remote device should sent the string including the
surrounding square brackets [ ]. You should treat the DAQ-unit ID as a strong password and
avoid for security reasons the choosing of obvious names. If you want to use an ID like
‘STATION1’ please add a kind of arbitrary verification code to it, like in this case ‘_AE762345’. In this
example the remote device should sent the string: [STATION1_AE762345] on connect.
If the remote device is a legacy serial device it can be connected to the internet with
a GPRS-DTU or GPRS-router with DTU-port (DTU = Data Terminal Unit or
transparent Serial to TCP converter).
Please choose a DTU or Serial to TCP converter that is capable of sending a user
defined string on connect.
The disadvantage of mobile internet devices is that they are not easily accessible for remote
configuration. However we have implemented an “Intercept” mechanism to make remote
configuration possible. If you connect to the server with HyperTerminal or any other TCP-terminal
emulator and you type (within 8 sec.) the Intercept command, then the next time the remote device
connects, all communication will be redirected to your terminal window and vice versa.
The intercept command is: [INTERCEPT:<DAQ-unit ID>] in example
[INTERCEPT:STATION1_AE762345] and if accepted your terminal will display while waiting for the
client [INTERCEPTING:<DAQ-unit ID>] or [INTERCEPTED:<DAQ-unit ID>] when connected.
Page 54 of 60
Backup Service
In case you don’t make use of a sophisticated database server with features like database mirroring
and automated backups, it is recommend to regularly backup the database manually (see Chapter
Database Backup) or automatically.
The Backup Service is meant for backing-up an Ms-Access or Ms-SQL-Express automatically at regular
intervals (e.g. every day at 07:00) to disk or removable media (e.g. USB-stick). Oracle is not
supported by the ‘Backup Service’.
To configure/start the ‘Backup Service’, please click from the ‘Menu’-bar->Control->Start Backup
Service and the following screen will pop-up:
Schedule: Specify the backup interval and the date and time when you want the next backup to take
place. If a backup fails it is retried every 5 minutes. If a backup succeeds the next backup will be
scheduled one interval further.
Backup file name format:
The file name of a backup file may start with a certain prefix and end with a certain trail, the file name
extension is fixed (.mdb for Ms-Access and .bak for Ms-SQL). The part between prefix and trail can be
formatted based on the ‘Backup time’. The default format, to prevent your disks becoming
overloaded with backup files, is yyyymm (e.g. 201104), which will cause max. one backup file per
month, even when backing up every day. If a backup file already exists, it will be overwritten with the
new one with the same name.
The Date/Time part format string is composed from specifiers that represent values to be inserted into
the formatted string. Some specifiers (such as "d"), simply format numbers or strings. Other specifiers
(such as "/") refer to locale-specific strings from global variables.
Page 55 of 60
In the following table, specifiers are given in lower case. Case is ignored in format specifiers.
Specifier
d
dd
ddd
dddd
m
mm
mmm
mmmm
yy
yyyy
Displays
Displays the day as a number without a leading zero (1-31).
Displays the day as a number with a leading zero (01-31).
Displays the day as an abbreviation (Sun-Sat) using the strings given by the
ShortDayNames global variable.
Displays the day as a full name (Sunday-Saturday) using the strings given by the
LongDayNames global variable.
Displays the month as a number without a leading zero (1-12). If the m specifier
immediately follows an h or hh specifier, the minute rather than the month is displayed.
Displays the month as a number with a leading zero (01-12). If the mm specifier
immediately follows an h or hh specifier, the minute rather than the month is displayed.
Displays the month as an abbreviation (Jan-Dec) using the strings given by the
ShortMonthNames global variable.
Displays the month as a full name (January-December) using the strings given by the
LongMonthNames global variable.
Displays the year as a two-digit number (00-99).
Displays the year as a four-digit number (0000-9999).
Save backup to: Specify the location where a backup file should be saved to, this can be a fixed
location on a (network) disk or this could be a removable media storage (e.g. an USB-stick).
In case of saving to a removable media, the backup file will be saved to the removable media with the
lowest ‘Driver’-letter. E.g. if two USB-sticks are connected one with ‘Driver’-letter E:\ and one with F:\
the backup file will be written to E:\.
As soon as a removable media is attached and the next backup schedule date was already reached,
the Service will immediately start to backup to the removable media. When a backup to a removable
media is completed the service will play the Windows confirmation sound or the Windows warning
sound in case of an error. Errors are logged to promisbackup.log and also passed to Projex Messenger.
Delete old data: To avoid that your database will reach its physical size limit, you can specify that
data older then a certain time (e.g. 1 month, 2 years, etc…) should be deleted after a successful
completion of the backup operation.
Starting the Backup Service: After closing the
properties screen, you can choose to run the backup
utility as a ‘Service’ or as an ‘Application’. When
started as a ‘Service’ the first time, the ‘Backup
Service’ will be installed as a system service. System
services will automatically start after re-boot, this
assures that it starts running even after an unattendant re-boot (e.g. after a power-failure).
If a backup has to be made to a network shared disk,
this disk may not be available to every user. Default
the ‘Service’ logs in as a "System account". If the
"System account" has no rights to the shared
network disk, you could setup the service to logon as
a different user with the proper rights.
Page 56 of 60
MODBUS Server
The ‘MODBUS Server’ is used to turn a PC running Promis into an MODBUS-RTU slave device. The PC
will by means of a serial port be connected into an MODBUS-RTU network, where a MODBUS-RTU
master can query for recent/actual values of certain Promis tags.
To configure/start the ‘MODBUS Server’, please click from the ‘Menu’-bar->Control->Start Promis
MODBUS Server and the following screen will pop-up:
After clicking ‘Start MODBUS Server’ you can choose to run it as a ‘Service’ or as an ‘Application’.
When started as a ‘Service’ the first time, the ‘MODBUS Server’ will be installed as a system service.
System services will automatically start after re-boot, this assures that it starts running even after an
un-attendant re-boot (e.g. after a power-failure).
When the ‘MODBUS Server’ is running visible, you can hide the ‘MODBUS Server’ by clicking the ‘closecross’ and a small icon in the ‘Windows’ icon tray will occur (right bottom corner). Clicking this icon
will pop it up again.
Properties
Communication port: Specify the serial communication port the ‘MODBUS Server’ should listen at
for incoming requests from a MODBUS-RTU master.
Note: ‘MODBUS/TCP’ and ‘MODBUS/RTU over TCP’ can be selected as well.
Baud rate: The default baud rate is 9600, all other serial communication parameters are set to fixed
values: 8 data bits, 1 stop bit, no parity and no handshake.
Slave address: The MODBUS Server does not have to be the only MODBUS-RTU slave in the
MODBUS-RTU network. Different slaves can be distinguished from each other, by giving them all a
unique slave address between 0 and 255, the default is 1.
Page 57 of 60
Refresh map every: Specify at which interval the MODBUS register map should be refreshed with
the most recent/actual values from the Promis database.
Expose values as: MODBUS is a protocol to read/write certain portions of an addressable memory,
an area consisting out of up to 65536 WORD (2 bytes) registers. The MODBUS protocol does not
specify how this area should be formatted.
The memory area of the ‘MODBUS Server’ starts at holding register# 0x0000 (40001) with the recent
value of the first selected Promis tag. At which register the recent value of the next tag starts depends
on how many WORD registers are used to represent a recent value. Some MODBUS masters can deal
with short integer numbers (using 1 WORD register per value) only, while others can deal with double
precision floating point numbers (using 4 WORD registers per value). A maximum of 1000 tags can be
published thru the ‘MODBUS Server’.
The following types can be specified:
Type
short
float
Range
-32768
+32767
-2.147.483.648
+2.147.483.647
IEEE754 32-bit
double
IEEE754 64-bit
integer
Length
1 WORD
Remarks (First tag starts at register# 0)
Second tag starts at register# 1
n-th tag starts at register# n
2 WORDs Second tag starts at register# 2
n-th tag starts at register# (2n)
2 WORDs Second tag starts at register# 2
n-th tag starts at register# (2n)
4 WORDs Second tag starts at register# 4
n-th tag starts at register# (4n)
Most significant WORD first: For values consisting out of multiple WORDS (e.g. float) some
MODBUS masters wants to have the most significant WORD first and others as last.
Each tag has a Status WORD register as well, the Status register of the first tags starts at holding
register 0x2000 (48193), the next at 0x2001 (48194), etc…
The Status WORD can exists out a combination of bits
Bit
Bit
Bit
Bit
0
1
2
3
(0x0001)
(0x0002)
(0x0004)
(0x0008)
Value not recorded in time
Minimum range exceeded
Low-low limit exceeded
Low limit exceeded
All 0 (0x0000)
Bit 4 (0x0010)
Bit 5 (0x0020)
Bit 6 (0x0040)
Okay
High limit exceeded
High-high limit exceeded
Maximum range exceeded
MODBUS Register mapping:
Use the MODBUS register mapping to define which tags from the Promis database should be included
in the MODBUS memory area. The order in this list determines where the value will appear in the
memory area. The order, in which the values appear should be in accordance with the master, so be
careful with changing the order or deleting tags from the list.
The value registers are starting at holding register address 0
In case of shorts or integers, decimal numbers lose their fractions, but by specifying a factor (when
adding a tag to the map) decimal numbers could be represented as values multiplied by 10, 100,
1000, etc. (E.g. a temperature of 25.23 C could be represented as 2523 C/100).
Page 58 of 60
Messenger (Alarm management)
If the alarm management system Messenger is installed alarms (high or low limit violations or if values
are not recorded in time) can be passed to the Messenger, which takes care of dispatching the alarm
to the right person. A license free version of the Messenger supports the dispatching of alarms to at
max. 4 different recipients. Alarms can be send via e-mail, SMS (GSM Modem required) or to other
PC’s running Messenger. Passing alarms to the Messenger is switched off by default. To enable
passing of alarms to the Messenger select ‘Start alarm scanner’ from the ‘Control’-menu. The ‘Alarm
scanner’ is a service that will run in the background and keeps running even if you close Promis and
will start running after a re-boot automatically. To stop the ‘Alarm scanner’ select ‘Stop alarm scanner’
from the ‘Control’-menu.
The ‘Messenger’ is provided with a hierarchical fallback mechanism to ensure that alarms are being
noticed.
Messages can be introduced in the
system at different levels. When a
message is introduced at a certain
level, a list will be built of all recipients
assigned to that level and who are
scheduled at that time. The message
will be sent to the first recipient in the
list, which must respond within a
certain amount of time. If he does not
respond in time, the message will be
sent to the next recipient, etc. If
nobody has responded at all, the list
can be tried again and again. If still
nobody has responded, then the nonscheduled recipients will be tried once.
If still nobody has responded or if
there are no recipients assigned to
this specific level, the recipients at the
parent level will be tried, etc. etc. until
the recipients assigned to the
‘Dispatchers Default’ level.
All categories
Dispatcher D efault
Operator
Support
R &D
Management
All categories
Monito r
Operator
Support
R& D
Management
Al l cat egori es
Level 1
Oper ator
S uppor t
R&D
Al l cat egori es
M anagement
Level 1. 1
Operator
Support
R& D
Management
To be able to distinctively dispatch alarms for each individual tag, an alarm is passed to the
Messenger with a (sub)process path. Alarms appear in Messenger under ‘Local Monitor’ and with
(sub)process name “promisALARM” and for each Promis (sub)location appended with its ‘Location
Code’ and finally append with the ‘Tag Code’ of the concerned tag and the type of violation that
occurred (UNDERRUN for a low limit violation, OVERRUN for a high level violation and TIMEOUT if a
value is not recorded in time).
Let’s assume a low-level pressure violation of a compressor at Promis location “Location A/Site
1/Production/Hall 1/Compressor”, than the (sub)process path passed to the Messenger might look
like: “promisALARM/LOCA/S1/PRO/H1/COMP/PRESS/UNDERRUN”
The ‘Messenger category’ for UNDERRUN/OVERRUN alarms is ‘Operator’ and the ‘Messenger
severity’ is ‘Warning’ in case of low or high limit violations and ‘Error’ in case of low-low or high-high
limit violations.
The ‘Messenger category’ for TIMEOUT alarms is ‘Support’ and the ‘Messenger severity’ is ‘Error’.
Page 59 of 60
Integrated WebServer
Promis has an integrated WebServer. When this WebServer is started, the information stored in the
Promis database can be consulted via a WebBrowser from any computer that has access to the Promis
WebServer either via an Intranet or Internet. The “Promis Standard WebServer” license, which is
included in a regular Promis license, enables a user to view recent values and pop-up a trend of a
single tag over the last 24h. The “Promis Extended WebServer” license enables the user to view
charts, reports and long term history.
To enable the WebSever select ‘Start WebSever’ from the ‘Control’-menu. The ‘WebServer’ is a service
that will run in the background and keeps running even if you close Promis, and will start running
after a re-boot automatically. To stop the ‘WebServer’ select ‘Stop WebServer’ from the ‘Control’menu.
To consult the Promis WebServer, open a WebBrowser and type in the address bar of the Web
Browser the name or IP address of the computer running the WebServer.
The WebServer listens by default to TCP port # 80. But this could be conflicting if you have already
running another WebServer (e.g. Microsoft Internet Information Server) on your system. The default
TCP port# can be changed to any other value (ask your network administrator for a suitable number,
to avoid problems with other applications or firewalls). When the port number is not set to 80, you
have to provide the port number in the URL (e.g. http://127.0.0.1:81 )
If reports using HTML5 Canvas rendering don’t show up, it could be that your browser does not
support the HTML5 Canvas element.
Customizing
The look and feel of the web portal can (within certain boundaries) be customized to your needs,
think about fonts and colors. Visual properties like fonts and colors are defined in so called style
sheets (*.css). The default style sheets are stored in the webdata folder. To customize a style sheet
you can copy it from webdata to webdata/profiles/common and adapt it to your needs. If you are
hosting clients and want to give each client his own look and feel you can add additional sub folders
to webdata/profiles e.g. webdata/profiles/acme and you copy style sheets to it that should differ from
the default and custom profile. Each individual user can be linked to a specific profile (Edit->Users).
Besides style sheets you could also copy any other file from webdata like button or logo pictures
(*.gif, *.jpg, etc.). You could even copy HTML and Javascript files, but you should be aware that
adapting those files could cause miss behavior of the web portal.
You can also add your own sub folders to the webdata folder e.g. webdata/download where you can
put your own static files to be accessed by any user.
Note: When adapting a HTML file, never remove elements having an ‘id’ property.
Cross platform
The Web-interface is designed for desktop PC’s-, laptops and tabloids’ and can be viewed with all
mayor browsers (IE-8, FF-8, Chrome-15, Safari-4.0, Opera-11.0, Android-2.3. We have implemented
a basic HTML web-interface for smart phones with a tiny screen or basic browser as well, showing
recent-values and simple 24h charts. To use this basic interface open the indexce.htm page in your
browser (e.g. http://127.0.0.1/indexce.htm ).
Page 60 of 60