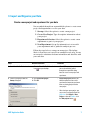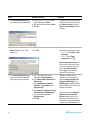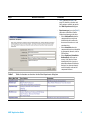
1
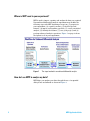
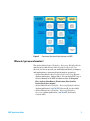
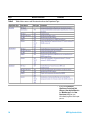
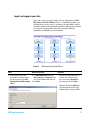
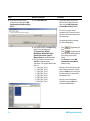
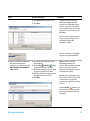
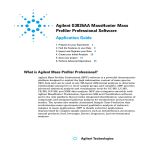
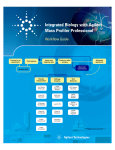
Agilent G3835AA MassHunter
Mass Profiler Professional Software
Application Guide
1. Prepare for your Experiment 4
2. Find the Features in your Data 6
3. Import and Organize your Data 7
4. Create your Initial Analysis 23
5. Save your project 37
6. Perform Advanced Operations 38
What is Agilent Mass Profiler Professional?
Agilent Mass Profiler Professional (MPP) software is a powerful
chemometrics platform designed to exploit the high information
content of mass spectra (MS) data and can be used in any MS-based
differential analysis to determine relationships among two or more
sample groups and variables. MPP provides advanced statistical
analysis and visualization tools for GC/MS, LC/MS, CE/MS, ICP-MS,
and NMR data analysis. MPP also integrates smoothly with Agilent
MassHunter Workstation, Spectrum Mill and ChemStation software
and is the only platform that provides integrated identification/
annotation of compounds and integrated pathway analysis for
metabolomic and proteomic studies. The system also enables
Automated Sample Class Prediction that revolutionizes mass
spectrometer-based qualitative analysis of unknown samples in
many applications. MPP is ideally suited for applications
characterized by complex sample matrices such as metabolomics,
proteomics, natural products, food, beverages, flavors, fragrances,
and environmental analyses.
Agilent Technologies
Where is MPP used in your experiment?
MPP is used to import, organize, and analyze the data you acquired.
Your unbiased differential analysis experiment may include the
following steps with MPP beginning at step four: (1) prepare for
your experiment, (2) acquire your data, (3) find the spectral
features, (4) import and organize your data, (5) create your initial
analysis, (6) identify the features, (7) save your project, and (8)
perform advanced analysis operations. Figure 1 on page 2 shows
the Agilent tools in your experiment.
Figure 1
The steps involved in an unbiased differential analysis.
How do I use MPP to analyze my data?
MPP helps you analyze your data through the use of sequential
dialog boxes and wizards as shown in Figure 2.
2
MPP Application Guide
Figure 2
Overview of the wizards that help you use MPP.
Where do I get more information?
The Agilent Metabolomics Workflow - Discovery Workflow Guide
and the Agilent MassHunter Mass Profiler Professional User
Manual (see below) provide you with additional detail, techniques,
and explanations to perform advanced analysis operations.
• Agilent MassHunter Mass Profiler Professional User Manual
(Agilent publication, January 2012). You can find a PDF copy of
the user manual in the MPP installation folder C:\Program
Files\Agilent\MassHunter\Workstation\Mass Profiler
Professional\docs\manual.
• Agilent Metabolomics Workflow - Discovery Workflow Guide
(Agilent publication 5990-7067EN, Revision B, October 2012)
• Agilent Metabolomics Workflow - Discovery Workflow
Overview (Agilent publication 5990-7068EN, Revision B,
October 2012)
MPP Application Guide
3
1. Prepare for your Experiment
An experiment consists of the analysis of a set of replicate samples
collected over a range of well defined parameters, treatments,
and/or exposures known as independent variables, including
parameter controls representing minimal or normal perturbations
(control samples). The results of changes observed in the samples is
designed to provide an answer to your hypothesis. The hypothesis
may be proved or disproved by analyzing the correlation of the
independent variables on the resulting expression of a large
number of dependent variables - the features (compounds) that are
measured in your samples. The results must be significant beyond
natural variability.
After you obtain your samples, acquire your data, and find the
features in your sample data, MPP takes you through data
extraction, processing, and statistical analysis so that you can
prove or disprove your hypothesis.
Elements to consider in planning your experiment
The hypothesis
The hypothesis is the question that is answered by your analysis.
For example, the question may be a statement that proposes a
possible correlation, or cause and effect, between a set of
independent variables and the resulting features in your data.
Natural variability
It is important to understand how any one sample in your data
represents the population as a whole. Because of natural variability
and the uncertainties associated with both the measurement and
the population, no assurance exists that any single sample from a
population represents the mean of the population. Thus, increasing
the sample size greatly improves the accuracy of the sample set in
describing the characteristics of the population.
4
MPP Application Guide
Replicate sampling
Sampling the entire population is not typically feasible because of
constraints imposed by time, resources, and finances. On the other
hand, fewer samples increase the probability of making a false
positive or false negative correlation.
System suitability
System suitability involves collecting data to provide you with a
means to evaluate and compensate for drift and instrumental
variations to assure quality results. Techniques employed by your
Agilent MassHunter software include (1) retention time alignment,
(2) intensity normalization, (3) chromatographic deconvolution,
and (4) baselining to produce the highest quality results. The best
results are achieved by maintaining your instrument and using
good chromatography.
Sampling methodology
Improved data quality comes from matching the sampling
methodology to the experimental design so that replicate data is
collected to span the parameter values for each parameter. A larger
number of samples appropriate to the population under study
results in a better answer to your hypothesis. An understanding of
the methodologies used in sampling and using more than one
method of sample collection have a positive impact on the
significance of your results.
Where to find more information to help you prepare for your experiment
Step-by-step detail of the process for preparing for your experiment
and performing an unbiased differential analysis is presented in
the Metabolomics Discovery Workflow (5990-7067EN).
MPP Application Guide
5
2. Find the Features in your Data
Before you analyze your data with MPP, the features (compounds)
in your data must be extracted into compound exchange (.CEF)
files. The features in your sample data are found and extracted by
processing your data files with Agilent MassHunter Qualitative
Analysis. MPP imports and analyzes the features that are saved in
your .CEF files.
MassHunter Qualitative Analysis
MassHunter Qualitative Analysis is used in conjunction with
MassHunter DA Reprocessor to perform untargeted feature
extraction, and additionally with MPP to perform recursive
targeted feature extraction.
Feature finding with MassHunter Qualitative Analysis involves
performing the following steps:
1 Create an untargeted Find by Molecular Feature (MFE) method
in MassHunter Qualitative Analysis.
2 Run the MFE method using DA Reprocessor to extract and save
the untargeted features from the sample data files.
3 Import, align, and filter the untargeted features using MPP.
4 Export the features from MPP for targeted, recursive finding in
MassHunter Qualitative Analysis.
5 Create a targeted Find by Formula (FbF) method in MassHunter
Qualitative Analysis.
6 Run the FbF method using DA Reprocessor to re-extract and
save the targeted features from the sample data files.
6
MPP Application Guide
3. Import and Organize your Data
Create a new project and experiment for your data
You are guided through four sequential dialog boxes to create a new
project and experiment to receive your data:
1 Startup: Select the option to create a new project.
2 Create New Project: Type descriptive information about
your project.
3 Experiment Selection: Select the option to create a new
experiment as part of your project.
4 New Experiment: Set up the information to store with
your experiment and to guide the analysis process.
Follow the steps below to setup your new project. The Agilent
Malaria Demo data set is used as an example in each step. You are
encouraged to substitute the demo information and data files with
your own data.
Steps
Detailed Instructions
Comments
1 Start Mass Profiler Professional.
a Click the Mass Profiler Professional
icon
on your desktop.
• When MPP starts, if you choose,
you are immediately guided
through four sequential dialog
boxes to create a new project and
experiment.
2 Create a new project from the
Startup dialog box.
a Click Create new project.
b Click OK.
• Create new project provides you
with the option to create a new
experiment or import an experiment
from an existing project into the
new project.
• After closing an open project, you
may create a new project from the
Menu bar; click Project > New
Project, or from the Toolbar; click
the New project button
.
MPP Application Guide
7
Steps
Detailed Instructions
3 In the Create New Project dialog
a Type Malaria Project or your
box, enter your project information.
project information in Name.
b Type descriptive information in Notes.
c Click OK.
4 In the Experiment Selection
Dialog dialog box, create a new
experiment.
a Click Create new experiment.
b Click OK.
Comments
• The project name and notes may be
viewed and edited at any time using
the Project Inspector by clicking
Project > Inspect Project from the
menu bar.
• You may also create a new
experiment in your project from the:
• Menu bar: Click Project > New
Experiment.
• Toolbar: Click the New
experiment button
.
• Open existing experiment opens a
project and the experiment(s) that
are stored in the project. You may
also click the Add experiment
button
to add an existing
experiment to your project.
5 In the New Experiment dialog box,
enter and select information that
guides your experiment creation.
8
a Type a descriptive name for the
experiment in Experiment name.
b Select Mass Profiler Professional for
Analysis type.
c Select Unidentified or Combined
(Identified + Unidentified) for the
Experiment type.
d Select Analysis: Significance Testing
and Fold Change for Workflow type.
e Type descriptive information in
Experiment notes.
f Click OK.
• Regardless of your personal
expertise, it is recommended to
select the Analysis: Significance
Testing and Fold Change for the
Workflow type to provide you with
quality control to your analysis that
improves your results.
• At the conclusion of the Analysis:
Significance Testing and Fold
Change workflow, you may save
your project and customize your
entire analysis using the operations
available in the Workflow Browser.
MPP Application Guide
Steps
Detailed Instructions
Comments
• Table 1(below) and Table 2 on
page 10 show the selection and
entry options available to you for
the New Experiment dialog box
• Experiment type (see also Table 2)
determines how Mass Profiler
Professional manages the data:
• Select Unidentified when the
compounds have only been
identified by their molecular
features of neutral mass and
retention time.
• Select Identified when the
compounds have been identified
by compound, formula, and/or
CAS number.
• Select Combined (Identified +
Unidentified) when you are
unsure if the data has been
identified in full or in part, or
when MassHunter Qualitative
Analysis has been previously
used to identify some of the
compound features.
Table 1
Table of selections and entries for the New Experiment dialog box
MPP Application Guide
9
Steps
Table 2
Detailed Instructions
Comments
Table of data sources and file extensions based on Experiment Type
• If you selected Analysis:
Significance Testing and Fold
Change or Data Import Wizard for
the Workflow type in the New
Experiment dialog box, you
immediately begin the data import
process.
10
MPP Application Guide
Import and organize your data
After you set up your project and create an experiment, the MS
Experiment Creation Wizard (Figure 3) immediately guides you
through the necessary steps to organize your experiment, import
your data, define your experiment variables, and prepare your data
for analysis; data preparation includes grouping, filtering,
alignment, normalization, and baselining.
Figure 3
MS Experiment Creation Wizard
Steps
Detailed Instructions
Comments
1 Select the data source that
generated the molecular features
for your experiment in the MS
Experiment Creation Wizard (Step
1 of 11).
a Click MassHunter Qual and select
Homo sapiens for the Organism if you
are using the Malaria Demo data set.
b Click Next.
• If you are using your own data set,
click the source of your sample
files, and select the Organism of
the sample files or select None.
• Note that selecting an Organism is
most important when you use the
Pathway Analysis features of MPP.
MPP Application Guide
11
Steps
Detailed Instructions
Comments
2 Select the molecular feature
sample files to import in the MS
Experiment Creation Wizard (Step
2 of 11).
a Click Select Data Files.
• The file type you need to select
depends on the data source you
selected in the MS Experiment
Creation Wizard (Step 1 of 11).
• See Table 2 on page 10 for a
comprehensive list of data sources
you may select from based on your
experiment type.
• To control your progress through
the wizard dialog boxes:
b Select your samples in the Open dialog
box. If necessary, browse to
C:\Program Files\Agilent\
MassHunter\Workstation\Mass
Profiler Professional\samples\
Malaria Demo for the Malaria Demo.
c Click the sample molecular feature
data files to import into the
experiment. The example Malaria data
files are:
• 1-1_pH7_pos_01.cef
• 1-2_pH7_pos_01.cef
• 1-3_pH7_pos_01.cef
• 1-4_pH7_pos_01.cef
• 3-1_pH7_pos_01.cef
• 3-2_pH7_pos_01.cef
• 3-3_pH7_pos_01.cef
• 3-4_pH7_pos_01.cef
12
• Click
•
•
to go to the next
step.
Click
to return to prior
steps and make modifications to
your settings and previous
entries.
Click Cancel to end the MS
Experiment Creation Wizard
without saving.
• You may select a continuous range
of files with a click on the first file
and press Shift and click on the last
file that includes the range of files
you want to select.
• You may select discontinuous,
individual by pressing Ctrl and
clicking on additional files.
MPP Application Guide
Steps
Detailed Instructions
Comments
d Click Open to load the selected files.
• Replicate samples are from the
collection of multiple identical
samples from a population. When
replicate samples are evaluated a
result is obtained that more closely
approximates the true value of the
population.
e Click Next.
• You can review and make changes
to your selection during the next
step before finalizing the
experiment creation.
• A progress indicator is shown while
your files are imported into MPP.
3 Review and order the sample files
based on the independent
variables in your experiment in the
MS Experiment Creation Wizard
(Step 5 of 11).
a Click one or more samples that you
want to reorder.
b Click the Up
or Down
button
to reorder the selected sample(s).
c Repeat the reordering actions as often
as necessary to obtain your order.
d Mark the sample names that you want
to import into your experiment.
e Click Next.
• Note: This step is the only
opportunity to reorder your
samples. After completing the data
import, create a new project or
experiment and repeat this process
to reorder your samples.
• You may select a continuous range
of files with a click on a first file and
a Shift-click on a last file that
includes the range of files you want
to select.
• Click the Restore
button at any
time to return the sample order to
your starting point when this step
was begun.
MPP Application Guide
13
Steps
Detailed Instructions
Comments
4 Define the sample grouping with
respect to the independent
variables and the replicate
structure of your experiment in the
MS Experiment Creation Wizard
(Step 6 of 11).
a Click Add Parameter.
• Note: Grouping at this time is
optional. You may add grouping or
change your grouping during the
Analysis: Significance Testing and
Fold Change Wizard or at any time
thereafter.
• An independent variable is an
essential element, constituent,
attribute, or quality in a data set
that is deliberately controlled in
your experiment. An independent
variable is referred to as a
parameter and is assigned a
parameter name.
• The attribute values within an
independent variable are referred to
as parameter values. Samples with
the same parameter value and the
same parameter name are treated
as replicates.
b Type a name for your Parameter name
in the Add/Edit Experiment
Parameter dialog box. Type
Infection for the Malaria Demo.
c Click your replicate Samples that
share the same first parameter value in
your data. For example:
• 1-1_pH7_pos_01
• 1-2_pH7_pos_01
• 1-3_pH7_pos_01
• 1-4_pH7_pos_01
d Select the Parameter type for your
grouping. Non-Numeric is selected for
the Malaria Demo.
• Parameter Type options:
• Select Non-Numeric if the
grouping is not a quantitative
value.
• Select Numeric if the grouping
value is quantitative or a value
that reflects a degree of
proportionality among the
samples with respect to an
independent variable. A numeric
parameter type allows some
data plots to be scaled by the
parameter values.
e Click Assign Value.
14
MPP Application Guide
Steps
Detailed Instructions
Comments
f Type the value for your first grouping in • In this example the samples are
the Assign Value dialog box. For the
assigned parameter values
Malaria Demo type Not Infected.
representing the Infection
g Click OK.
parameter.
h Click your replicate Samples that
share the same second parameter
value in your data. For example:
• 3-1_pH7_pos_01
• 3-2_pH7_pos_01
• 3-3_pH7_pos_01
• 3-4_pH7_pos_01
i Click Assign Value.
• The highlighted samples are
assigned the value typed in the
Assign Value dialog box.
j Type the value for your second
grouping in the Assign Value dialog
box. For the Malaria data type
Infected.
k Click OK.
l Repeat the value assignment steps
with your own data until you have
assigned a parameter name, type, and
value to all of your samples.
m Review your entries and grouping
assignment accuracy in the Add/Edit
Experiment Parameter dialog box.
n Repeat the value assignments for
individual or multiple samples as
necessary to make corrections or
changes.
o Click OK when the grouping for this
parameter name is complete.
MPP Application Guide
15
Steps
Detailed Instructions
Comments
p Repeat Add Parameter if your data has
more than one independent variable.
• Click Add Parameter.
• Repeat the steps above until you
have assigned a parameter name,
type, and value to all of your data.
• You may change the value of any
sample, or group of samples;
highlight the sample and click
Assign Value or Clear.
• Review step 5 OPTIONAL: Re-order
your parameter values and step 6
OPTIONAL: Saving and importing
experiment grouping information in a
spreadsheet. These steps provide
advanced instructions to manage your
parameters and parameter name
assignments using the wizard toolbar
and a spreadsheet application.
• Note: You may add grouping or
change your grouping during the
Analysis: Significance Testing and
Fold Change Wizard and at any
time thereafter.
q Click Next when you have completed
your experiment grouping.
16
MPP Application Guide
Steps
Detailed Instructions
Comments
5 OPTIONAL: Re-order your
parameter values.
a Click any one value under the
parameter column to select the whole
parameter column.
b Re-order the parameter column, click
the Left
or Right
button.
• When you have more than one
parameter associated with your
samples, each parameter and its
values is displayed in a separate
column in the MS Experiment
Creation Wizard (Step 6 of 11)
dialog box.
• When the parameter column is
selected the column is highlighted.
c Re-order the parameter values by
selecting a parameter column, then
click the Re-order parameter values
button.
d Click one or more values that you want
to reorder.
e Click the Up
or Down
button
to reorder the selected value(s).
f Click OK when the order for this
parameter is complete.
6 OPTIONAL: Saving and importing
experiment grouping information in
a spreadsheet.
MPP Application Guide
a Save the experiment parameters and
parameter values to a .tsv. Click the
Save experiment parameters to file
button
.
b Load your experiment parameter
grouping values from a .tsv file, instead
of using the MPP user interface. Click
the Load experiment parameters from
file button
.
• An example experiment grouping
file that is in the Malaria Demo
directory named “MALARIA
EXPERIMENT PARAMETERS (to be
loaded from file).tsv”
• The .tsv file is organized using tab
separated values (tsv) that may be
created, edited, and viewed using
Microsoft Excel or Notepad.
17
Steps
Detailed Instructions
Comments
c Load your experiment parameter
• Creating and editing experiment
grouping values from a sample file, if
parameter groupings may be more
applicable, by clicking the Import
convenient for you using Microsoft
parameters from samples
button.
Excel. Save your file as a .tsv file.
7 Filter the molecular features by
abundance, mass range, number of
ions per feature, and charge state
in the MS Experiment Creation
Wizard (Step 7 of 11).
a Mark the Minimum absolute
abundance check box under
Abundance filtering.
b Type a value of 5000 counts.
c Clear the Limit to the largest and
Minimum relative abundance check
boxes.
• The filtering parameters dialog box
is unique for each experiment type.
More information may be found in
the online Help.
• MassHunter Qual as the selected
data source, used in this example,
presents the most active fields.
• Filtering during the data import
process may be used to reject
low-intensity data or restrict the
range of data.
• In a Find by Molecular Feature
(MFE) generated data file the term
abundance actually refers to the
feature volume.
• In a Find by Formula (FbF)
generated data file the term
abundance actually refers to the
feature chromatographic area.
18
MPP Application Guide
Steps
Detailed Instructions
Comments
d Mark the Use all available data check
box under Retention time filtering.
e Clear the Use all available data check
box and type 50.00 for the Min Mass
and 1000 for the Max Mass under
Mass filtering.
f Click the Minimum number of ions
button and type 2 under Number of
ions.
g Click Multiple charge states
forbidden under Charge states.
h Click Next.
• Filtering by maximum mass may
improve your statistical analysis by
rejecting masses that are not
significant to the experiment. This
is especially relevant to
metabolomic samples.
• The filter parameters may be
cleared to preserve the prior
filtering that was used to generate
the feature data file.
• Filtering works with both GC/MS
and LC/MS data.
8 Align the features across the
samples based on tolerances
established by retention time and
mass in the MS Experiment
Creation Wizard (Step 8 of 11).
a Clear the Perform RT correction check
box.
b Type 0.1 % and 0.15 min for RT
Window. A smaller value reduces
compound grouping and leads to a
larger list of unique compounds.
c Type 5.0 ppm and 2.0 mDa for Mass
Window. It is not recommended to set
the mass window less than 2.0 mDa
for higher masses.
d Click Next.
• This step is omitted when the
experiment type is “identified.”
• GC/MS data alignment includes
retention time difference and mass
spectral match factor.
• A large retention time shift may be
used to compensate for less than
ideal chromatography.
• If retention time correction is used,
it is recommended to use at least
two widely spaced standards, and
to use standards that are present in
every sample. The correction is
based on a piecewise linear fit.
• Unidentified compounds from
different samples are aligned or
grouped together if (1) their
retention times are within the
specified tolerance window and (2)
the mass spectral similarity are
above the specified level.
• Retention alignment rewrites the
retention times in the data file.
MPP Application Guide
19
Steps
Detailed Instructions
Comments
9 Review the compounds present
and absent in each sample in the
MS Experiment Creation Wizard
(Step 9 of 11).
a Clear the Export for Recursion check
box.
b Click Next.
• This step shows a summary of the
compounds present and absent in
each of the samples based on the
experiment parameters, including
the application of the filter and
alignment parameters.
• The Compound Frequency chart
and table report the number of
common entities that appear in
your samples (i.e., there are 474
entities that appear in all 8 samples
and 1283 entities that appear in
only 1 sample - “one-hit wonders”).
The percent columns show you
abundance distribution of the
identical entities normalized to the
most abundant common entity.
• If most of the “one-hit wonders”
have a low relative abundance your
sample data alignment is likely
good. If the "one-hit wonders" have
a high relative abundance (i.e., in
the 30-100% column) then you may
need to improve your sample data
alignment.
• In the Mass vs. RT table, replicate
samples are expected to have a
similar number of compounds
present and absent.
• Use the Back and Next feature to
independently assess the effects of
your retention time alignment
versus compound alignment.
• It is not recommended to export the
compounds for recursion at this
step in your experiment. Better
results are obtained after the data
has been filtered for significance.
20
MPP Application Guide
Steps
Detailed Instructions
Comments
10 Select whether to normalize the
data to reduce the variability
caused by sample preparation and
instrument response in the MS
Experiment Creation Wizard (Step
10 of 11).
a Select None for the Normalization
Algorithm.
b Clear the Use External Scalar check
box.
c Click Next.
• You may use normalization and
external scalar techniques to
reduce the variability in your data
that was caused by sample
preparation and instrument
response.
MPP Application Guide
21
Steps
Detailed Instructions
Comments
11 Compare the features in each
sample to the response of each
feature across multiple samples, or
the control samples, in the MS
Experiment Creation Wizard (Step
11 of 11).
a Click the Baseline to ____ of all
samples button.
b Select median for the Baseline to
____of all samples.
c Click the Finish button
.
• There are four baselining options:
• None: Recommended if only a few
features in the samples exist.
• Z-Transform: Recommended if the
data sets are very dense, data
where very few instances of
compounds are absent from any
sample, such as a quantitation data
set from recursion.
• Baseline to ____ of all samples:
The abundance for each compound
is normalized to its selected
statistical abundance across all of
the samples. This has the effect of
reducing the weight of very large
and very small compound features
on later statistical analyses.
• Baseline to ____ of control
samples: The abundance for each
compound is normalized to its
selected statistical abundance
across just the samples selected as
the control samples. This has the
effect of weighting the compound
features to a known value that is
considered to be normal in the
population while reducing the
effect of large and small compound
features.
• If you selected Analysis:
Significance Testing and Fold
Change for the Workflow type in
the New Experiment dialog box
you immediately begin your
analysis.
22
MPP Application Guide
4. Create your Initial Analysis
The Analysis: Significance Testing and Fold Change Wizard
(Figure 4) improves the quality of your results and helps you create
an initial differential expression from your data. The steps are
predetermined and based on the experiment type, experiment
grouping, and conditions you entered when creating your project
and setting up your experiment. Some steps may be automatically
skipped for your experiment.
Figure 4
MPP Application Guide
Analysis: Significance Testing and Fold Change Wizard
23
Steps
Detailed Instructions
Comments
1 Review the summary of your new
experiment. Summary Report
(Step 1 of 8).
a Review the Summary Report.
b Click and right-click features on the
plot, or spreadsheet, to review the
data, change the plot view, export
selected data, or export the plot to a
file.
c Click Next.
• Familiarize yourself with the tools
available to you in the summary
report view.
24
• The Summary Report is displayed
as a spreadsheet view when you
have more than 30 samples.
MPP Application Guide
Steps
Detailed Instructions
Comments
2 Define or adjust the sample
grouping with respect to the
independent variables and the
replicate structure of your
experiment. Experiment Grouping
(Step 2 of 8).
a Click Add Parameter to define or
adjust your experiment grouping.
b Follow the steps in “Define the sample
grouping with respect to the
independent variables and the
replicate structure of your experiment
in the MS Experiment Creation Wizard
(Step 6 of 11).” on page 14.
c Click Next when you have completed
your experiment grouping.
• Note: In order to proceed to the
next step at least one parameter
with two parameter values must be
assigned.
3 Filter entities from your samples
based on the quality of their
presence in specified samples and
conditions. Filter Flags (Step 3 of
8).
a Review the summary plot.
b Click Re-run Filter to enter parameters
into the Filter Parameters dialog box.
c Mark the Present and Marginal check
boxes.
• A flag is a term used to denote the
quality of an entity within a sample.
A flag indicates if the entity was
detected in each sample as follows:
Present means the entity was
detected, Absent means the entity
was not detected, and Marginal
means the signal for the entity was
saturated.
• An independent variable is an
essential element, constituent,
attribute, or quality in a data set
that is deliberately controlled in an
experiment. An independent
variable is referred to as a
parameter and is assigned a
parameter name.
• This filter removes irreproducible
entities from further consideration
by your analysis.
MPP Application Guide
25
Steps
26
Detailed Instructions
Comments
d Clear the Absent check box. This flag
is useful when you want to identify
missing entities in the sample data.
e Click at least ___ out of X samples
have acceptable values. The “X” is
replaced in your display with the total
number of samples in your data set.
f Type 2 in the entry box. By setting this
parameter to a value of two or more,
“one-hit wonders” are filtered.
g Click OK.
h Review the profile plot. You are
encouraged to repeat the Re-run Filter
until you obtain the best results for
your experiment.
i Click Next.
• The number of entities displayed
above the profile plot is expected to
decrease as you progress through
the workflow.
• A “one-hit wonder” is an entity that
appears in only one sample, is
absent from the replicate samples,
and does not provide any utility for
statistical analysis.
MPP Application Guide
Steps
Detailed Instructions
Comments
4 Filter the remaining entities in your
samples based on their frequency
of occurrence among the samples
and conditions. Filter by
Frequency (Step 4 of 8).
a Review the summary plot.
b Click Re-run Filter to enter parameters
into the Filter Parameters dialog box.
c Type 100 in the Retain entities that
appear in at least.
d Click of samples in at least one
condition.
e Click OK.
f Review the profile plot. You are
encouraged to repeat the Re-run Filter
until you obtain the best results for
your experiment.
g Click Next.
• Set the minimum % and the
applicable condition of samples
that an entity must be present to
pass the filter: (1) of all samples
(conditions are not evaluated), (2)
of samples in only one condition
(one and only one condition) (3) of
samples in at least one condition
(one or more conditions), and (4) of
samples within each condition (all
conditions).
MPP Application Guide
• For experiments that contain five or
fewer replicates, 100% of all
samples is recommended. For
experiments with a larger number
of replicates, the filter frequency
percentage may be lowered. A
larger % removes more entities.
27
Steps
Detailed Instructions
Comments
5 Assess the sample quality of your
experiment. QC on samples (Step
5 of 8).
a Review the summary plot.
b Highly recommended: Click Back to
make adjustments to prior steps in the
workflow to improve the results.
c Click Next.
• QC on samples provides you with
the first view of the data using a
Principle Component Analysis
(PCA). PCA allows you to assess
the data by viewing a 3D scatter
plot of the calculated principle
components.
• You want your samples to form
discrete groups in the 3D PCA
Scores view based on their
parameter assignments.
28
MPP Application Guide
Steps
Detailed Instructions
Comments
6 Assess the differential significance
of your samples. Significance
Analysis (Step 6 of 8).
a Review the summary plot.
b Highly recommended: Click Back to
make adjustments to prior steps in the
workflow to improve the results.
c Customize the window panes.
d Move the p-value cut-off slider(s) or
type a value to change the p-value
cut-off value(s). A larger p-value
passes a larger number of entities.
• The statistical analysis is either a
T-test or an Analysis of Variance
(ANOVA) based on the samples and
experiment grouping.
• The last row of data in the Result
Summary spreadsheet shows the
number of entities that would be
expected to meet the significance
analysis by random chance based
on the p-value specified in each
column heading. If the number of
entities expected by chance is
much smaller than those based on
the corrected p-value, your entities
show significance among the
parameter values.
• The display of a diagram (Venn
Diagram, Fold Change, none, or
other plot) depends on your
samples and experiment grouping
for the analysis.
MPP Application Guide
29
Steps
Detailed Instructions
Comments
7 Filter the remaining entities in your
samples based on their relative
abundance ratios among the
samples and conditions. Fold
Change (Step 7 of 8).
a Review the summary plot.
b Move the Fold change cut-off slider or
type a value to change the Fold
change cut-off. The default value is
2.0. A larger cut-off value passes a
smaller number of entities through to
the final results.
c Select a value for the Minimum
number of pairs of conditions that
must have entities with a fold change
greater than the cut-off. The default
value is 1.
d Click Next.
• The Fold Change workflow step
may be automatically skipped
depending on your experiment
setup (it is skipped using the
Malaria Demo). If your experiment
has a parameter that contains at
least three parameter values, the
Fold Change step is available.
• Fold change is a signed value that
describes how much an entity
changes from its initial to its final
value. For example, when an entity
changes from a value of 60 to a
value of 15, the fold change is -4.
The quantity experienced a
four-fold decrease. Fold change is
the ratio of the final value to the
initial value.
• Fold change analysis is used to
identify entities with abundance
ratios, or, for example, differences
between a treatment and a control,
that are in excess of specified
cut-off or threshold value. Fold
change is calculated between the
conditions where Condition 1 and
another condition, Condition 2, are
treated as a single group.
30
MPP Application Guide
Steps
Detailed Instructions
Comments
8 Export the significant entities in
your experiment for identification.
ID Browser Identification (Step 8
of 8).
a Review the summary plot.
b Highly recommended: Click Back to
make adjustments to prior steps in the
workflow to improve the results.
c Click IDBrowser Identification to
export your entity list to Agilent
MassHunter ID Browser. ID Browser is
started and automatically prompts you
to set up your identification method
parameters.
• Processing your entities with ID
Browser performs the following
automatically: save the selected
entity list into a CEF file format,
open Agilent MassHunter ID
Browser, and import the saved CEF
file for identification.
• Once identification is completed, ID
Browser returns an identified CEF
file. This CEF file is imported into
the MPP experiment and
annotations are automatically
updated.
d Select the compounds to identify and
mark the identification method for your
experiment in the Compound
Identification Wizard dialog box.
e Click Next.
MPP Application Guide
31
Steps
Detailed Instructions
Comments
f Setup the parameters and values for
your database search.
32
MPP Application Guide
Steps
Detailed Instructions
Comments
g Click Finish when you have the
method set up for your experiment. ID
Browser automatically begins
identifying your entities and shows a
progress bar.
MPP Application Guide
33
Steps
Detailed Instructions
Comments
h Review and make adjustments to the
entity identifications as necessary
using the ID Browser interface.
i Click Save and Return
to
export your entity list back to your
experiment in MPP. You are
automatically returned to the MPP
user interface.
34
MPP Application Guide
Steps
Detailed Instructions
Comments
j Review your identified entity list in the
ID Browser Identification results. The
molecular formula now replaces the
mass and retention time for identified
entities in the compound column.
k Click Finish when you have completed
the ID Browser Identification.
• The Analysis: Significance Testing
and Fold Change workflow is now
complete and you are immediately
returned to the main MPP interface.
MPP Application Guide
35
Steps
36
Detailed Instructions
Comments
MPP Application Guide
5. Save your project
Save your current analysis as a TAR file for archiving, restoration
of any future analysis to the current results, sharing the data with a
collaborator, or sharing the data with Agilent customer support.
Steps
Detailed Instructions
Comments
1 Export your project to a TAR file.
a Click Project > Export Project.
b Mark the check box next to the
experiment you wish to save
c Click OK.
• You have completed creating your
project and analyzing an
experiment. It is recommended to
archive your progress by exporting
your project.
d Select or create the file folder.
e Type the File name.
f Click Save.
g Click OK.
MPP Application Guide
37
6. Perform Advanced Operations
The operations available in the Workflow Browser provide the tools
necessary for analyzing features from your mass spectrometry data
depending upon the need and aim of the analysis, the experiment
design, and the focus of the study. This helps you create different
interpretations to carry out the analysis based on the different
filtering, normalization, and standard statistical methods.
38
MPP Application Guide
BioCyc Pathway/Genome Databases
Includes BioCyc Pathway/Genome databases from the
Bioinformatics Research Group at SRI International®, used under
license.
http://www.biocyc.org/
Citation based on use of BioCyc
Users who publish research results in scientific journals based on
use of data from the EcoCyc Pathway/Genome database should
cite:
Keseler et al, Nucleic Acids Research 39:D583-90 2011.
Users who publish research results in scientific journals based on
use of data from most other BioCyc Pathway/Genome databases
should cite:
Caspi et al, Nucleic Acids Research 40:D742-53 2012.
In some cases, BioCyc Pathway/Genome databases are described
by other specific publications that can be found by selecting the
database and then going to the Summary Statistics pages under the
Tools menu. The resulting page sometimes contains a citation for
that database.
MPP Application Guide
39
www.agilent.com
In this book
The Agilent G3835AA
MassHunter Mass Profiler
Professional Software Application Guide presents
additional detail of the
software interface and helps
you use MPP with your data.
© Agilent Technologies, Inc. 2012
Revision A, November 2012
*G3835-90011*
G3835-90011
Agilent Technologies