1
No. CP-UM-1680E
Digitronik
Digital Indicating Controller
SDC40B
User's Manual
Computational Functions
This manual explains the computational
units of the SC40B in detail and also
serves as an instrumentation design
guide in that it gives control computation examples.
Control computational functions can be
loaded onto the SDC40B according to
the application being used. We strongly
urge that this manual be read by persons responsible for equipment design
utilizing the SDC40B, as well as those
involved in creating control programs.
RESTRICTIONS ON USE
When using this product in applications that require particular safety or when using this
product in important facilities, pay attention to the safety of the overall system and
equipment. For example, install fail-safe mechanisms, carry out redundancy checks
and periodic inspections, and adopt other appropriate safety measures as required.
IMPORTANT
The manual gives the most common application examples. Each application differ in
the concepts involved and the combinations required. The combinations given in the
manual are therefore only a guide to the capabilities of the instrument.
Yamatake Corporation shall not be held liable for any damage that may arise from the
use of the examples given in this manual.
REQUEST
Make sure that this User's Manual is handed over to the user before the
product is used.
Copying or duplicating this User's Manual in part or in whole is forbidden. The information and specifications in this User's Manual are subject to change without notice.
Considerable effort has been made to ensure that this User's Manual is
free from inaccuracies and omissions.
If you should find any inaccuracies or omissions, please contact
Yamatake Corporation.
In no event is Yamatake Corporation liable to anyone for any indirect,
special or consequential damages as a result of using this product.
1995 Yamatake Corporation ALL RIGHTS RESERVED
The DigitroniK R is a registered trademark of Yamatake Corporation.
SDC40B is a trademark of Yamatake Corporation.
The Role of This Manual
In all, three manuals have been prepared for the SDC40B. Read the manual according to your specific
requirements. The following lists all the manuals that accompany the SDC40B and gives a brief outline of the
manual. If you do not have the required manual, contact Yamatake Corporation or your dealer.
No. CP-U
E
M-XXXX
X
XXXX
XX
XXXX ua
an
ser's X
XXXX
XX
XXXXXX
XXX XXX
XXXX
XXXXXX
XXX XXX
XXXX
XXXXXX
XXX XXX
XXXX
XXXXXX
XXX XXX
XXXX
XXXXXX
XXX XXX
XXXX
XXXXXX
XXX XXX
No. CP-U
E
M-XXXX
X
XXXX
XX
XXXX ua
an
ser's X
XXXX
XX
XXXXXX
XXX XXX
XXXX
XXXXXX
XXX XXX
XXXX
XXXXXX
XXX XXX
XXXX
XXXXXX
XXX XXX
XXXX
XXXXXX
XXX XXX
XXXX
XXXXXX
XXX XXX
No. CP-U
E
M-XXXX
X
XXXX
XX
XXXX ua
an
ser's X
XXXX
XX
XXXXXX
XXX XXX
XXXX
XXXXXX
XXX XXX
XXXX
XXXXXX
XXX XXX
XXXX
XXXXXX
XXX XXX
XXXX
XXXXXX
XXX XXX
XXXX
XXXXXX
XXX XXX
User's Manual: Basic Operations
Manual No.CP-UM-1679E
This manual is provided with the SDC40B unit. We strongly urge persons
responsible for device design, operations, and maintenance on the
SDC40B read this manual. It describes how to mount the unit to an
operation console or other location, wire and configure the unit; it also
contains maintenance and inspection information, troubleshooting tips
and specifications.
User's Manual: Computational Functions (This manual)
Manual No.CP-UM-1680E
This is the manual you are now reading. We strongly urge persons
responsible for device design and control programming development on
the SDC40B read this manual. Control computational functions can be
loaded onto the SDC40B according to the application being used. This
manual explains computational expressions in detail. It also serves as an
instrumentation design guide in that it contains control computational
examples.
User's Manual: DigitroniK CPL Communications
SDC40B
Manual No.CP-UM-1683E
We strongly urge persons using the SDC40B CPL Communications
functions read this manual. This manual overviews CPL communications,
and explains wiring and communications procedures. It also provides a
list of communications data for the SDC40B, troubleshooting measures,
and communications specifications.
1
Organization of This User's Manual
This manual is organized as follows.
Chapter 1. COMPUTATIONAL UNITS
This chapter provides detailed descriptions o how each computational
expression is processed.
Chapter 2. USING COMPUTATIONAL UNITS
This chapter describes combinations of computational units using standard
procedures.
Chapter 3. APPLICATION EXAMPLES
This chapter offers examples of applications utilizing the SDC40B and how
to develop design sheets.
Chapter 4. PRECISION
This chapter gives the precision of each computational expression.
Chapter 5. DATA SHEETS
This chapter provides data sheets that can be photocopies as required.
Conventions Used in This Manual
The following conventions are used in this manual.
◆ Important
◆ Important” alerts the reader to points of note
: The preceded by “◆
when operating the unit.
◇ Note
◇ Note” alerts the reader to supplementary
: Text preceded by “◇
explanations or reference materials.
2
Contents
The Role of This Manual
Organization of This User's Manual
Conventions Used in This Manual
Chapter 1.
COMPUTATIONAL UNITS
1-1 General
■ Data formats of input lines used for computational expressions
■ Computation time
■ Dynamic area
■ Computational overflow check
1-2 Computational Expressions
ADD (addition)
SUB (subtraction)
MUL (multiplication)
DVD (division)
ABS (absolute value)
SQR (square-root extraction)
MAX (maximum value)
MIN (minimum value)
SGM (4-point addition)
HSE (high selector/low limiter)
LSE (low selector/high limiter)
HLLM (high and low limiter)
HMS (high monitor)
LMS (low monitor)
DMS (deviation monitor)
DRL (deviation rate limiter)
DRM (deviation rate monitor)
MAN (manual output)
PID1, PID2 (controller)
DED (dead time)
L/L (lead/lag)
LED (derivation)
INT (integration)
MAV (moving average)
RS (flip-flop)
AND (logical product)
OR (logical OR)
XOR (exclusive OR)
NOT (invert)
SW (2-position transfer switch)
SFT (softening transfer switch)
TSW (timer switch)
FSW (flag switch)
ALSW (alternate switch)
1-1
1-1
1-1
1-1
1-1
1-2
1-2
1-3
1-4
1-5
1-6
1-7
1-8
1-9
1-10
1-11
1-12
1-13
1-14
1-15
1-16
1-17
1-18
1-19
1-20
1-25
1-26
1-27
1-28
1-29
1-30
1-31
1-32
1-33
1-34
1-35
1-36
1-37
1-38
1-39
3
TIM (timer)
ONDT (on delay timer)
OFDT (off delay timer)
OST (one-shot timer)
CPO (integration pulse output I)
CPX (integration pulse output II)
PWM (pulse width modulation)
RMP (ramp signal generation)
LOG (logarithm)
EXP (exponent)
PMD1, PMD2 (control variable change I, II)
MOD (mode select/status detection)
MODX (mode select/edge detection)
AT1, AT2 (auto-tuning start/stop 1, 2)
HOLD (data hold)
RL (raise/lower unit)
RST (reset)
TBL1 to TBL3 (linearization tables 1 to 3)
TBR1 to TBR3 (inverse linearization tables 1 to 3)
TTP (time → % conversion)
PTT (% → time conversion)
EGP1, EGP2 (engineering unit parameter selection 1, 2)
PTB1 to PTB4 (% → % tables 1 to 4)
TTB1 to TTB4 (% → time tables 1 to 4)
UF1 to UF3 (user lamp outputs 1 to 3)
BLED (bar graph LED display switch)
DSP1 to DSP4 (additional display units 1 to 4)
Chapter 2.
1-40
1-41
1-42
1-43
1-44
1-45
1-46
1-47
1-48
1-49
1-50
1-51
1-52
1-53
1-54
1-55
1-56
1-57
1-58
1-59
1-60
1-61
1-62
1-63
1-64
1-65
1-66
USING COMPUTATIONAL UNITS
2-1 Overview of Combinations
2-1
2-2 Basic Combinations of Computational Units
■ Basic Combinations of MAN and PID units
(with auto-balance)
■ Inserting HLLM units (high/low limiter) between PID and
MAN units (with auto-balance)
■ Inserting SW (2-position transfer switch) units between PID
and MAN units (with auto-balance)
■ Inserting computations between MAN and AO1
(with auto-balance)
■ Ensuring preset output during cold start
■ Ratio bias computation
■ Multi-SP setting 1
■ Multi-SP setting 2
■ PID group changes
2-2
4
2-2
2-3
2-4
2-5
2-6
2-7
2-8
2-9
2-10
■ Changing proportional band continuously to suit settings or
other factors
■ Using follow mode
■ Smoothing changes from auto to cascade mode
■ Analog changes of remote setting signals using external
contacts
■ Sample hold
■ Integration pulse output
■ Analog integration
■ Pulse to analog integration
Chapter 3.
2-11
2-12
2-13
2-14
2-15
2-16
2-17
2-18
APPLICATION EXAMPLES
3-1 Overview
3-1
3-2 Automatic Combustion Control for Saving Energy and Reducing
Pollution
■ General
■ Instrumentation examples
■ Computation design
■ Hints
3-2
3-2
3-2
3-3
3-3
3-3 Feed-forward Control of Boiler Liquid Level Control
■ General
■ Instrumentation examples
■ Computation design
■ Hints
3-4
3-4
3-4
3-5
3-5
3-4 Compressor Over-ride Control
■ General
■ Instrumentation examples
■ Computation design
■ Hints
3-6
3-6
3-6
3-7
3-7
Chapter 4.
PRECISION
4-1 General
■ Precision of floating point computations
■ Precision of time computations
■ Other items requiring consideration
■ Calculating computation precision
4-1
4-1
4-1
4-2
4-2
4-2 List of Computational Unit Precision
4-3
5
Chapter 5.
DATA SHEETS
5-1 General
5-1
5-2 Data that Can be Changed after Operation
5-1
Data Sheets for the SDC40B Digital Indicating Controller
SDC40B Design Sheet
6
1. Computational Units
Chapter 1. Computational Units
1-1 General
The DigitroniK SDC40B is a general-purpose, single-loop controller designed to
control temperatures, pressures, flow rates, levels, pH values and other varying
physical conditions. It combines PID control and about 80 auxiliary functions in a
single unit which can be assigned to as many as 50 computational units. This chapter
gives detailed descriptions of computation processing.
■ Data formats of input lines used for computational expressions
:
:
:
:
:
% data
time data
flag (ON/OFF) data
index (1, 2 and similar numeric values) data
composite (%, time, flag or index) data
■ Computation time
The computation times given below are absolute numbers and do not have units. The
total operation time of all computational units and the input processing time is
calculated, and the use or non-use of communication options is monitored to determine
SDC40B processing cycle time.
Code
1
2
3
4
5
Processing Allowable processing time (an absolute number)
cycle time
Without CPL
With CPL
0.1 sec
110
90
0.2 sec
260
220
0.3 sec
410
350
0.4 sec
560
480
0.5 sec
710
610
Refer to 5-5, “Computation Processing Functions” in Chapter 5 in Basic Operations
(Manual No. CP-UM-1679E or CP-UM-1699E) for further information on how the
computation processing cycle is determined.
■ Dynamic area
This indicates the extent of RAM used by a computational expression.
N: No RAM is used.
L: Indicates that a large amount of RAM is used. Thus up to 8 computational units
with an “L” in their “Dynamic area” column can be used.
S: Indicates that a small amount of RAM is used. Thus up to 20 computational units
with an “S” in their “Dynamic area” column can be used.
Using combinations of “L” and “S” computational units does not reduce the total
number of either type that can be simultaneously used.
■ Computational overflow check
Computational units with “Computational overflow check” in the “Remarks” column
can be moved to IM (interlock manual) mode when an overflow occurs.
Refer to Section 5-7, “Modes” in Chapter 5 in Basic Operations (Manual No. CPUM-1679E or CP-UM-1699E) for details.
1-1
1
1. Computational Units
1-2 Computational Expressions
No.
Computational
expression
1
Addition
Mnemonic Computation
Dynamic area
time
ADD
3
N
Input lines Data format
Remarks
Computational overflow check
Range
Initial value
Configuration
H1 H2
ADD
H1
% format −999.9 to 999.9
0.0
P1
H2
% format −999.9 to 999.9
0.0
P2
P1
% format −999.9 to 999.9
100.0
P2
% format −999.9 to 999.9
100.0
OUT
% format −999.9 to 999.9
—
OUT
Computational expression:
OUT = H1 × P1 + H2 × P2
Computation
OUT < −999.9% or OUT > 999.9% generates a computational overflow.
1-2
1. Computational Units
No.
Computational
expression
Mnemonic
2
Subtraction
SUB
Computation
Dynamic area
time
3
N
Input lines Data format
Remarks
Computational overflow check
Range
Initial value
Configuration
H1 H2
SUB
H1
% format −999.9 to 999.9
0.0
P1
H2
% format −999.9 to 999.9
0.0
P2
P1
% format −999.9 to 999.9
100.0
P2
% format −999.9 to 999.9
100.0
OUT
% format −999.9 to 999.9
—
OUT
Computational expression:
OUT = H1 × P1 − H2 × P2
Computation
OUT < −999.9% or OUT > 999.9% generates a computational overflow.
1-3
1. Computational Units
No.
Computational
expression
Mnemonic
3
Multiplication
MUL
Computation
Dynamic area
time
2
N
Input lines Data format
Remarks
Computational overflow check
Range
Initial value
Configuration
H1 H2
H1
% format −999.9 to 999.9
0.0
H2
% format −999.9 to 999.9
0.0
OUT
% format −999.9 to 999.9
—
MUL
OUT
Computational expression:
OUT = H1 × H2
Computation
OUT < −999.9% or OUT > 999.9% generates a computational overflow.
1-4
1. Computational Units
No.
Computational
expression
4
Division
Mnemonic Computation Dynamic area
time
DIV
3
N
Input lines Data format
Remarks
Computational overflow check
Range
Initial value
Configuration
H1 H2
DIV
P1
H1
% format −999.9 to 999.9
100.0
H2
% format −999.9 to 999.9
100.0
P1
% format −999.9 to 999.9
0.0
OUT
% format −999.9 to 999.9
—
OUT
Computational expression:
OUT = (H1 ÷ H2) + P1
Computation
OUT < −999.9% or OUT > 999.9% generates a computational overflow.
When H2 is 0.0% and,
H1 is positive, OUT is 999.9%
H1 is negative, OUT is −999.9%
an overflow is generated.
1-5
1. Computational Units
No.
Computational
expression
5
Absolute value
Mnemonic Computation Dynamic area
time
ABS
1
Remarks
N
Input lines Data format
Range
Initial value
Configuration
H1
H1
% format −999.9 to 999.9
0.0
% format
—
ABS
OUT
OUT
Computational expression:
Computation
OUT = |H1|
1-6
0.0 to 999.9
1. Computational Units
No.
Computational
expression
Mnemonic Computation Dynamic area
time
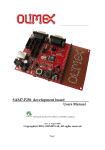
6 Square-root extraction SQR
8
Remarks
N
Input lines Data format
Range
Initial value
Configuration
H1
SQR
H1
% format −999.9 to 999.9
0.0
P1
% format −999.9 to 999.9
0.0
P1
OUT
OUT
% format
0.0 to —
Computational expression:
P1 is the drop-out value.
P1 ≧ 0. When set to P1 < 0, P1 is assumed to be 0.
When H1 > P1, OUT is
When H1 ≦ P1, OUT is 0.
Output after square root
extraction (OUT)
Computation
100.0%
100.0%
Input (H1)
Drop-out value (P1)
1-7
1. Computational Units
No.
Computational
expression
7
Maximum value
Mnemonic Computation Dynamic area
time
MAX
2
Remarks
N
Input lines Data format
Range
Initial value
Configuration
H1 H2
MAX
H1
% format −999.9 to 999.9
0.0
P1
H2
% format −999.9 to 999.9
0.0
P2
P1
% format −999.9 to 999.9
0.0
P2
% format −999.9 to 999.9
0.0
OUT
% format −999.9 to 999.9
—
OUT
Computational expression:
Computation
OUT is the maximum value (H1, H2, P1, P2)
1-8
1. Computational Units
No.
Computational
expression
8
Minimum value
Mnemonic Computation Dynamic area
time
MIN
2
Remarks
N
Input lines Data format
Range
Initial value
Configuration
H1 H2
MIN
H1
% format −999.9 to 999.9
100.0
P1
H2
% format −999.9 to 999.9
100.0
P2
P1
% format −999.9 to 999.9
100.0
P2
% format −999.9 to 999.9
100.0
OUT
% format −999.9 to 999.9
—
OUT
Computational expression:
Computation
OUT is the maximum value (H1, H2, P1, P2)
1-9
1. Computational Units
No.
Computational
expression
9
4-point addition
Mnemonic Computation Dynamic area
time
SGM
2
N
Input lines Data format
Remarks
Computational overflow check
Range
Initial value
Configuration
H1 H2
SGM
H1
% format −999.9 to 999.9
0.0
P1
H2
% format −999.9 to 999.9
0.0
P2
P1
% format −999.9 to 999.9
0.0
P2
% format −999.9 to 999.9
0.0
OUT
% format −999.9 to 999.9
—
OUT
Computational expression:
OUT = H1 + H2 + P1 + P2
Computation
OUT < −999.9% or OUT > 999.9% generates a computational overflow.
1-10
1. Computational Units
No.
Computational
expression
Mnemonic Computation Dynamic area
time
10 High selector (low limiter) HSE
1
Remarks
N
Input lines Data format
Range
Initial value
Configuration
H1 H2
H1
% format −999.9 to 999.9
0.0
H2
% format −999.9 to 999.9
0.0
OUT
% format −999.9 to 999.9
0.0
HSE
OUT
Computational expression:
Computation
When H1 ≧ H2, OUT is H1.
When H1 < H2, OUT is H2.
When used as a low limiter, H2 is the low limit value.
1-11
1. Computational Units
No.
Computational
expression
Mnemonic Computation Dynamic area
time
11 Low selector (high limiter) LSE
1
Remarks
N
Input lines Data format
Range
Initial value
Configuration
H1 H2
H1
% format −999.9 to 999.9
100.0
H2
% format −999.9 to 999.9
100.0
OUT
% format −999.9 to 999.9
—
LSE
OUT
Computational expression:
Computation
When H1 ≧ H2, OUT is H2.
When H1 < H2, OUT is H1.
When used as a high limiter, H2 is the high limit value.
1-12
1. Computational Units
No.
Computational
expression
Mnemonic Computation Dynamic area
time
12 High and low limiter HLLM
2
Remarks
N
Input lines Data format
Range
Initial value
Configuration
H1
HLLM
H1
% format −999.9 to 999.9
0.0
P1
% format −999.9 to 999.9
100.0
P2
% format −999.9 to 999.9
0.0
OUT
% format −999.9 to 999.9
—
P1
P2
OUT
Computational expression:
Computation
When P1 is the high limiter and P2 is the low limiter, P1 > P2.
When H1 > P1, OUT is P1.
When H1 < P1, OUT is P2.
When P1 ≧ H1 ≧ P2, OUT is H1.
When P1 ≦ P2 is set, OUT is P2.
1-13
1. Computational Units
No.
Computational
expression
13
High monitor
Mnemonic Computation Dynamic area
time
HMS
2
Remarks
N
Input lines Data format
Range
Initial value
Configuration
H1 H2
HMS
H1
% format −999.9 to 999.9
100.0
H2
% format −999.9 to 999.9
100.0
P2
% format −999.9 to 999.9
0.0
OUT
Flag format ON = 1, OFF = 0
—
P2
OUT
Computational expression:
Computation
H2 is the high monitor value and P2 is the hysteresis width setting.
P2 ≧ 0. When P2 < 0 is set, P2 is assumed to be 0.
When H1 ≧ H2, OUT is ON.
When H1 < (H2 − P2), OUT is OFF.
1-14
1. Computational Units
No.
Computational
expression
14
Low monitor
Mnemonic Computation Dynamic area
time
LMS
2
Remarks
N
Input lines Data format
Range
Initial value
Configuration
H1 H2
LMS
H1
% format −999.9 to 999.9
0.0
H2
% format −999.9 to 999.9
0.0
P2
% format −999.9 to 999.9
0.0
OUT
Flag format ON = 1, OFF = 0
—
P2
OUT
Computational expression:
Computation
H2 is the low monitor value and P2 is the hysteresis width setting.
P2 ≧ 0. When P2 < 0 is set, P2 is assumed to be 0.
When H1 ≦ H2, OUT is ON.
When H1 > (H2 + P2), OUT is OFF.
1-15
1. Computational Units
No.
Computational
expression
Mnemonic Computation Dynamic area
time
15 Deviation monitor DMS
3
Remarks
N
Input lines Data format
Range
Initial value
Configuration
H1 H2
DMS
H1
% format −999.9 to 999.9
0.0
P1
H2
% format −999.9 to 999.9
0.0
P2
P1
% format −999.9 to 999.9
100.0
P2
% format −999.9 to 999.9
0.0
OUT
Flag format ON = 1, OFF = 0
—
OUT
Computational expression:
Computation
The deviation between H1 and H2 is assessed using monitor setting value P1. P2 is the
hysteresis width setting.
P1 ≧ 0; P2 ≧ 0. When P1 < 0 and P2 < 0, they are both assumed to be 0. When P1 < P2,
OUT is always OFF.
When |H1 − H2| ≧ P1, OUT is ON.
When |H1 − H2| < (P1 − P2), OUT is OFF.
1-16
1. Computational Units
No.
Computational
expression
Mnemonic Computation Dynamic area
time
16 Deviation rate limiter
DRL
3
S
Input lines Data format
Remarks
Computational overflow check
Range
Initial value
Configuration
H1 H2
DRL
P1
H1
% format −999.9 to 999.9
0.0
H2
% format −999.9 to 999.9
0.0
P1
% format −999.9 to 999.9
0.0
OUT
% format −999.9 to 999.9
—
OUT
Computational expression:
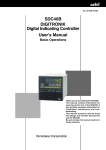
Computation
Limits deviation rate per minute of input H1 to positive H2% and negative P1%.
H2 is the positive deviation rate limit.
(H2 > 0. When H2 ≦ 0, the positive deviation rate limit does not operate.)
P1 is the negative deviation rate limit.
(P1 < 0. When P1 ≧ 0, the negative deviation rate limit does not operate.)
When H1 ≦ OUT (−1) + H2’ and H1 ≧ OUT (n−1) + P1’, OUT is H1.
When H1 > OUT (−1) + H2’, OUT is OUT (−1) + H2’.
When H1 < OUT (−1) + P1’, OUT is OUT (−1) + P1’.
H2’: Converted computation cycle value of positive deviation rate limit setting value H2 (> 0)
P1’: Converted computation cycle value of negative deviation rate limit setting value P1 (< 0)
OUT (−1): Previous output value
The limit operation is not available in initial state (during the first minute after starting).
H2
H2
P1
t
1 min
1 min
◆Important:
This deviation rate limiter does not check and limit deviation rates
for each input computation cycle.
1-17
1. Computational Units
No.
Computational
expression
Mnemonic Computation Dynamic area
time
17 Deviation rate monitor DRM
5
Remarks
L
Input lines Data format
Range
Initial value
Configuration
H1 H2
DRM
H1
% format −999.9 to 999.9
0.0
P1
H2
% format −999.9 to 999.9
0.0
P2
P1
% format −999.9 to 999.9
0.0
P2
% format −999.9 to 999.9
0.0
OUT
Flag format ON = 1, OFF = 0
—
OUT
Computational expression:
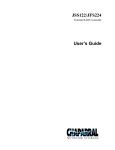
Computation
Output is asserted when input H1 exceeds positive H2% or drops below negative P1%
compared to inputs made one minute earlier.
H2 is the positive deviation rate monitor value.
(H2 ≧ 0. When H2 < 0, H2 is assumed to be 0.)
P1 is the negative deviation rate monitor value.
(P1 ≦ 0. When P1 > 0, P1 is assumed to be 0.)
P2 is the hysteresis value.
(P2 ≧ 0. When P2 < 0, P2 is assumed to be 0.
Conditions of P2 < H2 and P2 <|P1|are required.)
(H1 − H1(n)) ≧ H2 or when (H1 − H1(n)) ≦ P1, OUT is ON.
When (H1 − H1(n)) < (H2 − P2) or (H1 − H1(n)) > (P1 + P2), OUT is OFF.
Since only 30 data items (every 2 seconds) can be stored in the dynamic area, H1 is actually
the value of an input made between 59 to 61 seconds earlier.
The monitor operation is not available in initial state (during the first minute after starting).
H1
Stored image of input H1
H1
H2
H1
H1
(n)
(n–30) (n–29)
1 min
P1
t
1 min
OUT
1-18
ON
OFF
H1(n) is compared with H1(n–30).
Output is asserted when input H1
exceeds positive H2% or drops below
negative P1%.
1. Computational Units
No.
Computational
expression
18
Manual output
Mnemonic Computation Dynamic area
time
MAN
3
Remarks
Only 1 unit can be used
N
Input lines Data format
Range
Initial value
Configuration
H1 H2
MAN
H1
% format −999.9 to 999.9
0.0
P1
H2
% format −999.9 to 999.9
0.0
P2
P1
% format −999.9 to 999.9
0.0
P2
Flag format ON = 1, OFF = 0
OFF
OUT
% format −999.9 to 999.9
—
OUT
Computational expression:
Computation
H2 is the follow input.
P1 is the tracking input.
P2 is the tracking switch signal.
In manual mode (includes interlock manual mode), OUT is OUT(−1) + ΔMV
When P2 is ON or in initial state, OUT is P1 unconditionally.
In follow mode, OUT is H2.
In auto and cascade modes, OUT is H1.
ΔMV is justified using the and keys and manipulated with the keys when MMI
is in the manual ouput setting state. When the keys are used, OUT is limited to the range
−10.0 to 110.0% (up to that point H1 and H2 inputs are output in the range −999.9% to
999.9%).
Higher computational
unit output
Follow input
H1
H2
AUTO/CAS
MAN
FOLLOW
OFF
ON
P1
Tracking input
ΔMV
OR
(Output increase/
decrease)
Initial*
P2
Tracking input
switching signal
* : Power ON
OUT
1-19
1. Computational Units
No.
Computational
expression
19
Controller #1
PID1
20
Controller #2
PID2
Mnemonic Computation Dynamic area
time
36
Remarks
Only 1 unit can be used
N
Constraints depending on controller type
Input lines Data format
Range
Initial value
Configuration
H1 H2
PID1
or
PID2
H1
% format −999.9 to 999.9
0.0
P1
H2
% format −999.9 to 999.9
0.0
P2
P1
% format −999.9 to 999.9
0.0
P2
Flag format ON = 1, OFF = 0
OFF
OUT
% format −999.9 to 999.9
—
OUT
Computational expression:
H1 is the remote setting signal and H2 is PV.
P1 is the tracking input and P2 is the tracking switching signal.
Each controller (PID1 or PID2) can be either of the following two PID computation types which
are selected using the [control computational data (contl)] settings. Both PID computation types
offer speed operations and the position output format.
• Normal PID (deviation derivative)
• Derivative-based (measured value derivative) PID
Computation
◆Important:
• AT (auto-tuning) and overshoot control and smart tuning for overshoot
control and neural network tuning can be performed only in normal PID
(deviation derivative). Derivative-based (measured value derivative)
PID cannot be used for these functions or for the creation of a dead
band.
• Computations are initialized according to the conditions listed in the
table below.
Condition
Normal PID
MAN mode
P.D item is deleted
P.D item is deleted
Mode change
D(n)=D(n–1)=E(n)
D(n)=PV, V(n–1)=V(n)
C(n)=limit (P1)
C(n)=limit (P1)
P2=ON
Derivative-based PID
Note: P1 is limited within the range –10.0 to +110.0%.
• LSP is limited to the range 0.0 to 100.0% during PV and RSP tracking.
• After ration and bias computations, RSP is limited to the range −10.0
to +110.0%.
• PV is limited to the range −10.0 to +110.0%
(continued)
1-20
1. Computational Units
Normal PID:
Control block diagram
(Reverse operation)
D(n)
+ E(n)
SP
D
P
−
PV
I
(Normal operation)
D(n)
− E(n)
SP
D
P
+
PV
I
ΔC(n)
Dk(n) +
+
Di(n)
+
+
[P1]
C(n–1)
ΔC(n)
Dk(n) +
+
Di(n)
C(n)
+
+
C(n)
[P1]
C(n–1)
Computational expression • When P2 is ON, C(n) = [P1] + ΔC(n)
Computation
• When P2 is OFF, C(n) = C(n–1) + ΔC(n)
ΔC(n) = PID(SP, PV)
100
1
1 + TcS
• C(n) = (1 + ) ( )
PB
TiS
1
1 + TcS
8
A conversion of the above equation gives the following.
C(n) = C(n–1) + ΔC(n) = C(n–1) + Dk(n) + Di(n)
∵ Dk(n) = Kg × (D(n) − D(n–1))
Di(n) = Kig × D(n)
D(n) = D(n–1) + Kd (E(n) − D(n–1)) + Kd2 (E(n) − E(n–1))
PB = proportional band
Ti = integral time
Td = derivative time
E(n) = deviation
D(n) = derivative block output
Dk(n) = proportional block output
Di(n) = integrating block output
C(n) = control output
(n-1) = previous value of each (value of previous sample)
Ts = sampling time
100
Ts
Kg = , Kig = Kg PB
Ti
Kd =
Kd2 =
Ts
1
Ts + Td
8
Td
1
Ts + Td
8
(The PID computational algorithm is equivalent to our SDC40A and operation A used by
DCP550 instruments.) (continued)
1-21
1. Computational Units
(Continued from previous page)
Normal PID control computation block
Normal PID performs derivative operations on deviations (SP–PV).
This type also allows creation of a dead band by setting a deviation level limit below which
PID computation is not performed (held).
Remote setting signal
(RSP)
Ratio setting value
Bias setting value
H2
H1
PV
RATIO
BIAS
LSP
AUTO/MAN/IM
AND
CAS
PV.ALM.H
Value specifying upper PV alarm limit
PV.ALM.L
Value specifying lower PV alarm limit
Value specifying deviation alarm
DEV.ALM
MAN
Value specifying PID group
Value specifying dead band
Value specifying proportional band
Value specifying integral time
Value specifying derivative time
Value specifying upper integral time limit
Value specifying lower integral time limit
GAP
Group selection
Computation
PV tracking
Value specifying normal or reverse
operation
PID
ΔMV
MV
OFF
Value specifying output
of deviation rate limit
DRL
ON
P1
Tracking input *1
OR
MAN/IM
MDCHG*2
P2
Tracking switching signal*1
OUT
*1 : Used for configuring the auto-balance function.
*2 : Mode change (Auto, Manual, Cascade, Follow, Interlock manual)
(continued)
1-22
1. Computational Units
Derivative-based PID:
Control block diagram
(Reverse operation)
+ V(n)
SP
−
D(n)
E(n)
PV
D
(Normal operation)
− V(n)
SP
+
D(n)
E(n)
PV
D
P
I
P
I
ΔC(n)
Dk(n) +
+
Di(n)
+
+
[P1]
C(n–1)
ΔC(n)
Dk(n) +
+
Di(n)
C(n)
+
+
C(n)
[P1]
C(n–1)
Computational expression • When P2 is ON, C(n) = [P1] + ΔC(n)
Computation
• When P2 is OFF, C(n) = C(n–1) + ΔC(n)
ΔC(n) = PID(SP, PV)
100
1
1 + TdS
• C(n) = (1 + ) {SP − ( ) PV}
PB
TiS
1
1 + TdS
8
A conversion of the above equation gives the following.
C(n) = C(n–1) + ΔC(n) = C(n–1) + Dk(n) + Di(n)
∵ Dk(n) = Kg × (V(n) − V(n–1))
Di(n) = Kig × V(n)
V(n) = SP − D(n)
D(n) = D(n–1) + Kd (PV(n) − D(n–1))
+ Kd2 (PV(n) − PV(n–1))
PB = proportional band, Ti = integral time, Td = derivative time
E(n) = PV
D(n) = derivative block output
Dk(n) = proportional block output
Di(n) = integrating block output
C(n) = control output
(n-1) = previous value of each (value of previous sample)
Ts = sampling time
100
Ts
Kg = , Kig = Kg PB
Ti
Kd =
Kd2 =
Ts
1
Ts + Td
8
Td
1
Ts + Td
8
(The PID computational algorithm is equivalent to operation B used by our DCP550 instruments.) (continued)
1-23
1. Computational Units
(Continued from previous page)
Derivative-based PID control computation block
Derivative-based PID performs only derivative operations on measured values (PV). It does
not perform derivative operations on set values (SP).
In addition, the derivative-based PID has no dead band processing capability.
Smart tuning and neural network tuning cannot be executed to accomplish AT (auto-tuning)
and overshoot suppression.
Remote setting signal
(RSP)
Ratio setting value
Bias setting value
H2
H1
PV
RATIO
BIAS
LSP
AUTO/MAN/IM
AND
CAS
PV.ALM.H
Value specifying upper PV alarm limit
PV.ALM.L
Value specifying lower PV alarm limit
Value specifying deviation alarm
DEV.ALM
MAN
Value specifying PID group
D
Value specifying proportional band
Value specifying integral time
Value specifying derivative time
Value specifying upper integral time limit
Value specifying lower integral time limit
Group selection
Computation
PV tracking
Value specifying normal or reverse
operation
PI
ΔMV
MV
OFF
Value specifying output
of deviation rate limit
DRL
ON
P1
Tracking input*1
OR
MAN/IM
MDCHG*2
P2
Tracking switching signal*1
OUT
*1 : Used for configuring the auto-balance function.
*2 : Mode change (Auto, Manual, Cascade, Follow, Interlock manual)
1-24
1. Computational Units
No.
Computational
expression
21
Dead time
Mnemonic Computation Dynamic area
time
DED
4
Remarks
L
Input lines Data format
Range
Initial value
Configuration
H1
H1
DED
% format −999.9 to 999.9
0.0
P1
P1
Time format
0 to 6000.0
0.0
OUT
OUT
% format −999.9 to 999.9
—
Computational expression:
Computation
Input H1 is output after the dead time, P1 seconds.
During initialization (P1 second period from start), OUT becomes H1.
P1 is dead time (seconds)
OUT = e –P1 • s × H1
Internal computations input data into the buffers of the 30 dynamic areas (P1/30) and shifts it
between these buffers. Thus if the dead time setting is long, the output is performed staircase
fashion. For example, if dead time P1 is set to 60 seconds, the output is changed
only every 2 seconds since P1/30 is 2.
However, if the P1/30 is lower than the sampling time, the output changes every sampling time.
1-25
1. Computational Units
No.
Computational
expression
22
Lead/lag
Mnemonic Computation Dynamic area
time
L/L
5
Remarks
S
Input lines Data format
Range
Initial value
H1
Configuration
H1
L/L
% format −999.9 to 999.9
0.0
P1
P2
P1
Time format
0 to 6000.0
0.0
P2
Time format
0 to 6000.0
0.0
OUT
OUT
% format −999.9 to 999.9
—
Computational expression:
P1 is lead time (sec).
P2 is lag time (sec).
1 + P1 • S
OUT = × H1
1 + P2 • S
Internal computations calculate sampling time Ts, previous inputs and outputs, H1(–1) and
OUT(–1) respectively according to the following equation.
Computation
Ts
P1
OUT = OUT(–1) + × (H1 − OUT(–1)) + × (H1 − H1(–1))
Ts + P2
Ts + P2
However, when P2 < Ts, P2 is limited to Ts.
When P1 > 16 x P2, P1 is automatically 16 × P2.
OUT when P1 > P2
OUT when P1 < P2
H1
t
1-26
1. Computational Units
No.
Computational
expression
23
Derivation
Mnemonic Computation Dynamic area
time
LED
5
Remarks
S
Input lines Data format
Range
Initial value
H1
Configuration
H1
LED
% format −999.9 to 999.9
0.0
P1
P2
P1
Time format
0 to 6000.0
0.0
P2
Time format
0 to 6000.0
0.0
OUT
OUT
% format −999.9 to 999.9
—
Computational expression:
P1 is lead time (sec).
P2 is lag time (sec).
P1• S
OUT = × H1
1 + P2 • S
Internal computations calculate sampling time Ts, previous inputs and outputs, H1(–1) and
OUT(–1) respectively according to the following equation.
Computation
Ts
P1
OUT = × (H1 − OUT(–1)) + × (H1 − H1(–1))
Ts + P2
Ts + P2
However, when P2 < Ts, P2 is limited to Ts.
When P1 > 16 × P2, P1 is automatically 16 × P2.
OUT when P1 > P2
H1
OUT when P1 < P2
t
1-27
1. Computational Units
No.
Computational
expression
24
Integration
Mnemonic Computation Dynamic area
time
INT
4
Remarks
S
Input lines Data format
Range
Initial value
Configuration
H1 H2
INT
H1
% format −999.9 to 999.9
0.0
P1
H2
% format −999.9 to 999.9
0.0
P2
P1
Time format
P2
Flag format ON = 1, OFF = 0
OFF
OUT
% format −999.9 to 999.9
—
OUT
0 to 6000.0
0.0
Computational expression:
P1 is the integral time (sec).
When P2 is OFF, OUT is H2.
OUT =
When P2 is ON,
Internal computation:
H1
P1 • S
Ts
OUT = OUT(–1) + × H1
P1
Computation
S: Laplacian
OUT(–1): Previous OUT value
Ts: Sampling value
OUT
H1
t
◆Important:
1-28
The resolution of computational units H1, H2 and OUT is 0.033%. Thus an
error is generated if integration is performed on H1 or other inputs where
meaning is assigned to digits below 0.1%.
1. Computational Units
No.
Computational
expression
25 Moving average
Mnemonic Computation Dynamic area
time
MAV
11
Remarks
L
Input lines Data format
Range
Initial value
Configuration
H1
% format −999.9 to 999.9
H1
MAV
0.0
P1
P1
Time format
0 to 6000.0
0.0
OUT
OUT
% format −999.9 to 999.9
—
Computational expression:
This computational unit outputs the arithmetical mean of 30 data items from the start of P1 (sec).
However, when P1 is 0, OUT is H1.
When P1 ≦ 30 × Ts, P1 is 30 × Ts. (Ts is the sampling time.)
Computation
H1
30 items
OUT
t
P1
◆Important:
When the P1 input changes greatly, maximum P1 time has to elapse
before a moving average of P1 time can be calculated.
Example:
When H1 is 50.0%, P1 is 60.0 sec and H1 changes to 100.0% and P1 to 600.0 sec,
the output does not change after 20 sec, but after 20 × n sec.
1-29
1. Computational Units
No.
Computational
expression
26
Flip-flop
Mnemonic Computation Dynamic area
time
RS
1
Remarks
N
Input lines Data format
Range
Initial value
Configuration
H1 H2
H1
Flag format ON = 1, OFF = 0
OFF
H2
Flag format ON = 1, OFF = 0
OFF
OUT
Flag format ON = 1, OFF = 0
—
RS
OUT
Computational expression:
Computation
This computational unit holds ON/OFF data for set input H1 and uses the H2 input to perform
a reset.
When H2 is ON, OUT is unconditionally OFF.
When H2 is OFF and H1 is ON, OUT is ON.
When H1 is ON, OUT is ON.
During initialization OUT is OFF.
1-30
1. Computational Units
No.
Computational
expression
27
Logical product
Mnemonic Computation Dynamic area
time
AND
1
Remarks
N
Input lines Data format
Range
Initial value
Configuration
H1 H2
AND
H1
Flag format ON = 1, OFF = 0
OFF
P1
H2
Flag format ON = 1, OFF = 0
OFF
P2
P1
Flag format ON = 1, OFF = 0
OFF
P2
Flag format ON = 1, OFF = 0
OFF
OUT
Flag format ON = 1, OFF = 0
—
OUT
Computational expression:
Computation
This computational unit performs an AND operation on the four line ON/OFF data.
OUT = H1 ∧ H2 ∧ P1 ∧ P2
1-31
1. Computational Units
No.
Computational
expression
28
Logical OR
Mnemonic Computation Dynamic area
time
OR
1
Remarks
N
Input lines Data format
Range
Initial value
Configuration
H1 H2
OR
H1
Flag format ON = 1, OFF = 0
OFF
P1
H2
Flag format ON = 1, OFF = 0
OFF
P2
P1
Flag format ON = 1, OFF = 0
OFF
P2
Flag format ON = 1, OFF = 0
OFF
OUT
Flag format ON = 1, OFF = 0
—
OUT
Computational expression:
Computation
This computational unit performs an OR operation on the four line ON/OFF data.
OUT = H1 ∨ H2 ∨ P1 ∨ P2
1-32
1. Computational Units
No.
Computational
expression
29
Exclusive OR
Mnemonic Computation Dynamic area
time
XOR
1
Remarks
N
Input lines Data format
Range
Initial value
Configuration
H1 H2
H1
Flag format ON = 1, OFF = 0
OFF
H2
Flag format ON = 1, OFF = 0
OFF
OUT
Flag format ON = 1, OFF = 0
—
XOR
OUT
Computational expression:
This computational unit performs an XOR operation on the two line ON/OFF data.
OUT = H1 ∀ H2
H2
OUT
ON
ON
OFF
OFF
ON
ON
ON
OFF
ON
OFF
OFF
OFF
Computation
H1
1-33
1. Computational Units
No.
Computational
expression
30
Invert
Mnemonic Computation Dynamic area
time
NOT
1
Remarks
N
Input lines Data format
Range
Initial value
Configuration
H1
H1
Flag format ON = 1, OFF = 0
OFF
OUT
Flag format ON = 1, OFF = 0
—
NOT
OUT
Computational expression:
Computation
This computational unit inverts the ON/OFF data.
OUT = H1
1-34
1. Computational Units
No.
Computational
expression
31 2-position transfer switch
Mnemonic Computation Dynamic area
time
SW
1
Remarks
N
Input lines Data format
Range
Initial value
Configuration
H1 H2
SW
P1
H1
% format −999.9 to 999.9
0.0
H2
% format −999.9 to 999.9
0.0
P1
Flag format ON = 1, OFF = 0
OFF
OUT
% format −999.9 to 999.9
—
OUT
Computational expression:
Computation
This computational unit uses P1 to switch inputs H1 and H2.
When P1 is OFF, OUT is H1.
When P1 is ON, OUT is H2.
1-35
1. Computational Units
No.
Computational
expression
Mnemonic Computation Dynamic area
time
32 Softening transfer switch SFT
3
Remarks
S
Input lines Data format
Range
Initial value
Configuration
H1 H2
SFT
H1
% format −999.9 to 999.9
0.0
P1
H2
% format −999.9 to 999.9
0.0
P2
P1
Flag format ON = 1, OFF = 0
OFF
P2
% format −999.9 to 999.9
0.0
OUT
% format −999.9 to 999.9
—
OUT
Computational expression:
This computational unit switches between H1 and H2 for one cycle using a P2 (%) slope for
smooth switching when P1 rises.
When P1 goes from ON to OFF (when a trailing edge is detected), OUT goes from H2 to H1.
When P1 goes from OFF to ON (when a rising edge is detected), OUT goes from H1 to H2.
The P2 (%) slope loses its effect when it reaches H1 or H2.
When P1 is constantly OFF, OUT is H1.
When P1 is constantly ON, OUT is H2.
P2%
Computation
H2
H1
t
P1
1-36
OUT
1. Computational Units
No.
Computational
expression
33
Timer switch
Mnemonic Computation Dynamic area
time
TSW
1
Remarks
N
Input lines Data format
Range
Initial value
Configuration
H1 H2
TSW
P1
H1
Time format
0 to 6000.0
0.0
H2
Time format
0 to 6000.0
0.0
P1
Flag format ON = 1, OFF = 0
OFF
OUT
OUT
Time format
0 to 6000.0
—
Computational expression:
Computation
This computational unit switches between H1 and H2 using P1 time data.
When P1 is OFF, OUT is H1.
When P1 is ON, OUT is H2.
1-37
1. Computational Units
No.
Computational
expression
34
Flag switch
Mnemonic Computation Dynamic area
time
FSW
1
Remarks
N
Input lines Data format
Range
Initial value
Configuration
H1 H2
FSW
P1
H1
Flag format ON = 1, OFF = 0
OFF
H2
Flag format ON = 1, OFF = 0
OFF
P1
Flag format ON = 1, OFF = 0
OFF
OUT
Flag format ON = 1, OFF = 0
OFF
OUT
Computational expression:
Computation
This computational unit switches between H1 and H2 using P1 flag data.
When P1 is OFF, OUT is H1.
When P1 is ON, OUT is H2.
1-38
1. Computational Units
No.
Computational
expression
Mnemonic Computation Dynamic area
time
35 Alternate switch ALSW
2
Remarks
S
Input lines Data format
Range
Initial value
Configuration
H1
ALSW
H1
Flag format ON = 1, OFF = 0
OFF
P1
Flag format ON = 1, OFF = 0
OFF
OUT
Flag format ON = 1, OFF = 0
—
P1
OUT
Computational expression:
Computation
This computational unit inverts the output when the rising edge of H1 is detected.
When P1 is ON, OUT is OFF.
When P1 is OFF, OUT is inverted when the rising edge of H1 is detected.
During initializing, OUT is OFF.
The trailing edge cannot be detected.
1-39
1. Computational Units
No.
Computational
expression
36
Timer
Mnemonic Computation Dynamic area
time
TIM
2
Remarks
S
Input lines Data format
Range
Initial value
Configuration
H1
TIM
H1
Flag format ON = 1, OFF = 0
P1
Time format
OFF
P1
0 to 6000.0
0.0
OUT
Flag format ON = 1, OFF = 0
OUT
Computational expression:
This computational unit generates a pulse for P1 seconds.
The pulse width is the same as the computation cycle time.
When H1 is OFF, OUT is OFF (reset).
When H1 is ON, OUT generates a fixed cycle pulse;.
H1
Computation
OUT
1-40
P1
t
—
1. Computational Units
No.
Computational
expression
37
On delay timer
Mnemonic Computation Dynamic area
time
ONDT
2
Remarks
S
Input lines Data format
Range
Initial value
Configuration
H1
H1
Flag format ON = 1, OFF = 0
P1
Time format
OFF
P1
ONDT
0 to 6000.0
0.0
OUT
Flag format ON = 1, OFF = 0
OUT
—
Computational expression:
When H1 changes to ON, OUT goes ON after P1 seconds.
When H1 changes to OFF, OUT goes OFF unconditionally.
Thus if H1 goes OFF before P1 seconds elapse, OUT stays OFF.
However, during initialization OUT is H1 and if H1 is ON, the delay does not operate with
the result that the output goes ON.
Computation
H1
OUT
P1
P1
t
1-41
1. Computational Units
No.
Computational
expression
38
Off delay timer
Mnemonic Computation Dynamic area
time
OFDT
2
Remarks
S
Input lines Data format
Range
Initial value
Configuration
H1
H1
Flag format ON = 1, OFF = 0
P1
Time format
OFF
P1
OFDT
0 to 6000.0
0.0
OUT
Flag format ON = 1, OFF = 0
OUT
—
Computational expression:
When H1 changes to OFF, OUT goes OFF after P1 seconds.
When H1 changes to ON, OUT goes ON unconditionally.
Thus if H1 goes ON before P1 seconds elapse, OUT stays ON.
However, during initialization OUT is H1 and if H1 is OFF, the delay does not operate with
the result that the output goes OFF.
H1
Computation
OUT
1-42
P1
P1
t
1. Computational Units
No.
Computational
expression
39
One-shot timer
Mnemonic Computation Dynamic area
time
OST
2
Remarks
S
Input lines Data format
Range
Initial value
Configuration
H1
H1
Flag format ON = 1, OFF = 0
P1
Time format
OFF
P1
OST
0 to 6000.0
0.0
OUT
Flag format ON = 1, OFF = 0
OUT
—
Computational expression:
This computational unit outputs a pulse during pulse width P1 when the rising edge of H1 is
detected. Since a second rising edge is not detected during pulse output, it cannot be
retriggered and the pulse is output for P1 seconds from the time the first rising edge is detected.
When OUT is ON and P1 changes, output pulse width changes.
H1
Computation
OUT
P1
P1
P1
t
H1
OUT
P1①
P1②
P1②
t
the time when P1
changes ① to ②
the time when P1
changes ② to 0
1-43
1. Computational Units
No.
Computational
expression
Mnemonic Computation Dynamic area
time
40 Integration pulse output I CPO
4
Remarks
S
Input lines Data format
Range
Initial value
Configuration
H1
CPO
H1
% format −999.9 to 999.9
100.0
P1
% format −999.9 to 999.9
100.0
P2
Flag format ON = 1, OFF = 0
OFF
OUT
Flag format ON = 1, OFF = 0
—
P1
P2
OUT
Computational expression:
This computational unit outputs input H1 percentage (%) data converted to pulse/hour.
OUT = 1000 × P1 × H1 (pulse/time)
The output pulse width is the same as the computation cycle.
When P2 is OFF, OUT goes OFF unconditionally.
Example:
Computation
When H1 is a fixed input of 50.0% and P1 is set to P1 = 100.0%,
the OUT pulse is as follows:
OUT = 1000 × 1.000 × 0.500 = 500 (pulse/hour)
1-44
1. Computational Units
No.
Computational
expression
Mnemonic Computation Dynamic area
time
41 Integration pulse output II CPX
4
Remarks
S
Input lines Data format
Range
Initial value
Configuration
H1 H2
H1
CPX
% format −999.9 to 999.9
0.0
P1
H2
Index format
0 to 30000
1
P2
P1
Index format
0 to 30000
1
P2
Flag format ON = 1, OFF = 0
OFF
OUT
Flag format ON = 1, OFF = 0
—
OUT
Computational expression:
This computational unit performs integration on input H1 each computation cycle and outputs
the number of pulses per hour corresponding to the integration range set by H2 and P1.
The output pulse width is the same as the computation cycle.
When P2 is ON, the internal integrating data is cleared.
The integrating range is set using index data H2 and P1. This index format does not
display an index but integer data in the range 0 to 30000 used to set variable
parameters (index format).
OUT = H1 × (H2/P1) (pulse/hour)
H2 is the input range (input range per hour)
P1 is the output pulse weight (weight of output pulse).
Computation
Example:
When H1 is a fixed input of H1 = 50.0%, H2 is 10000 and P1 is 100, the output is as follows:
OUT = H1 × (H2/P1)
= 0.500 × (10000 ÷ 100) = 50 (pulse/hour)
1-45
1. Computational Units
No.
Computational
expression
Mnemonic Computation Dynamic area
time
42 Pulse width modulation PWM
4
Remarks
S
Input lines Data format
Range
Initial value
Configuration
H1
H1
% format −999.9 to 999.9
0.0
P1
PWM
P1
Time format
0 to 6000.0
0.0
OUT
OUT
Flag format ON = 1, OFF = 0
—
Computational expression:
P1 is the cycle time (sec).
The frequency of OUT going ON during cycle P1 (sec) is proportional to input H1.
When H1 ≦ 0% or P1 < (2 × computation cycle), OUT is forced to OFF.
When H1 ≧ 100%, OUT is forced to ON.
The resolution of ON/OFF is computation cycle/P1.
H1 is sampled once during the P1 cycle and an H1 change during the P1 cycle is ignored.
Computation
H1
t
OUT
P1
P1
P1
P1
P1
Example:
When the computation cycle is 0.1 sec and P1 is 10 sec,
the resolution is 0.1 ÷ 10 = 0.01 i.e. a resolution of 1%.
◆Important:
1-46
This computational unit generates time proportional control which can be
output to DO. However, note that attention is required in setting resolution,
H1 sampling cycle and handling DO characteristics (relay outputs, open
collector outputs and their service life).
1. Computational Units
No.
Computational
expression
Mnemonic Computation Dynamic area
time
43 Ramp signal generation RMP
3
Remarks
S
Input lines Data format
Range
Initial value
Configuration
H1 H2
RMP
H1
Flag format ON = 1, OFF = 0
OFF
P1
H2
Flag format ON = 1, OFF = 0
OFF
P2
P1
Time format
0 to 6000.0
0.0
P2
% format −999.9 to 999.9
100.0
OUT
% format −999.9 to 999.9
—
OUT
Computational expression:
When H1 is OFF, the output is reset and OUT
becomes 0.0%.
When H2 is ON, the output is held.
Setting the time required for P1 to from 0.0% to
100.0%.
When P2 reaches the output value, it is
automatically reset to 0.0% after which the
output starts increasing again.
Computation
Rate of increase =
100
(%/min)
P1 × 60
Thus the time it takes to go from 0% to 100% is
P1.
OUT
P1
P2
t
H1
H2
Reset
Hold
Example:
In a P1 setting of 10.0 (sec), it takes 10 minutes to go from 0% to 100% while it takes 120
minutes to do this when P1 is set to 120.0 (sec). Maximum slope is accomplished when P1
is set to 0.1 (sec) in which case 100% is reached in 0.1 min (6 sec). The increase per
computation cycle is 100 ÷ (60 ÷ 5) or 8.333% at an computation cycle setting of 0.5 sec.
Minimum slope is achieved when P1 is set to 6000.0 (sec) when 100% is reached in 6000
minutes (100 hours). The increase per computation cycle is 1/36000 or 0.000027778% at a
computation cycle setting of 0.1 sec. Thus the internal computations use the floating point
notation for higher precision, however, as the output is rounded off there is a discrepancy
between the results of internal processing and data displayed on the unit monitor. For
example, when P1 is 6000.0 (when an increase to 0.1% takes 6 minutes), the monitor will
start from 0.0% but display a value of 0.05% as 0.1% (since 0.05% is rounded up to 0.1%)
which will then seem to be reached in 3 minutes.
1-47
1. Computational Units
No.
Computational
expression
44
Logarithm
Mnemonic Computation Dynamic area
time
LOG
8
Remarks
N
Input lines Data format
Range
Initial value
Configuration
H1
LOG
H1
% format −999.9 to 999.9
0.0
P1
Flag format ON = 1, OFF = 0
OFF
OUT
% format −999.9 to 999.9
—
P1
OUT
Computational expression:
Computation
When H1 ≦ 0, OUT is 0.
When P1 is OFF, OUT is LOG10 (H1).
When P1 is ON, OUT is LOGe (H1).
1-48
1. Computational Units
No.
Computational
expression
44
Exponent
Mnemonic Computation Dynamic area
time
EXP
18
Remarks
N
Input lines Data format
Range
Initial value
Configuration
H1
EXP
H1
% format −999.9 to 999.9
0.0
P1
Flag format ON = 1, OFF = 0
OFF
OUT
% format −999.9 to 999.9
—
P1
OUT
Computational expression:
Computation
When P1 is OFF, OUT is 10H1. (When H1 ≧ 100 %, OUT is limited.)
When P1 is ON, OUT is eH1.
(When H1 ≧ 230 %, OUT is limited.)
1-49
1. Computational Units
No.
Computational
expression
Mnemonic Computation Dynamic area
time
51 Control variable change I PMD1
8
52 Control variable change II PMD2
Remarks
No limit on numbers used
N
Input lines Data format
Range
Initial value
Configuration
H1
PMD1
or
PMD2
H1
Composite format −999.9 to 6000.0
0.0
P1
Flag format ON = 1, OFF = 0
OFF
P2
Index format
P1
P2
1
1 to 17
OUT
OUT
Composite format −999.9 to 6000.0
—
Computational expression:
PMD1 changes PID1 control variables while PMD2 changes PID2 control variables.
They interpret input H1 as a control variable specified by index data P2 and change
the output depending on the state of P1 and the corresponding PID unit.
When P1 is OFF, control variables are not changed (OUT is the previously held value).
When P1 is ON, control variables are changed (OUT is H1).
When a control variable specified by P2 is either 2 : integral time or 3 : derivative time, time
data has to be input to input line H1. When the specified control variable is 16 : PID
group number, index data has to be connected to input line H1. In other cases
percentage format (%) data has to be connected to input line H1.
Computation
◆Important:
1-50
Make sure that the inputs are limited to the ranges listed below.
P2 exponent
Control variables
Input range
1
2
3
4
5
6
7
Proportional band
Integral Time
Derivative Time
Upper integral time limit
Lower integral time limit
Gap
Output rate of change limit
0.1
0.0
0.0
−200.0
−200.0
0.0
0.0
to
to
to
to
to
to
to
999.9
6000.0
6000.0
200.0
200.0
100.0
100.0
10
11
12
13
14
Ratio
Bias
Deviation monitor
Upper PV monitor limit
Lower PV monitor limit
−999.9
−999.9
0.0
−10.0
−10.0
to
to
to
to
to
999.9
999.9
100.0
110.0
110.0
16
17
PID group number
LSP
0
0.0
to
to
7
100.0 %
%
sec
sec
%
%
%
%
%
%
%
%
%
1. Computational Units
No.
53
Computational
expression
Mode select
(status detection)
Mnemonic Computation Dynamic area
time
MOD
2
Remarks
Only one unit can be used
N
Input lines Data format
Range
Initial value
Configuration
H1 H2
MOD
H1
Flag format ON = 1, OFF = 0
OFF
P1
H2
Flag format ON = 1, OFF = 0
OFF
P2
P1
Flag format ON = 1, OFF = 0
OFF
P2
Flag format ON = 1, OFF = 0
OFF
Computational expression:
Computation
This computational unit changes instrument modes (follow, cascade, auto and manual).
H1 is follow mode.
When ON, the follow mode is selected.
When OFF, follow mode is canceled.
H2 is manual mode.
When ON, the manual mode is selected.
P1 is auto-mode.
When ON, the auto-mode is selected.
P2 is cascade mode.
When ON, the cascade mode is selected.
When H2, P1 and P2 are all ON, the following priority is observed: H2 > P1 > P2. When all
are OFF, the previous state is held.
Example:
When H2 goes ON after the auto mode was
activated by P1 going ON, the manual mode
is activated (①). When subsequently H2
goes OFF, the auto mode is reactivated (as
long as P1 is still ON) (②).
◆Important:
H2
P1
Mode
①
Previous Auto Manual
mode
mode mode
②
Auto
mode
• Only one unit of this computational expression can be used and edge
detection (no. 54) cannot be used to change modes.
• The mode switching keys ( MAN, AUTO and CAS ) are not available.
1-51
1. Computational Units
No.
54
Computational
expression
Mode select
(edge detection)
Mnemonic Computation Dynamic area
time
MODX
2
Remarks
Only one unit can be used
N
Input lines Data format
Range
Initial value
Configuration
H1 H2
MODX
H1
Flag format ON = 1, OFF = 0
OFF
P1
H2
Flag format ON = 1, OFF = 0
OFF
P2
P1
Flag format ON = 1, OFF = 0
OFF
P2
Flag format ON = 1, OFF = 0
OFF
Computation
Computational expression:
This computational unit changes instrument modes (follow, cascade, auto and manual).
H1 is follow mode.
When ON, the follow mode is selected.
When OFF, follow mode is canceled.
H2 is manual mode.
When H2 goes from OFF to ON, the manual mode is selected.
P1 is auto-mode.
When P1 goes from OFF to ON, the auto-mode is selected.
P2 is cascade mode.
When P2 goes from OFF to ON, the cascade mode is selected.
Lines other than H1 use edge detection. Thus the instrument will go from the present mode
to a new mode when a rising edge is detected.
When H2, P1 and P2 are all ON, the following priority is observed: H2 > P1 > P2. When all
are OFF, the previous state is held.
Example:
When H2 goes from OFF to ON after the
auto mode was activated by P1 going from
OFF to ON, the manual mode is activated
(①). If H2 subsequently goes OFF, the
instrument stays in the manual mode (②).
◆Important:
1-52
H2
P1
Mode
①
Previous Auto Manual
mode
mode mode
• Only one unit of this computational expression can be used and status
detection (no. 53) cannot be used to change modes.
• The mode switching keys ( MAN, AUTO and CAS ) are not available.
These keys can be made available through input of internal mode
switching signals (MKY, AKY and CKY) to the input lines.
1. Computational Units
No.
Computational
expression
Mnemonic Computation Dynamic area
time
55 Auto-tuning start/stop 1
AT1
56 Auto-tuning start/stop 2
AT2
1
N
Remarks
Only one unit can be used
Input lines Data format
Range
Initial value
Configuration
H1
AT1
or
AT2
H1
Flag format ON = 1, OFF = 0
OFF
P1
Flag format ON = 1, OFF = 0
OFF
P2
Index format
P1
P2
0 to 30000
1
Computational expression:
Computation
AT1 computational unit performs auto-tuning on PID1 unit.
AT2 computational unit performs auto-tuning on PID2 unit.
H1 starts auto-tuning (edge detection)
Auto-tuning starts when H1 goes from OFF to ON.
P1 stops auto-tuning.
When P1 goes OFF, auto-tuning stops unconditionally (and does not start again.)
P2 specifies the auto-tuning startup mode.
0: does not start up
1: normal auto-tuning
2: auto-tuning protected from overshoots
3: neural network auto-tuning
◆Important:
• Auto-tuning is performed according to the limit cycle. The lower limit on
a PID unit output (OUT) is 0% and the upper limit is 100%. The output
can be limited during auto-tuning by connecting a high and low limiter
after the PID unit. However, since auto-tuning is based on a limit cycle
of 0 ←→ 100%, the written PID parameters will not operate optimally
and manual adjustment is required.
• When this unit is used, the auto-tuning key ( AT ) on the instrument is
disabled. It can be enabled by inputting an internal signal (ATKY) via
the input line.
1-53
1. Computational Units
No.
Computational
expression
57
Data hold
Mnemonic Computation Dynamic area
time
HOLD
1
Remarks
N
Input lines Data format
Range
Initial value
Configuration
H1
HOLD
H1
Composite format −999.9 to 3600.0
P2
Index format
0.0
P2
0 to 30000
1
OUT
OUT
Composite format −999.9 to 3600.0
Computational expression:
Computation
H1 is interpreted as data format specified by index data P2. H1 data or status persist
outages and is output when the system is restarted.
When RAM backup is normal,
OUT is the HOLD value for 1 cycle at restart.
OUT is H1 from second cycle after restart.
When RAM backup fails,
OUT is H1 for 1 cycle at restart.
1-54
P2 specifies the data format of input H1.
1: percentage format
2: time format
3: flag format
4: index format
—
1. Computational Units
No.
Computational
expression
58 Raise/lower unit
Mnemonic Computation Dynamic area
time
RL
3
Remarks
S
Input lines Data format
Range
Initial value
Configuration
H1 H2
RL
H1
Flag format ON = 1, OFF = 0
OFF
P1
H2
Flag format ON = 1, OFF = 0
OFF
P2
P1
% format −999.9 to 999.9
0.0
P2
Flag format ON = 1, OFF = 0
OFF
OUT
% format −999.9 to 999.9
—
OUT
Computational expression:
When H1 is ON (raise), the output increases.
When H2 is ON (lower), the output decreases.
Computation
When H1 is ON and H2 is OFF, OUT = OUT(–1) + Δ
When H1 is OFF and H2 is ON, OUT = OUT(–1) − Δ
When H1 and H2 are ON, OUT = OUT(–1)
When H1 and H2 are OFF, OUT = OUT(–1)
When P2 is OFF, OUT(–1) is the previous OUT value, but at the first time of cold start,
OUT(–1) is 0.0 %.
When P2 is ON, OUT(–1) is P1 value.
There are two speeds for the raise/lower process.
Less than one second after H1 or H2 goes ON Δ= 0.1 %
1 second or longer after H1 or H2 goes ON Δ= 10 × Ts %
1-55
1. Computational Units
No.
Computational
expression
59
Reset
Mnemonic Computation Dynamic area
time
RST
1
Remarks
N
Input lines Data format
Range
Initial value
Configuration
H1
H1
Flag format ON = 1, OFF = 0
OFF
RST
Computational expression:
This computational unit cancels the interlock function.
When H1 is OFF, no operation is performed (control is unaffected).
When H1 is ON, the interlock function is canceled when the following conditions are met.
① When the sensor check does not turn up any input errors.
② When no computation time overloads are generated.
③ When no overflows have occurred.
Computation
◆Important:
1-56
The conditions for going to the interlock manual mode are specified
at setup. (The initial value is 0.)
0: the mode is not invoked
1: invokes the mode when memory related error occurs
2: invokes the mode when memory related or analog input error
occurs
3: invokes the mode when memory related, analog input or
a computation error occurs
1. Computational Units
No.
Computational
expression
Mnemonic Computation Dynamic area
time
Remarks
61 Linearization table 1 TBL1
8
62 Linearization table 2 TBL2
N
63 Linearization table 3 TBL3
Input lines Data format
Configuration
H1
Range
Initial value
H1
% format
−999.9 to 999.9
0.0
OUT
% format
−999.9 to 999.9
—
TBL1
TBL2
TBL3
OUT
Computational expression:
These tables consist of an X1 and Y1 origin and 15 segments (16 points) which are used
for converting (approximation by linearization table) X (H1: input) to Y (OUT: output).
The X and Y axes can be both positive or negative.
When H1 ≦ X1, OUT is Y1 …①
When H1 ≧ X (last point), OUT is Y (last point) …②
Computation
Output
Yn
Yn–1
Y1
②
①
X1
Xn–1
Xn
(n=2, …16)
Input
Two or more linearization tables can be chained to form a single table. To join two tables,
place X1 on the second table over X16 of the first table (see below). Thus X (last point)
must be less than X1 in the second table.
Output
Yn
Yn
TBL2
TBL1
Y1
Y1
X1
Xn
Yn
TBL2
Input
Yn
Output
Y1
TBL2
Output
TBL1
TBL1
Y1
X1
X1 Xn–1 Xn
(n=2, …16)
TBL1
Input
Xn
X1 TBL2 Xn
1-57
1. Computational Units
No.
Computational
expression
Mnemonic Computation Dynamic area
time
Remarks
64 Inverse linearization tables 1 TBR1
8
65 Inverse linearization tables 2 TBR2
N
66 Inverse linearization tables 3 TBR3
Configuration
H1
Input lines Data format
Range
Initial value
H1
% format
−999.9 to 999.9
0.0
OUT
% format
−999.9 to 999.9
—
TBR1
TBR2
TBR3
OUT
Computational expression:
Computation
These tables consist of an X1 and Y1 origin
and 15 segments (16 points) which are used
for converting (approximation by linearization
table) Y (H1: input) to X (OUT: output). The
X and Y axes can be both positive or
negative.
When H1 ≦ Y1,
OUT = X1 …①
When H1 ≧ Y (last point),
OUT = X (last point) …②
Output
②
Xn
Xn–1
X1
①
Y1
Yn–1 Yn
(n=2, …16)
Input
Two or more linearization tables can be chained to form a single table. To join two tables,
place Y1 on the second table over Y16 of the first table (see below). Thus Y (last point) must
be less than Y1 in the second table.
◆Important:
1-58
Linearization and inverse linearization tables #1, #2 and #3 can be
used together. When both types of table are used to make one table,
the conditions Xn+1 > Xn and Yn+1 >Yn must be met to allow correct
conversion between normal and inverse conversions.
1. Computational Units
No.
Computational
expression
Mnemonic Computation Dynamic area
time
67 Time → % conversion TTP
2
N
Remarks
Computational overflow check
Input lines Data format
Range
Initial value
Configuration
H1
TTP
H1
Time format
0 to 6000.0
0.0
P1
Time format
0 to 6000.0
0.0
P2
Time format
0 to 6000.0
0.0
P1
P2
OUT
OUT
% format −999.9 to 999.9
—
Computational expression:
This computational unit converts the time format of input H1 in a span where time format input
P1 is the lower limit and P2 is the upper limit to the percentage (%) format.
OUT =
H1 − P1
P2 − P1
Example:
Computation
P1 is 0.0 sec.
P2 is 600.0 sec.
When H1 is 300.0, OUT is 0.5 (50.0%).
When P1 − P2 is 0, the sign of H1 − P1 causes OUT to become ±999.9% and overflow.
However, when H1 − P1 is 0, OUT is 0.0% and no overflow is generated.
1-59
1. Computational Units
No.
Computational
expression
Mnemonic Computation Dynamic area
time
68 % → Time conversion PTT
2
N
Remarks
Computational overflow check
Input lines Data format
Range
Initial value
Configuration
H1
H1
PTT
% format −999.9 to 999.9
0.0
P1
P2
P1
Time format
0 to 6000.0
0.0
P2
Time format
0 to 6000.0
0.0
OUT
Time format
0 to 6000.0
—
OUT
Computational expression:
This computational unit converts the percentage (%) format of input H1 in a span where time
format input P1 is the lower limit and P2 is the upper limit to the time format.
OUT = H1 × (P2 − P1) + P1
Example:
P1 is 0.0 sec.
P2 is 600.0 sec.
When H1 is 50% (0.5), OUT is 300.0 sec.
Computation
When the result of the computation is negative, OUT is 0.0 sec and an overflow is generated.
1-60
1. Computational Units
No.
Computational
expression
Mnemonic Computation Dynamic area
time
69 Engineering unit parameter selection 1 EGP1
1
70 Engineering unit parameter selection 2 EGP2
N
Remarks
Only one unit can be used
Input lines Data format
Range
Initial value
0 to 30000
0
H1
Configuration
H1
Index format
EGP1
or
EGP2
OUT
OUT
% format −999.9 to 999.9
—
Computation
Computational expression:
This computational unit performs internal computations in the percentage (%) format. The
use of engineering units is limited to the operator and directly related PV and SP indications
and settings. These units are automatically converted to the percentage format in the course
of internal computations. However, engineering units cannot be used to set multi-SP, high
monitors or low monitors so the user has to convert these to the percentage format which is
time-consuming. The engineering unit parameter selection and engineering unit parameter
setting (E. PARA) have been provided to cope with this problem. Engineering unit
parameters (E PARA) set by the engineering units and whose numbers are specified by
index format input H1 are converted to the percentage format by the engineering unit
parameter selection unit. In the conversion from engineering units to the percentage format,
the engineering unit decimal point position set by the input processing data setting (IN), lower
limit and upper limit values (lower and upper limit span) are used as data in the conversion to
convert engineering unit parameters (E. PARA) into the percentage format.
Item
Percentage format output
after EGP selection
Setting value → Percentage format
EP1-0
EP1-1
:
EP1-7
Engineering unit parameter PID1 related items
Engineering unit parameter PID1 related items
:
Engineering unit parameter PID1 related items
66.0U
70.5U
:
115.0U
①→ 55.0%
①→ 58.75%
:
:
①→ 95.833…%
9 EP2-0
10 EP2-1
:
:
EP2-7
16
Engineering unit parameter PID2 related items
Engineering unit parameter PID2 related items
:
Engineering unit parameter PID2 related items
2.00U
6.48U
:
10.50U
②→ 10.0%
②→ 32.4%
:
:
②→ 52.5%
Engineering unit parameter setting (E. PARA)
No. Item code
1
2
:
8
①: These are settings using input processing data (IN [1]) involving decimal point position [1],
lower limit [0.0] and upper limit [120.0]. For example (66 ÷ 120.0) × 100 = 55%, etc.
②: These are settings using input processing data (IN [2]) involving decimal point position [2],
lower limit [0.0] and upper limit [20.00]. For example (2.00 ÷ 20.00) × 100 = 10.0%, etc.
EGP1 is used for PID1 units and EGP2 is used for PID2 units. The item code of the
engineering units consists of 8 numbers from 0 to 8, so 0 is used in specifying indexes
beyond 8 (1-0 or 2-0). Unused PID units can be combined with input processing data setting
(IN) 4 to 6 to call up set values.
1-61
1. Computational Units
No.
Computational
expression
Mnemonic Computation Dynamic area
time
81 % → % table #1
PTB1
82 % → % table #2
PTB2
83 % → % table #3
PTB3
84 % → % table #4
PTB4
5
Remarks
N
Input lines Data format
Range
Initial value
H1
% format −999.9 to 999.9
0.0
OUT
% format −999.9 to 999.9
—
PTB1
∼
Configuration
H1
PTB4
OUT
Computational expression:
Computation
These tables consist of an X1 and Y1 origin and 15 segments (16 points) which are used for
converting (approximation by linearization table) X (H1 : input) to Y (OUT : output).
The X and Y axes can be both positive or negative. This function is identical to the
linearization table function with the exception that tables cannot be chained.
1-62
1. Computational Units
No.
Computational
expression
Mnemonic Computation Dynamic area
time
Remarks
85 % → time table #1 TTB1
86 % → time table #2 TTB2
5
87 % → time table #3 TTB3
N
88 % → time table #4 TTB4
Input lines Data format
Range
Initial value
H1
% format −999.9 to 999.9
0.0
TTB1
∼
Configuration
H1
TTB4
OUT
OUT
Time format
0 to 6000.0
—
Computational expression:
This computational unit converts percentage (%) data to time data using a linearization table.
Tables cannot be chained.
Computation
OUT (sec)
OUT’
Input: H1 (%)
H1’
1-63
1. Computational Units
No.
Computational
expression
Mnemonic Computation Dynamic area
time
Remarks
91 User lamp output #1 UF1
1
92 User lamp output #2 UF2
N
Only one unit can be used
93 User lamp output #3 UF3
Input lines Data format
Range
Initial value
Configuration
H1
UF1
UF2
UF3
H1
Flag format ON = 1, OFF = 0
OFF
P1
Flag format ON = 1, OFF = 0
OFF
P1
Computational expression:
This computational unit controls the UF display LED (user lamp) on the display panel.
When P1 is OFF, the lamps are OFF unconditionally.
When P1 is ON and H1 is also ON, the lamps are lit.
When P1 is ON but H1 is OFF, the lamp are not lit.
Computation
Units #1 to #3 correspond to UF1 to UF3 lamps.
When this unit is not used, the lamps are OFF.
1-64
1. Computational Units
No.
Computational
expression
Mnemonic Computation Dynamic area
time
94 Bar graph display switch BLED
2
N
Remarks
Only one unit can be used
Input lines Data format
Range
Initial value
Configuration
H1
BLED
H1
% format −999.9 to 999.9
0.0
P1
Flag format ON = 1, OFF = 0
OFF
P2
Index format
P1
P2
0 to 30000
1
Computational expression:
Computation
This computational unit selects bar graph data using index data P2.
When P1 is OFF, the bar graph is OFF unconditionally.
When P1 is ON, P2 is 0 and the bar graph displays H1 %.
However, there is a limit of 0 ≦ H1 ≦ 100.
When P1 is ON and P2 is 1, the bar graph displays DI.
DI 1 to 12 are assigned to each LED from the left of the bar graph and the LEDs go ON
when DI goes ON.
When P1 is ON and P2 is 2, the bar graph displays DO.
DO 1 to 8 are assigned to each LED from the left of the bar graph and the LEDs go ON
when DO goes ON.
1-65
1. Computational Units
No.
Computational
expression
Mnemonic Computation Dynamic area
time
Remarks
95 Additional display unit #1 DSP1
96 Additional display unit #2 DSP2
4
97 Additional display unit #3 DSP3
N
Only one unit can be used
98 Additional display unit #4 DSP4
Input lines Data format
Range
Initial value
DSP1
∼
Configuration
H1 H2
DSP4
H1
% format −999.9 to 999.9
0.0
P1
H2
% format −999.9 to 999.9
0.0
P2
P1
Index format
0 to 30000
0
P2
Index format
0 to 30000
0
Computational expression:
Computation
This computational unit adds normal display patterns that are displayed on display panel 1
(PV) and 2 (SP). Percentage (%) format input data H1 is converted according to engineering
unit scaling with analog input numbers specified by index data P1. The data is displayed on
display panel 1. Similarly, input H2 is converted according to engineering unit scaling with the
analog input numbers specified by P2 and the data is displayed on display panel 2.
1 ≦ P1, P2 ≦ 6
(Data is displayed in the percentage format when 0 or a figure of 7 or more is specified.)
1-66
H1 and H2 are limited within the range −10.0 to 110.0% before scaling (however, −19999
or less is displayed as −19999).
Press the DISP key to cycle through displays #1 to #4 to add data to the normal display mode.
2. Using Computational Units
Chapter 2. Using Computational Units
2-1 Overview of Combinations
A great number of computations can be performed by combining different
computational units. This chapter describes combinations of computational units
using standard procedures as examples which can be used to build more complex
configurations. For information on the meaning of internal signals and setting data,
refer to SDC40B Basic Operations (Manual No. CP-UM-1679E or CP-UM-1699E).
2-1
2
2. Using Computational Units
2-2 Basic Combinations of Computational Units
■ Basic Combinations of MAN and PID units (with auto-balance)
① To ensure smooth switching between modes, the output from the MAN unit is
fed back to PID unit P1 (tracking input). In manual mode, the PID unit
automatically receives the tracking input and the output changes according to
MAN unit operations. When the mode changes back to auto mode, PID calculates
the most recently received tracking input for smooth switching.
② The tracking input is not received internally, instead the output signal is input to
AIR2 (analog input 2) and AIR3 (analog input 3; but this requires a converter
resistor) which are connected externally. However, this means that one analog
input is occupied.
AIR2
①
②
H1
1
H2
H1
1
P1
PID1
H2
P1
PID1
OFF
OFF
P2
P2
OUT
OUT
0.0%
H1
2
0.0%
H2
P1
AO1
OFF
MAN
H1
2
H2
P1
P2
OUT
AO1
2-2
AO1
OFF
MAN
P2
OUT
AO1
2. Using Computational Units
■ Inserting HLLM units (high/low limiter) between PID and MAN units (with
auto-balance)
An HLLM unit (high/low limiter) can be used to limit PID unit output. PPA is
shown in the example below, but a variable internal signal could be input instead,
in which case the DI input can be used to change the limit value.
PPA01
H1
1
H2
H1
3
P1
PID1
H2
P1
PID1
OFF
H2
P1
P2
OUT
OUT
H1
2
H1
4
OUT
PPA03
HLLM
P1 High limiter
(Example:PPA01)
Low limiter
High limiter
P1
0.0%
P1
SW
DI1
Low limiter
OUT
0.0%
H2
P1
AO1
OFF
MAN
H1
5
H2
P1
AO1
OFF
MAN
P2
AO1
H2
P2
OUT
OUT
PPA04
H1
2
HLLM
P2 (Example:PPA02)
OUT
H1
3
DI1
SW
OFF
P2
PPA02
H1
1
P2
OUT
AO1
2-3
2. Using Computational Units
■ Inserting SW (2-position transfer switch) units between PID and MAN units
(with auto-balance)
The preset output can be extracted by inserting a switch unit between the PID unit
and MAN unit to switch percentage data. Although it is possible to install the switch
after the MAN unit, this should be avoided as it may disable manual operation in
an emergency.
In the figure below, DI performs the switching operation and PPA01 sets the preset
value. When the preset value has to be adjusted on-site, store the set PPA value in
the UF key to simplify subsequent access.
H1
1
H2
P1
PID1
OFF
P2
OUT
PPA01
H1
2
H2
P1
DI1
SW
OUT
0.0%
H1
3
H2
P1
AO1
OFF
MAN
P2
OUT
AO1
2-4
2. Using Computational Units
■ Inserting computations between MAN and AO1 (with auto-balance)
To perform characteristics compensation of operations and other computations
involving linearization tables, the tracking input to the MAN unit is returned after
performing a reverse computation.
◆ Important:
The output of a reverse computation must be fed to a unit ahead of the one
it is connected to. In the example below, 2; TBR unit is connected to 3; MAN
unit.
H1
1
H2
P1
PID1
OFF
P2
OUT
H1
3
H2
P1
MAN
OFF
P2
OUT
AO1
H1
4
H1
2
TBL1
OUT
TBR1
OUT
AO1
2-5
2. Using Computational Units
■ Ensuring preset output during cold start
In a cold start, a preset output value entered at setup is written to AO1 before the
first computation process. This value is inherited by the computation process. In
order to start from the actual output before the preset value, AO1 has to be registered
in the tracking output in the MAN unit. The preset mode setting is enabled in
manual mode only. In auto and cascade mode, the AO1 value is soon overwritten
by the PID computation result or other units and targeted preset output cannot be
obtained. By entering a value other than AO1 in the tracking input of the MAN unit
shown in the lower right figure, it is possible to start output from this value in
manual mode regardless of hot or cold start.
H1
H2
H1
H2
P1
PID1
P1
PID1
OFF
OFF
P2
P2
OUT
H1
OUT
H2
H1
H2
P1
P1
AO1
OFF
MAN
P2
OUT
AO1
2-6
0.0%
OFF
MAN
P2
OUT
AO1
2. Using Computational Units
■ Ratio bias computation
The ADD unit facilitates ratio bias computation. The ADD unit computational
expressions are as follows
OUT = H1 × P1 + H2 × P2
If H2 in this equation is replaced by a fixed parameter, 100.0% (1.000),
OUT = H1 × P1 + 1.000 × P2
This means that P1 is set as PPA01 and P2 as PPA02.
OUT = H1 × PPA01 + PPA02
Input H1 can be replaced by the following,
PPA01 is ratio
( − 999.9 to 999.9%)
PPA02 is bias
( − 999.9 to 999.9%)
Instead of a PPA setting, a variable signal can be entered as shown in the example
given below to calculate variable ratios and biases.
Example:
35.0% input
100.0%
H2
P1
H1
PPA01
PPA02
ADD
100.0%
H2
P1
H1
ADD
P2
OUT
P2
OUT
100.0%
H2
P1
H1
PPA01 = 10.0%
PPA02 = 2.0%
ADD
P2
OUT
5.5% output
2-7
2. Using Computational Units
■ Multi-SP setting 1
The
keys on the front panel can be used to directly set the local SP of the
instrument. There are no parameters for storing local SPs. For this reason, to store
several local SPs and switch between multiple SPs like the SDC40A, local SP values
are rewritten using the control variable change unit (PMD 1 or 2). If the engineering
unit parameter selection unit (EGP 1 or 2) is used in the previous stage, it is possible
to directly set engineering units. However, when the PMD1 P1 line goes ON, the
PMD1 setting is always enabled and settings made with the front panel
keys are ignored. Read the “Multi-SP setting 2” on the following page for information
on how to avoid this problem.
Outline of settings:
• DI is converted to index data with the digital input processing data setting (in the
example, DI 1 to 3 are converted to index data 0 to 7).
• Local SPs are set in engineering units using engineering unit parameter selection
unit (EGP 1 or EGP 2) (66.0U... in the example).
• The output from EGP 1 is connected to H1 on PMD 1.
• LSP is selected and registered in P2 on PMD1.
Digital input processing data setting
No. 1 digital input process 1 start; 1
No. 7 digital input process 1 units; 3
DI01 is the
starting point.
Three DI inputs
are handled as
binary data.
(0,1, …,7)
Controller internal signal index format
DIX1
H1
1
The numbers (0 to 7) of the
engineering unit parameter
specified in index data are
converted to percentage data
and output (the conversion
process uses floating point
notation).
No. of engineering unit
Digital inputs parameters
DI1
DI2
DI3
2-8
A digital input is converted to index data
and output to DIX1.
1
2
3
4
5
6
7
8
EP1-0; 66.0
EP1-1; 70.5
EP1-2; :
EP1-3;
EP1-4;
EP1-5;
EP1-6;
EP1-7;
EGP1
OUT
H1
2
P1
1 (ON)
LSP
PMD1
P2
Example:
In the above example, when DI1, DI2 and DI3 are all
OFF, DIX1 is 0. EP1-0 66.0U is used to convert the
decimal place, upper and lower limit of the input set
with the input processing data setting to percentage
data which is output. PMD1 automatically changes the
LSP value in the PID1 unit according to LSP set in P2
according to input H1.
2. Using Computational Units
■ Multi-SP setting 2
In “Multi-SP setting 1,” above the PMD setting was used. However, in order to use
the front panel
keys and local SP settings, multi-SP is assigned to a remote
setting. Local SP can still be modified using the front panel
keys.
Outline of settings:
• Select the control types (control type 1, 2 or 3) that can accept remote setting
inputs (in the example control type 1 is selected).
• DI is converted to index data using digital input processing data settings (in the
example, DI4 to 6 is converted to index data 0 to 7).
• The engineering unit parameter selection unit (EGP1 or EGP 2) is used to set
remote SP (or multi-SP) using engineering units (70.5U in the example).
• Controller internal signal index format DIX2 is set in EGP1 H1.
AUTO
• When the auto mode is invoked with the AUTO
key, local SP can be
modified with the
keys and when the cascade mode is invoked with the
CAS
CAS
key, a DI input can be used to select SP.
Digital input processing data setting
No. 2 digital input process 1 start; 4
No. 8 digital input process 1 units; 3
DI4 is the
starting point.
Three DI inputs
are handled as
binary data.
(0,1, …,7)
A digital input is converted to index format data
and output to DIX2.
Controller internal signal index data
DIX2
H1
1
The numbers (0 to 7) of the
engineering unit parameter
specified in index data are
converted to percentage data
and output (the conversion
process uses floating point
notation).
EGP1
OUT
No. of engineering unit
Digital inputs parameters
DI4
DI5
DI6
1
2
3
4
5
6
7
8
EP1-0; 66.0
EP1-1; 70.5
EP1-2; :
EP1-3;
EP1-4;
EP1-5;
EP1-6;
EP1-7;
Example:
In the above example,
when DI4 is ON and DI5
and DI6 are OFF, DIX2 is
1. EP1-1 70.5U is used to
convert the decimal place,
upper and lower limit of
the input set with the input
processing data setting to
percentage data which is
output.
H1
2
H2
P1
PID1
P2
OUT
2-9
2. Using Computational Units
■ PID group changes
The PMD unit is used to change PID group numbers to DI inputs.
Digital input processing data setting
No. 1 digital input process 1 start; 1
No. 7 digital input process 1 units; 3
DI01 is the
starting point.
Three DI inputs
are handled as
binary data.
(0,1, …,7)
A digital input is converted to index data
and output to DIX1.
Controller internal signal index data
DIX1
H1
P1
ON
PIDNo
PMD1
P2
Digital inputs
DI1
DI2
DI3
2-10
Example:
In the above example, when DI1 is OFF, DI2 and DI3
are ON, DIX1 is 2 and 2 is entered in H1. PMD1
automatically converts this to group number 2 (in the
same way as PID group numbers used by the PID1
unit are entered in input H1) according to the value
(here a PID group number) of the P2 control variable.
2. Using Computational Units
■ Changing proportional band continuously to suit settings or other factors
When the response characteristics of the control system are not uniform, the
linearization table unit and PMD unit are used to change a proportional band with
a set value. When internal signal SP (1 or 2) is registered, it is possible to extract
the set value (local or remote SP) used by the PID 1 or 2 unit.
When a PV value is used instead of an SP setting value in the registration of an
internal signal, continuous changes can be made to the proportional band using the
PV value. And when a DEV value is used, continuous changes can be made to the
proportional band using the deviation between SP and PV values.
Output
TBL1 setting
example
Y7
Internal signal/controller system
SP1
Y
H1
1
Y1
TBL1
Y13
OUT
X1
X7
X13
X
Input
H1
2
P1
ON
P (Proportional band)
PMD1
P2
2-11
2. Using Computational Units
■ Using follow mode
Normally, the control signal from the host computer is input “as is” (follow mode)
and control and output operations are performed only when required. In the example
shown below, the MAN key MAN on the front panel or mode switching using DI02
are used to manipulate the output.
Follow input
AI2
DI01
AI1
SP1
H1
3
DI02
MKY
H2
H2
H1
1
P1
PID1
OFF
P1
P2
OUT
OUT
H1
2
H2
P1
AKY
CKY
MODX
P2
H1
4
H2
P1
AO1
OFF
MAN
P2
OUT
AO1
2-12
OFF
OFF
OR
P2
2. Using Computational Units
■ Smoothing changes from auto to cascade mode
When a change is made from the auto mode to the cascade mode, the sudden change
in the SP value causes a surge in the output. In the example given below, the SFT
unit (softening transfer switch) is used to suppress SP changes and ensure smooth
switching. SP1, a PID1 unit internal signal, is stored in input H1 of the SFT unit.
This means that the SP1 is initial value used in the transition from the auto mode
to the cascade mode. Similarly, a CAS internal signal is stored in input P1. This
signal starts a synchronized remote SP value change when a control mode is switched.
The speed of switching from SP1 to remote setting value AI2 is determined by
PPA01 (variable parameter 1) and performed in PPA01% slope per computation
cycle.
AI1
AI2
SP1
H1
1
H2
P1
CAS
PPA01
SFT
P2
OUT
H1
2
H2
P1
PID1
OFF
P2
OUT
H1
3
H2
P1
AO1
OFF
MAN
P2
OUT
AO1
2-13
2. Using Computational Units
■ Analog changes of remote setting signals using external contacts
The DI input raises or lowers remote setting signals by analog means. The speed of
the raise/lower process is determined by the RL unit and continuous changes are
possible when a contact is installed.
Less than 1 sec after going ON: deviation rate = 0.1%
1 sec or more after going ON: deviation rate = 10 × Ts%
To start a remote setting value from SP1, input P2 on the RL unit must go ON. Note
that this requires the processing sequence illustrated below.
DI01 (raise) DI02 (lower)
H1
2
AI1
H2
P1
SP1
ON
RL
P2
OUT
In the above example, when the power is
turned on in cascade mode, SP1 is 0.0%. A
HOLD unit has to be installed to retain SP1
value during hot start.
H1
1
H2
P1
RL
ON
P1
PID1
OUT
H2
P1
AO1
OFF
P2
1
OUT
P2
OUT
AO1
2-14
OFF
P2
MAN
HOLD
P2
OUT
H2
H1
4
SP1
H1
1
H1
3
2. Using Computational Units
■ Sample hold
The SW unit is used to configure the sample hold function provided by sample value
P1 control.
Input
H1
H2
P1
SW
Input is sampled when ON
and held when OFF
OUT
Output
H1
Input
P1
Input fetch
signal
Time
Sampling
Holding
Output
2-15
2. Using Computational Units
■ Integration pulse output
Analog amounts are converted to pulse outputs.
Flow meter (0.0 ∼ 100.0m3/h)
4.00 ∼ 20.00mA
Example:
In this example, a flow rate of 100.0 m3 is converted to an
output pulse where OUT is 1.000 × (1000/1) = 1000
(pulse/hour).
AI1
1000
H2
H1
P1
1
CPX
P2
OUT
From integrating reset circuit
(The integration is reset inside the unit at ON.)
DO1
2-16
2. Using Computational Units
■ Analog integration
Analog integration is performed internally using an integration pulse output.
Percentage data is handled internally in the IEEE floating point notation which can
process 6 to 7 digit decimals and thus has a resolution of 0.01% or more. However,
the second decimal is rounded off to ( ×××.× ). The output resolution when
integrating values are converted to analog output equals the resolution of the D/A
(digital → analog) converter or 1/10000, which requires that the result of integration
has to be handled with care in terms of integration accuracy and integration scale.
Flow meter (0.0 ∼ 100.0m3/h)
4.00 ∼ 20.00mA
A : P1 = ON
Flow when pulse is ON
B : P1 = OFF
Flow when pulse is OFF
AI1
A
Pulse weight is 0.1 m3
0.1
H1
2
H2
P1
100.0
ADD
100.0
P2
OUT
1000
H2
B
H1
1
H1
3
H2
P1
1
P2
SW
OUT
OUT
(0.1
0.0
H1
4
P1
CPX
H2
m3/pulse)
From integration
reset circuit
(integration is
reset when ON)
P1
SW
OUT
Integration amount (analog)
1% corresponds to 1m3
2-17
2. Using Computational Units
■ Pulse to analog integration
The sampling cycle of the digital input unit of this instrument is the same as the
computation cycle and is therefore not a high-speed cycle. As a result, only reasonably
slow pulses can be converted to analog signals. Pulses should be (1/(computation
cycle × 2) Hz (1 to 5 Hz) or less.
Flow meter (0.0 ∼ 100.0m3/h)
0 to 1000 pulse/h
(0.1m3/pulse)
A : P1 = ON
Flow when pulse is ON
B : P1 = OFF
Flow when pulse is OFF
DI01
A
Pulse weight is 0.1 m3
0.1
H1
1
H2
P1
100.0
ADD
10.0
P2
OUT
Weight of integration is
changed by 10/100
B
H1
2
H2
P1
DI01CG
SW
(0.1 m3/pulse)
OUT
0.0
H1
3
H2
P1
SW
OFF
OUT
Integration amount (analog)
1% corresponds to 10m3
2-18
3. Application Examples
Chapter 3. Application Examples
3-1 Overview
This chapter provides a number of examples of SDC40B applications. Use them
together with the computational unit applications described in Chapter 2.
◆ Important:
Typical application examples are given in this chapter. However, each
application is based on different concepts and many situations call for
combinations of several computational units, thus the combinations configured
here are given only as a guide.
Yamatake Corporation shall not be held liable for any damage that may arise
from the use of the examples given in this manual.
3
3-1
3. Application Examples
3-2 Automatic Combustion Control for Saving Energy and Reducing Pollution
■ General
● Cross-limit control to prevent generation of black smoke during load changes.
● Air fuel ratio control for low excess air control in combustion
● Recuperator for temperature compensation of air flow
■ Instrumentation examples
Signal from furnace temperature controller
Air flow
Fuel flow
Controller
Controller
Deviation rate limiter
<
+B
>
−B
>
−B
<
+B
f(x)
PI
1/f(x)
MAN
PI
Input processing
÷ √
MAN
SDC40A
RDY CH1
REM CH2
MAN CH3
COM
SP
DEV
OUT
SDC40B
OUT
EV1
EV2
SP/EV
EV3
A/M
LOADER AT
OT1
UF1
R/L
OT2
UF2
AT
UF
DISP
PARA
SDC40B
ENT
FLW CH1
CAS CH2
AUT IM
MAN
FLW CH1
CAS CH2
AUT IM
MAN
SP
LCK
OUT
SP
LCK
OUT
OUT
UF1
Furnace temperature
controller
OUT
UF2
MAN
UF3
AUTO
LOADER AT
OT1
UF1
CAS
OT2
UF2
AT
FZY
DISP
UF1
PARA
UF2
MAN
ENT
UF3
AUTO
LOADER AT
Air flow
controller
OT1
UF1
CAS
OT2
UF2
AT
FZY
DISP
PARA
ENT
Fuel flow
controller
Air
Temperature sensor
Air
temperature
sensor
Air flow
sensor
Fuel
Combustion furnace
3-2
Fuel flow
sensor
3. Application Examples
■ Computation design
Air flow controller
Fuel flow controller
Air temperature Air flow Signal from fuel controller
AI1
AI2
AI3
Signal from temperature Signal from air flow
controller
controller
Fuel flow
AI1
AI2
AI3
100.0
H1
2
H1
1
H2
P1
PID1
H1
6
TBL1
0 (OFF)
H2
H1
9
P1
PID1
H2
LSE
0 (OFF)
P2
H1
8
H2
P1
PPA
ADD
PPA
P2
OUT
OUT
OUT
H1
4
H1
1
P2
OUT
OUT
PPA
TBR1
100.0
H2
H1
11
P1
PPA
DRL
H2
H1
10
HSE
H2
P1
PPA
SUB
PPA
P2
OUT
OUT
OUT
OUT
100.0
H1
3
H2
H1
2
HSE
H2
P1
PPA
SUB
PPA
P2
OUT
OUT
100.0
H1
3
H1
7
H2
P1
AO1
0 (OFF)
MAN
H2
P1
MAN
OUT
OUT
Signal to air flow
controller valve
H2
LSE
H1
4
H2
P1
AO2
Signal to fuel
flow controller
AO1
Signal to fuel
flow controller
valve
PPA
ADD
P2
P2
AO1
AO1
0 (OFF)
H1
5
PPA
P2
OUT
OUT
AO2
Signal to air
flow controller
■ Hints
○ In temperature compensation of air flow, temperature inputs are assigned lower numbers than
flow inputs due to the computation sequence.
○ AIR3 is a 1 to 5 V input so a 250 Ω precision conversion capacitor is required in the above wiring
diagram.
Capacitor Part No. 81401325 (one capacitor, precision ± 0.02%)
3-3
3. Application Examples
3-3 Feed-forward Control of Boiler Liquid Level Control
■ General
● Steam flow fluctuations are anticipated and controlled to compensate for lag in load
characteristics.
● Cascade control of water supply flow compensates for lag in load characteristics and
prevents overshoots during level control.
■ Instrumentation examples
Steam flow sensor
√
L/L
Drum level
sensor
+
PID
√
PI
MAN
Water supply flow
sensor
Steam flow
sensor
Steam
SDC40B
Drum level sensor
Boiler (drum)
FLW CH1
CAS CH2
AUT IM
MAN
SP
LCK
OUT
OUT
UF1
UF2
MAN
UF3
AUTO
LOADER AT
OT1
UF1
CAS
OT2
UF2
AT
FZY
DISP
PARA
ENT
Water supply
3-4
Water supply
flow sensor
3. Application Examples
■ Computation design
Drum level sensor
AIR1
Steam flow sensor Water supply flow sensor
AIR2
AIR3
Input processing
AI1
√
√
AI2
AI3
SP1
H1
3
H2
H1
1
P1
PID1
P1
TPA
TPA
L/L
0 (OFF)
P2
P2
OUT
OUT
H1
4
H2
P1
100.0
PPA1
ADD
H1
2
H2
P1
100.0
PPA1
SUB
P2
P2
OUT
OUT
H1
5
H2
P1
PID2
0 (OFF)
P2
OUT
0.0
H1
6
H2
P1
AO1
0 (OFF)
MAN
P2
OUT
AO1
Signal to water supply
flow control valve
■ Hints
○ Tracking input P1 to the PID1 unit is returned after processing in the reverse computational SUB
unit in the ADD unit.
○ SP2 is input to input line H1 on the SUB unit to perform auto-balance when modes change from
auto to cascade mode.
3-5
3. Application Examples
3-4 Compressor Over-ride Control
■ General
● Unified control of pressure and flow rates
● Smooth switching from auto to manual
● PID calculations of pressure and flow control can be added to the manipulate signal using
a fixed deviation.
■ Instrumentation examples
Pressure sensor
Flow sensor
√
PID1
PID2
<
<
<
+
+
MAN
FLW CH1
CAS CH2
AUT IM
MAN
SP
LCK
OUT
OUT
UF1
UF2
MAN
UF3
AUTO
LOADER AT
OT1
UF1
CAS
OT2
UF2
PARA
AT
FZY
DISP
SDC40B
ENT
Bleed
valve
Compressor
Pressure sensor
3-6
Flow sensor
Factory needing
compressed air
3. Application Examples
■ Computation design
Flow sensor
AIR2
Pressure sensor
AIR1
Input processing
√
AI2
AI1
SP1
H1
2
H2
P1
MAN
SW
H1
3
SP2
H2
H1
7
P1
PID1
H2
PID2
0 (OFF)
P1
OUT
H2
H1
9
LSE
OUT
H2
LSE
OUT
OUT
PPA
H1
4
MAN
SW
P2
OUT
H1
5
H2
0 (OFF)
P2
OUT
H1
2
P1
PPA
H2
P1
100.0
100.0
ADD
H1
10
H2
H1
8
LSE
H2
P1
100.0
100.0
ADD
P2
OUT
P2
OUT
H1
11
OUT
H2
P1
AO1
0 (OFF)
MAN
P2
OUT
0 (OFF) MKY
AO1
H1
1
H2
P1
AKY
0 (OFF)
MODX
Signal to bleed valve
(fully open at 4 mA)
P2
■ Hints
○ Since LSP is input to each PID, controller type 3 was selected. As shown above, the MODX unit
was used but only in the auto and man modes since the CAS mode was not used.
○ PID1 performs reverse processing and PID2 performs normal processing.
3-7
Chapter 4. Precision
4. Precision
4-1 General
The SDC40B is a single loop controller which offers high-speed and highly accurate
computation processing. The precision of a computational unit does not normally
require special attention, but when different types of computations are combined and
special applications are used, care is needed. This chapter provides a list of
computational units giving the precision provided by SDC40B and their conditions.
■ Precision of floating point computations
The percentage data used in internal computations are processed as single-precision
floating point representation. Although multiplication and division do not involve a
restriction on the decimal point position, addition and subtraction sometimes do.
Example: Computation deviations that occur in the ADD unit
ADD:OUT = (H1 × P1) + (H2 × P2)
H1 = 100.0%
(internal data = 1.000)
P1 = 100.0%
(internal data = 1.000)
H2 = 0.1%
(internal data = 0.001)
P2 = 0.1%
(internal data = 0.001)
The above inputs are handled by the ADD unit.
(H1 × P1) becomes 1.000 × 1.000 = 1.000000 (Note that: 100% × 100% = 100%).
(H2 × P2) becomes 0.001 × 0.001 = 0.000001 (Note that: 0.1% × 0.1% = 0.0001%).
The mantissa in IEEE single-precision floating point representation is 24 bits, giving
223 significant digits, or 6 to 7 significant decimal digits. Consequently, when decimals
with 7 different digits are added, an error occurs as additions involving 8 different
digits are not performed. In the above example, adding 1.000000 and 0.000001
where the difference is greater than 7 digits will generate an error. In the above
example, “H2 = 0.01%” (not a possible setting, but a possible input from a unit in
a previous stage) and if one more digit is added, there will be more than 8 different
digits causing the addition to be aborted and OUT becomes 100%.
Note that it is not that figures such as 0.0001% (0.00001) cannot be used, the
problem occurs when the 8 digits of the mantissa and non-mantissa differ. Incidentally,
adding 10% (0.1) to 0.0001% (0.000001) does not produce an error.
◆ Important:
The range of percentage data used in the SDC40B is –999.9 to 999.9% and
digits less than 0.01% can produce numbers of 7 digits. Thus, it is
recommended practice not to assign meaning to digits below 0.001% to
prevent computation errors.
■ Precision of time computations
In internal computations time data is processed at a resolution of 0.1 sec. As a result,
smaller time values are rounded up.
4-1
4
4. Precision
■ Other items requiring consideration
● Analog input
Precision of analog input: ± 0.1% FS + 1U
(depends on standard conditions, indication conversion and ranges)
Input resolution:
1/20000
● Analog output (4 to 20 mA output)
Output precision:
± 0.1% FS or less (depends on operating conditions)
Output resolution:
1/10000
● Absolute time (precision of internal quartz oscillator)
Absolute time precision: ± 0.01% (depends on operating conditions)
Max ± 0.36 sec/hour (3600 sec)
Max ± 8.64 sec/day (24 hours)
■ Calculating computation precision
● System precision Z for n number of computations is shown below.
X1, X2, …, Xn indicates the precision of each computational expression.
4-2
4. Precision
4-2 List of Computational Unit Precision
No.
Computational expression Mnemonic
1
2
3
4
5
6
7
8
9
10
11
12
13
14
15
16
17
18
19
20
21
22
23
Addition
Subtraction
Multiplication
Division
Absolute value
Square-root extraction
Maximum value
Minimum value
4-point addition
High selector (low limiter)
Low selector (high limiter)
High and low limiter
High monitor
Low monitor
Deviation monitor
Deviation rate limiter
Deviation rate monitor
Manual output
Controller #1
Controller #2
Dead time
Lead/lag
Derivation
ADD
SUB
MUL
DIV
ABS
SQR
MAX
MIN
SGM
HSE
LSE
HLLM
HMS
LMS
DMS
DRL
DRM
MAN*
PID1*
PID2*
DED
L/L
LED
24
Integration
INT
25
26
27
28
29
30
31
32
33
34
35
36
37
38
39
40
41
42
43
44
45
46
47
48
49
50
Moving average
Flip-flop
Logical product
Logical OR
Exclusive OR
Invert
2-position transfer switch
Softening transfer switch
Timer switch
Flag switch
Alternate switch
Timer
On delay timer
Off delay timer
One-shot timer
Integration pulse output I
Integration pulse output II
Pulse width modulation
Ramp signal generation
Logarithm
Exponent
MAV
RS
AND
OR
XOR
NOT
SW
SFT
TSW
FSW
ALSW
TIM
ONDT
OFDT
OST
CPO
CPX
PWM
RMP
LOG
EXP
Precision
±0.01%
±0.01%
±0.01%
±0.01%
Conditions
P1 and P2 must be fixed
P1 and P2 must be fixed
P1 must be fixed
±0.01%
Resolution 0.001% or greater
Resolution 0.001% or greater
±0.01%
±0.006/Ts%
(0 to P1/30) min.
(0 to P1/30) min.
±Ts × 2
±Ts × 2
(0 to P1/30) min.
±Ts
±Ts
±Ts
±Ts
±0.1%
±0.1%
Ts/P1 × 100%
±Ts
±0.01%
±0.01%
Resolution 0.001% or greater
Resolution 0.001% or greater
Resolution 0.001% or greater
Resolution 0.001% or greater
Resolution 0.001% or greater
Resolution 0.001% or greater
Controls outputs 1 min later
Precision of check time
Set resolution is 0.1%
However P1 > computation cycle
Ts is the computation cycle
Ts is the computation cycle
Output resolution is 0.033%, digits lower
than 0.1% of H1 input cannot be guaranteed.
However P1 > computation cycle
Resolution of ON/OFF comparison
Ts: computation cycle, *: Only one computation with the same computation cycle can be used.
4-3
4. Precision
No.
51
52
53
54
55
56
57
58
59
60
61
62
63
64
65
66
67
68
69
70
71
72
73
74
75
76
77
78
79
80
81
82
83
84
85
86
87
88
89
90
91
92
93
94
95
96
97
98
99
100
Computational expression Mnemonic
Precision
Control variable change I
Control variable change II
Mode select (status detection)
Mode select (edge detection)
Auto-tuning start/stop 1
Auto-tuning start/stop 2
Data hold
Raise/lower unit
Reset
PMD1*
PMD2*
MOD*
MODX*
AT1*
AT2*
HOLD
RL
RST*
Linearization table 1
Linearization table 2
Linearization table 3
Inverse linearization tables 1
Inverse linearization tables 2
Inverse linearization tables 3
Time → % conversion
% → Time conversion
Engineering unit parameter selection 1
Engineering unit parameter selection 2
TBL1
TBL2
TBL3
TBR1
TBR2
TBR3
TTP
PTT
EGP1*
EGP2*
±0.01%
±0.01%
±0.01%
±0.01%
±0.01%
±0.01%
±0.01%
±0.1 sec.
% → % table #1
% → % table #2
% → % table #3
% → % table #4
% → time table #1
% → time table #2
% → time table #3
% → time table #4
PTB1
PTB2
PTB3
PTB4
TTB1
TTB2
TTB3
TTB4
±0.01%
±0.01%
±0.01%
±0.01%
±0.1 sec.
±0.1 sec.
±0.1 sec.
±0.1 sec.
User lamp output #1
User lamp output #2
User lamp output #3
Bar graph display switch
Additional display unit #1
Additional display unit #2
Additional display unit #3
Additional display unit #4
UF1*
UF2*
UF3*
BLED*
DSP1*
DSP2*
DSP3*
DSP4*
*: Only one computation with the same computation cycle can be used.
4-4
Conditions
Chapter 5. Data Sheets
5. Data Sheets
5-1 General
The data sheets in this chapter have been provided as a summary of applications (a
reference for computation design, etc.). Although they can be used as documents
that are to be submitted or filed, the PC loader should be used for this to prevent
transcription errors. Refer to the “Smart Loader Package SLPC4B User’s Manual”
(Manual No. CP-UM-1681E) for information on how to create data sheets.
5-2 Data that Can be Changed after Operation
Data items that can be modified by the SDC40B are indicated by an asterisk (*).
5
5-1
Data sheets for the SDC40B Digital Indicating Controller
Customer Name
Date
Control Device
Manufacturer
Control Specification No.
Approval
Tag No.
Modifications
Model
C40B
□ 2G4AS06
□ 5G4AS09
□ 1 (no communications)
□ Other information ( )
Page 1/9
□ D0 (data enclosed)
□ Other information ( )
■ Setup data
SDC40B
code
Item
Description
(0 to 30000)
* C01
C40B management No.
* C02
Computation cycle
□ 1:100ms, □ 2:200ms, □ 3:300ms, □ 4:400ms, □ 5:500ms
* C03
Control type
□ 0:1PID (A/M), □ 1:1PID (A/M/C), □ 2:2PID (A/M/C), □ 3:2PID (A/M/C)
* C04
IM mode transition condition settings □ 0:no transitions, □ 1:memory error, □ 2:memory/AI error, □ 3:memory/AI/computation error
* C05
Startup procedure
□ 0:cold start, □ 1:hot start
* C06
Preset mode
□ 0:auto (AUTO), □ 1:manual (MAN), □ 2:cascade (CAS)
* C07
Preset output
* C08
Preset LSP1
(0.0 to 100.0%)
* C09
Preset LSP2
(0.0 to 100.0%)
* C10
Input range type 1
* C11
Input 1 temperature units
* C12
Input 1 cold junction compensation □ 0:Internal compensation, □ 1:External compensation
* C13
Input 1 line break operation □ 0:up scale, □ 1:down scale
* C14
Input 2 range type
□ 0:4 to 20mA, □ 1:1 to 5V
* C15
LSP1 setting method
□ 0:with direct change, □ 1:no direct change, □ 2:LSP1 changes inhibited
* C16
LSP2 setting method
□ 0:with direct change, □ 1:no direct change, □ 2:LSP2 changes inhibited
* C17
PV/AI indication selection
□ 0:PV1 (PID1), □ 1:PV2 (PID2), □ 2:AIR1, □ 3:AIR2, □ 4:AIR3
* C18
□ 0:AT is not performed
□ 1:General AT (PID1), □ 2:Overshoot protected AT (PID1),
Auto tuning method selection
□ 3:Neural network AT (PID1)
□ 4:General AT (PID2), □ 5:Overshoot protected AT (PID2),
□ 6:Neural network AT (PID2)
* C19
Motor control method selection
* C20
Automatic adjustment of motor opening □ 0:no adjustment, □ 1:adjustment
* C21
Motor opening control (fully closed)
(0 to )
* C22
Motor opening control (fully open)
( to 10000)
* C23
Motor fully open/fully closed time (sec.)
(5.0 to 240.0 sec.)
* C24
Positional proportional control dead zone
(0.5 to 25.0%)
* C25
CPL transmission address
* C26
CPL transmission rate, code
* C27
CPL transmission write enable/prevent □ 0:write enable, □ 1:write disable
(−10.0 to +110.0%)
□ 0:°C, □ 1:°F
□ 0:MFB (conventional) + estimated position control performed,
□ 1:MFB (conventional), □ 2:estimated position control performed
(0 to 127)
□ 0:9600 bps, even parity, 1 stop bit, □ 1:9600 bps, no parity, 2 stop bits,
□ 2:4800 bps, even parity, 1 stop bit, □ 3:4800 bps, even parity, 2stop bits
Page 2/9
■ Input processing data
SDC40B
code
Item
Description
* In 02
Engineering unit display
Decimal point position
0 to 4
* In 03
Engineering unit display
Lower limit
0%
Engineering unit display
Upper limit
100%
−19999 to +26000 U
* In 05 Linearization table No.
0:not used
1:TBL1, 2:TBL2, 3:TBL3
* In 12
0:not performed
1:performed
* In 13
Drop-out value for
square-root extraction
0.0 to 100.0%
* In 07
* In 08
* In 09
* In 10
* In 11
Input3 Virtual4 Virtual5 Virtual6
[3]
[4]
[5]
[6]
−19999 to +26000 U
Temperature compensation
input No.
Temperature units for
temperature compensation
Design temperature for
temperature compensation
Pressure compensation
input No.
Pressure units for pressure
compensation
Design pressure for
pressure compensation
Square-root extraction
computation
* In 06
Input2
[2]
0:not used
1:used
* In 01 Input use
* In 04
Input1
[1]
0:no temperature compensation
1:input 1, 2:input 2, 3:input 3
0:°C
1:°F
−19999 to +26000 U
0:no pressure compensation
1:input 1, 2:input 2, 3:input 3
0:MPa, 1:kPa, 2:Pa
3:kqf/cm2, 4:mmH2O
−19999 to +26000 U
* In 14 Digital filter
0.0 to 120.0 sec.
* In 15 Input error diagnosis
0:not performed
1:performed
■ Control computational data
SDC40B
code
Item
Description
* PID.tp PID computation type
0:Normal PID
1:Derivative-based PID
* PID.no PID group setting
0 to 7
* ACT
Control operation
0:reverse operation
1:normal operation
* PV-In
Engineering unit number
specification
1 to 6
* PV-tr
PV tracking
0:none, 1:yes
* rR
Ratio
−999.9 to +999.9%
* BIAS
Bias
−999.9 to +999.9%
* DEV.AL Deviation alarm
0.0 to 100.0%
* PVL.AL PV lower alarm
−10.0 to +110.0%
* PVH.AL PV upper alarm
−10.0 to +110.0%
* AL.HYS Alarm hysteresis
0.0 to 100.0%
* IOUT
Initial PID computation cycle
procedure
* rPID
0:automatic initialization
PID initialization method 1:initialization when LSP1 is changed
2:no initialization
* St
0:no smart tuning
Smart tuning method selection 1:uses fixed break value
2:updates break value
* 2PID
PID with two degrees of freedom
0.0 to 100.0%
0:2 degrees of freedom not used
1:2 degrees of freedom used
PID1 computational unit PID2 computational unit
[1]
[2]
Page 3/9
■ PID parameters
SDC40B
code
Item
Group Group Group Group Group Group Group Group
No. 0 No. 1 No. 2 No. 3 No. 4 No. 5 No. 6 No. 7
Description
*P
Proportional band
0.1 to 999.9%
*I
Integral time
0.0 to 6000.0 sec.
*D
Derivative time
0.0 to 6000.0 sec.
* rL
Lower integral limit
−200.0 to upper limit%
* rH
Upper integral limit
Lower limit to +200.0%
* GAP Dead band
0.0 to 100.0%
* OTL Output deviation rate limit
0.0 to 100.0%
/computation cycle
* rE
Manual reset
0.0 to 100.0%
* br
Break
0 to 30
* dP
Disturbance suppressing
proportional band
Disturbance suppressing
integral time
Disturbance suppressing
derivative time
0.1 to 999.9%
* dI
* dD
0.0 to 6000.0 sec.
0.0 to 6000.0 sec.
■ Linearization table data (% → %)
Specification range: X axis Y axis: −999.9 to +999.9%
(TBL1)
(TBL2)
(TBL3)
SDC40B X axis SDC40B Y axis
code
(%)
code
(%)
SDC40B X axis SDC40B Y axis
code
(%)
code
(%)
SDC40B X axis SDC40B Y axis
code
(%)
code
(%)
* tL.A01
tL.B01
tL.A01
tL.B01
tL.A01
tL.B01
* tL.A02
tL.B02
tL.A02
tL.B02
tL.A02
tL.B02
* tL.A03
tL.B03
tL.A03
tL.B03
tL.A03
tL.B03
* tL.A04
tL.B04
tL.A04
tL.B04
tL.A04
tL.B04
* tL.A05
tL.B05
tL.A05
tL.B05
tL.A05
tL.B05
* tL.A06
tL.B06
tL.A06
tL.B06
tL.A06
tL.B06
* tL.A07
tL.B07
tL.A07
tL.B07
tL.A07
tL.B07
* tL.A08
tL.B08
tL.A08
tL.B08
tL.A08
tL.B08
* tL.A09
tL.B09
tL.A09
tL.B09
tL.A09
tL.B09
* tL.A10
tL.B10
tL.A10
tL.B10
tL.A10
tL.B10
* tL.A11
tL.B11
tL.A11
tL.B11
tL.A11
tL.B11
* tL.A12
tL.B12
tL.A12
tL.B12
tL.A12
tL.B12
* tL.A13
tL.B13
tL.A13
tL.B13
tL.A13
tL.B13
* tL.A14
tL.B14
tL.A14
tL.B14
tL.A14
tL.B14
* tL.A15
tL.B15
tL.A15
tL.B15
tL.A15
tL.B15
* tL.A16
tL.B16
tL.A16
tL.B16
tL.A16
tL.B16
Table connection No.
CAIN.I
Table connection No.
(The instrument cannot specify table connection no.)
CAIN.I
Table connection No.
CAIN.I
■ PTB table data (% → %)
(PTB1)
Specification range: X axis Y axis: −999.9 to +999.9%
(PTB2)
(PTB3)
Page 4/9
(PTB4)
SDC40B X axis SDC40B Y axis SDC40B X axis SDC40B Y axis SDC40B X axis SDC40B Y axis SDC40B X axis SDC40B Y axis
code (%) code (%) code (%) code (%) code (%) code (%) code (%) code (%)
* pt.A01
pt.B01
pt.A01
pt.B01
pt.A01
pt.B01
pt.A01
pt.B01
* pt.A02
pt.B02
pt.A02
pt.B02
pt.A02
pt.B02
pt.A02
pt.B02
* pt.A03
pt.B03
pt.A03
pt.B03
pt.A03
pt.B03
pt.A03
pt.B03
* pt.A04
pt.B04
pt.A04
pt.B04
pt.A04
pt.B04
pt.A04
pt.B04
* pt.A05
pt.B05
pt.A05
pt.B05
pt.A05
pt.B05
pt.A05
pt.B05
* pt.A06
pt.B06
pt.A06
pt.B06
pt.A06
pt.B06
pt.A06
pt.B06
* pt.A07
pt.B07
pt.A07
pt.B07
pt.A07
pt.B07
pt.A07
pt.B07
* pt.A08
pt.B08
pt.A08
pt.B08
pt.A08
pt.B08
pt.A08
pt.B08
* pt.A09
pt.B09
pt.A09
pt.B09
pt.A09
pt.B09
pt.A09
pt.B09
* pt.A10
pt.B10
pt.A10
pt.B10
pt.A10
pt.B10
pt.A10
pt.B10
* pt.A11
pt.B11
pt.A11
pt.B11
pt.A11
pt.B11
pt.A11
pt.B11
* pt.A12
pt.B12
pt.A12
pt.B12
pt.A12
pt.B12
pt.A12
pt.B12
* pt.A13
pt.B13
pt.A13
pt.B13
pt.A13
pt.B13
pt.A13
pt.B13
* pt.A14
pt.B14
pt.A14
pt.B14
pt.A14
pt.B14
pt.A14
pt.B14
* pt.A15
pt.B15
pt.A15
pt.B15
pt.A15
pt.B15
pt.A15
pt.B15
* pt.A16
pt.B16
pt.A16
pt.B16
pt.A16
pt.B16
pt.A16
pt.B16
■ TTB table data (% → time)
(TTB1)
Specification range: X axis: −999.9 to +999.9%
Y axis: 0.0 to 6000.0 sec.
(TTB2)
(TTB3)
(TTB4)
SDC40B X axis SDC40B Y axis SDC40B X axis SDC40B Y axis SDC40B X axis SDC40B Y axis SDC40B X axis SDC40B Y axis
code (%) code (sec.) code (%) code (sec.) code (%) code (sec.) code (%) code (sec.)
* tt.A01
tt.B01
tt.A01
tt.B01
tt.A01
tt.B01
tt.A01
tt.B01
* tt.A02
tt.B02
tt.A02
tt.B02
tt.A02
tt.B02
tt.A02
tt.B02
* tt.A03
tt.B03
tt.A03
tt.B03
tt.A03
tt.B03
tt.A03
tt.B03
* tt.A04
tt.B04
tt.A04
tt.B04
tt.A04
tt.B04
tt.A04
tt.B04
* tt.A05
tt.B05
tt.A05
tt.B05
tt.A05
tt.B05
tt.A05
tt.B05
* tt.A06
tt.B06
tt.A06
tt.B06
tt.A06
tt.B06
tt.A06
tt.B06
* tt.A07
tt.B07
tt.A07
tt.B07
tt.A07
tt.B07
tt.A07
tt.B07
* tt.A08
tt.B08
tt.A08
tt.B08
tt.A08
tt.B08
tt.A08
tt.B08
* tt.A09
tt.B09
tt.A09
tt.B09
tt.A09
tt.B09
tt.A09
tt.B09
* tt.A10
tt.B10
tt.A10
tt.B10
tt.A10
tt.B10
tt.A10
tt.B10
* tt.A11
tt.B11
tt.A11
tt.B11
tt.A11
tt.B11
tt.A11
tt.B11
* tt.A12
tt.B12
tt.A12
tt.B12
tt.A12
tt.B12
tt.A12
tt.B12
* tt.A13
tt.B13
tt.A13
tt.B13
tt.A13
tt.B13
tt.A13
tt.B13
* tt.A14
tt.B14
tt.A14
tt.B14
tt.A14
tt.B14
tt.A14
tt.B14
* tt.A15
tt.B15
tt.A15
tt.B15
tt.A15
tt.B15
tt.A15
tt.B15
* tt.A16
tt.B16
tt.A16
tt.B16
tt.A16
tt.B16
tt.A16
tt.B16
■ Variable parameters (% format)
SDC40B
code
Name
Specification range: −999.9 to +999.9%
Setting
(%)
SDC40B
code
* PPA01
PPA21
* PPA02
PPA22
* PPA03
PPA23
* PPA04
PPA24
* PPA05
PPA25
* PPA06
PPA26
* PPA07
PPA27
* PPA08
PPA28
* PPA09
PPA29
* PPA10
PPA30
* PPA11
PPA31
* PPA12
PPA32
* PPA13
PPA33
* PPA14
PPA34
* PPA15
PPA35
* PPA16
PPA36
* PPA17
PPA37
* PPA18
PPA38
* PPA19
PPA39
* PPA20
PPA40
■ Variable parameters (time format)
SDC40B
code
Name
Name
Page 5/9
Setting
(%)
Specification range: 0.0 to 6000.0 sec.
Setting
(sec.)
* TPA01
* TPA02
* TPA03
* TPA04
* TPA05
* TPA06
* TPA07
* TPA08
* TPA09
* TPA10
■ Variable parameter (flag format)
SDC40B
code
Name
Setting
(0 or 1)
Specification range: 0 (OFF), 1 (ON)
SDC40B
code
* FPA01
FPA11
* FPA02
FPA12
* FPA03
FPA13
* FPA04
FPA14
* FPA05
FPA15
* FPA06
FPA16
* FPA07
FPA17
* FPA08
FPA18
* FPA09
FPA19
* FPA10
FPA20
Name
Setting
(0 or 1)
■ Variable parameters (index format)
SDC40B
code
Name
Specification range: 0 to 30000
Page 6/9
Setting
* IPA01
* IPA02
* IPA03
* IPA04
* IPA05
* IPA06
* IPA07
* IPA08
* IPA09
* IPA10
■ Engineering unit parameters Specification range: Lower engineering unit limit to upper engineering unit limit
SDC40B
code
Name
(PID1 related)
Setting
(U)
SDC40B
code
* EP1-0
EP2-0
* EP1-1
EP2-1
* EP1-2
EP2-2
* EP1-3
EP2-3
* EP1-4
EP2-4
* EP1-5
EP2-5
* EP1-6
EP2-6
* EP1-7
EP2-7
Name
(PID2 related)
Setting
(U)
Name
(UF2 key related)
Setting
■ UF key processing data
SDC40B
code
Name
(UF1 key related)
Setting
SDC40B
code
* UF.SET Basic UF1 key registration
UF.SET Basic UF2 key registration
* UF-01
UF-01
* UF-02
UF-02
* UF-03
UF-03
* UF-04
UF-04
* UF-05
UF-05
* UF-06
UF-06
* UF-07
UF-07
* UF-08
UF-08
■ Digital input processing data Specification range: 0 to 12
SDC40B
code
Digital input processing
starting point
SDC40B
code
DI.TOP(1)
DI.NBR(1)
DI.TOP(2)
DI.NBR(2)
DI.TOP(3)
DI.NBR(3)
DI.TOP(4)
DI.NBR(4)
DI.TOP(5)
DI.NBR(5)
DI.TOP(6)
DI.NBR(6)
Number of digital input
processing units
Page 7/9
■ ID data settings (for reference only)
SDC40B
code
Item
ID-01
Hardware type 1
ID-02
Hardware type 2
ID-03
ROM ID
ID-04
ROM ITEM
ID-05
ROM revision
Initial value
■ Protect settings
SDC40B
code
SEL
Item
Description
Setting transition
selection
□0 □1 □2 □3 □4 □5
Protection
○
○
○
○
○
○
Control computational data
×
○
×
×
×
○
PID parameter
×
○
×
×
×
○
Variable parameter
×
○
×
×
×
○
Engineering unit parameter
×
○
×
×
×
○
Linearization table data
×
×
○
×
×
○
PTB table data
×
×
○
×
×
○
TTB table data
×
×
○
×
×
○
Setup
×
×
×
○
×
○
Input processing data
×
×
×
○
×
○
UF key processing data
×
×
×
○
×
○
Digital input processing data
×
×
×
○
×
○
ID data
×
×
×
○
×
○
Computational unit monitor
×
×
×
×
○
○
Input signal monitor
×
×
×
×
○
○
○: transition possible, ×: transition not possible
LOC
Key lock
1st digit: PARA key
2nd digit: CAS key
3rd digit: AUTO key
4th digit: MAN key
5th digit: AT key
Example: ××××× (0: no key lock, 1: key lock)
0 0 0 0 1
(Only PARA key lock)
■ Trend processing data
Item
Description
Data trend 1 assignment
Data trend 2 assignment
Data trend 3 assignment
Data trend cycle
1 to 30000 sec.
Setting
Page 8/9
■ Computational unit data
No.
Computational expression
Name
1
2
3
4
5
6
7
8
9
10
11
12
13
14
15
16
17
18
19
20
21
22
23
24
25
26
27
28
29
30
31
32
33
34
35
36
37
38
39
40
41
42
43
44
45
46
47
48
49
50
Computation
sequence
H1 input signal
Signal
Code
H2 input signal
Signal
Code
P1 input signal
Signal
Code
P2 input signal
Signal
Code
SDC40B Design Sheet Page 9/9
AIR1
AIR2
AIR3
Input name
Input range type
Lower engineering unit limit
Upper engineering unit limit
Linearization table No.
Temperature compensation
Pressure compensation
Square-root extraction
Digital filter
Management No. Computation cycle Control type IM mode transitions
Startup
Preset mode
DI01
DI02
DI03
DI04
DI05
DI06
DI07
DI08
DI09
DI10
DI11
DI12
DIX1
DIX2
DIX3
DIX4
DIX5
DIX6
DO1
DO2
DO3
DO4
DO5
DO6
Customer name
Control device
Tag No.
AI1
AI2
AI3
PARA Name Setting
AO2
AO3
DO7
DO8
Page 9/9
AO1
Revision History
Printed
Date
Manual Number
Edition
Revised pages
95-05
01-02
CP-UM-1680E 1st Edition
2nd Edition 1-5
1-19
1-22
1-24
1-28
1-33
1-36
1-43
1-49
1-53
1-55
1-61
2-17
2-18
02-07
3rd Edition
1-18, 1-55
2-17
Description
DVD corrected to DIV
*Note added
*Note 2 added
*Note 2 added
Graph curve corrected
Table added
Explanation added
Explanation and timing chart added
Conditions added
AT2 expression added. P1: ON corrected to OFF
Computational expression revised
No.68 and 69 corrected to No.69 and 70
Initial value corrected from 1 to 0
ADD unit P2: 1.0 changed to 100.0. Description
deleted. CPX unit OUT line: (0.1m2/pulse) added
ADD unit P2: 1/10 changed to 10/100
SW unit DI01CG: (0.1m3/pulse) added
Computational expression added
(0.1m2/pulse) corrected to (0.1m3/pulse)
Specifications are subject to change without notice.
Control Product Division
Sales contact: Yamatake Corporation,
IBD Sensing and Control Department
Totate International Building
2-12-19 Shibuya Shibuya-ku Tokyo 150-8316 Japan
Phone: 81-3-3486-2380
Fax:
81-3-3486-2300
This has been printed on recycled paper.
Printed in Japan.
1st Edition: Issued in May, 1995
2nd Edition: Issued in Feb., 2001(M)