1
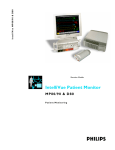
Philips CMS Patient Monitoring System
& V24 and V26 Patient Monitors
Concepts Guide
PHI
Part No. M1046-9421L
Printed March 2003
Notice
This document contains proprietary information which is protected by copyright. All
Rights Reserved. Reproduction, adaptation, or translation without prior written
permission is prohibited, except as allowed under the copyright laws.
Philips Medical Systems
Cardiac and Monitoring Systems
3000 Minuteman Road
Andover, MA 01810
+1 (800) 934-7372
Publication number
M1046-9421L
Printed September 2002
Warranty
The information contained in this document is subject to change without notice.
Philips Medical Systems makes no warranty of any kind with regard to this material,
including, but not limited to, the implied warranties or merchantability and fitness for
a particular purpose.
Philips Medical Systems shall not be liable for errors contained herein or for
incidental or consequential damages in connection with the furnishing, performance,
or use of this material.
© 2002 Philips Medizin Systeme Böblingen GmbH
All rights are reserved.
Reproduction in whole or in part is prohibited without the prior written consent of the
copyright holder.
Printing History
New editions of this document will incorporate all material updated since the
previous edition. Update packages may be issued between editions and contain
replacement and additional pages to be merged by a revision date at the bottom of the
page. Note that pages which are rearranged due to changes on a previous page are not
considered revised.
The documentation printing date and part number indicate its current edition. The
printing date and part number change when a new edition is printed. This guide
combines the former CMS Patient Monitoring System Concepts Guide with the
former Viridia 26/24 Series Concepts Training and Reference Guide to one manual;
therefore, this guide is in its first edition. The printing histories of both Concepts
Guides are listed below.
Printing histories of former Concepts Guide Versions
Edition
CMS
V24 and V26
Patient Monitors
First
January 1996
November 1996
Second
May 1997
December 1996
Third
January 1998
February 1998
Fourth
---
April 1999
First Edition ......................................June 2000
Contents
Introduction . . . . . . . . . . . . . . . . . . . . . . . . . . . . . . . . . . . . . . . . . . . . . . . . . . . . . . . . 1
The Purpose of This Book . . . . . . . . . . . . . . . . . . . . . . . . . . . . . . . . . . . . . . . . . . . . . . . . . . . . . . .1
Who Should Use This Book . . . . . . . . . . . . . . . . . . . . . . . . . . . . . . . . . . . . . . . . . . . . . . . . . . . . . .1
What The Book Contains . . . . . . . . . . . . . . . . . . . . . . . . . . . . . . . . . . . . . . . . . . . . . . . . . . . . . . . .2
Intro . . . . . . . . . . . . . . . . . . . . . . . . . . . . . . . . . . . . . . . . . . . . . . . . . . . . . . . . . . . . . . . . . . . . . .2
How the Book is Structured . . . . . . . . . . . . . . . . . . . . . . . . . . . . . . . . . . . . . . . . . . . . . . . . . .2
How the Content Is Organized . . . . . . . . . . . . . . . . . . . . . . . . . . . . . . . . . . . . . . . . . . . . . . . .2
How to Use This Book . . . . . . . . . . . . . . . . . . . . . . . . . . . . . . . . . . . . . . . . . . . . . . . . . . . . . . . . . .3
Learning and Reference . . . . . . . . . . . . . . . . . . . . . . . . . . . . . . . . . . . . . . . . . . . . . . . . . . . . .3
Choose Your Approach . . . . . . . . . . . . . . . . . . . . . . . . . . . . . . . . . . . . . . . . . . . . . . . . . . . . . .3
Basic Plug-In Modules . . . . . . . . . . . . . . . . . . . . . . . . . . . . . . . . . . . . . . . . . . . . . . . 1
Introduction. . . . . . . . . . . . . . . . . . . . . . . . . . . . . . . . . . . . . . . . . . . . . . . . . . . . . . . . . . . . . . . . . . .1
Goals . . . . . . . . . . . . . . . . . . . . . . . . . . . . . . . . . . . . . . . . . . . . . . . . . . . . . . . . . . . . . . . . . . . . .1
Objectives . . . . . . . . . . . . . . . . . . . . . . . . . . . . . . . . . . . . . . . . . . . . . . . . . . . . . . . . . . . . . . . . .1
Topics . . . . . . . . . . . . . . . . . . . . . . . . . . . . . . . . . . . . . . . . . . . . . . . . . . . . . . . . . . . . . . . . . . . .2
Electrocardiogram/Respirogram (ECG/RESP) Module Concepts . . . . . . . . . . . . . .3
ECG Measurement . . . . . . . . . . . . . . . . . . . . . . . . . . . . . . . . . . . . . . . . . . . . . . . . . . . . . . . . . . . . .3
Description . . . . . . . . . . . . . . . . . . . . . . . . . . . . . . . . . . . . . . . . . . . . . . . . . . . . . . . . . . . . . . . .3
Concepts . . . . . . . . . . . . . . . . . . . . . . . . . . . . . . . . . . . . . . . . . . . . . . . . . . . . . . . . . . . . . . . . . .3
Measurement Principle . . . . . . . . . . . . . . . . . . . . . . . . . . . . . . . . . . . . . . . . . . . . . . . . . . . . . .3
Measurement Acquisition . . . . . . . . . . . . . . . . . . . . . . . . . . . . . . . . . . . . . . . . . . . . . . . . . . . .3
Output . . . . . . . . . . . . . . . . . . . . . . . . . . . . . . . . . . . . . . . . . . . . . . . . . . . . . . . . . . . . . . . . . . . .9
Criteria for Proper Measurement . . . . . . . . . . . . . . . . . . . . . . . . . . . . . . . . . . . . . . . . . . . .11
Plug-In Modules . . . . . . . . . . . . . . . . . . . . . . . . . . . . . . . . . . . . . . . . . . . . . . . . . . . . . . . . . . .11
ECG Measurements Exercises. . . . . . . . . . . . . . . . . . . . . . . . . . . . . . . . . . . . . . . . . . . . . . .12
ECG Module . . . . . . . . . . . . . . . . . . . . . . . . . . . . . . . . . . . . . . . . . . . . . . . . . . . . . . . . . . . . . . . . .13
Description . . . . . . . . . . . . . . . . . . . . . . . . . . . . . . . . . . . . . . . . . . . . . . . . . . . . . . . . . . . . . . .13
Measurements . . . . . . . . . . . . . . . . . . . . . . . . . . . . . . . . . . . . . . . . . . . . . . . . . . . . . . . . . . . .13
Components . . . . . . . . . . . . . . . . . . . . . . . . . . . . . . . . . . . . . . . . . . . . . . . . . . . . . . . . . . . . . .13
Block Diagram . . . . . . . . . . . . . . . . . . . . . . . . . . . . . . . . . . . . . . . . . . . . . . . . . . . . . . . . . . . .13
Theory of Operation (M1001A/M1002A). . . . . . . . . . . . . . . . . . . . . . . . . . . . . . . . . . . . . . .15
ECG Module Features. . . . . . . . . . . . . . . . . . . . . . . . . . . . . . . . . . . . . . . . . . . . . . . . . . . . . .16
ECG Module Exercises . . . . . . . . . . . . . . . . . . . . . . . . . . . . . . . . . . . . . . . . . . . . . . . . . . . . .18
RESP Measurement . . . . . . . . . . . . . . . . . . . . . . . . . . . . . . . . . . . . . . . . . . . . . . . . . . . . . . . . . . .19
Contents-1
Description . . . . . . . . . . . . . . . . . . . . . . . . . . . . . . . . . . . . . . . . . . . . . . . . . . . . . . . . . . . . . . .19
Concepts . . . . . . . . . . . . . . . . . . . . . . . . . . . . . . . . . . . . . . . . . . . . . . . . . . . . . . . . . . . . . . . . .19
Measurement Principle . . . . . . . . . . . . . . . . . . . . . . . . . . . . . . . . . . . . . . . . . . . . . . . . . . . . .19
Measurement Acquisition . . . . . . . . . . . . . . . . . . . . . . . . . . . . . . . . . . . . . . . . . . . . . . . . . . .20
Output . . . . . . . . . . . . . . . . . . . . . . . . . . . . . . . . . . . . . . . . . . . . . . . . . . . . . . . . . . . . . . . . . . .21
Criteria for Proper Measurement . . . . . . . . . . . . . . . . . . . . . . . . . . . . . . . . . . . . . . . . . . . .21
Plug-In Modules . . . . . . . . . . . . . . . . . . . . . . . . . . . . . . . . . . . . . . . . . . . . . . . . . . . . . . . . . . .21
References . . . . . . . . . . . . . . . . . . . . . . . . . . . . . . . . . . . . . . . . . . . . . . . . . . . . . . . . . . . . . . .21
RESP Measurement Exercises. . . . . . . . . . . . . . . . . . . . . . . . . . . . . . . . . . . . . . . . . . . . . . .22
ECG/RESP Module . . . . . . . . . . . . . . . . . . . . . . . . . . . . . . . . . . . . . . . . . . . . . . . . . . . . . . . . . . . .23
Description . . . . . . . . . . . . . . . . . . . . . . . . . . . . . . . . . . . . . . . . . . . . . . . . . . . . . . . . . . . . . . .23
Measurements . . . . . . . . . . . . . . . . . . . . . . . . . . . . . . . . . . . . . . . . . . . . . . . . . . . . . . . . . . . .23
Components . . . . . . . . . . . . . . . . . . . . . . . . . . . . . . . . . . . . . . . . . . . . . . . . . . . . . . . . . . . . . .23
Block Diagram . . . . . . . . . . . . . . . . . . . . . . . . . . . . . . . . . . . . . . . . . . . . . . . . . . . . . . . . . . . .24
Theory of Operation . . . . . . . . . . . . . . . . . . . . . . . . . . . . . . . . . . . . . . . . . . . . . . . . . . . . . . .25
ECG/RESP Module Features . . . . . . . . . . . . . . . . . . . . . . . . . . . . . . . . . . . . . . . . . . . . . . . .26
ECG/RESP Module Exercises . . . . . . . . . . . . . . . . . . . . . . . . . . . . . . . . . . . . . . . . . . . . . . .28
Non-invasive Blood Pressure (NBP) Module Concepts . . . . . . . . . . . . . . . . . . . . 30
NBP Measurement . . . . . . . . . . . . . . . . . . . . . . . . . . . . . . . . . . . . . . . . . . . . . . . . . . . . . . . . . . . .30
Description . . . . . . . . . . . . . . . . . . . . . . . . . . . . . . . . . . . . . . . . . . . . . . . . . . . . . . . . . . . . . . .30
Concepts . . . . . . . . . . . . . . . . . . . . . . . . . . . . . . . . . . . . . . . . . . . . . . . . . . . . . . . . . . . . . . . . .30
Measurement Principle . . . . . . . . . . . . . . . . . . . . . . . . . . . . . . . . . . . . . . . . . . . . . . . . . . . . .30
Measurement Acquisition . . . . . . . . . . . . . . . . . . . . . . . . . . . . . . . . . . . . . . . . . . . . . . . . . . .31
Output . . . . . . . . . . . . . . . . . . . . . . . . . . . . . . . . . . . . . . . . . . . . . . . . . . . . . . . . . . . . . . . . . . .31
Criteria for Proper Measurement . . . . . . . . . . . . . . . . . . . . . . . . . . . . . . . . . . . . . . . . . . . .31
Plug-In Modules . . . . . . . . . . . . . . . . . . . . . . . . . . . . . . . . . . . . . . . . . . . . . . . . . . . . . . . . . . .31
NBP Measurements Exercises . . . . . . . . . . . . . . . . . . . . . . . . . . . . . . . . . . . . . . . . . . . . . . .32
NBP Modules . . . . . . . . . . . . . . . . . . . . . . . . . . . . . . . . . . . . . . . . . . . . . . . . . . . . . . . . . . . . . . . . .34
Description . . . . . . . . . . . . . . . . . . . . . . . . . . . . . . . . . . . . . . . . . . . . . . . . . . . . . . . . . . . . . . .34
Measurements . . . . . . . . . . . . . . . . . . . . . . . . . . . . . . . . . . . . . . . . . . . . . . . . . . . . . . . . . . . .34
Components . . . . . . . . . . . . . . . . . . . . . . . . . . . . . . . . . . . . . . . . . . . . . . . . . . . . . . . . . . . . . .34
Block Diagram . . . . . . . . . . . . . . . . . . . . . . . . . . . . . . . . . . . . . . . . . . . . . . . . . . . . . . . . . . . .34
Theory of Operation . . . . . . . . . . . . . . . . . . . . . . . . . . . . . . . . . . . . . . . . . . . . . . . . . . . . . . .36
NBP Module Features . . . . . . . . . . . . . . . . . . . . . . . . . . . . . . . . . . . . . . . . . . . . . . . . . . . . . .36
NBP Module Exercises . . . . . . . . . . . . . . . . . . . . . . . . . . . . . . . . . . . . . . . . . . . . . . . . . . . . .39
Cardiac Output (C.O.) Module Concepts . . . . . . . . . . . . . . . . . . . . . . . . . . . . . . . . 40
C.O. Measurement. . . . . . . . . . . . . . . . . . . . . . . . . . . . . . . . . . . . . . . . . . . . . . . . . . . . . . . . . . . . .40
Description . . . . . . . . . . . . . . . . . . . . . . . . . . . . . . . . . . . . . . . . . . . . . . . . . . . . . . . . . . . . . . .40
Concepts . . . . . . . . . . . . . . . . . . . . . . . . . . . . . . . . . . . . . . . . . . . . . . . . . . . . . . . . . . . . . . . . .40
Contents-2
Measurement Principle . . . . . . . . . . . . . . . . . . . . . . . . . . . . . . . . . . . . . . . . . . . . . . . . . . . .
Measurement Acquisition . . . . . . . . . . . . . . . . . . . . . . . . . . . . . . . . . . . . . . . . . . . . . . . . . .
Output . . . . . . . . . . . . . . . . . . . . . . . . . . . . . . . . . . . . . . . . . . . . . . . . . . . . . . . . . . . . . . . . . .
Criteria for Proper Measurement . . . . . . . . . . . . . . . . . . . . . . . . . . . . . . . . . . . . . . . . . . . .
Plug-In Modules . . . . . . . . . . . . . . . . . . . . . . . . . . . . . . . . . . . . . . . . . . . . . . . . . . . . . . . . . .
C.O. Measurement Exercises . . . . . . . . . . . . . . . . . . . . . . . . . . . . . . . . . . . . . . . . . . . . . . .
C.O. Module . . . . . . . . . . . . . . . . . . . . . . . . . . . . . . . . . . . . . . . . . . . . . . . . . . . . . . . . . . . . . . . . .
Description . . . . . . . . . . . . . . . . . . . . . . . . . . . . . . . . . . . . . . . . . . . . . . . . . . . . . . . . . . . . . .
Measurements . . . . . . . . . . . . . . . . . . . . . . . . . . . . . . . . . . . . . . . . . . . . . . . . . . . . . . . . . . . .
Components . . . . . . . . . . . . . . . . . . . . . . . . . . . . . . . . . . . . . . . . . . . . . . . . . . . . . . . . . . . . .
Block Diagram . . . . . . . . . . . . . . . . . . . . . . . . . . . . . . . . . . . . . . . . . . . . . . . . . . . . . . . . . . .
Theory of Operation . . . . . . . . . . . . . . . . . . . . . . . . . . . . . . . . . . . . . . . . . . . . . . . . . . . . . . .
C.O. Module Features . . . . . . . . . . . . . . . . . . . . . . . . . . . . . . . . . . . . . . . . . . . . . . . . . . . . .
C.O. Module Exercises. . . . . . . . . . . . . . . . . . . . . . . . . . . . . . . . . . . . . . . . . . . . . . . . . . . . .
40
40
42
42
42
43
44
44
44
44
44
46
47
48
Cardiac Output #C10 (CCO) Module Concepts (CMS only) . . . . . . . . . . . . . . . . 49
C.O. #C10 (CCO) Measurement (CMS only) . . . . . . . . . . . . . . . . . . . . . . . . . . . . . . . . . . . . . . 49
Description . . . . . . . . . . . . . . . . . . . . . . . . . . . . . . . . . . . . . . . . . . . . . . . . . . . . . . . . . . . . . . 49
Concepts . . . . . . . . . . . . . . . . . . . . . . . . . . . . . . . . . . . . . . . . . . . . . . . . . . . . . . . . . . . . . . . . 49
Measurement Principle . . . . . . . . . . . . . . . . . . . . . . . . . . . . . . . . . . . . . . . . . . . . . . . . . . . . 49
Measurement Acquisition . . . . . . . . . . . . . . . . . . . . . . . . . . . . . . . . . . . . . . . . . . . . . . . . . . 49
. . . . . . . . . . . . . . . . . . . . . . . . . . . . . . . . . . . . . . . . . . . . . . . . . . . . . . . . . . . . . . . . . . . . . . . . 50
Injectate Temperature and Volume . . . . . . . . . . . . . . . . . . . . . . . . . . . . . . . . . . . . . . . . . . 51
C.O. #C10 (CCO) Module (CMS only) . . . . . . . . . . . . . . . . . . . . . . . . . . . . . . . . . . . . . . . . . . . . 52
Description . . . . . . . . . . . . . . . . . . . . . . . . . . . . . . . . . . . . . . . . . . . . . . . . . . . . . . . . . . . . . . 52
Measurements . . . . . . . . . . . . . . . . . . . . . . . . . . . . . . . . . . . . . . . . . . . . . . . . . . . . . . . . . . . . 52
Components . . . . . . . . . . . . . . . . . . . . . . . . . . . . . . . . . . . . . . . . . . . . . . . . . . . . . . . . . . . . . 52
Block Diagram . . . . . . . . . . . . . . . . . . . . . . . . . . . . . . . . . . . . . . . . . . . . . . . . . . . . . . . . . . . 52
Theory of Operation . . . . . . . . . . . . . . . . . . . . . . . . . . . . . . . . . . . . . . . . . . . . . . . . . . . . . . . 54
C.O. #C10 (CCO) Module Features . . . . . . . . . . . . . . . . . . . . . . . . . . . . . . . . . . . . . . . . . . 55
Arterial Oxygen Saturation/Plethysmography (SpO2/Pleth) Module Concepts . 56
SpO2 Measurement . . . . . . . . . . . . . . . . . . . . . . . . . . . . . . . . . . . . . . . . . . . . . . . . . . . . . . . . . . . 56
Description . . . . . . . . . . . . . . . . . . . . . . . . . . . . . . . . . . . . . . . . . . . . . . . . . . . . . . . . . . . . . . 56
Concepts . . . . . . . . . . . . . . . . . . . . . . . . . . . . . . . . . . . . . . . . . . . . . . . . . . . . . . . . . . . . . . . . 56
Measurement Principle . . . . . . . . . . . . . . . . . . . . . . . . . . . . . . . . . . . . . . . . . . . . . . . . . . . . 57
Measurement Acquisition . . . . . . . . . . . . . . . . . . . . . . . . . . . . . . . . . . . . . . . . . . . . . . . . . . 57
Output . . . . . . . . . . . . . . . . . . . . . . . . . . . . . . . . . . . . . . . . . . . . . . . . . . . . . . . . . . . . . . . . . . 57
Criteria for Proper Measurement . . . . . . . . . . . . . . . . . . . . . . . . . . . . . . . . . . . . . . . . . . . . 57
Plug-In Modules . . . . . . . . . . . . . . . . . . . . . . . . . . . . . . . . . . . . . . . . . . . . . . . . . . . . . . . . . . 58
SpO2 Measurement Exercises . . . . . . . . . . . . . . . . . . . . . . . . . . . . . . . . . . . . . . . . . . . . . . 59
Contents-3
SpO2/PLETH Module . . . . . . . . . . . . . . . . . . . . . . . . . . . . . . . . . . . . . . . . . . . . . . . . . . . . . . . . . .60
Description . . . . . . . . . . . . . . . . . . . . . . . . . . . . . . . . . . . . . . . . . . . . . . . . . . . . . . . . . . . . . . .60
Measurements . . . . . . . . . . . . . . . . . . . . . . . . . . . . . . . . . . . . . . . . . . . . . . . . . . . . . . . . . . . .60
Components . . . . . . . . . . . . . . . . . . . . . . . . . . . . . . . . . . . . . . . . . . . . . . . . . . . . . . . . . . . . . .60
Block Diagram . . . . . . . . . . . . . . . . . . . . . . . . . . . . . . . . . . . . . . . . . . . . . . . . . . . . . . . . . . . .60
Theory of Operation . . . . . . . . . . . . . . . . . . . . . . . . . . . . . . . . . . . . . . . . . . . . . . . . . . . . . . .62
SpO2/PLETH Module Features . . . . . . . . . . . . . . . . . . . . . . . . . . . . . . . . . . . . . . . . . . . . . .63
SpO2/PLETH Module Exercises . . . . . . . . . . . . . . . . . . . . . . . . . . . . . . . . . . . . . . . . . . . . .65
Temperature (TEMP) Module Concepts . . . . . . . . . . . . . . . . . . . . . . . . . . . . . . . . 66
TEMP Measurement . . . . . . . . . . . . . . . . . . . . . . . . . . . . . . . . . . . . . . . . . . . . . . . . . . . . . . . . . . .66
Description . . . . . . . . . . . . . . . . . . . . . . . . . . . . . . . . . . . . . . . . . . . . . . . . . . . . . . . . . . . . . . .66
Concepts . . . . . . . . . . . . . . . . . . . . . . . . . . . . . . . . . . . . . . . . . . . . . . . . . . . . . . . . . . . . . . . . .66
Measurement Principle . . . . . . . . . . . . . . . . . . . . . . . . . . . . . . . . . . . . . . . . . . . . . . . . . . . . .66
Measurement Acquisition . . . . . . . . . . . . . . . . . . . . . . . . . . . . . . . . . . . . . . . . . . . . . . . . . . .66
Output . . . . . . . . . . . . . . . . . . . . . . . . . . . . . . . . . . . . . . . . . . . . . . . . . . . . . . . . . . . . . . . . . . .66
Criteria for Proper Measurement . . . . . . . . . . . . . . . . . . . . . . . . . . . . . . . . . . . . . . . . . . . .66
Plug-In Modules . . . . . . . . . . . . . . . . . . . . . . . . . . . . . . . . . . . . . . . . . . . . . . . . . . . . . . . . . . .67
References . . . . . . . . . . . . . . . . . . . . . . . . . . . . . . . . . . . . . . . . . . . . . . . . . . . . . . . . . . . . . . .67
TEMP Measurement Exercises . . . . . . . . . . . . . . . . . . . . . . . . . . . . . . . . . . . . . . . . . . . . . .68
TEMP Module . . . . . . . . . . . . . . . . . . . . . . . . . . . . . . . . . . . . . . . . . . . . . . . . . . . . . . . . . . . . . . . .69
Description . . . . . . . . . . . . . . . . . . . . . . . . . . . . . . . . . . . . . . . . . . . . . . . . . . . . . . . . . . . . . . .69
Measurements . . . . . . . . . . . . . . . . . . . . . . . . . . . . . . . . . . . . . . . . . . . . . . . . . . . . . . . . . . . .69
Components . . . . . . . . . . . . . . . . . . . . . . . . . . . . . . . . . . . . . . . . . . . . . . . . . . . . . . . . . . . . . .69
Block Diagram . . . . . . . . . . . . . . . . . . . . . . . . . . . . . . . . . . . . . . . . . . . . . . . . . . . . . . . . . . . .69
Theory of Operation . . . . . . . . . . . . . . . . . . . . . . . . . . . . . . . . . . . . . . . . . . . . . . . . . . . . . . .71
TEMP Module Features . . . . . . . . . . . . . . . . . . . . . . . . . . . . . . . . . . . . . . . . . . . . . . . . . . . .71
TEMP Module Exercises. . . . . . . . . . . . . . . . . . . . . . . . . . . . . . . . . . . . . . . . . . . . . . . . . . . .72
Recorder Module Concepts . . . . . . . . . . . . . . . . . . . . . . . . . . . . . . . . . . . . . . . . . . . 73
Recorder Module (M1116A) . . . . . . . . . . . . . . . . . . . . . . . . . . . . . . . . . . . . . . . . . . . . . . . . . . . .73
Description . . . . . . . . . . . . . . . . . . . . . . . . . . . . . . . . . . . . . . . . . . . . . . . . . . . . . . . . . . . . . . .73
Block Diagram . . . . . . . . . . . . . . . . . . . . . . . . . . . . . . . . . . . . . . . . . . . . . . . . . . . . . . . . . . . .73
Theory of Operation . . . . . . . . . . . . . . . . . . . . . . . . . . . . . . . . . . . . . . . . . . . . . . . . . . . . . . .75
Recorder Module Features . . . . . . . . . . . . . . . . . . . . . . . . . . . . . . . . . . . . . . . . . . . . . . . . . .77
Recorder Module Exercises (M1116A) . . . . . . . . . . . . . . . . . . . . . . . . . . . . . . . . . . . . . . . .79
Recorder Module (M1116B) . . . . . . . . . . . . . . . . . . . . . . . . . . . . . . . . . . . . . . . . . . . . . . . . . . . .80
Description . . . . . . . . . . . . . . . . . . . . . . . . . . . . . . . . . . . . . . . . . . . . . . . . . . . . . . . . . . . . . . .80
Block Diagram . . . . . . . . . . . . . . . . . . . . . . . . . . . . . . . . . . . . . . . . . . . . . . . . . . . . . . . . . . . .80
Theory of Operation . . . . . . . . . . . . . . . . . . . . . . . . . . . . . . . . . . . . . . . . . . . . . . . . . . . . . . .82
Recorder Module Features . . . . . . . . . . . . . . . . . . . . . . . . . . . . . . . . . . . . . . . . . . . . . . . . . .83
Contents-4
Recorder Module Exercises (M1116B) . . . . . . . . . . . . . . . . . . . . . . . . . . . . . . . . . . . . . . . 85
Data Transfer Module Concepts . . . . . . . . . . . . . . . . . . . . . . . . . . . . . . . . . . . . . . . 86
Data Transfer Module . . . . . . . . . . . . . . . . . . . . . . . . . . . . . . . . . . . . . . . . . . . . . . . . . . . . . . . . . 86
Description . . . . . . . . . . . . . . . . . . . . . . . . . . . . . . . . . . . . . . . . . . . . . . . . . . . . . . . . . . . . . . 86
Components . . . . . . . . . . . . . . . . . . . . . . . . . . . . . . . . . . . . . . . . . . . . . . . . . . . . . . . . . . . . . 86
Block Diagram . . . . . . . . . . . . . . . . . . . . . . . . . . . . . . . . . . . . . . . . . . . . . . . . . . . . . . . . . . . 86
Theory of Operation . . . . . . . . . . . . . . . . . . . . . . . . . . . . . . . . . . . . . . . . . . . . . . . . . . . . . . . 88
Data Transfer Module Features . . . . . . . . . . . . . . . . . . . . . . . . . . . . . . . . . . . . . . . . . . . . . 89
Data Transfer Module Exercises . . . . . . . . . . . . . . . . . . . . . . . . . . . . . . . . . . . . . . . . . . . . 90
Advanced Plug-In Modules . . . . . . . . . . . . . . . . . . . . . . . . . . . . . . . . . . . . . . . . . . . 1
Introduction . . . . . . . . . . . . . . . . . . . . . . . . . . . . . . . . . . . . . . . . . . . . . . . . . . . . . . . . . . . . . . . . . .
Goals . . . . . . . . . . . . . . . . . . . . . . . . . . . . . . . . . . . . . . . . . . . . . . . . . . . . . . . . . . . . . . . . . . . .
Objectives . . . . . . . . . . . . . . . . . . . . . . . . . . . . . . . . . . . . . . . . . . . . . . . . . . . . . . . . . . . . . . . .
Topics. . . . . . . . . . . . . . . . . . . . . . . . . . . . . . . . . . . . . . . . . . . . . . . . . . . . . . . . . . . . . . . . . . . .
1
1
1
2
Invasive Blood Pressure Module Concepts . . . . . . . . . . . . . . . . . . . . . . . . . . . . . . . 3
Invasive Blood Pressure Measurement. . . . . . . . . . . . . . . . . . . . . . . . . . . . . . . . . . . . . . . . . . . . 3
Description . . . . . . . . . . . . . . . . . . . . . . . . . . . . . . . . . . . . . . . . . . . . . . . . . . . . . . . . . . . . . . . 3
Concepts . . . . . . . . . . . . . . . . . . . . . . . . . . . . . . . . . . . . . . . . . . . . . . . . . . . . . . . . . . . . . . . . . 3
Measurement Principle . . . . . . . . . . . . . . . . . . . . . . . . . . . . . . . . . . . . . . . . . . . . . . . . . . . . . 3
Measurement Acquisition . . . . . . . . . . . . . . . . . . . . . . . . . . . . . . . . . . . . . . . . . . . . . . . . . . . 3
Measurement Output . . . . . . . . . . . . . . . . . . . . . . . . . . . . . . . . . . . . . . . . . . . . . . . . . . . . . . . 4
Criteria for Proper Measurement . . . . . . . . . . . . . . . . . . . . . . . . . . . . . . . . . . . . . . . . . . . . . 4
Plug-In Modules . . . . . . . . . . . . . . . . . . . . . . . . . . . . . . . . . . . . . . . . . . . . . . . . . . . . . . . . . . . 4
Invasive Blood Pressure Measurement Exercises . . . . . . . . . . . . . . . . . . . . . . . . . . . . . . . 5
Invasive Blood Pressure Module (M1006A) . . . . . . . . . . . . . . . . . . . . . . . . . . . . . . . . . . . . . . . . 6
Description . . . . . . . . . . . . . . . . . . . . . . . . . . . . . . . . . . . . . . . . . . . . . . . . . . . . . . . . . . . . . . . 6
Measurements . . . . . . . . . . . . . . . . . . . . . . . . . . . . . . . . . . . . . . . . . . . . . . . . . . . . . . . . . . . . . 6
Components . . . . . . . . . . . . . . . . . . . . . . . . . . . . . . . . . . . . . . . . . . . . . . . . . . . . . . . . . . . . . . 6
Block Diagram . . . . . . . . . . . . . . . . . . . . . . . . . . . . . . . . . . . . . . . . . . . . . . . . . . . . . . . . . . . . 6
Theory of Operation . . . . . . . . . . . . . . . . . . . . . . . . . . . . . . . . . . . . . . . . . . . . . . . . . . . . . . . . 8
PRESS M1006A Features . . . . . . . . . . . . . . . . . . . . . . . . . . . . . . . . . . . . . . . . . . . . . . . . . . . . 8
PRESS M1006A Module Exercises . . . . . . . . . . . . . . . . . . . . . . . . . . . . . . . . . . . . . . . . . . . 10
Invasive Blood Pressure Module (M1006A/Option #C01) . . . . . . . . . . . . . . . . . . . . . . . . . . . 11
Description . . . . . . . . . . . . . . . . . . . . . . . . . . . . . . . . . . . . . . . . . . . . . . . . . . . . . . . . . . . . . . 11
Measurements . . . . . . . . . . . . . . . . . . . . . . . . . . . . . . . . . . . . . . . . . . . . . . . . . . . . . . . . . . . . 11
Components . . . . . . . . . . . . . . . . . . . . . . . . . . . . . . . . . . . . . . . . . . . . . . . . . . . . . . . . . . . . . 11
Block Diagram . . . . . . . . . . . . . . . . . . . . . . . . . . . . . . . . . . . . . . . . . . . . . . . . . . . . . . . . . . . 11
Theory of Operation . . . . . . . . . . . . . . . . . . . . . . . . . . . . . . . . . . . . . . . . . . . . . . . . . . . . . . . 13
Contents-5
PRESS M1006A/Option #C01 Module Features . . . . . . . . . . . . . . . . . . . . . . . . . . . . . . . . .14
PRESS M1006A/Option #C01 Module Exercises . . . . . . . . . . . . . . . . . . . . . . . . . . . . . . . .15
Invasive Blood Pressure Module (M1006B) . . . . . . . . . . . . . . . . . . . . . . . . . . . . . . . . . . . . . . .16
Description . . . . . . . . . . . . . . . . . . . . . . . . . . . . . . . . . . . . . . . . . . . . . . . . . . . . . . . . . . . . . . .16
Measurements . . . . . . . . . . . . . . . . . . . . . . . . . . . . . . . . . . . . . . . . . . . . . . . . . . . . . . . . . . . .16
Components . . . . . . . . . . . . . . . . . . . . . . . . . . . . . . . . . . . . . . . . . . . . . . . . . . . . . . . . . . . . . .16
Block Diagram . . . . . . . . . . . . . . . . . . . . . . . . . . . . . . . . . . . . . . . . . . . . . . . . . . . . . . . . . . . .16
Theory of Operation . . . . . . . . . . . . . . . . . . . . . . . . . . . . . . . . . . . . . . . . . . . . . . . . . . . . . . .18
PRESS M1006B Module Features . . . . . . . . . . . . . . . . . . . . . . . . . . . . . . . . . . . . . . . . . . . .18
PRESS M1006B Module Exercises . . . . . . . . . . . . . . . . . . . . . . . . . . . . . . . . . . . . . . . . . . .19
CO2 Respiratory Gas Module Concepts . . . . . . . . . . . . . . . . . . . . . . . . . . . . . . . . . 20
CO2 Respiratory Gas Measurement . . . . . . . . . . . . . . . . . . . . . . . . . . . . . . . . . . . . . . . . . . . . . .20
Description . . . . . . . . . . . . . . . . . . . . . . . . . . . . . . . . . . . . . . . . . . . . . . . . . . . . . . . . . . . . . . .20
Concepts . . . . . . . . . . . . . . . . . . . . . . . . . . . . . . . . . . . . . . . . . . . . . . . . . . . . . . . . . . . . . . . . .20
Measurement Principle . . . . . . . . . . . . . . . . . . . . . . . . . . . . . . . . . . . . . . . . . . . . . . . . . . . . .20
Measurement Acquisition . . . . . . . . . . . . . . . . . . . . . . . . . . . . . . . . . . . . . . . . . . . . . . . . . . .20
Measurement Output. . . . . . . . . . . . . . . . . . . . . . . . . . . . . . . . . . . . . . . . . . . . . . . . . . . . . . .20
Criteria for Proper Measurement . . . . . . . . . . . . . . . . . . . . . . . . . . . . . . . . . . . . . . . . . . . .21
Plug-In Modules . . . . . . . . . . . . . . . . . . . . . . . . . . . . . . . . . . . . . . . . . . . . . . . . . . . . . . . . . . .21
CO2 Respiratory Gas Measurement Exercises . . . . . . . . . . . . . . . . . . . . . . . . . . . . . . . . .22
CO2 Respiratory Gas Module (M1016A) . . . . . . . . . . . . . . . . . . . . . . . . . . . . . . . . . . . . . . . . . .23
Description . . . . . . . . . . . . . . . . . . . . . . . . . . . . . . . . . . . . . . . . . . . . . . . . . . . . . . . . . . . . . . .23
Measurements . . . . . . . . . . . . . . . . . . . . . . . . . . . . . . . . . . . . . . . . . . . . . . . . . . . . . . . . . . . .23
Components . . . . . . . . . . . . . . . . . . . . . . . . . . . . . . . . . . . . . . . . . . . . . . . . . . . . . . . . . . . . . .23
Block Diagram . . . . . . . . . . . . . . . . . . . . . . . . . . . . . . . . . . . . . . . . . . . . . . . . . . . . . . . . . . . .23
Theory of Operation . . . . . . . . . . . . . . . . . . . . . . . . . . . . . . . . . . . . . . . . . . . . . . . . . . . . . . .25
CO2 M1016A Features. . . . . . . . . . . . . . . . . . . . . . . . . . . . . . . . . . . . . . . . . . . . . . . . . . . . . .25
CO2 M1016A Module Exercises. . . . . . . . . . . . . . . . . . . . . . . . . . . . . . . . . . . . . . . . . . . . . .27
Sidestream CO2 Module (M1015A). . . . . . . . . . . . . . . . . . . . . . . . . . . . . . . . . . . . . . . . . . . . . . .28
Description . . . . . . . . . . . . . . . . . . . . . . . . . . . . . . . . . . . . . . . . . . . . . . . . . . . . . . . . . . . . . . .28
Measurements . . . . . . . . . . . . . . . . . . . . . . . . . . . . . . . . . . . . . . . . . . . . . . . . . . . . . . . . . . . .28
Components . . . . . . . . . . . . . . . . . . . . . . . . . . . . . . . . . . . . . . . . . . . . . . . . . . . . . . . . . . . . . .28
Block Diagram . . . . . . . . . . . . . . . . . . . . . . . . . . . . . . . . . . . . . . . . . . . . . . . . . . . . . . . . . . . .28
Theory of Operation . . . . . . . . . . . . . . . . . . . . . . . . . . . . . . . . . . . . . . . . . . . . . . . . . . . . . . .30
M1015A Sidestream CO2 Module Features . . . . . . . . . . . . . . . . . . . . . . . . . . . . . . . . . . . .31
M1015A Sidestream Module Exercises . . . . . . . . . . . . . . . . . . . . . . . . . . . . . . . . . . . . . . . .32
FIO2 Module Concepts (CMS only) . . . . . . . . . . . . . . . . . . . . . . . . . . . . . . . . . . . . 33
FIO2 Respiratory Measurement . . . . . . . . . . . . . . . . . . . . . . . . . . . . . . . . . . . . . . . . . . . . . . . . .33
Description . . . . . . . . . . . . . . . . . . . . . . . . . . . . . . . . . . . . . . . . . . . . . . . . . . . . . . . . . . . . . . .33
Contents-6
Concepts . . . . . . . . . . . . . . . . . . . . . . . . . . . . . . . . . . . . . . . . . . . . . . . . . . . . . . . . . . . . . . . .
Measurement Principle . . . . . . . . . . . . . . . . . . . . . . . . . . . . . . . . . . . . . . . . . . . . . . . . . . . .
Measurement Acquisition . . . . . . . . . . . . . . . . . . . . . . . . . . . . . . . . . . . . . . . . . . . . . . . . . .
Measurement Output . . . . . . . . . . . . . . . . . . . . . . . . . . . . . . . . . . . . . . . . . . . . . . . . . . . . . .
Criteria for Proper Measurement . . . . . . . . . . . . . . . . . . . . . . . . . . . . . . . . . . . . . . . . . . . .
Plug-In Modules . . . . . . . . . . . . . . . . . . . . . . . . . . . . . . . . . . . . . . . . . . . . . . . . . . . . . . . . . .
FIO2 Respiratory Measurement Exercises . . . . . . . . . . . . . . . . . . . . . . . . . . . . . . . . . . . .
FIO2 Module (M1017A). . . . . . . . . . . . . . . . . . . . . . . . . . . . . . . . . . . . . . . . . . . . . . . . . . . . . . . .
Description . . . . . . . . . . . . . . . . . . . . . . . . . . . . . . . . . . . . . . . . . . . . . . . . . . . . . . . . . . . . . .
Measurements . . . . . . . . . . . . . . . . . . . . . . . . . . . . . . . . . . . . . . . . . . . . . . . . . . . . . . . . . . . .
Components . . . . . . . . . . . . . . . . . . . . . . . . . . . . . . . . . . . . . . . . . . . . . . . . . . . . . . . . . . . . .
Block Diagram . . . . . . . . . . . . . . . . . . . . . . . . . . . . . . . . . . . . . . . . . . . . . . . . . . . . . . . . . . .
Theory of Operation . . . . . . . . . . . . . . . . . . . . . . . . . . . . . . . . . . . . . . . . . . . . . . . . . . . . . . .
FIO2 M1017A Module Exercises. . . . . . . . . . . . . . . . . . . . . . . . . . . . . . . . . . . . . . . . . . . . .
33
33
33
33
34
34
34
35
35
35
35
35
37
39
Transcutaneous Gas (tcpO2/tcpCO2) Module Concepts . . . . . . . . . . . . . . . . . . . . 40
tcpO2/tcpCO2 Measurement . . . . . . . . . . . . . . . . . . . . . . . . . . . . . . . . . . . . . . . . . . . . . . . . . . . 40
Description . . . . . . . . . . . . . . . . . . . . . . . . . . . . . . . . . . . . . . . . . . . . . . . . . . . . . . . . . . . . . . 40
Concepts . . . . . . . . . . . . . . . . . . . . . . . . . . . . . . . . . . . . . . . . . . . . . . . . . . . . . . . . . . . . . . . . 40
Measurement Principle . . . . . . . . . . . . . . . . . . . . . . . . . . . . . . . . . . . . . . . . . . . . . . . . . . . . 40
Measurement Acquisition . . . . . . . . . . . . . . . . . . . . . . . . . . . . . . . . . . . . . . . . . . . . . . . . . . 41
Measurement Output . . . . . . . . . . . . . . . . . . . . . . . . . . . . . . . . . . . . . . . . . . . . . . . . . . . . . . 41
Criteria for Proper Measurement . . . . . . . . . . . . . . . . . . . . . . . . . . . . . . . . . . . . . . . . . . . . 41
Plug-In Modules . . . . . . . . . . . . . . . . . . . . . . . . . . . . . . . . . . . . . . . . . . . . . . . . . . . . . . . . . . 41
tcpO2/tcpCO2 Measurement Exercises. . . . . . . . . . . . . . . . . . . . . . . . . . . . . . . . . . . . . . . 42
tcpO2/tcpCO2 Module (M1018A). . . . . . . . . . . . . . . . . . . . . . . . . . . . . . . . . . . . . . . . . . . . . . . . 43
Description . . . . . . . . . . . . . . . . . . . . . . . . . . . . . . . . . . . . . . . . . . . . . . . . . . . . . . . . . . . . . . 43
Measurements . . . . . . . . . . . . . . . . . . . . . . . . . . . . . . . . . . . . . . . . . . . . . . . . . . . . . . . . . . . . 43
Calibration Algorithm . . . . . . . . . . . . . . . . . . . . . . . . . . . . . . . . . . . . . . . . . . . . . . . . . . . . . 43
Components . . . . . . . . . . . . . . . . . . . . . . . . . . . . . . . . . . . . . . . . . . . . . . . . . . . . . . . . . . . . . 45
Block Diagram . . . . . . . . . . . . . . . . . . . . . . . . . . . . . . . . . . . . . . . . . . . . . . . . . . . . . . . . . . . 45
Theory of Operation . . . . . . . . . . . . . . . . . . . . . . . . . . . . . . . . . . . . . . . . . . . . . . . . . . . . . . . 47
tcpO2/tcpCO2 M1018A Features . . . . . . . . . . . . . . . . . . . . . . . . . . . . . . . . . . . . . . . . . . . . 48
tcpO2/tcpCO2 M1018A Module Exercises. . . . . . . . . . . . . . . . . . . . . . . . . . . . . . . . . . . . . 49
SvO2 Blood Gas Module Concepts (CMS only) . . . . . . . . . . . . . . . . . . . . . . . . . . . 50
SvO2 Blood Gas Measurement. . . . . . . . . . . . . . . . . . . . . . . . . . . . . . . . . . . . . . . . . . . . . . . . . . 50
Description . . . . . . . . . . . . . . . . . . . . . . . . . . . . . . . . . . . . . . . . . . . . . . . . . . . . . . . . . . . . . . 50
Concepts . . . . . . . . . . . . . . . . . . . . . . . . . . . . . . . . . . . . . . . . . . . . . . . . . . . . . . . . . . . . . . . . 50
Measurement Principle . . . . . . . . . . . . . . . . . . . . . . . . . . . . . . . . . . . . . . . . . . . . . . . . . . . . 50
Measurement Acquisition . . . . . . . . . . . . . . . . . . . . . . . . . . . . . . . . . . . . . . . . . . . . . . . . . . 50
Contents-7
Measurement Output. . . . . . . . . . . . . . . . . . . . . . . . . . . . . . . . . . . . . . . . . . . . . . . . . . . . . . .50
Criteria for Proper Measurement . . . . . . . . . . . . . . . . . . . . . . . . . . . . . . . . . . . . . . . . . . . .50
Plug-In Modules . . . . . . . . . . . . . . . . . . . . . . . . . . . . . . . . . . . . . . . . . . . . . . . . . . . . . . . . . . .50
SvO2 Blood Gas Measurement Exercises. . . . . . . . . . . . . . . . . . . . . . . . . . . . . . . . . . . . . .51
SvO2 Module (M1021A) . . . . . . . . . . . . . . . . . . . . . . . . . . . . . . . . . . . . . . . . . . . . . . . . . . . . . . . .52
Description . . . . . . . . . . . . . . . . . . . . . . . . . . . . . . . . . . . . . . . . . . . . . . . . . . . . . . . . . . . . . . .52
Measurements . . . . . . . . . . . . . . . . . . . . . . . . . . . . . . . . . . . . . . . . . . . . . . . . . . . . . . . . . . . .52
Components . . . . . . . . . . . . . . . . . . . . . . . . . . . . . . . . . . . . . . . . . . . . . . . . . . . . . . . . . . . . . .52
Block Diagram . . . . . . . . . . . . . . . . . . . . . . . . . . . . . . . . . . . . . . . . . . . . . . . . . . . . . . . . . . . .52
Theory of Operation . . . . . . . . . . . . . . . . . . . . . . . . . . . . . . . . . . . . . . . . . . . . . . . . . . . . . . .54
SvO2 M1021A Features . . . . . . . . . . . . . . . . . . . . . . . . . . . . . . . . . . . . . . . . . . . . . . . . . . . . .55
SvO2 M1021A Module Exercises . . . . . . . . . . . . . . . . . . . . . . . . . . . . . . . . . . . . . . . . . . . . .57
Blood Analysis Module Concepts . . . . . . . . . . . . . . . . . . . . . . . . . . . . . . . . . . . . . . 58
Blood Analysis Measurement . . . . . . . . . . . . . . . . . . . . . . . . . . . . . . . . . . . . . . . . . . . . . . . . . . .58
Description . . . . . . . . . . . . . . . . . . . . . . . . . . . . . . . . . . . . . . . . . . . . . . . . . . . . . . . . . . . . . . .58
Concepts . . . . . . . . . . . . . . . . . . . . . . . . . . . . . . . . . . . . . . . . . . . . . . . . . . . . . . . . . . . . . . . . .58
Measurement Principle . . . . . . . . . . . . . . . . . . . . . . . . . . . . . . . . . . . . . . . . . . . . . . . . . . . . .58
Measurement Acquisition . . . . . . . . . . . . . . . . . . . . . . . . . . . . . . . . . . . . . . . . . . . . . . . . . . .60
Measurement Output. . . . . . . . . . . . . . . . . . . . . . . . . . . . . . . . . . . . . . . . . . . . . . . . . . . . . . .60
Negative Factors Affecting Proper Measurement . . . . . . . . . . . . . . . . . . . . . . . . . . . . . . .61
Blood Analysis Module (M1022A). . . . . . . . . . . . . . . . . . . . . . . . . . . . . . . . . . . . . . . . . . . . . . . .62
Description . . . . . . . . . . . . . . . . . . . . . . . . . . . . . . . . . . . . . . . . . . . . . . . . . . . . . . . . . . . . . . .62
Measurements . . . . . . . . . . . . . . . . . . . . . . . . . . . . . . . . . . . . . . . . . . . . . . . . . . . . . . . . . . . .62
Components . . . . . . . . . . . . . . . . . . . . . . . . . . . . . . . . . . . . . . . . . . . . . . . . . . . . . . . . . . . . . .62
Block Diagram . . . . . . . . . . . . . . . . . . . . . . . . . . . . . . . . . . . . . . . . . . . . . . . . . . . . . . . . . . . .62
Theory of Operation . . . . . . . . . . . . . . . . . . . . . . . . . . . . . . . . . . . . . . . . . . . . . . . . . . . . . . .64
Blood Analysis Features . . . . . . . . . . . . . . . . . . . . . . . . . . . . . . . . . . . . . . . . . . . . . . . . . . . .65
Blood Analysis Module - Software Update Requirements . . . . . . . . . . . . . . . . . . . . . . . .66
Blood Analysis Module Exercises . . . . . . . . . . . . . . . . . . . . . . . . . . . . . . . . . . . . . . . . . . . .67
VueLink Module Concepts . . . . . . . . . . . . . . . . . . . . . . . . . . . . . . . . . . . . . . . . . . . . 68
VueLink Module . . . . . . . . . . . . . . . . . . . . . . . . . . . . . . . . . . . . . . . . . . . . . . . . . . . . . . . . . . . . . .68
Description . . . . . . . . . . . . . . . . . . . . . . . . . . . . . . . . . . . . . . . . . . . . . . . . . . . . . . . . . . . . . . .68
Measurements . . . . . . . . . . . . . . . . . . . . . . . . . . . . . . . . . . . . . . . . . . . . . . . . . . . . . . . . . . . .68
Components . . . . . . . . . . . . . . . . . . . . . . . . . . . . . . . . . . . . . . . . . . . . . . . . . . . . . . . . . . . . . .69
Block Diagram . . . . . . . . . . . . . . . . . . . . . . . . . . . . . . . . . . . . . . . . . . . . . . . . . . . . . . . . . . . .69
Theory of Operation . . . . . . . . . . . . . . . . . . . . . . . . . . . . . . . . . . . . . . . . . . . . . . . . . . . . . . .71
M1032A VueLink Module Features . . . . . . . . . . . . . . . . . . . . . . . . . . . . . . . . . . . . . . . . . . .71
VueLink Module Exercises . . . . . . . . . . . . . . . . . . . . . . . . . . . . . . . . . . . . . . . . . . . . . . . . . .73
Contents-8
EEG Module Concepts (CMS only) . . . . . . . . . . . . . . . . . . . . . . . . . . . . . . . . . . . . 74
EEG Measurement. . . . . . . . . . . . . . . . . . . . . . . . . . . . . . . . . . . . . . . . . . . . . . . . . . . . . . . . . . . . 74
Basics . . . . . . . . . . . . . . . . . . . . . . . . . . . . . . . . . . . . . . . . . . . . . . . . . . . . . . . . . . . . . . . . . . . 74
EEG Channels . . . . . . . . . . . . . . . . . . . . . . . . . . . . . . . . . . . . . . . . . . . . . . . . . . . . . . . . . . . . 74
EEG Signal. . . . . . . . . . . . . . . . . . . . . . . . . . . . . . . . . . . . . . . . . . . . . . . . . . . . . . . . . . . . . . . 74
Brain Waves. . . . . . . . . . . . . . . . . . . . . . . . . . . . . . . . . . . . . . . . . . . . . . . . . . . . . . . . . . . . . . 74
Frequency . . . . . . . . . . . . . . . . . . . . . . . . . . . . . . . . . . . . . . . . . . . . . . . . . . . . . . . . . . . . . . . 75
Amplitude . . . . . . . . . . . . . . . . . . . . . . . . . . . . . . . . . . . . . . . . . . . . . . . . . . . . . . . . . . . . . . . 77
Symmetry. . . . . . . . . . . . . . . . . . . . . . . . . . . . . . . . . . . . . . . . . . . . . . . . . . . . . . . . . . . . . . . . 77
Patterns . . . . . . . . . . . . . . . . . . . . . . . . . . . . . . . . . . . . . . . . . . . . . . . . . . . . . . . . . . . . . . . . . 77
EEG Module . . . . . . . . . . . . . . . . . . . . . . . . . . . . . . . . . . . . . . . . . . . . . . . . . . . . . . . . . . . . . . . . . 79
Description . . . . . . . . . . . . . . . . . . . . . . . . . . . . . . . . . . . . . . . . . . . . . . . . . . . . . . . . . . . . . . 79
Measurements . . . . . . . . . . . . . . . . . . . . . . . . . . . . . . . . . . . . . . . . . . . . . . . . . . . . . . . . . . . . 79
Components . . . . . . . . . . . . . . . . . . . . . . . . . . . . . . . . . . . . . . . . . . . . . . . . . . . . . . . . . . . . . 80
Block Diagram . . . . . . . . . . . . . . . . . . . . . . . . . . . . . . . . . . . . . . . . . . . . . . . . . . . . . . . . . . . 81
Theory of Operation . . . . . . . . . . . . . . . . . . . . . . . . . . . . . . . . . . . . . . . . . . . . . . . . . . . . . . . 81
Electrode Application . . . . . . . . . . . . . . . . . . . . . . . . . . . . . . . . . . . . . . . . . . . . . . . . . . . . . 83
EEG Module Features . . . . . . . . . . . . . . . . . . . . . . . . . . . . . . . . . . . . . . . . . . . . . . . . . . . . . 85
BIS Module Concepts . . . . . . . . . . . . . . . . . . . . . . . . . . . . . . . . . . . . . . . . . . . . . . . 86
BIS Measurement. . . . . . . . . . . . . . . . . . . . . . . . . . . . . . . . . . . . . . . . . . . . . . . . . . . . . . . . . . . . . 86
Introduction . . . . . . . . . . . . . . . . . . . . . . . . . . . . . . . . . . . . . . . . . . . . . . . . . . . . . . . . . . . . . 86
Depth of Anesthesia . . . . . . . . . . . . . . . . . . . . . . . . . . . . . . . . . . . . . . . . . . . . . . . . . . . . . . 86
The Bispectral Index (BIS) and Depth of Anesthesia . . . . . . . . . . . . . . . . . . . . . . . . . . . 88
BIS Module . . . . . . . . . . . . . . . . . . . . . . . . . . . . . . . . . . . . . . . . . . . . . . . . . . . . . . . . . . . . . . . . . . 93
Description . . . . . . . . . . . . . . . . . . . . . . . . . . . . . . . . . . . . . . . . . . . . . . . . . . . . . . . . . . . . . . 93
Measurement. . . . . . . . . . . . . . . . . . . . . . . . . . . . . . . . . . . . . . . . . . . . . . . . . . . . . . . . . . . . . 93
Components . . . . . . . . . . . . . . . . . . . . . . . . . . . . . . . . . . . . . . . . . . . . . . . . . . . . . . . . . . . . . 93
Theory of Operation . . . . . . . . . . . . . . . . . . . . . . . . . . . . . . . . . . . . . . . . . . . . . . . . . . . . . . . 94
BIS Module Features . . . . . . . . . . . . . . . . . . . . . . . . . . . . . . . . . . . . . . . . . . . . . . . . . . . . . . 95
CMS Patient Monitoring System . . . . . . . . . . . . . . . . . . . . . . . . . . . . . . . . . . . . . . . 1
Introduction . . . . . . . . . . . . . . . . . . . . . . . . . . . . . . . . . . . . . . . . . . . . . . . . . . . . . . . . . . . . . . . . . .
Goals . . . . . . . . . . . . . . . . . . . . . . . . . . . . . . . . . . . . . . . . . . . . . . . . . . . . . . . . . . . . . . . . . . . .
Objectives . . . . . . . . . . . . . . . . . . . . . . . . . . . . . . . . . . . . . . . . . . . . . . . . . . . . . . . . . . . . . . . .
Topics. . . . . . . . . . . . . . . . . . . . . . . . . . . . . . . . . . . . . . . . . . . . . . . . . . . . . . . . . . . . . . . . . . . .
Definitions . . . . . . . . . . . . . . . . . . . . . . . . . . . . . . . . . . . . . . . . . . . . . . . . . . . . . . . . . . . . . . . .
1
1
1
1
2
CMS Patient Monitoring System Overview . . . . . . . . . . . . . . . . . . . . . . . . . . . . . . . 4
Introduction . . . . . . . . . . . . . . . . . . . . . . . . . . . . . . . . . . . . . . . . . . . . . . . . . . . . . . . . . . . . . . 4
Objectives . . . . . . . . . . . . . . . . . . . . . . . . . . . . . . . . . . . . . . . . . . . . . . . . . . . . . . . . . . . . . . . . 4
Contents-9
Concepts . . . . . . . . . . . . . . . . . . . . . . . . . . . . . . . . . . . . . . . . . . . . . . . . . . . . . . . . . . . . . . . . . .4
Topics . . . . . . . . . . . . . . . . . . . . . . . . . . . . . . . . . . . . . . . . . . . . . . . . . . . . . . . . . . . . . . . . . . . .5
CMS Patient Monitoring System Description . . . . . . . . . . . . . . . . . . . . . . . . . . . . . . . . . . . . . . .6
Introduction . . . . . . . . . . . . . . . . . . . . . . . . . . . . . . . . . . . . . . . . . . . . . . . . . . . . . . . . . . . . . . .6
CMS Functionality . . . . . . . . . . . . . . . . . . . . . . . . . . . . . . . . . . . . . . . . . . . . . . . . . . . . . . . . . .6
CMS Features . . . . . . . . . . . . . . . . . . . . . . . . . . . . . . . . . . . . . . . . . . . . . . . . . . . . . . . . . . . . . .7
CMS Functions. . . . . . . . . . . . . . . . . . . . . . . . . . . . . . . . . . . . . . . . . . . . . . . . . . . . . . . . . . . . .7
CMS Patient Monitoring System Modules . . . . . . . . . . . . . . . . . . . . . . . . . . . . . . . . . . . . . . . . . .8
CMS Patient Monitoring System Bus Structure . . . . . . . . . . . . . . . . . . . . . . . . . . . . . . . . . . . .10
Introduction . . . . . . . . . . . . . . . . . . . . . . . . . . . . . . . . . . . . . . . . . . . . . . . . . . . . . . . . . . . . . .10
Physical Backplane . . . . . . . . . . . . . . . . . . . . . . . . . . . . . . . . . . . . . . . . . . . . . . . . . . . . . . . .11
Message Passing Bus. . . . . . . . . . . . . . . . . . . . . . . . . . . . . . . . . . . . . . . . . . . . . . . . . . . . . . .11
Local Bus . . . . . . . . . . . . . . . . . . . . . . . . . . . . . . . . . . . . . . . . . . . . . . . . . . . . . . . . . . . . . . . .11
Utility Bus . . . . . . . . . . . . . . . . . . . . . . . . . . . . . . . . . . . . . . . . . . . . . . . . . . . . . . . . . . . . . . . .11
Function Card Description Summary . . . . . . . . . . . . . . . . . . . . . . . . . . . . . . . . . . . . . . . . .12
Function Cards. . . . . . . . . . . . . . . . . . . . . . . . . . . . . . . . . . . . . . . . . . . . . . . . . . . . . . . . . . . .13
Local Clusters. . . . . . . . . . . . . . . . . . . . . . . . . . . . . . . . . . . . . . . . . . . . . . . . . . . . . . . . . . . . .13
Card Placement . . . . . . . . . . . . . . . . . . . . . . . . . . . . . . . . . . . . . . . . . . . . . . . . . . . . . . . . . . .14
Minimum System Requirements . . . . . . . . . . . . . . . . . . . . . . . . . . . . . . . . . . . . . . . . . . . . .15
CMS Patient Monitoring System Power System . . . . . . . . . . . . . . . . . . . . . . . . . . . . . . . . . . . .17
Introduction . . . . . . . . . . . . . . . . . . . . . . . . . . . . . . . . . . . . . . . . . . . . . . . . . . . . . . . . . . . . . .17
Components . . . . . . . . . . . . . . . . . . . . . . . . . . . . . . . . . . . . . . . . . . . . . . . . . . . . . . . . . . . . . .17
Theory of Operation . . . . . . . . . . . . . . . . . . . . . . . . . . . . . . . . . . . . . . . . . . . . . . . . . . . . . . .17
CMS Patient Monitoring System Hardware Configurations . . . . . . . . . . . . . . . . . . . . . . . . . .19
Introduction . . . . . . . . . . . . . . . . . . . . . . . . . . . . . . . . . . . . . . . . . . . . . . . . . . . . . . . . . . . . . .19
Application CPUs. . . . . . . . . . . . . . . . . . . . . . . . . . . . . . . . . . . . . . . . . . . . . . . . . . . . . . . . . .19
Memory . . . . . . . . . . . . . . . . . . . . . . . . . . . . . . . . . . . . . . . . . . . . . . . . . . . . . . . . . . . . . . . . . .19
Function Card Placement . . . . . . . . . . . . . . . . . . . . . . . . . . . . . . . . . . . . . . . . . . . . . . . . . . .20
Plug-in Parameter Modules . . . . . . . . . . . . . . . . . . . . . . . . . . . . . . . . . . . . . . . . . . . . . . . . .30
CMS Patient Monitoring System Software Configurations . . . . . . . . . . . . . . . . . . . . . . . . . . .31
Introduction . . . . . . . . . . . . . . . . . . . . . . . . . . . . . . . . . . . . . . . . . . . . . . . . . . . . . . . . . . . . . .31
Standard Display . . . . . . . . . . . . . . . . . . . . . . . . . . . . . . . . . . . . . . . . . . . . . . . . . . . . . . . . . .31
Selection Window . . . . . . . . . . . . . . . . . . . . . . . . . . . . . . . . . . . . . . . . . . . . . . . . . . . . . . . . .31
Task Window . . . . . . . . . . . . . . . . . . . . . . . . . . . . . . . . . . . . . . . . . . . . . . . . . . . . . . . . . . . . .31
Screen Messages . . . . . . . . . . . . . . . . . . . . . . . . . . . . . . . . . . . . . . . . . . . . . . . . . . . . . . . . . .31
System Overview Exercises . . . . . . . . . . . . . . . . . . . . . . . . . . . . . . . . . . . . . . . . . . . . . . . . . . . .32
CMS Patient Monitoring System Functional Modules . . . . . . . . . . . . . . . . . . . . . 34
Introduction . . . . . . . . . . . . . . . . . . . . . . . . . . . . . . . . . . . . . . . . . . . . . . . . . . . . . . . . . . . . . .34
Objectives . . . . . . . . . . . . . . . . . . . . . . . . . . . . . . . . . . . . . . . . . . . . . . . . . . . . . . . . . . . . . . . .34
Contents-10
Concepts . . . . . . . . . . . . . . . . . . . . . . . . . . . . . . . . . . . . . . . . . . . . . . . . . . . . . . . . . . . . . . . .
Topics. . . . . . . . . . . . . . . . . . . . . . . . . . . . . . . . . . . . . . . . . . . . . . . . . . . . . . . . . . . . . . . . . . .
Computer Module . . . . . . . . . . . . . . . . . . . . . . . . . . . . . . . . . . . . . . . . . . . . . . . . . . . . . . . . . . . .
Introduction . . . . . . . . . . . . . . . . . . . . . . . . . . . . . . . . . . . . . . . . . . . . . . . . . . . . . . . . . . . . .
Front of the Computer Module . . . . . . . . . . . . . . . . . . . . . . . . . . . . . . . . . . . . . . . . . . . . . .
Rear Connectors . . . . . . . . . . . . . . . . . . . . . . . . . . . . . . . . . . . . . . . . . . . . . . . . . . . . . . . . . .
Integral Power Supply - Computer Module (M1046B) . . . . . . . . . . . . . . . . . . . . . . . . . . . . . .
Integral Power Supply - Connectors and Controls. . . . . . . . . . . . . . . . . . . . . . . . . . . . . .
Remote Power Supply (M1047A). . . . . . . . . . . . . . . . . . . . . . . . . . . . . . . . . . . . . . . . . . . . . . . .
Front Panel Controls - Remote Power Supply . . . . . . . . . . . . . . . . . . . . . . . . . . . . . . . . .
Remote Power Supply - Rear Controls and Connectors . . . . . . . . . . . . . . . . . . . . . . . . .
Display Module . . . . . . . . . . . . . . . . . . . . . . . . . . . . . . . . . . . . . . . . . . . . . . . . . . . . . . . . . . . . . .
Introduction . . . . . . . . . . . . . . . . . . . . . . . . . . . . . . . . . . . . . . . . . . . . . . . . . . . . . . . . . . . . .
Display Models . . . . . . . . . . . . . . . . . . . . . . . . . . . . . . . . . . . . . . . . . . . . . . . . . . . . . . . . . . .
Front of Main Display . . . . . . . . . . . . . . . . . . . . . . . . . . . . . . . . . . . . . . . . . . . . . . . . . . . . .
Front Panel Controls and Connectors . . . . . . . . . . . . . . . . . . . . . . . . . . . . . . . . . . . . . . . .
Rear of Main Display . . . . . . . . . . . . . . . . . . . . . . . . . . . . . . . . . . . . . . . . . . . . . . . . . . . . . .
External Alarm Device Connectors and Controls . . . . . . . . . . . . . . . . . . . . . . . . . . . . . .
CRT Display Rear Panel Connectors and Controls . . . . . . . . . . . . . . . . . . . . . . . . . . . . .
Switch-Mode Power Supply (SMPS) . . . . . . . . . . . . . . . . . . . . . . . . . . . . . . . . . . . . . . . . .
Remote Displays . . . . . . . . . . . . . . . . . . . . . . . . . . . . . . . . . . . . . . . . . . . . . . . . . . . . . . . . . .
Control Panel . . . . . . . . . . . . . . . . . . . . . . . . . . . . . . . . . . . . . . . . . . . . . . . . . . . . . . . . . . . . . . . .
Remote Keypad . . . . . . . . . . . . . . . . . . . . . . . . . . . . . . . . . . . . . . . . . . . . . . . . . . . . . . . . . . . . . .
Introduction . . . . . . . . . . . . . . . . . . . . . . . . . . . . . . . . . . . . . . . . . . . . . . . . . . . . . . . . . . . . .
Connections . . . . . . . . . . . . . . . . . . . . . . . . . . . . . . . . . . . . . . . . . . . . . . . . . . . . . . . . . . . . .
Data Entry Keys . . . . . . . . . . . . . . . . . . . . . . . . . . . . . . . . . . . . . . . . . . . . . . . . . . . . . . . . . .
Module Racks. . . . . . . . . . . . . . . . . . . . . . . . . . . . . . . . . . . . . . . . . . . . . . . . . . . . . . . . . . . . . . . .
Introduction . . . . . . . . . . . . . . . . . . . . . . . . . . . . . . . . . . . . . . . . . . . . . . . . . . . . . . . . . . . . .
Types of Racks . . . . . . . . . . . . . . . . . . . . . . . . . . . . . . . . . . . . . . . . . . . . . . . . . . . . . . . . . . .
Integral Rack Connectors . . . . . . . . . . . . . . . . . . . . . . . . . . . . . . . . . . . . . . . . . . . . . . . . . .
Satellite Module Rack Connectors . . . . . . . . . . . . . . . . . . . . . . . . . . . . . . . . . . . . . . . . . . .
Module Rack Theory of Operation . . . . . . . . . . . . . . . . . . . . . . . . . . . . . . . . . . . . . . . . . . .
Module Rack Block Diagram . . . . . . . . . . . . . . . . . . . . . . . . . . . . . . . . . . . . . . . . . . . . . . .
Plug-in Parameter Modules . . . . . . . . . . . . . . . . . . . . . . . . . . . . . . . . . . . . . . . . . . . . . . . . . . . .
Types of Module . . . . . . . . . . . . . . . . . . . . . . . . . . . . . . . . . . . . . . . . . . . . . . . . . . . . . . . . . .
Alarms . . . . . . . . . . . . . . . . . . . . . . . . . . . . . . . . . . . . . . . . . . . . . . . . . . . . . . . . . . . . . . . . . .
Installing a Parameter Module . . . . . . . . . . . . . . . . . . . . . . . . . . . . . . . . . . . . . . . . . . . . . .
“T” Parameter Module . . . . . . . . . . . . . . . . . . . . . . . . . . . . . . . . . . . . . . . . . . . . . . . . . . . . .
Connection to the Rack . . . . . . . . . . . . . . . . . . . . . . . . . . . . . . . . . . . . . . . . . . . . . . . . . . . .
Connection to the Patient . . . . . . . . . . . . . . . . . . . . . . . . . . . . . . . . . . . . . . . . . . . . . . . . . .
34
35
35
35
35
38
40
40
41
41
42
43
43
43
43
45
46
47
48
50
53
53
54
54
54
54
55
55
55
55
56
56
56
58
58
59
59
59
59
59
Contents-11
Precautions. . . . . . . . . . . . . . . . . . . . . . . . . . . . . . . . . . . . . . . . . . . . . . . . . . . . . . . . . . . . . . .59
CMS Patient Monitoring System Module Exercises . . . . . . . . . . . . . . . . . . . . . . . . . . . . . . . . .60
CMS Master Function Cards . . . . . . . . . . . . . . . . . . . . . . . . . . . . . . . . . . . . . . . . . . 63
Introduction . . . . . . . . . . . . . . . . . . . . . . . . . . . . . . . . . . . . . . . . . . . . . . . . . . . . . . . . . . . . . .63
Objectives . . . . . . . . . . . . . . . . . . . . . . . . . . . . . . . . . . . . . . . . . . . . . . . . . . . . . . . . . . . . . . . .63
Concepts . . . . . . . . . . . . . . . . . . . . . . . . . . . . . . . . . . . . . . . . . . . . . . . . . . . . . . . . . . . . . . . . .63
Topics . . . . . . . . . . . . . . . . . . . . . . . . . . . . . . . . . . . . . . . . . . . . . . . . . . . . . . . . . . . . . . . . . . .64
Master Card Overview . . . . . . . . . . . . . . . . . . . . . . . . . . . . . . . . . . . . . . . . . . . . . . . . . . . . . . . . .64
Introduction . . . . . . . . . . . . . . . . . . . . . . . . . . . . . . . . . . . . . . . . . . . . . . . . . . . . . . . . . . . . . .64
Master Card Functions . . . . . . . . . . . . . . . . . . . . . . . . . . . . . . . . . . . . . . . . . . . . . . . . . . . . .65
Communication with the MPB . . . . . . . . . . . . . . . . . . . . . . . . . . . . . . . . . . . . . . . . . . . . . . .66
DC-to-DC Converter . . . . . . . . . . . . . . . . . . . . . . . . . . . . . . . . . . . . . . . . . . . . . . . . . . . . . . .67
Functional Block Diagram . . . . . . . . . . . . . . . . . . . . . . . . . . . . . . . . . . . . . . . . . . . . . . . . . .67
Theory of Operation . . . . . . . . . . . . . . . . . . . . . . . . . . . . . . . . . . . . . . . . . . . . . . . . . . . . . . .68
Application CPU . . . . . . . . . . . . . . . . . . . . . . . . . . . . . . . . . . . . . . . . . . . . . . . . . . . . . . . . . . . . . .69
Introduction . . . . . . . . . . . . . . . . . . . . . . . . . . . . . . . . . . . . . . . . . . . . . . . . . . . . . . . . . . . . . .69
Components . . . . . . . . . . . . . . . . . . . . . . . . . . . . . . . . . . . . . . . . . . . . . . . . . . . . . . . . . . . . . .69
Theory of Operation . . . . . . . . . . . . . . . . . . . . . . . . . . . . . . . . . . . . . . . . . . . . . . . . . . . . . . .70
Functional Block Diagram . . . . . . . . . . . . . . . . . . . . . . . . . . . . . . . . . . . . . . . . . . . . . . . . . .71
LEDs . . . . . . . . . . . . . . . . . . . . . . . . . . . . . . . . . . . . . . . . . . . . . . . . . . . . . . . . . . . . . . . . . . . .73
Summary of Functions . . . . . . . . . . . . . . . . . . . . . . . . . . . . . . . . . . . . . . . . . . . . . . . . . . . . .73
Configurable Processor Card . . . . . . . . . . . . . . . . . . . . . . . . . . . . . . . . . . . . . . . . . . . . . . . . . . .74
Introduction . . . . . . . . . . . . . . . . . . . . . . . . . . . . . . . . . . . . . . . . . . . . . . . . . . . . . . . . . . . . . .74
Components . . . . . . . . . . . . . . . . . . . . . . . . . . . . . . . . . . . . . . . . . . . . . . . . . . . . . . . . . . . . . .74
Theory of Operation . . . . . . . . . . . . . . . . . . . . . . . . . . . . . . . . . . . . . . . . . . . . . . . . . . . . . . .75
Functional Block Diagram . . . . . . . . . . . . . . . . . . . . . . . . . . . . . . . . . . . . . . . . . . . . . . . . . .76
Daughter Card Block Diagram. . . . . . . . . . . . . . . . . . . . . . . . . . . . . . . . . . . . . . . . . . . . . . .76
CPC LEDs . . . . . . . . . . . . . . . . . . . . . . . . . . . . . . . . . . . . . . . . . . . . . . . . . . . . . . . . . . . . . . . .77
Summary of CPC CPU Features . . . . . . . . . . . . . . . . . . . . . . . . . . . . . . . . . . . . . . . . . . . . .77
Monochrome Display Controller . . . . . . . . . . . . . . . . . . . . . . . . . . . . . . . . . . . . . . . . . . . . . . . .78
Introduction . . . . . . . . . . . . . . . . . . . . . . . . . . . . . . . . . . . . . . . . . . . . . . . . . . . . . . . . . . . . . .78
Connection to Display Module. . . . . . . . . . . . . . . . . . . . . . . . . . . . . . . . . . . . . . . . . . . . . . .78
Components . . . . . . . . . . . . . . . . . . . . . . . . . . . . . . . . . . . . . . . . . . . . . . . . . . . . . . . . . . . . . .78
Theory of Operation . . . . . . . . . . . . . . . . . . . . . . . . . . . . . . . . . . . . . . . . . . . . . . . . . . . . . . .79
Functional Block Diagram . . . . . . . . . . . . . . . . . . . . . . . . . . . . . . . . . . . . . . . . . . . . . . . . . .80
Summary of DSPC Card Features . . . . . . . . . . . . . . . . . . . . . . . . . . . . . . . . . . . . . . . . . . . .81
Color Display Controller Cards. . . . . . . . . . . . . . . . . . . . . . . . . . . . . . . . . . . . . . . . . . . . . . . . . .81
Introduction . . . . . . . . . . . . . . . . . . . . . . . . . . . . . . . . . . . . . . . . . . . . . . . . . . . . . . . . . . . . . .81
Connections . . . . . . . . . . . . . . . . . . . . . . . . . . . . . . . . . . . . . . . . . . . . . . . . . . . . . . . . . . . . . .81
Contents-12
CDSPC_CTRL Components . . . . . . . . . . . . . . . . . . . . . . . . . . . . . . . . . . . . . . . . . . . . . . . .
Theory of Operation . . . . . . . . . . . . . . . . . . . . . . . . . . . . . . . . . . . . . . . . . . . . . . . . . . . . . . .
CDSPC_CTRL Functional Block Diagram. . . . . . . . . . . . . . . . . . . . . . . . . . . . . . . . . . . . .
Summary of CDSPC Cards Features . . . . . . . . . . . . . . . . . . . . . . . . . . . . . . . . . . . . . . . . .
Color Display Controller Card (New Version) . . . . . . . . . . . . . . . . . . . . . . . . . . . . . . . . . . . . .
Introduction . . . . . . . . . . . . . . . . . . . . . . . . . . . . . . . . . . . . . . . . . . . . . . . . . . . . . . . . . . . . .
Connections . . . . . . . . . . . . . . . . . . . . . . . . . . . . . . . . . . . . . . . . . . . . . . . . . . . . . . . . . . . . .
CDSPC Components . . . . . . . . . . . . . . . . . . . . . . . . . . . . . . . . . . . . . . . . . . . . . . . . . . . . . .
Theory of Operation . . . . . . . . . . . . . . . . . . . . . . . . . . . . . . . . . . . . . . . . . . . . . . . . . . . . . . .
CDSPC Functional Block Diagram. . . . . . . . . . . . . . . . . . . . . . . . . . . . . . . . . . . . . . . . . . .
Summary of CDSPC Cards Features . . . . . . . . . . . . . . . . . . . . . . . . . . . . . . . . . . . . . . . . .
Flatscreen Display Controller Card. . . . . . . . . . . . . . . . . . . . . . . . . . . . . . . . . . . . . . . . . . . . . .
Introduction . . . . . . . . . . . . . . . . . . . . . . . . . . . . . . . . . . . . . . . . . . . . . . . . . . . . . . . . . . . . .
Connections . . . . . . . . . . . . . . . . . . . . . . . . . . . . . . . . . . . . . . . . . . . . . . . . . . . . . . . . . . . . .
DSPC_FLAT Components . . . . . . . . . . . . . . . . . . . . . . . . . . . . . . . . . . . . . . . . . . . . . . . . . .
Theory of Operation . . . . . . . . . . . . . . . . . . . . . . . . . . . . . . . . . . . . . . . . . . . . . . . . . . . . . . .
DSPC_FLAT Functional Block Diagram . . . . . . . . . . . . . . . . . . . . . . . . . . . . . . . . . . . . . .
Summary of DSPC_FLAT Card Features . . . . . . . . . . . . . . . . . . . . . . . . . . . . . . . . . . . . .
DSPC_FLAT_ASIA Flatscreen Controller Card. . . . . . . . . . . . . . . . . . . . . . . . . . . . . . . . . . . .
Introduction . . . . . . . . . . . . . . . . . . . . . . . . . . . . . . . . . . . . . . . . . . . . . . . . . . . . . . . . . . . . .
Connections . . . . . . . . . . . . . . . . . . . . . . . . . . . . . . . . . . . . . . . . . . . . . . . . . . . . . . . . . . . . .
DSPC_FLAT_ASIA Components . . . . . . . . . . . . . . . . . . . . . . . . . . . . . . . . . . . . . . . . . . . .
Theory of Operation . . . . . . . . . . . . . . . . . . . . . . . . . . . . . . . . . . . . . . . . . . . . . . . . . . . . . . .
Summary of Features . . . . . . . . . . . . . . . . . . . . . . . . . . . . . . . . . . . . . . . . . . . . . . . . . . . . . .
DSPC_XGA Display Controller Card. . . . . . . . . . . . . . . . . . . . . . . . . . . . . . . . . . . . . . . . . . . . .
Introduction . . . . . . . . . . . . . . . . . . . . . . . . . . . . . . . . . . . . . . . . . . . . . . . . . . . . . . . . . . . . .
Connections . . . . . . . . . . . . . . . . . . . . . . . . . . . . . . . . . . . . . . . . . . . . . . . . . . . . . . . . . . . . .
DSPC_XGA Components. . . . . . . . . . . . . . . . . . . . . . . . . . . . . . . . . . . . . . . . . . . . . . . . . . .
Theory of Operation . . . . . . . . . . . . . . . . . . . . . . . . . . . . . . . . . . . . . . . . . . . . . . . . . . . . . . .
DSPC_XGA Functional Block Diagram . . . . . . . . . . . . . . . . . . . . . . . . . . . . . . . . . . . . . . .
Summary of DSPC_XGA Card Features . . . . . . . . . . . . . . . . . . . . . . . . . . . . . . . . . . . . . .
Utility CPU . . . . . . . . . . . . . . . . . . . . . . . . . . . . . . . . . . . . . . . . . . . . . . . . . . . . . . . . . . . . . . . . . .
Introduction . . . . . . . . . . . . . . . . . . . . . . . . . . . . . . . . . . . . . . . . . . . . . . . . . . . . . . . . . . . . .
Connections or Interfaces . . . . . . . . . . . . . . . . . . . . . . . . . . . . . . . . . . . . . . . . . . . . . . . . . .
Components . . . . . . . . . . . . . . . . . . . . . . . . . . . . . . . . . . . . . . . . . . . . . . . . . . . . . . . . . . . . .
Theory of Operation . . . . . . . . . . . . . . . . . . . . . . . . . . . . . . . . . . . . . . . . . . . . . . . . . . . . . . .
Functional Block Diagram . . . . . . . . . . . . . . . . . . . . . . . . . . . . . . . . . . . . . . . . . . . . . . . . .
Utility Card LEDs . . . . . . . . . . . . . . . . . . . . . . . . . . . . . . . . . . . . . . . . . . . . . . . . . . . . . . . . .
Summary of Utility CPU Features . . . . . . . . . . . . . . . . . . . . . . . . . . . . . . . . . . . . . . . . . . .
RS232/RS422 Dual Interface Card . . . . . . . . . . . . . . . . . . . . . . . . . . . . . . . . . . . . . . . . . . . . . . .
82
82
83
83
84
84
84
84
85
86
86
87
87
87
87
87
88
88
89
89
89
89
89
89
90
90
90
90
90
91
91
92
92
92
92
93
96
97
97
98
Contents-13
Introduction . . . . . . . . . . . . . . . . . . . . . . . . . . . . . . . . . . . . . . . . . . . . . . . . . . . . . . . . . . . . . .98
Software Release Changes . . . . . . . . . . . . . . . . . . . . . . . . . . . . . . . . . . . . . . . . . . . . . . . . . .98
Connections . . . . . . . . . . . . . . . . . . . . . . . . . . . . . . . . . . . . . . . . . . . . . . . . . . . . . . . . . . . . . .98
Components . . . . . . . . . . . . . . . . . . . . . . . . . . . . . . . . . . . . . . . . . . . . . . . . . . . . . . . . . . . . . .99
Theory of Operation . . . . . . . . . . . . . . . . . . . . . . . . . . . . . . . . . . . . . . . . . . . . . . . . . . . . . . .99
Functional Block Diagram . . . . . . . . . . . . . . . . . . . . . . . . . . . . . . . . . . . . . . . . . . . . . . . . .101
Summary of RS232/RS422 Features . . . . . . . . . . . . . . . . . . . . . . . . . . . . . . . . . . . . . . . . .102
HDLC Interface Card . . . . . . . . . . . . . . . . . . . . . . . . . . . . . . . . . . . . . . . . . . . . . . . . . . . . . . . . .102
Introduction . . . . . . . . . . . . . . . . . . . . . . . . . . . . . . . . . . . . . . . . . . . . . . . . . . . . . . . . . . . . .102
Components . . . . . . . . . . . . . . . . . . . . . . . . . . . . . . . . . . . . . . . . . . . . . . . . . . . . . . . . . . . . .102
Theory of Operation . . . . . . . . . . . . . . . . . . . . . . . . . . . . . . . . . . . . . . . . . . . . . . . . . . . . . .102
Testing/Diagnostics . . . . . . . . . . . . . . . . . . . . . . . . . . . . . . . . . . . . . . . . . . . . . . . . . . . . . . .103
Functional Block Diagram . . . . . . . . . . . . . . . . . . . . . . . . . . . . . . . . . . . . . . . . . . . . . . . . .104
Summary of HDLC Features . . . . . . . . . . . . . . . . . . . . . . . . . . . . . . . . . . . . . . . . . . . . . . .104
Analog Interface Card . . . . . . . . . . . . . . . . . . . . . . . . . . . . . . . . . . . . . . . . . . . . . . . . . . . . . . . .105
Introduction . . . . . . . . . . . . . . . . . . . . . . . . . . . . . . . . . . . . . . . . . . . . . . . . . . . . . . . . . . . . .105
Components . . . . . . . . . . . . . . . . . . . . . . . . . . . . . . . . . . . . . . . . . . . . . . . . . . . . . . . . . . . . .105
Theory of Operation . . . . . . . . . . . . . . . . . . . . . . . . . . . . . . . . . . . . . . . . . . . . . . . . . . . . . .106
Functional Block Diagram . . . . . . . . . . . . . . . . . . . . . . . . . . . . . . . . . . . . . . . . . . . . . . . . .108
Summary of Analog Card Features . . . . . . . . . . . . . . . . . . . . . . . . . . . . . . . . . . . . . . . . . .109
CMS Local Function Cards . . . . . . . . . . . . . . . . . . . . . . . . . . . . . . . . . . . . . . . . . . 110
Introduction . . . . . . . . . . . . . . . . . . . . . . . . . . . . . . . . . . . . . . . . . . . . . . . . . . . . . . . . . . . . .110
Objectives . . . . . . . . . . . . . . . . . . . . . . . . . . . . . . . . . . . . . . . . . . . . . . . . . . . . . . . . . . . . . . .110
Concepts . . . . . . . . . . . . . . . . . . . . . . . . . . . . . . . . . . . . . . . . . . . . . . . . . . . . . . . . . . . . . . . .110
Topics . . . . . . . . . . . . . . . . . . . . . . . . . . . . . . . . . . . . . . . . . . . . . . . . . . . . . . . . . . . . . . . . . .111
Local Card Overview . . . . . . . . . . . . . . . . . . . . . . . . . . . . . . . . . . . . . . . . . . . . . . . . . . . . . . . . .111
Introduction . . . . . . . . . . . . . . . . . . . . . . . . . . . . . . . . . . . . . . . . . . . . . . . . . . . . . . . . . . . . .111
Local Card Functions . . . . . . . . . . . . . . . . . . . . . . . . . . . . . . . . . . . . . . . . . . . . . . . . . . . . .111
EPROM . . . . . . . . . . . . . . . . . . . . . . . . . . . . . . . . . . . . . . . . . . . . . . . . . . . . . . . . . . . . . . . . . . . . .113
Introduction . . . . . . . . . . . . . . . . . . . . . . . . . . . . . . . . . . . . . . . . . . . . . . . . . . . . . . . . . . . . .113
Components . . . . . . . . . . . . . . . . . . . . . . . . . . . . . . . . . . . . . . . . . . . . . . . . . . . . . . . . . . . . .113
Theory of Operation . . . . . . . . . . . . . . . . . . . . . . . . . . . . . . . . . . . . . . . . . . . . . . . . . . . . . .114
Functional Block Diagram . . . . . . . . . . . . . . . . . . . . . . . . . . . . . . . . . . . . . . . . . . . . . . . . .114
Summary of EPROM Features . . . . . . . . . . . . . . . . . . . . . . . . . . . . . . . . . . . . . . . . . . . . . .115
SRAM . . . . . . . . . . . . . . . . . . . . . . . . . . . . . . . . . . . . . . . . . . . . . . . . . . . . . . . . . . . . . . . . . . . . . .115
Introduction . . . . . . . . . . . . . . . . . . . . . . . . . . . . . . . . . . . . . . . . . . . . . . . . . . . . . . . . . . . . .115
Components . . . . . . . . . . . . . . . . . . . . . . . . . . . . . . . . . . . . . . . . . . . . . . . . . . . . . . . . . . . . .115
Theory of Operation . . . . . . . . . . . . . . . . . . . . . . . . . . . . . . . . . . . . . . . . . . . . . . . . . . . . . .115
Functional Block Diagram . . . . . . . . . . . . . . . . . . . . . . . . . . . . . . . . . . . . . . . . . . . . . . . . .117
Contents-14
Summary of SRAM Features . . . . . . . . . . . . . . . . . . . . . . . . . . . . . . . . . . . . . . . . . . . . . . .
Color Display Video Card . . . . . . . . . . . . . . . . . . . . . . . . . . . . . . . . . . . . . . . . . . . . . . . . . . . . .
Introduction . . . . . . . . . . . . . . . . . . . . . . . . . . . . . . . . . . . . . . . . . . . . . . . . . . . . . . . . . . . .
Connections . . . . . . . . . . . . . . . . . . . . . . . . . . . . . . . . . . . . . . . . . . . . . . . . . . . . . . . . . . . .
CDSPC_VIDEO Components . . . . . . . . . . . . . . . . . . . . . . . . . . . . . . . . . . . . . . . . . . . . . .
Theory of Operation . . . . . . . . . . . . . . . . . . . . . . . . . . . . . . . . . . . . . . . . . . . . . . . . . . . . . .
CDSPC_VIDEO Functional Block Diagram . . . . . . . . . . . . . . . . . . . . . . . . . . . . . . . . . .
Summary of CDSPC Cards Features . . . . . . . . . . . . . . . . . . . . . . . . . . . . . . . . . . . . . . . .
Serial Distribution Network Interface . . . . . . . . . . . . . . . . . . . . . . . . . . . . . . . . . . . . . . . . . .
Introduction . . . . . . . . . . . . . . . . . . . . . . . . . . . . . . . . . . . . . . . . . . . . . . . . . . . . . . . . . . . .
Connections . . . . . . . . . . . . . . . . . . . . . . . . . . . . . . . . . . . . . . . . . . . . . . . . . . . . . . . . . . . .
Components . . . . . . . . . . . . . . . . . . . . . . . . . . . . . . . . . . . . . . . . . . . . . . . . . . . . . . . . . . . .
Theory of Operation . . . . . . . . . . . . . . . . . . . . . . . . . . . . . . . . . . . . . . . . . . . . . . . . . . . . . .
Summary of SDN Features . . . . . . . . . . . . . . . . . . . . . . . . . . . . . . . . . . . . . . . . . . . . . . . .
Functional Block Diagram . . . . . . . . . . . . . . . . . . . . . . . . . . . . . . . . . . . . . . . . . . . . . . . .
Rack Interface . . . . . . . . . . . . . . . . . . . . . . . . . . . . . . . . . . . . . . . . . . . . . . . . . . . . . . . . . . . . . .
Introduction . . . . . . . . . . . . . . . . . . . . . . . . . . . . . . . . . . . . . . . . . . . . . . . . . . . . . . . . . . . .
Connections . . . . . . . . . . . . . . . . . . . . . . . . . . . . . . . . . . . . . . . . . . . . . . . . . . . . . . . . . . . .
Components . . . . . . . . . . . . . . . . . . . . . . . . . . . . . . . . . . . . . . . . . . . . . . . . . . . . . . . . . . . .
Theory of Operation . . . . . . . . . . . . . . . . . . . . . . . . . . . . . . . . . . . . . . . . . . . . . . . . . . . . . .
Summary of Rack Interface Features . . . . . . . . . . . . . . . . . . . . . . . . . . . . . . . . . . . . . . .
Functional Block Diagram . . . . . . . . . . . . . . . . . . . . . . . . . . . . . . . . . . . . . . . . . . . . . . . .
Aux Connector Card . . . . . . . . . . . . . . . . . . . . . . . . . . . . . . . . . . . . . . . . . . . . . . . . . . . . . . . . .
Introduction . . . . . . . . . . . . . . . . . . . . . . . . . . . . . . . . . . . . . . . . . . . . . . . . . . . . . . . . . . . .
Connections . . . . . . . . . . . . . . . . . . . . . . . . . . . . . . . . . . . . . . . . . . . . . . . . . . . . . . . . . . . .
Remote Switch Card . . . . . . . . . . . . . . . . . . . . . . . . . . . . . . . . . . . . . . . . . . . . . . . . . . . . . . . . .
Introduction . . . . . . . . . . . . . . . . . . . . . . . . . . . . . . . . . . . . . . . . . . . . . . . . . . . . . . . . . . . .
Connections . . . . . . . . . . . . . . . . . . . . . . . . . . . . . . . . . . . . . . . . . . . . . . . . . . . . . . . . . . . .
117
118
118
118
118
119
121
122
122
122
122
123
123
124
125
126
126
126
126
126
127
128
129
129
129
129
129
129
V24 and V26 Patient Monitors . . . . . . . . . . . . . . . . . . . . . . . . . . . . . . . . . . . . . . . . .1
Introduction . . . . . . . . . . . . . . . . . . . . . . . . . . . . . . . . . . . . . . . . . . . . . . . . . . . . . . . . . . . . . . . . . .
Goals . . . . . . . . . . . . . . . . . . . . . . . . . . . . . . . . . . . . . . . . . . . . . . . . . . . . . . . . . . . . . . . . . . . .
Objectives . . . . . . . . . . . . . . . . . . . . . . . . . . . . . . . . . . . . . . . . . . . . . . . . . . . . . . . . . . . . . . . .
Topics. . . . . . . . . . . . . . . . . . . . . . . . . . . . . . . . . . . . . . . . . . . . . . . . . . . . . . . . . . . . . . . . . . . .
V24 and V26 Patient Monitors Description and Features. . . . . . . . . . . . . . . . . . . . . . . . . . . . .
Introduction . . . . . . . . . . . . . . . . . . . . . . . . . . . . . . . . . . . . . . . . . . . . . . . . . . . . . . . . . . . . . .
Objectives . . . . . . . . . . . . . . . . . . . . . . . . . . . . . . . . . . . . . . . . . . . . . . . . . . . . . . . . . . . . . . . .
Concepts . . . . . . . . . . . . . . . . . . . . . . . . . . . . . . . . . . . . . . . . . . . . . . . . . . . . . . . . . . . . . . . . .
Clinical Uses . . . . . . . . . . . . . . . . . . . . . . . . . . . . . . . . . . . . . . . . . . . . . . . . . . . . . . . . . . . . . .
Product Releases . . . . . . . . . . . . . . . . . . . . . . . . . . . . . . . . . . . . . . . . . . . . . . . . . . . . . . . . . .
1
1
1
2
3
3
3
3
3
3
Contents-15
V24 and V26 Patient Monitors Standard Package . . . . . . . . . . . . . . . . . . . . . . . . . . . . . . . .3
Features . . . . . . . . . . . . . . . . . . . . . . . . . . . . . . . . . . . . . . . . . . . . . . . . . . . . . . . . . . . . . . . . . .3
Mainframe. . . . . . . . . . . . . . . . . . . . . . . . . . . . . . . . . . . . . . . . . . . . . . . . . . . . . . . . . . . . . . . . .5
Rack Features . . . . . . . . . . . . . . . . . . . . . . . . . . . . . . . . . . . . . . . . . . . . . . . . . . . . . . . . . . . . .5
Parameter Modules . . . . . . . . . . . . . . . . . . . . . . . . . . . . . . . . . . . . . . . . . . . . . . . . . . . . . . . . .6
Philips Patient Care System . . . . . . . . . . . . . . . . . . . . . . . . . . . . . . . . . . . . . . . . . . . . . . . . . .7
Data Management . . . . . . . . . . . . . . . . . . . . . . . . . . . . . . . . . . . . . . . . . . . . . . . . . . . . . . . . . .7
Vital Signs Recording . . . . . . . . . . . . . . . . . . . . . . . . . . . . . . . . . . . . . . . . . . . . . . . . . . . . . . .7
Split Screen Capability . . . . . . . . . . . . . . . . . . . . . . . . . . . . . . . . . . . . . . . . . . . . . . . . . . . . . .7
Clinical Calculation Set. . . . . . . . . . . . . . . . . . . . . . . . . . . . . . . . . . . . . . . . . . . . . . . . . . . . . .7
Drug Calculator . . . . . . . . . . . . . . . . . . . . . . . . . . . . . . . . . . . . . . . . . . . . . . . . . . . . . . . . . . . .7
Arrhythmia Detection . . . . . . . . . . . . . . . . . . . . . . . . . . . . . . . . . . . . . . . . . . . . . . . . . . . . . . .8
Anesthetic Gas Monitoring . . . . . . . . . . . . . . . . . . . . . . . . . . . . . . . . . . . . . . . . . . . . . . . . . . .8
Alarms . . . . . . . . . . . . . . . . . . . . . . . . . . . . . . . . . . . . . . . . . . . . . . . . . . . . . . . . . . . . . . . . . . . .8
ST Segment Analysis . . . . . . . . . . . . . . . . . . . . . . . . . . . . . . . . . . . . . . . . . . . . . . . . . . . . . . . .9
oxyCRG . . . . . . . . . . . . . . . . . . . . . . . . . . . . . . . . . . . . . . . . . . . . . . . . . . . . . . . . . . . . . . . . . . .9
Neonatal Event Review. . . . . . . . . . . . . . . . . . . . . . . . . . . . . . . . . . . . . . . . . . . . . . . . . . . . . .9
Settings Transfer . . . . . . . . . . . . . . . . . . . . . . . . . . . . . . . . . . . . . . . . . . . . . . . . . . . . . . . . . . .9
V24 and V26 Patient Monitors Features Exercises . . . . . . . . . . . . . . . . . . . . . . . . . . . . . .10
V24 and V26 Patient Monitors Interfaces. . . . . . . . . . . . . . . . . . . . . . . . . . . . . . . . . . . . . . . . . .11
Introduction . . . . . . . . . . . . . . . . . . . . . . . . . . . . . . . . . . . . . . . . . . . . . . . . . . . . . . . . . . . . . .11
Objectives . . . . . . . . . . . . . . . . . . . . . . . . . . . . . . . . . . . . . . . . . . . . . . . . . . . . . . . . . . . . . . . .11
Concepts . . . . . . . . . . . . . . . . . . . . . . . . . . . . . . . . . . . . . . . . . . . . . . . . . . . . . . . . . . . . . . . . .11
Overview . . . . . . . . . . . . . . . . . . . . . . . . . . . . . . . . . . . . . . . . . . . . . . . . . . . . . . . . . . . . . . . . .11
V24 and V26 Patient Monitors Interfaces Exercises . . . . . . . . . . . . . . . . . . . . . . . . . . . . .13
V24 and V26 Patient Monitors User Controls and Connectors . . . . . . . . . . . . . . . . . . . . . . . .14
Introduction . . . . . . . . . . . . . . . . . . . . . . . . . . . . . . . . . . . . . . . . . . . . . . . . . . . . . . . . . . . . . .14
Objectives . . . . . . . . . . . . . . . . . . . . . . . . . . . . . . . . . . . . . . . . . . . . . . . . . . . . . . . . . . . . . . . .14
Concepts . . . . . . . . . . . . . . . . . . . . . . . . . . . . . . . . . . . . . . . . . . . . . . . . . . . . . . . . . . . . . . . . .14
User Controls. . . . . . . . . . . . . . . . . . . . . . . . . . . . . . . . . . . . . . . . . . . . . . . . . . . . . . . . . . . . . . . . .14
Overview . . . . . . . . . . . . . . . . . . . . . . . . . . . . . . . . . . . . . . . . . . . . . . . . . . . . . . . . . . . . . . . . .14
Display. . . . . . . . . . . . . . . . . . . . . . . . . . . . . . . . . . . . . . . . . . . . . . . . . . . . . . . . . . . . . . . . . . .14
Front Panel Controls . . . . . . . . . . . . . . . . . . . . . . . . . . . . . . . . . . . . . . . . . . . . . . . . . . . . . . .15
The V24/V26 Front Panel Keys . . . . . . . . . . . . . . . . . . . . . . . . . . . . . . . . . . . . . . . . . . . . . . .15
V24/V26 User Controls Exercises . . . . . . . . . . . . . . . . . . . . . . . . . . . . . . . . . . . . . . . . . . . .17
Connectors. . . . . . . . . . . . . . . . . . . . . . . . . . . . . . . . . . . . . . . . . . . . . . . . . . . . . . . . . . . . . . . . . . .18
Overview . . . . . . . . . . . . . . . . . . . . . . . . . . . . . . . . . . . . . . . . . . . . . . . . . . . . . . . . . . . . . . . . .18
Eight-slot Rack . . . . . . . . . . . . . . . . . . . . . . . . . . . . . . . . . . . . . . . . . . . . . . . . . . . . . . . . . . . .18
Six-slot Rack. . . . . . . . . . . . . . . . . . . . . . . . . . . . . . . . . . . . . . . . . . . . . . . . . . . . . . . . . . . . . .18
Connectors Exercises . . . . . . . . . . . . . . . . . . . . . . . . . . . . . . . . . . . . . . . . . . . . . . . . . . . . . .19
Contents-16
V24 and V26 Patient Monitors Software Configurations . . . . . . . . . . . . . . . . . . . . . . . . . . . .
Introduction . . . . . . . . . . . . . . . . . . . . . . . . . . . . . . . . . . . . . . . . . . . . . . . . . . . . . . . . . . . . .
Objectives . . . . . . . . . . . . . . . . . . . . . . . . . . . . . . . . . . . . . . . . . . . . . . . . . . . . . . . . . . . . . . .
Concepts . . . . . . . . . . . . . . . . . . . . . . . . . . . . . . . . . . . . . . . . . . . . . . . . . . . . . . . . . . . . . . . .
Overview . . . . . . . . . . . . . . . . . . . . . . . . . . . . . . . . . . . . . . . . . . . . . . . . . . . . . . . . . . . . . . . .
Modules Partitioning . . . . . . . . . . . . . . . . . . . . . . . . . . . . . . . . . . . . . . . . . . . . . . . . . . . . . .
Application CPU Architecture . . . . . . . . . . . . . . . . . . . . . . . . . . . . . . . . . . . . . . . . . . . . . .
Utility CPU Architecture . . . . . . . . . . . . . . . . . . . . . . . . . . . . . . . . . . . . . . . . . . . . . . . . . . .
Front End Microcontroller Architecture . . . . . . . . . . . . . . . . . . . . . . . . . . . . . . . . . . . . . .
V24/V26 Software Configurations Exercises. . . . . . . . . . . . . . . . . . . . . . . . . . . . . . . . . . .
V24 and V26 Patient Monitors Theory of Operation . . . . . . . . . . . . . . . . . . . . . . . . . . . . . . . .
Overview . . . . . . . . . . . . . . . . . . . . . . . . . . . . . . . . . . . . . . . . . . . . . . . . . . . . . . . . . . . . . . . .
V24, V24C, V26C Power Supply . . . . . . . . . . . . . . . . . . . . . . . . . . . . . . . . . . . . . . . . . . . . .
V24CT/V26CT Power Supply . . . . . . . . . . . . . . . . . . . . . . . . . . . . . . . . . . . . . . . . . . . . . . . .
System Board . . . . . . . . . . . . . . . . . . . . . . . . . . . . . . . . . . . . . . . . . . . . . . . . . . . . . . . . . . . .
Application Subsystem . . . . . . . . . . . . . . . . . . . . . . . . . . . . . . . . . . . . . . . . . . . . . . . . . . . .
Utility Subsystem . . . . . . . . . . . . . . . . . . . . . . . . . . . . . . . . . . . . . . . . . . . . . . . . . . . . . . . . .
Front End Interface Subsystem . . . . . . . . . . . . . . . . . . . . . . . . . . . . . . . . . . . . . . . . . . . . .
Common Subsystem. . . . . . . . . . . . . . . . . . . . . . . . . . . . . . . . . . . . . . . . . . . . . . . . . . . . . . .
Front Panel Keyboard . . . . . . . . . . . . . . . . . . . . . . . . . . . . . . . . . . . . . . . . . . . . . . . . . . . . .
Flat Panel Display. . . . . . . . . . . . . . . . . . . . . . . . . . . . . . . . . . . . . . . . . . . . . . . . . . . . . . . . .
Display Adapter Board. . . . . . . . . . . . . . . . . . . . . . . . . . . . . . . . . . . . . . . . . . . . . . . . . . . . .
3 Board Assembly . . . . . . . . . . . . . . . . . . . . . . . . . . . . . . . . . . . . . . . . . . . . . . . . . . . . . . . . .
Service Port Connectors . . . . . . . . . . . . . . . . . . . . . . . . . . . . . . . . . . . . . . . . . . . . . . . . . . .
Six-slot Rack Eight-slot Rack . . . . . . . . . . . . . . . . . . . . . . . . . . . . . . . . . . . . . . . . . . . . . . .
V24/V26 Theory of Operation Exercises . . . . . . . . . . . . . . . . . . . . . . . . . . . . . . . . . . . . . .
20
20
20
20
20
21
21
21
21
22
23
23
25
25
32
32
32
32
32
32
33
33
33
33
33
33
Philips Monitoring Network (SDN) . . . . . . . . . . . . . . . . . . . . . . . . . . . . . . . . . . . . .1
Introduction . . . . . . . . . . . . . . . . . . . . . . . . . . . . . . . . . . . . . . . . . . . . . . . . . . . . . . . . . . . . . . . . . .
Goals . . . . . . . . . . . . . . . . . . . . . . . . . . . . . . . . . . . . . . . . . . . . . . . . . . . . . . . . . . . . . . . . . . . .
Objectives . . . . . . . . . . . . . . . . . . . . . . . . . . . . . . . . . . . . . . . . . . . . . . . . . . . . . . . . . . . . . . . .
Topics. . . . . . . . . . . . . . . . . . . . . . . . . . . . . . . . . . . . . . . . . . . . . . . . . . . . . . . . . . . . . . . . . . . .
Defining the Philips Monitoring Network (SDN) . . . . . . . . . . . . . . . . . . . . . . . . . . . . . . . . . . .
Philips Monitoring Network (SDN) Components . . . . . . . . . . . . . . . . . . . . . . . . . . . . . . . . . . .
Philips Care Hub (SCC) . . . . . . . . . . . . . . . . . . . . . . . . . . . . . . . . . . . . . . . . . . . . . . . . . . . . .
Philips Monitoring Network (SDN) Interface Circuitry . . . . . . . . . . . . . . . . . . . . . . . . . .
Wall Boxes and Face Plates . . . . . . . . . . . . . . . . . . . . . . . . . . . . . . . . . . . . . . . . . . . . . . . . .
Branch Cables . . . . . . . . . . . . . . . . . . . . . . . . . . . . . . . . . . . . . . . . . . . . . . . . . . . . . . . . . . . . .
Local Distribution Cables (LDC) . . . . . . . . . . . . . . . . . . . . . . . . . . . . . . . . . . . . . . . . . . . . .
How the Philips Monitoring Network (SDN) Works. . . . . . . . . . . . . . . . . . . . . . . . . . . . . . . . .
1
1
1
2
2
3
4
4
4
4
4
4
Contents-17
Defining the Inter-SDN Gateway. . . . . . . . . . . . . . . . . . . . . . . . . . . . . . . . . . . . . . . . . . . . . . . . . .8
Defining the Inter-SDN Gateway Exercises . . . . . . . . . . . . . . . . . . . . . . . . . . . . . . . . . . . . . . .11
Contents-18
Introduction
The Purpose of This Book
Philips Medical Systems’ CMS Patient Monitoring System & V24 and V26 Patient
Monitors Concepts Guide is a companion volume to the Service Guides of both the
CMS and V24/V26 patient monitors. This volume contains conceptual information
and technical details on both patient monitoring families.
The purpose of this book is to provide a conceptual foundation for the monitoring
systems in order to support effective troubleshooting and repair. The book is not
intended to be a comprehensive, in-depth explanation of the product architecture or
technical implementation. Rather, it was developed to offer enough information on
the functions and operations of the monitoring systems so that engineers who repair
them will be able to better understand how they work.
The book provides a bird’s-eye-view of the product family in the context of the
clinical settings and measurements for which they are used. It covers the
physiological measurements that the products were designed to provide, the modules
that acquire those measurements, the three systems that use those modules, and the
network that ties all of the pieces together into an integrated whole.
Who Should Use This Book
If you are a biomedical engineer or a technician responsible for troubleshooting,
repairing, and maintaining Philips’ patient monitoring systems, this book was
designed for you. If you are new to Philips’ product line or monitoring systems, you
may find it helpful as an orientation to the equipment. If you have been working on
the systems for awhile and now want further details on how they work, you are likely
to find much of the information you need here. If you want to learn about patient
measurements and the principles by which they are derived, this is a good place to
start.
Introduction -1
What The Book Contains
What The Book Contains
Intro
The CMS & V24/V26 and their families of products are powerful, flexible patient
monitoring systems that provide a wide range of data acquisition and processing
functions for all types of patients, in both critical care and routine care settings.
Although these patient monitors are highly reliable and easy to use, its high degree of
flexibility and functionality may seem daunting to users and technicians who do not
work with it on a regular basis. The information in this book will, we hope, make the
systems easier to understand.
How the Book is
Structured
The book contains five chapters, each of which may be used independently of the
others.
Chapters in This Book
How the Content Is
Organized
Chapter Title
Description
Basic Plug-In Modules
The measurements taken by the basic set of plug-in
parameter modules used by Philips’ patient monitoring
systems, and the functional descriptions of the modules
themselves.
Advanced Plug-In Modules
The measurements taken by the advanced set of
modules, along with the functional descriptions of the
modules.
CMS
A functional description of the CMS, including its
components and operations.
V24 and V26 Patient Monitors
A functional description of the V24/V26, including its
components and operations.
Philips Patient Network
An overview of the Philips Patient Network (SDN),
including its major components, functions, and the
services it provides.
The flow of information proceeds from the patient inward toward the system. The
chapters begin with the measurements that are taken from patients and the plug-in
modules that are designed to acquire and process those data. The module information
is organized based on the technical complexity of the device, not on the
characteristics of the measurements. The first set of modules, from a technical
perspective, are simpler in operation. The next set of modules performs more
complex data processing operations.
Following the plug-in modules are chapters that cover the monitoring systems with
which the modules can be used. These are the CMS, Anesthesia CMS (ACMS) the
Neonatal CMS (NCMS) and the V24/V26.
The CMS is Philips’ premier modular monitoring system with full functionality and
the ability to use all of the modules. The V24 and V26 are designed to be used with
patients who are being monitored in a Critical Care environment. The V24CT/V26CT
can also be used during patient transport between units. It can use most, but not all, of
the plug-in modules of the Philips patient monitoring system.
Introduction -2
How to Use This Book
The final chapter covers the Philips monitoring network (SDN), also called Philips
patient care system, which enables the monitoring systems to be connected to a
central station. With Philips monitoring network (SDN), central monitoring stations
can be connected to bedside monitors, external computers, and measurement
instruments to provide clinical staff with the configuration that meets their needs.
How to Use This Book
Learning and
Reference
Choose Your
Approach
The book was designed as a combination self-paced training course and reference
manual. While it does not cover every aspect of the monitoring systems in detail, it
covers the functional descriptions that are provided in the Service Manuals for the
individual systems. To help you plan and assess your learning, it provides:
•
goals for each chapter
•
learning objectives for each section within a chapter
•
highlights of important concepts, as well as topic lists at the beginning of each
section
•
practice exercises within each chapter
•
a final self-assessment test at the end of the book
Your approach to this book will likely depend on your personal preference and job
needs. You can use the book as a self-paced training course, a reference document, or
both. Although the book has a logical information flow, the chapters are independent
units that do not have to be read in any particular order. Here are some suggested
approaches:
•
If you are unfamiliar with the products and would like to use the book as a training
document, start at the beginning and work your way through at your own pace,
using the learning aids provided.
•
If you already have some knowledge of the systems and want to identify the areas
in which you need to learn more, you may want to start by taking the test at the
end of the book. The questions are grouped to correspond with specific sections of
the book. By identifying the questions you were not able to answer correctly, you
can focus your learning on only those areas. You’ll also have a better idea of how
much you already know. Then, take the test again at the end to reinforce your
knowledge.
•
You may want to use the book as a reference as you study the troubleshooting
guides for the systems, or as a pre-course to help prepare yourself for
troubleshooting.
•
If you already know a lot about the hardware and want to focus on the
measurement principles exclusively, you may want to pull out those sections and
put them together in whatever order would be useful to you.
Introduction -3
How to Use This Book
Introduction -4
Chapter 1 Basic Plug-In Modules
Introduction
This chapter covers the basic set of plug-in parameter modules used by the patient
monitoring systems and the measurement principles on which they are based. The next
chapter covers the more advanced modules and their measurements.
The categorization of basic and advanced modules is based on the complexity of their
data-processing functions, rather than on the ease or difficulty of taking the
measurements. Engineers who maintain and repair the equipment may want to
become familiar with the basic modules before moving on to the more complex ones.
Goals
Objectives
After successfully completing this chapter, you should be able to:
•
Describe the physiologic measurements that can be acquired and processed by
Philips’ basic plug-in parameter modules.
•
Explain how Philips’ plug-in modules acquire and process physiologic
measurements.
In order to meet the chapter’s goals, you should be able to:
•
Define each of the physiologic measurements.
•
State the principle by which each measurement is derived.
•
Recognize the forms in which the data for each measurement are represented.
•
Identify the criteria and influencing factors related to the proper acquisition of the
measurement.
•
Describe the method, components, and mechanisms by which the measurement’s
electrical signals are processed by the corresponding plug-in module.
•
Identify and describe the features of the module.
Basic Plug-In Modules
1-1
Introduction
Topics
This chapter contains the following topics:
Chapter Topics
Measurements and Modules
1-2
Basic Plug-In Modules
Page
ECG Measurement
1-3
ECG Module
1-13
RESP Measurement
1-19
ECG/RESP Module
1-23
NBP Measurement
1-30
NBP Modules
1-34
C.O. Measurement
1-40
C.O. Module
1-44
C.O. #C10 (CCO) Measurement (CMS only)
1-49
C.O. #C10 (CCO) Module (CMS only)
1-52
SpO2 Measurement
1-56
SpO2/PLETH Module
1-60
TEMP Measurement
1-66
TEMP Module
1-69
Recorder Module (M1116A)
1-73
Recorder Module (M1116B)
1-80
Data Transfer Module
1-86
ECG Measurement
Electrocardiogram/Respirogram (ECG/RESP) Module Concepts
ECG Measurement
Description
The skin surface electrocardiogram (ECG) measures the electrical activity of the
patient's heart, or myocardium. This information indicates the condition of the heart’s
electrical conduction system.
ECG is also referred to as EKG, the abbreviation for the German spelling of the term.
Concepts
Measurement
Principle
ECG concepts important to electrocardiogram measurement are:
•
Lead - A specific electrode or array of electrodes used to record changes in
electrical potential created by activity of an organ, such as the heart.
•
QRS complex - The portion of an ECG waveform that represents the
depolarization of the cardiac ventricles.
•
ST segment - The portion of an ECG waveform that represents the time period
between the end of ventricular depolarization and the start of ventricular
repolarization.
•
Pace pulse - On an ECG waveform, the marks indicating the initiation of cardiac
depolarization and contraction generated by an artificial pacemaker.
The electrical cells of the heart generate, conduct, and coordinate electrical impulses
that cause the heart’s mechanical cells to contract. As these impulses move through
the various parts of the heart’s conduction system, small electrical currents also move
toward the body’s surface. An ECG measures the heart’s electrical activity as the
heart contracts and relaxes by recording the electrical signals on the patient’s skin.
The measurement represents the changing electrical potentials and their progression
through the heart; the ECG records data on both the direction of electrical activity and
its magnitude.
The electrical signals are detected by electrodes placed on various areas of the
patient's trunk and limbs. The information carried by the signals varies according to
where and how the electrodes are placed.
Measurement
Acquisition
An ECG is recorded using lead cables connected to a monitoring device. ECG leads
are single electrodes, or arrays of electrodes, placed at specific anatomical positions
that detect the electrical voltage of a specific cardiac vector. Each lead monitors the
heart’s electrical activity from a different perspective. Unipolar leads detect signals
moving from the heart to the skin’s surface; bipolar leads detect the surface electrical
activity moving from one electrode to another. The EASI 12-lead ECG uses a special
lead positioning that detects electrical activity, which does not correspond directly to
Basic Plug-In Modules
1-3
ECG Measurement
the standard ECG vectors, but from which all 12 of the standard vectors can be
derived.
Lead cable sets are available with various numbers of lead wires; common types are
three, five, and twelve lead sets. The end of each wire is attached to an electrode and
is color-coded to facilitate anatomical placement. Electrodes can be placed in many
different arrangements, depending on factors such as clinical application, type of
patient, and suspected diagnosis.
Limb Leads
Three bipolar limb leads are called leads I, II, and III. Electrodes are placed on the
patient’s right arm, left arm, and left leg, forming a pattern known as Einthoven’s
triangle. For convenience, the electrodes can also be placed on the patient’s trunk
near the shoulders and hip.
The unipolar leads are called aVR, aVL, and aVF; they can be monitored by the same
three electrodes. When selected on the monitor, these leads measure the current from
the heart out to the specified limb.
Figure 1-1 shows the electrode placements and direction of the signals for limb leads.
(European colors in brackets)
1-4
Basic Plug-In Modules
ECG Measurement
I
+
BLACK
-
[YELLOW]
-
WHITE
[RED]
-
aVR
aVL
III
aVF
II
80x80
+
+
RED
[BLACK]
Figure 1-1 Electrode Placement for Limb Leads
Basic Plug-In Modules
1-5
ECG Measurement
Chest Leads
Chest leads, also called precordial leads, are unipolar. Leads labelled V with a
number or letter designation can be placed around the entire circumference of the
chest, as well as the back. The most common clinical objective in matching V leads is
ischemia detection. Figure 1-2 shows an example of the placement of these leads.
V1
V3R
V4R
V2
V7
V3
VE
V4
V5
V6
80x80
Figure 1-2 Electrode Placement for Chest Leads
1-6
Basic Plug-In Modules
ECG Measurement
Modified Chest Lead
(MCL1)
MCL1 is a bipolar chest lead in which two electrodes are placed over the chest as
shown in Figure 1-3. Other modified leads are also commonly used. The position and
index of the chest electrode corresponds to the V-positions in Figure 1-2. (European
colors in brackets).
WHITE
[RED]
1
2
M
CL
1
3
4
RED
BLACK
[GREEN]
[YELLOW]
80x80
Figure 1-3 Modified Chest Lead (MCL1)
Basic Plug-In Modules
1-7
ECG Measurement
Five-Electrode
Placements
Electrodes for five-lead sets can be placed in various positions. One arrangement is
shown in Figure 1-4. The right leg (RL) lead serves as a ground. (European colors in
brackets).
Angle of
Lewis
BLACK
[YELLOW]
1
WHITE
[RED]
2
3
4
BROWN
[WHITE]
GREEN
80x80
[BLACK]
Figure 1-4 Five Electrode Placement
1-8
Basic Plug-In Modules
RED
[GREEN]
ECG Measurement
For EASI 12-lead ECG derivation, the leads should be placed as shown in
Figure 1-5. (European colors in brackets).
Figure 1-5 EASI 12-lead Electrode Placement
Output
ECG signals are depicted as continuous waveforms that show real-time changes in
lead voltages. The ECG shows the cycles of depolarization and repolarization of
various parts of the heart, enabling practitioners to localize cardiac pathology. It
interprets the electrical potentials as positive or negative, and plots them on a graph as
upward and downward deflections from a baseline.
Basic Plug-In Modules
1-9
ECG Measurement
ECG Waveforms
Many variations of the basic waveform are possible, depending on which leads are
being measured and the condition of the patient’s heart. Figure 1-6 shows the basic
ECG wave.
Figure 1-6 Basic ECG Waveform
The parts of a wave are labeled, P, QRS, and T, as shown in Figure 1-7. For patients
with artificial pacemakers, small dashes called pace pulses appear at the beginning of
each wave. The QRS complex may actually be composed of only Q and R waves,
only R and S waves, or only an R wave.
R
T
P
} DIFFERENCE= ST VALUE
Q
S
Normal QRS Complex
IDEAL
QRS
NO Q WAVE
NO S WAVE
NO R WAVE
ONLY
(Q& S COMBINE)
R WAVE
Figure 1-7 The QRS Complex
ST Segment
1-10
Basic Plug-In Modules
The ST segment is the part of the waveform between the S and T waves. This part of
the waveform plays a critical role in diagnosing cardiac abnormalities. ST segment
analysis is an important function in patient monitoring systems. An elevated or
depressed ST segment can indicate a serious condition.
ECG Measurement
Criteria for Proper
Measurement
Plug-In Modules
Factors affecting accurate measurement of ECG are:
•
Proper placement of electrodes. In order to record the strongest signals from the
appropriate angles, electrodes must be placed precisely. Failure to do so may
result in erroneous readings.
•
Good skin contact. Because ECG signals are small, low voltages (millivolts), the
electrodes must make good contact with the patient’s skin in order to get an
accurate reading. Good contact requires proper skin preparation and periodic
electrode replacement.
•
Proper selection of leads. Leads must be selected with the correct cable sets to
measure the appropriate electrical activity. Selecting the wrong leads could result
in misdiagnosis of the heart’s condition.
•
Elimination of external interference. A patient’s movements or bones can interfere
with the signal, as can pacemaker activity and electrical interference from
electrosurgical units (ESU). In the OR application, for example, electrodes should
be placed equidistant from the surgical site to improve the ESU suppression.
Other extraneous sources of electrical interference can be electrical appliances
around the patient.
Two of Philips’ plug-in modules can measure ECG: the ECG Module (M1001A/B)
and the ECG/RESP Module (M1002A/B). Check the documentation for the system
being used for determination of module usability.
Basic Plug-In Modules
1-11
ECG Measurement
ECG Measurements
Exercises
1. An ECG measures both the magnitude and ________________ of the heart’s
electrical signals.
2. Specific electrodes that measure specific cardiac vectors are
called______________.
3. The right leg electrode serves as a ______________.
4. The part of the ECG waveform that plays a critical role in diagnosing serious heart
conditions is the:
a. P wave
b. QRS complex
c. ST segment
Answers
1. direction
2. leads
3. ground
4. c
1-12
Basic Plug-In Modules
ECG Module
ECG Module
Description
The M1001A/B ECG Module is a three-channel electrocardiogram measurement
parameter unit. It is designed to be used with adult, neonatal, or pediatric patients in
Critical Care environments.
The M1002A/B ECG/RESP Module possesses the same ECG functionality as the
ECG Module and adds respirograph functions as well.
Measurements
The ECG produces up to 3 continuous real-time waveforms of the patient’s cardiac
electrical activity. It also generates numerics for the average heart rate (HR), derived
from either the ECG or a remote arrhythmia computer.
Components
The following components carry out the major signal processing functions within the
module.
Table 1-1 Major ECG Module Components
Block Diagram
Component
Function
Input Protection Network and
ESU Filter
Protects the input amplifiers from defibrillation and high
frequency interference signals.
Lead Selection Switches
Selects channels 1 and 2 for patient leads. (with EASI also
channel 3)
Right Leg Drive
Minimizes interference from the 50/60Hz power line.
Highpass and Lowpass Filters
Allow independent selection of diagnostic, monitoring, or
filter bandwidths for each channel.
Test Signal
Generates a calibration voltage on each channel and tests the
circuitry of the module.
Pace Pulse Detector
Detects pace pulses for channels 1and 2.
Figure 1-8 shows the module’s logical structure.
Basic Plug-In Modules
1-13
INPUT
PROTECTION
NETWORK
+
ESU-FILTER
1-14
Basic Plug-In Modules
TEST
SIGNALS
INPUT
AMPS
RL
DRIVE
LEAD
SWITCH
SIGNAL
SWITCHES
SELECTION
LEAD
ECG ASIC
TWO-CHANNEL
PACE PULSE
DETECTOR
DIFFERENTIAL
AMPS
HIGH &
LOW
PASS
FILTERS
MUX
D
A
RACK
INTERFACE
VARIABLE
AMPLIFIER
LEADS OFF
PATIENT
ISOLATION
CONTROLLER
SYSTEM
RACK
ECG Module
Figure 1-8 M1001A ECG Module Block Diagram
INPUT CONNECTOR
ECG Module
Theory of Operation
(M1001A/M1002A)
As ECG signals pass from the patient to the monitor, they progress through stages
corresponding to the four logical sections of the module, as shown in the block
diagram of Figure 1-8. Module-related faults can generally be isolated to one of the
four stages.
1 Signals are received through patient electrodes and lead cables by the input
connector.
2 The input protection network and ESU Filter eliminate extraneous signals.
3 The signals are processed by two circuits: the ECG Application Specific
Integrated Circuit (ECG ASIC) and the Pace Pulse Detector (PPD ASIC). At this
point, the analog signals from each lead are selected, amplified, filtered, and
converted to digital form. During the process, the output of each input amplifier is
checked for a leads-off electrode condition, so that any detached electrode can be
identified. The leads for channels 1 and 2 are selected using two identical lead
selection circuits; channel 3 always carries the chest lead. The signals from the
three channels are summed in the differential amplifiers.
To prevent interference from the 50/60Hz power line, the common mode signal
derived from behind the lead selectors is used to drive the right leg drive amplifier.
The output from the amplifier is then returned to the patient via the RL electrode. The
PPD checks channels 1 and 2 to detect pulses from a pacemaker for display or
cardiotach rejection. The high and low pass filters allow the independent selection of
diagnostic, monitoring, or filter bandwidths for each channel.
For calibration purposes a 1mV calibration signal will be generated on each of the
channels, in front of the filtering circuitry. The complete module can be tested (from
in front of the first amplifier) on user request. That means switching the patients lead
off, selecting lead V for all channels, and feeding in a test signal.
4 The microprocessor, which connects to the patient isolators and rack interface
through a front-end link, passes control signals for lead selection and pulse
detection from the monitor to the module components through the control lines. It
extracts the requested physiologic features from the cardiac signals and passes
them on to the monitor. Meanwhile, all needed voltage for the module’s operation
is provided by the internal power supply, which receives 78 MHz and 60 V DC
through the rack interface.
5 In the case of EASI 12-lead ECG, the signal is processed to derive any 3 of the
standard 12 vectors.
Basic Plug-In Modules
1-15
ECG Module
ECG Module
Features
Figure 1-9 shows the user controls and connector for the ECG Module. The parts are
described following the figure.
ECG
M1001A
T
(2)
ECG
(1)
(3)
12
PIN
Figure 1-9 ECG Module Controls and Connectors
User Controls
1 Setup Key—A single-press key used to enter the ECG setup screen.
2 Setup Indicator—A green LED, lit when the ECG setup screen is activated.
Connectors
3 The standard 12-pin connector will accept either a 3-lead or 5-lead ECG cable.
For EASI a 5-lead cable is required.
Waveforms
The size of the waveforms can be adjusted automatically or manually.
Four configuration settings are possible to control the size and position of the
waveform.
1-16
Basic Plug-In Modules
ECG Module
Table 1-2 Waveform Settings
QRS Detection
Setting
Description
Autoadjust
The wave size is automatically adjusted to fit inside the channel. The
position of the wave is optimized so that the middle of the wave
occupies the middle of the channel, unless ST monitoring is switched
on.
Autosize
The wave size is automatically adjusted to fit inside the channel. This
setting adjusts the amplitude of the wave but not its offset.
Gain x 1
The amplitude of the wave is magnified by 1000.
Gain x 2
The amplitude of the wave is magnified by 2000.
Because the QRS complex is the most prominent part of the ECG waveform, it is
used by clinicians to determine the strongest ECG signals.
QRS detection can occur in auto or manual mode. In auto mode, QRS complexes are
detected automatically. In manual mode, the QRS detection level appears on the
screen as a horizontal line across the ECG wave.
Paced vs. Non-Paced
Mode
In non-paced mode, no pace pulses are expected and no pace pulse rejection occurs.
In paced mode, pace pulses are annotated with a small dash on the screen.
ST Segment Analysis
ST segment analysis is an optional feature. ST segment measurements can be
recorded on up to three channels and three leads of a patient’s ECG. The
measurements are shown as numerics on the standard display, graphically in the ST
analysis task window, and as part of patient vital signs and trend graphs. They can be
recorded with reference beats at the bedside, or without beats at a central monitor or
recorder.
Up to 242 sets of real-time algorithm outputs can be graphed, stored, and recalled,
each with up to three channels of data. All stored waves are cleared after a discharge
procedure when the monitor is turned off for more than three hours, or when
monitoring mode is reset.
Safety
To ensure the safety of the patient, the patient-applied parts are isolated from ground
by optical isolators and a transformer. The module is also encapsulated in plastic.
Basic Plug-In Modules
1-17
ECG Module
ECG Module
Exercises
1. The ECG generates numerics for which physiologic measurement?
a. pulse
b. pace pulses
c. heart rate
2. Which ECG Module component prevents interference from the 50/60 Hz power
line?
a. Input protection network
b. Right leg drive
c. Highpass and lowpass filters
3. Which channels does the PPD check for pace pulses?
a. Channels 1 and 2
b. Channels 2 and 3
c. Channels 1, 2, and 3
4. The number of ST segment measurements that can be stored and retrieved is_____.
5. For EASI 12-Lead Monitoring you need
a. a 3-lead or a 5-lead cable
b. a 5-lead cable.
6. With a standard lead set and five-electrode cable set, the leads that can be
monitored are:
a. 3 limb or chest leads on Channels 1, 2, and 3
b. 3 limb or chest leads on Channels 1 and 2, and 1 chest lead on Channel 3
c. 7 limb or chest leads on both Channel 1 and Channel 2, and 1 chest lead on
Channel 3
7. With an EASI lead set, the leads that can be monitored are:
a. 3 limb or chest leads on Channels 1, 2, and 3
b. any lead out of 12 for all 3 channels
c. 7 limb or chest leads on both Channel 1 and Channel 2, and 1 chest lead on
Channel 3
Answers
1. c
2. b
3. a
4. 242
5. b
6. a
7. b
1-18
Basic Plug-In Modules
RESP Measurement
RESP Measurement
Description
A respirogram is a recording of respiratory activity that indicates the strength and
efficiency of a patient’s respiratory (pulmonary) muscles. The measurement can be
accomplished using various techniques; the method employed by Philips’ patient
monitoring devices is the impedance method.
Concepts
Respiration is the metabolic process by which the body obtains oxygen, expels carbon
dioxide, and regulates its acid-base (pH) balance.This process is carried out by a
respiratory system composed of the lungs, the respiratory muscles (notably the
diaphragm and intercostal muscles), and the organs that carry gas into and out of the
lungs. Respiratory monitoring techniques measure either the nature of the gas
exchange within the lungs, or the efficiency of the pulmonary muscles. A respirogram
is concerned with the latter.
An important concept for respirogram monitoring is:
•
Respiratory rate - The timing and rhythm of inspiration and exhalation.
If any of these measurements is above or below the normal range, other respiratory
monitoring techniques may be needed to assess the patient’s overall respiratory
condition.
Measurement
Principle
Within the thorax (chest), the lungs are surrounded by a moist pleural membrane,
which produces a lubricating fluid that enables the lungs to move easily during
respiration. This fluid, along with the change in volume of air, allows the
measurement of electrical impedance when the lungs expand and contract.
A respirogram measures the change in electrical impedance between two electrodes
placed on the patient’s skin as the patient breathes in and out. By using a modulation
technique for measuring the impedance, with a carrier frequency that is far outside the
ECG bandwidth, the same electrodes that are used for the ECG measurement can be
used for respiration. Although the ECG and RESP signals are obtained using the same
electrode set, the measurement principles are fundamentally different.
Basic Plug-In Modules
1-19
RESP Measurement
Measurement
Acquisition
RESP is measured by placing two electrodes, right arm (RA) and left leg (LL), on the
patient’s skin as shown in Figure 1-10. For EASI 12-Lead ECG the positions are
different (see Figure 1-5).
Angle of
Lewis
BLACK
[YELLOW]
WHITE
[RED]
RE
SP
GREEN
[BLACK]
80x80
RED
[GREEN]
Figure 1-10 Electrode Placements for RESP
The impedance measurement contains several signals:
•
The basic impedance of the thorax.
•
The change in impedance caused by breathing.
•
The change in impedance caused by cardiac activity.
The impedance change caused by breathing activity is extracted from the basic
impedance and displayed as a respiration wave. Impedance changes caused by cardiac
activity are discarded and are not included in the respiration rate.
1-20
Basic Plug-In Modules
RESP Measurement
Output
RESP signals are depicted as continuous waveforms that show real-time changes in
impedance. Both the respiratory rate and heart rate are shown as numeric values.
Criteria for Proper
Measurement
Factors affecting accurate measurement of RESP are:
•
Proper placement of electrodes, in order to optimize the measurement of
impedance changes. Since ECG waveforms may require more precise placement,
ECG waveform results may have to be considered when repositioning leads and
electrodes to optimize respiratory wave size.
•
Good skin contact, to maintain a good signal.
•
Elimination of external interference. A patient’s movements, bones, or organs can
interfere with the signal, as can pacemaker activity and electrical interference
from electrosurgical units (ESU). Respirogram monitoring is not recommended
for active patients because false alarms may occur. Normal cardiac activity is
filtered out. However, artifacts from pulsating blood can interfere if the liver or
cardiac ventricles are between the electrodes.
Plug-In Modules
The ECG/RESP Module (M1002A/B) provides respirogram and electrocardiogram
functions. It can be used with most of the monitoring systems in the Philips patient
monitoring family. Check the documentation for the system being used for
determination of module usability.
References
Ahrens, Tom. Respiratory Monitoring in Critical Care, in AACN Clinical Issues in
Critical Care Nursing. [For bibliography: Susan Osguthorpe, ed. Philadelphia, JB
Lippincott, 1993.]
Philips Part No. 78834-90090 “Neonatal Monitoring: The ABCs of ECG and Resp.”
Philips Part No. 5954-2304 Application Note
Basic Plug-In Modules
1-21
RESP Measurement
RESP Measurement
Exercises
1. Respiratory monitoring generally measures two types of pulmonary functioning:
the effectiveness of _____________________ and efficiency of ______________.
2. RESP uses a _____________________ technique that allows electrical impedance
to be measured using ECG electrodes.
3. RESP uses ECG electrodes placed in which positions:
a. Left arm and right arm
b. Left arm and right leg
c. Right arm and left leg
4. The data displayed in a respiration wave are:
a. Impedance change from breathing activity
b. Respiratory rate
c. Heart rate, as a numeric
d. all of the above
Answers
1. Gas exchange, pulmonary muscles
2. Modulation
3. c
4. d
1-22
Basic Plug-In Modules
ECG/RESP Module
ECG/RESP Module
Description
The M1002A ECG/RESP Module is a three-channel electrocardiogram and
respiration measurement parameter unit. It is designed to be used with adult, neonatal,
or pediatric patients in an ICU environment.
The module possesses the same ECG functionality as the M1001A and adds
respirogram functions as well.
Measurements
The ECG/RESP Module produces continuous real-time waveforms for both cardiac
and pulmonary electrical activity. It also generates numerics for the average heart rate
(HR), derived from either the ECG or a remote arrhythmia computer, and for the
respiration rate (RR).
Components
The following components carry out the major signal processing functions within the
module.
Table 1-3 Major ECG Components of ECG/RESP Module
ECG Component
Function
Input Protection Network and
ESU filter
Protects the input amplifiers from defibrillation and high
frequency interference signals.
Lead Selection Switches
Selects channels 1 and 2 for patient leads.
Right Leg Drive
Prevents interference from the 50/60Hz power line.
Highpass and Lowpass Filters
Allow the independent selection of diagnostic, monitoring,
or filter bandwidths for each channel.
Test Signal
Generates a calibration voltage on each channel and tests
the circuitry for the module.
Pace Pulse Detector
Detects pace pulses for channels 1and 2.
Table 1-4 Major RESP Components of ECG/RESP
RESP Component
Function
Input Protection Network and
ESU filter
Protects the input amplifiers from defibrillation and high
frequency interference signals.
Measurement Bridge
Detects and modulates the RA and LL ECG signals with a
39 kHz sine wave. Generates a calibration and test signal.
Synchronous Demodulator
Demodulates the output from the input amplifier.
Impedance Subtracter and
Digital-to-Analog Converter
Subtracts the basic thoracic impedance from the signal and
converts it to digital form.
Basic Plug-In Modules
1-23
1-24
Basic Plug-In Modules
RL
LL
LA
TEST
SIGNAL
INPUT
AMPS
MEASUREMENT
BRIDGE
SINE SHAPER
INPUT
PROTECTION
NETWORK
+
ESU-FILTER
INPUT
AMPLIFIER
39 kHz
RL
DRIVE
SWITCHES
LEAD
SWITCH
SIGNAL
LEAD
SELECTION
HIGH &
LOW
PASS
FILTERS
SYNCHRONOUS
DEMODULATOR
TWO-CHANNEL
PACE PULSE
DETECTOR
DIFFERENTIAL
AMPS
LOW PASS
FILTER
RESP
D
A
DIFFERENTIAL
AMPLIFIER
IMPEDANCE
SUBTRACTOR
D / A -CONV
MUX
VARIABLE
AMLIFIER
LEADS OFF
RACK
INTERFACE
SYSTEM
CONTROLLER
RACK
Block Diagram
RA
C
ECG ASIC
PATIENT
ISOLATION
ECG/RESP Module
Figure 1-11 shows the ECG/RESP module’s logical structure.
Figure 1-11 M1002A/B ECG/RESP Module Block Diagram
INPUT CONNECTION
ECG/RESP Module
Theory of Operation
As ECG and RESP signals pass from the patient to the monitor, they progress through
stages corresponding to the four logical sections of the module, as shown in the block
diagram. Module-related faults can generally be isolated to one of the four stages.
1 Signals are received through patient electrodes and lead cables by the input
connector.
2 The input protection network and ESU filter eliminate extraneous signals.
3 ECG: The signals are processed by two circuits: the ECG Application Specific
Integrated Circuit (ECG ASIC) and the Pace Pulse Detector (PPD ASIC). At this
point, the analog signals from each lead are selected, amplified, filtered, and
converted to digital form. During the process, the output of each input amplifier is
checked for a leads-off electrode condition, so that any individual lead whose
electrode has fallen off can be identified. The leads for channels 1 and 2 are
selected using two identical lead selection circuits; channel 3 always carries the
chest lead. The signals from the three channels are summed in the differential
amplifiers.
To prevent interference from the 50/60Hz power line, the common mode signal
derived from behind the lead selectors is used to drive the right leg drive amplifier.
The output from the amplifier is then returned to the patient via the RL electrode.
The PPD checks for pace pulses on channels 1 and 2 for cardiotach rejection or
marking of the display. The high and low pass filters allow the independent
selection of diagnostic, monitoring, or filter bandwidths for each channel.
For calibration, a 1mV calibration signal is generated on each channel. This is
done by a bandgap voltage reference from a precision voltage divider in front of
the filtering circuitry. The complete module can be tested on user request.
RESP: The measurement bridge, driven by a 39kHz sine wave, detects and
excites the ECG signals from the RA and LL lead paths behind the Input
Protection Network. The modulated output is amplified by the differential input
amplifier, demodulated by the synchronous demodulator, and input to a low-pass
filter. The impedance subtracter subtracts the basic thoracic impedance to derive
the respiration wave signal. The signal is then multiplexed with the ECG signals,
amplified, and converted to digital for use by the microprocessor.
For calibration and testing purposes, a 1 ohm test signal is generated by the bridge
circuitry.
4 The microprocessor, which connects to the patient isolators and rack interface
through a front-end link, passes control signals for lead selection and pulse
detection from the monitor to the module components through the control lines. It
extracts the requested physiologic features from the cardiac signals and passes
them on to the monitor. Meanwhile, all needed voltage for the module’s operation
is provided by the internal power supply, which receives 78 MHz and 60 V DC
through the rack interface.
Basic Plug-In Modules
1-25
ECG/RESP Module
ECG/RESP Module
Features
Figure 1-12 shows the user controls and connector for the ECG/RESP Module. The
parts are described following the figure.
ECG/RESP
M1002A
T
(2)
(4)
ECG
RESP
(3)
(1)
(5)
12
PIN
Figure 1-12 ECG/RESP Module Controls and Connectors
User Controls
1 ECG Setup Key—A single-press key used to enter the ECG setup screen.
2 ECG Setup Indicator—A green LED, lit when the ECG setup screen is
activated.
3 RESP Setup Key—A single-press key used to enter the Respiration setup screen.
4 RESP Setup Indicator—A green LED, lit when the Respiration setup screen is
activated.
Connectors
ECG Modes
5 The standard 12-pin connector will accept either a 3-lead or 5-lead ECG cable.
In auto mode, the QRS complexes are detected automatically. In manual mode, the
QRS detection level appears on the screen as a horizontal line across the ECG wave.
This enables the user to see exactly what is causing the heart rate counter to count.
In non-paced mode, no pace pulses are expected and no pace pulse rejection occurs.
In paced mode, pace pulses are annotated with a small dash on the screen.
1-26
Basic Plug-In Modules
ECG/RESP Module
ST Segment Analysis
ST segment analysis is an optional feature. ST segment measurements can be
recorded on up to three channels and three leads of a patient’s ECG. The
measurements are shown as numerics on the standard display, graphically in the ST
analysis task window, and as part of patient vital signs and trend graphs. They can be
recorded with reference beats at the bedside, or without beats at a central monitor or
recorder.
Up to 242 sets of real-time algorithm outputs can be graphed, stored, and recalled,
each with up to three channels of data. All stored waves are cleared after a discharge
procedure when the monitor is turned off for more than three hours, or when
monitoring mode is reset.
RESP Modes
Safety
In auto mode, the monitor measures respiration and adjusts the detection level
automatically, depending on waveform height, presence of cardiac artifact, and
absence of valid breaths. In manual mode, the user sets the detection level for
measuring respiration.
To ensure the safety of the patient, the patient-applied parts are isolated from ground
by optical isolators and a transformer. The module is also encapsulated in plastic.
Basic Plug-In Modules
1-27
ECG/RESP Module
ECG/RESP Module
Exercises
1. The ECG generates numerics for which physiologic measurement?
a. pulse
b. pace pulses
c. heart rate
2. Which module component prevents interference from the 50/60 Hz power line?
a. Input protection network
b. Right leg drive
c. Highpass and lowpass filters
3. Which channels does the PPD check for pace pulses?
a. Channels 1 and 2
b. Channels 2 and 3
c. Channels 1, 2, and 3
4. The RESP signal is detected by which component?
a. Differential amplifier
b. Impedance subtracter
c. Measurement bridge
d. Synchronous demodulator
5. The impedance subtracter subtracts which part of the RESP signal?
a. heart rate
b. respiratory rate
c. cardiac impedance
d. basic thoracic impedance
6. The number of ST segment measurements that can be stored and retrieved is ___.
7. Respiration is monitored from which two lead paths?
a. LA and RA
b. LA and RL
c. LL and LA
d. LL and RA
1-28
Basic Plug-In Modules
ECG/RESP Module
Answers
1. c
2. b
3. a
4. c
5. d
6. 242
7. d
Basic Plug-In Modules
1-29
NBP Measurement
Non-invasive Blood Pressure (NBP) Module Concepts
NBP Measurement
Description
Blood pressure is the pressure exerted by the blood against the walls of the blood
vessels. Blood pressure measurement indicates the status of a patient’s overall cardiac
condition. Most frequently, blood pressure is measured in the arteries, as they are the
vessels that carry blood from the heart to the body’s major organs.
Non-invasive blood pressure measurements are taken by indirect methods of
obtaining arterial blood pressure values, rather than by direct sampling of the blood
stream. Various techniques can be used for measuring blood pressure non-invasively;
all are based on compressing the artery by means of an occluding cuff, and measuring
the effect of the compression on blood flow. The method used by Philips’ patient
monitoring systems is the oscillometric method. That is, the monitor measures the
oscillation or changes in the volume of the arteries accompanying the heart beat.
Concepts
Blood pressure results from interactions between the heart’s pumping force, the
circulatory system’s blood volume, and the body’s vascular resistance to blood flow.
Blood pressure measurements are related to cardiac output measurements in that both
types are concerned with pumping force and vascular resistance. Cardiac output is a
major determinent of blood pressure.
Concepts important to non-invasive blood pressure measurement are:
Measurement
Principle
1-30
Basic Plug-In Modules
•
Systolic pressure - The highest pressure of the blood against the arterial wall
following ventricular contraction. It is a measure of how hard the heart is working
and how much oxygen it requires.
•
Diastolic pressure - The lowest pressure of the blood against the blood vessel
wall following closure of the aortic valve, just before ventricular contraction. It is
one measure of how much oxygen the heart is getting from the pulmonary
capillaries. I
•
Pulse pressure - The difference between the systolic and diastolic readings. This
is the range of the pressure in the arteries.
•
Mean arterial pressure - The average pressure used to push blood through the
circulatory system. This measurement is an important index of blood flow and gas
exchange in the capillaries.
In the oscillometric method, blood pressure is measured as oscillations superimposed
on cuff pressure. The cuff, inflated around the patient’s limb, senses arterial pulses as
oscillations whose amplitude changes as the cuff is deflated. The initial oscillations
are roughly equivalent to systolic pressure; the larger oscillations represent mean
pressure; and the diastolic pressure is then derived from the mean pressure.
NBP Measurement
Measurement
Acquisition
To take the measurement, the cuff is placed around the patient’s limb and inflated
until the artery is occluded, at a point just above systolic pressure. Blood movement
ceases when cuff pressure is greater than arterial pressure. As cuff deflation
commences, blood begins to flow through the artery at the systolic pressure, and the
resulting pulsations are detected as oscillations. The cuff continues to deflate, and the
amplitude of arterial oscillations increases until it reaches a maximum value, which
represents mean arterial pressure. As cuff deflation continues, arterial pressure drops
due to decreased resistance from the cuff pressure. Diastolic pressure is measured
when the oscillations begin diminishing rapidly.
Output
Oscillometric blood pressure measurements are displayed as numerics.
Criteria for Proper
Measurement
Factors affecting accurate measurement of non-invasive blood pressure are:
Limitations
Plug-In Modules
•
Cuff size. A cuff that is too narrow may produce false BP readings that are too
high. Conversely, a cuff that is too wide may produce false low readings.
•
Cuff placement. The cuff should be placed on the arm at the level of the heart for a
true zero reading. False high readings may be produced by cuffs that are applied
too loosely.
•
Artifacts, caused by shivering, bumping, or other rhythmic or external pressure.
The oscillometric measurement has limitations in certain clinical situations. When a
patient’s condition makes regular arterial pressure pulses difficult to detect, the
measurement is unreliable and takes longer to derive. The following conditions can
interfere with the measurement:
•
Patient Movement: If the patient is moving, shivering, or having convulsions,
reliable measurement is difficult or impossible to obtain.
•
Cardiac Arrhythmias: Irregular heart beats during arrhythmias make
measurements unreliable or impossible.
•
Pressure Changes: If the patient’s blood pressure changes rapidly during the
measurement period, measurements are unreliable.
•
Severe Shock: Severe shock or hypothermia reduces blood flow to the peripheries
and thus reduces arterial pulses, making pressure measurement unreliable.
•
Obese Patients: A thick layer of fat surrounding the limb can muffle arterial pulses
and prevent them from reaching the cuff, thus reducing the measurement’s
accuracy.
•
Heart Rate Extremes: Measurements cannot be made if the heart rate is less than
15 bpm or greater than 300 bpm.
•
Heart-lung Machine: Measurements are not possible if the patient is connected to
a heart-lung machine.
•
Movement of the tube
Philips’ M1008A and M1008B NBP Modules measure non-invasive blood pressure.
The M1008B module replaced the M1008A.
Basic Plug-In Modules
1-31
NBP Measurement
NBP Measurements
Exercises
1. The oscillometric method uses an occluding cuff to sense variations in which of the
following:
a. Cardiac output
b. Ventricular contraction
c. Arterial blood flow
d. Capillary blood supply
2. What is the highest pressure of blood against the arterial wall called?
a. Diastolic Pressure
b. Systolic Pressure
c. Mean Arterial Pressure
d. Pulse Pressure
3. What is the lowest pressure of blood against the arterial wall called?
a. Diastolic Pressure
b. Systolic Pressure
c. Mean Arterial Pressure
d. Pulse Pressure
4. What is the term for the difference between the highest and lowest blood pressure
measurement?
a. Diastolic Pressure
b. Systolic Pressure
c. Mean Arterial Pressure
d. Pulse Pressure
5. What does the highest amplitude oscillation on a non-invasive blood pressure
waveform represent?
a. Diastolic Pressure
b. Systolic Pressure
c. Mean Arterial Pressure
d. Pulse Pressure
6. False blood pressure readings that are too high can be produced by which of the
following circumstances?
a. A cuff that is too narrow
b. A cuff that is too wide
c. A cuff applied too tightly
1-32
Basic Plug-In Modules
NBP Measurement
Answers
1. c
2. b
3. a
4. d
5. c
6. a
Basic Plug-In Modules
1-33
NBP Modules
NBP Modules
Description
The M1008A and M1008B NBP Modules are non-invasive blood pressure
measurement parameter units for Philips’ patient monitoring devices. The M1008A
Module is designed to be used with adult or pediatric patients, in both OR and ICU
environments. The M1008B Module is designed to be used with adult, pediatric, or
neonatal patients, in OR and ICU environments. The M1008A and M1008B Modules
cannot be used simultaneously in a patient monitor.
Measurements
The modules produce numerics for the systolic, diastolic, and mean blood pressure
values. No waveform is associated with these modules.
Three different methods can be used to obtain the measurements:
Venous Puncture
Components
•
Manual: For each request, one measurement of systolic, diastolic, and mean
pressures is taken.
•
Auto: Repeated measurements of the three values are taken at timed intervals
specified by the user.
•
Stat: Measurements of the three values are taken immediately and repeatedly over
a period of five minutes. This method uses a faster measurement procedure but
produces a less accurate reading.
This is not a measurement mode, rather the cuff is inflated to and held at a preset
pressure to help you find a vein to puncture. The cuff deflates automatically after a
fixed time, or you can deflate it manually.
The following components carry out the major signal processing functions within the
module.
Table 1-5 Major NBP Module Components
Block Diagram
1-34
Basic Plug-In Modules
Component
Function
Pressure Pump
Inflates the cuff to preset limits, once or repeatedly,
depending on the measurement method used.
Pressure Sensor
Measures cuff and arterial pressures using solid-state
technology.
Overpressure Safety
System
Triggers alarms at given pressures and time limits, and
deflates the cuff.
Bandpass Filter
Extracts arterial pressure oscillations from the cuff
pressure.
Deflation System
Automatically deflates the cuff at steps of a given
magnitude.
Figure 1-13 shows the NBP module’s logical structure.
CUFF
PRE AMP
PRESSURE
SENSOR
DEFLATION
SYSTEM
PRE AMP
PRESSURE
SENSOR
PRESSURE
PUMP
BANDPASS
MUX
D
A
CONTROLLER
SYSTEM
(INTERFACE)
RACK
INTERFACE
RACK
NBP Modules
Figure 1-13 M1008A/B NBP Module Block Diagram
Basic Plug-In Modules
1-35
NBP Modules
Theory of Operation
As NBP signals pass from the patient to the monitor, they progress through stages
corresponding to logical sections of the module, as shown in the block diagram.
Module-related faults can generally be isolated to one of the stages.
1 Signals from the patient are received by the pressure sensor through the cuff,
which is connected to the module by a single tube. The cuff is inflated, deflated,
and monitored by a pump, deflation system, and safety system controlled by a
microprocessor.
Cuff inflation: During the initial cuff inflation, the cuff is inflated by the pressure
pump to a set pressure which is determined by the mode. Thereafter the cuff is
inflated by the pressure pump to a cuff pressure above the patient’s systolic pressure.
Depending on the measurement method used, inflation occurs once or repeatedly.
When the cuff pressure is greater than the systolic pressure, the artery is occluded; the
pressure sensor then detects only the cuff pressure.
Cuff Deflation: Cuff pressure is automatically released by the deflation system in
steps of approximately 8 mmHg until the artery is only partially occluded. At that
point, measurement and processing of arterial pressure oscillations begin and
continue as the cuff pressure is progressively released.
2 Detection: As arterial pressure oscillations are detected, they are superimposed on
the cuff pressure within the module’s circuitry. After being extracted by the
bandpass filter, they are passed to the microcontroller and measured.
3 Measurement: As the cuff is deflated, the magnitude of the oscillations as a
function of cuff pressure increases until the mean arterial pressure is reached.
When cuff pressure falls below the mean arterial pressure, oscillation magnitude
begins to decrease.
The systolic and diastolic blood pressure values are deduced from the oscillometric
signal by extrapolation, resulting in empirical values. Extrapolation uses the
attenuation rate of the signal on both sides of the maximum readings. Invasive
pressure measurement are also used as a reference to correlate non-invasive pressure.
NBP Module
Features
1-36
Basic Plug-In Modules
Figure 1-14 shows the user controls and connector for the modules. The parts are
described following the figure.
NBP Modules
(8)
(7)
(2)
(4)
(5)
(1)
(6)
(3)
((9)
Figure 1-14 NBP Module Controls and Connectors
User Controls
1 NBP Setup Key: A single-press key used to enter the NBP setup screen.
2 NBP Setup Indicator: A green LED, lit when the NBP setup screen is activated.
3 Start Key: A single-press key, used to start the measurement cycle.
4 Start Indicator: a green LED, lit when the measurement cycle is entered.
5 Stop Key: a single-press key, used to stop the measurement cycle.
6 Stat Key: A single-press key, used to start a static measurement cycle.
7 Stat Indicator: A green LED, lit when the static measurement cycle is entered.
8 Venous Puncture Symbol: indicates that the module supports the Venous
Puncture function.
Connectors
9 A standard NBP connector connects to the cuff.
NPB Modes
The M1008A Module offers adult and pediatric modes. The M1008B Module offers
adult, pediatric, and neonatal modes.
Basic Plug-In Modules
1-37
NBP Modules
Table 1-6 shows the cuff inflation limits for each mode.
Table 1-6 Cuff Inflation Limits, in mmHg
Mode
First Inflation
Subsequent Inflations,
Above Systolic Pressure
Adult
165
25
Pediatric
125
20
Neonatal
100
15
Table 1-7 shows the measurement ranges for each mode.
Table 1-7 Measurement Ranges, in mmHg
Safety
Mode
Systolic
Diastolic
Mean
Adult
30 - 270
10 - 245
20 - 255
Pediatric
30 - 180
10 - 150
20 - 160
Neonatal
30 - 130
10 - 150
20 - 160
Table 1-8 gives the maximum limits that ensure patient safety.
Table 1-8 Maximum Safety Limits
1-38
Basic Plug-In Modules
Mode
Maximum
Measurement
Time
Adult
Maximum
Time/Pressure
Over-pressure
Maximum
100 seconds
120 seconds for
pressure > 10 mmHg
330 mmHg for > 2
seconds
Pediatric
100 seconds
120 seconds for
pressure > 10 mmHg
220 mmHg for > 2
seconds
Neonatal
60 seconds
60 seconds for
pressure > 5 mmHg
165 mmHg for > 2
seconds
NBP Modules
NBP Module
Exercises
1. The NBP Modules provide numerics for which measurements:
a. systolic, diastolic, and mean arterial pressures
b. pulse rate
c. heart and respiration rates
d. a and b
e. a, b, and c
2. The M1008B Module provides the same functions as the M1008A Module, with
the addition of a mode for:
a. Adults
b. Pediatrics
c. Neonates
d. Pediatrics and Neonates
3. In which mode are measurements taken repeatedly over a period of five minutes?
a. Manual mode
b. Auto mode
c. Stat mode
4. What is the function of the bandpass filter?
a. It filters artifact from the mean arterial pressure.
b. It extracts the arterial pressure oscillations from the cuff pressure.
c. It protects the circuitry from high-frequency interference.
5. The systolic and diastolic blood pressure values are deduced from the oscillometric
signal by ____________________,resulting in empirical values.
Answers
1. a
2. c
3. c
4. b
5. extrapolation
Basic Plug-In Modules
1-39
C.O. Measurement
Cardiac Output (C.O.) Module Concepts
C.O. Measurement
Description
Cardiac output is an important measure of cardiac performance. It measures the
volume of blood pumped into the circulatory system by the heart over a specified
period of time. Cardiac output is closely related to blood pressure.
Several methods can be used for determining cardiac output. The method used by
Philips’ patient monitoring systems is the thermodilution method. With
thermodilution, cardiac output is measured as the liters of blood pumped per minute
into the pulmonary artery by the right ventricle of the heart.
Concepts
Cardiac output is determined by heart rate and stroke volume, as defined below.
•
Heart rate - The number of times the heart beats in one minute.
•
Stroke volume - The amount of blood pumped per beat.
•
Cardiac index - A measure of an individual’s cardiac output adequacy, calculated
by dividing the cardiac output by the body surface area.
Measurement
Principle
The thermodilution method is based on the principle that the flow rate of an unknown
quantity of liquid can be determined by adding a known quantity of indicator and
measuring its concentration downstream. Thermodilution involves injecting a cooled
solution at a known temperature into the heart. The injectate solution mixes with and
cools the warmer surrounding blood. When the blood leaves the heart, its temperature
as a function of time indicates the rate of blood flow.
Measurement
Acquisition
The measurement is taken with a pulmonary artery (PA) Swan Ganz catheter.
The catheter is inserted into the heart, with the proximal lumen opening positioned in
the right atrium for introducing the injectate, and the thermistor, used for monitoring
temperature, positioned in the pulmonary artery. Positioning of the catheter is gauged
by using pressure measurements and X-rays of the catheter location. A small amount
of thermal indicator is introduced into the right atrium. The indicator mixes with the
blood in the right ventricle and approaches a temperature equilibrium. When the
diluted blood reaches the pulmonary artery, the thermistor measures the decrease in
blood temperature over time.
The temperature of the injectate solution can be measured either indirectly or directly.
Indirectly, the temperature of the cooling bath is measured. Direct measurement uses
a flow-through temperature probe to measure the injectate temperature as it is being
1-40
Basic Plug-In Modules
C.O. Measurement
introduced into the catheter. The probe is positioned where the syringe injects the
indicator into the proximal lumen port.
Basic Plug-In Modules
1-41
C.O. Measurement
Output
The time/temperature curve resulting from the measurement resembles a bell-shaped
curve, except that it has an exponential decay. The data are integrated to calculate the
area beneath the curve. By convention, the y-axis of the graph shows decreasing
temperature.
THERMODILUTION
CURVE
P.A.
BLOOD
36.0 C
36.5 C
INJECTION
TEMP
37.0 C
TIME
EXPONENTIAL
DECAY
Criteria for Proper
Measurement
Plug-In Modules
Factors affecting accurate measurement of cardiac output include:
•
Physiological conditions. Variations in cardiac rate and rhythm, cardiac
abnormalities, or patient anxiety or movement can cause errors in measurement.
•
Catheter conditions. A damaged or incorrectly positioned catheter, or a
prematurely inflated balloon will cause measurement errors.
•
Injectate factors. Inaccurate timing, volume, or temperature of injectate, as well as
use of the wrong catheter port will result in errors.
The M1012A C.O. Module provides the thermodilution cardiac output measurement.
References
Woods, Susan and Susan Osguthorpe. Cardiac Output Determination, in AACN
Clinical Issues in Critical Care Nursing. [For bibliography: Susan Osguthorpe, ed.
Philadelphia, JB Lippincott, 1993.]
1-42
Basic Plug-In Modules
C.O. Measurement
C.O. Measurement
Exercises
1. The time it takes for cooled blood to change temperature in the thermodilution
method is used to derive which of the following measurements?
a. Mean arterial blood pressure
b. Core body temperature
c. Rate of blood flow
d. Blood gas exchange
2. Which term refers to the amount of blood pumped per heartbeat?
a. Cardiac index
b. Cardiac output
c. Heart rate
d. Stroke volume
3. Using thermodilution, at what location does the cold injectate solution leave the
catheter and enter the heart?
a. Right atrium
b. Right ventricle
c. Pulmonary artery
d. Left atrium
4. The graph of the cardiac output measurement resembles:
a. A RESP waveform
b. A bell-shaped curve
c. Blood pressure oscillations
d. An inverted QRS wave
Answers
1. c
2. d
3. a
4. b
Basic Plug-In Modules
1-43
C.O. Module
C.O. Module
Description
The M1012 C.O. Module is a cardiac output measurement parameter unit. It is
designed to be used with adult patients in an ICU or OR environment. It uses the
thermodilution method to generate the measurement.
Measurements
The C.O. Module produces a thermodilution curve, together with numerics for the
cardiac output, cardiac index, blood temperature, and injectate temperature values.
Components
The following components carry out the major signal processing functions within the
module.
Table 1-9 Major C.O. Module Components
Block Diagram
1-44
Basic Plug-In Modules
Component
Function
Reference Switching Matrix
Calibrates the measurement using reference resistors.
Differential Amplifier
Amplifies the signals from the reference switching matrix.
Dual-Slope, Analog-to-Digital
Converter
Digitizes the analog signals from both the blood and injectate
channels.
Figure 1-15 shows the block diagram of the C.O. Module M1012A.
INJECT
BLOOD
DIFFERENTIAL
AMPLIFIER
LOW
PASS
FILTER
CURRENT
SOURCE
REFERENCE
SWITCHING
MATRIX
DIFFERENTIAL
AMPLIFIER
LOW
PASS
FILTER
REFERENCE CONTROL
REFERENCE
SWITCHING
MATRIX
CURRENT
SOURCE
GAIN CONTROL
VARIABLE
GAIN
AMPLIFIER
MUX
A/D
CONVERTER
D/A
CONVERTER
CONTROLLER
SYSTEM
PATIENT
ISOLATION
RACK
INTERFACE
RACK
C.O. Module
Basic Plug-In Modules
1-45
C.O. Module
Figure 1-15 M1012A C.O. Module Block Diagram
Theory of Operation
The module has two separate circuits for measuring blood and injectate temperatures.
The signals progress through the module as follows:
1 Blood Channel: The temperature sensor distal, Tblood, in the catheter is
connected to a reference switching matrix that continuously compares the input to
reference resistors for continuous calibration of the measurement. The
sequentially produced voltages across the reference and sensor resistors are
amplified before being input to a low-pass filter. The filtered signals are then
passed through the multiplexer to the analog-to-digital converter.
2 Injectate Channel: The temperature sensor, Tinjectate, which is either a flowthrough or bath probe, is connected to a separate reference-switching matrix on its
own circuit. The matrix compares the signals to the same reference resistors used
for the blood circuit. The output is amplified, filtered, and then multiplexed with
the blood temperature signal before the signals are digitized for the
microcontroller.
3 The cardiac output measurement is obtained by first compensating for the blood
temperature by the digital-to-analog converter. The difference signal is then
amplified by a variable amplifier with a high gain, which increases the sensitivity
for measuring the thermodilution curve.
The continuous calibration, linearization, control, and conversion to degrees C is
performed by the software.
1-46
Basic Plug-In Modules
C.O. Module
C.O. Module
Features
Figure 1-16 shows the user controls and connector for the C.O. Module. The parts are
described following the figure.
C.O.
M1012A
T
(2)
C.O.
START
(1)
(3)
12
PIN
(4)
Figure 1-16 Cardiac Output Module Controls and Connectors
User Controls
1 C.O. Setup Key -- A single-press key used to enter the cardiac output setup
screen.
2 C.O. Setup Indicator -- A green LED, lit when the cardiac output setup screen is
activated.
3 Start Key -- A single-press key, used to enter the measurement cycle.
Connectors
Safety
4 This is a standard 12-pin connector for use with a catheter, thermistor, and start/
stop switch.
To ensure the safety of the patient, the patient-applied part is isolated from ground by
opto-couplers and a transformer. The module is also encapsulated in plastic.
Basic Plug-In Modules
1-47
C.O. Module
C.O. Module
Exercises
1. The M1012A C.O. Module can be used with which patients?
a. adults
b. adults and pediatrics
c. adults, pediatrics, and neonates
2. Which component of the C.O. Module calibrates the measurement using reference
resistors?
a. Differential amplifier
b. Reference switching matrix
c. Dual-slope analog-to-digital converter
d. Digital-to-analog converter
3. Which component converts the measurement to degrees C?
a. Reference Switching Matrix
b. Dual-Slope Analog-to-Digital Converter
c. Digital-to-analog converter
d. Application software
Answers
1. a
2. b
3. d
1-48
Basic Plug-In Modules
C.O. #C10 (CCO) Measurement (CMS only)
Cardiac Output #C10 (CCO) Module Concepts (CMS only)
This chapter describes the Transpulmonary Thermodilution method of measuring the Cardiac Output.
For information regarding the Right Heart method, please refer to chapter “Cardiac Output (C.O.) Module Concepts”
on page 1-40.
C.O. #C10 (CCO) Measurement (CMS only)
Description
The transpulmonary thermodilution method requires the M1012A #C10 Cardiac
Output Module. Option C10 is Philips’ implementation of Pulsion Medical Systems
PiCCOTM method, which offers the following features:
•
Measurement of Cardiac Output (C.O.), Intrathoracic Blood Volume (ITBV) and
Extravascular Lung Water (EVLW)1 using transpulmonary thermodilution.
•
Measurement of Continuous Cardiac Output (CCO), Stroke Volume (SV),
Systemic Vascular Resistance (SVR) and Stroke Volume Variation (SVV) by
means of Pulse Contour analysis of the arterial blood pressure waveform.
Concepts
The PiCCOTM method is a combination of the transpulmonary thermodilution
technique and blood pressure waveform analysis to measure Cardiac Output (C.O.),
Intrathoracic Blood Volume (ITBV) and Extravascular Lung Water (EVLW)1.
Measurement
Principle
The thermodilution method is based on the principle that the flow rate of an unknown
quantity of liquid can be determined by adding a known quantity of indicator and
measuring its concentration downstream. Thermodilution involves injecting a cooled
solution at a known temperature into the heart. The injectate solution mixes with and
cools the warmer surrounding blood. When the blood leaves the heart, its temperature
as a function of time indicates the rate of blood flow.
The thermodilution measurement is also used for the calibration of the Continuous
Cardiac Output (CCO), derived by pulse contour analysis from the arterial blood
pressure wave.
Measurement
Acquisition
The measurement of transpulmonary thermodilution cardiac output and blood
pressure requires a central venous line and an arterial thermal dilution catheter placed
downstream from the heart, in or near the aorta, e.g. the femoral or the axillary artery.
The injectate is injected through the central venous line. The temperature of the
injectate solution is measured by a flow-through temperature probe as it is being
introduced into the central venous line. The injectate mixes with the blood in the right
ventricle and approaches a temperature equilibrium. When the diluted blood reaches
1. EVLW is not available in U.S.A.
Basic Plug-In Modules
1-49
C.O. #C10 (CCO) Measurement (CMS only)
the artery with the arterial catheter, the thermistor measures the decrease in blood
temperature over time.
The blood pressure wave acquisition is achieved with the M1006A/B Invasive
Pressure module. For details regarding this module please refer to “Invasive Blood
Pressure Module Concepts” on page 2-3.
C.O. Module
M1012A #C10
Pressure Module
M1006B
Sterile Injectate
Solution
C.O. Interface
Cable
M1643A
Injectate Syringe
Temperature
Probe
Central Venous
Line
3-Way
Stopcock
Pulsion
Pressure
Transducer
Cooling Container
Pulsion
Arterial Catheter
Figure 1-17 Setup for Transpulmonary Thermodilution and Continuous Cardiac
Output
1-50
Basic Plug-In Modules
C.O. #C10 (CCO) Measurement (CMS only)
Injectate
Temperature and
Volume
Based on the injectate temperature and the patient’s cardiac output the necessary
injectate volume differs.The following graphic is a guideline on which injectate
volume should be used.
C.O.
[l/min]
25.0
Tblood = 37oC
15.0
Tinj < 7oC
12.5
7.50
Tinj < 25oC
2.50
1.50
1.25
0.75
0.25
2
10
20
Injectate
Volume
[ml]
The dilution of injectate is also influenced by the extravascular tissue. The
Extravascular Thermovolume Index (ETVI) is a quality indicator which quantifies
this influence. ETVI is calculated based on the patient’s body weight and only applies
to the current single transpulmonary thermodilution measurement. For patients with
high ETVI values, the accuracy of the transpulmonary thermodilution measurement
may be reduced. It is recommended to use a higher injectate volume and/or colder
injectate in these patients based on the following table.
Cold Injectate
Patient Weight
ETVI < 10
Room Temp. Injectate
ETVI ≥ 10
ETVI < 10
< 3 kg
2 ml
2 ml
3 ml
< 10 kg
2 ml
3 ml
3 ml
< 25 kg
3 ml
5 ml
5 ml
< 50 kg
5 ml
10 ml
10 ml
< 100 kg
10 ml
15 ml
15 ml
≥ 100 kg
15 ml
20 ml
20 ml
ETVI ≥ 10
Use cold injectate
Basic Plug-In Modules
1-51
C.O. #C10 (CCO) Module (CMS only)
C.O. #C10 (CCO) Module (CMS only)
This section describes the Transpulmonary Thermodilution method of measuring the Cardiac Output.
For information regarding the Right Heart method, please refer to chapter “Cardiac Output (C.O.) Module Concepts”
on page 1-40.
Description
The M1012 #C10 C.O. Module is a cardiac output measurement parameter unit. It is
designed to be used with adult, pediatric or neonatal patients down to 2kg of weight in
the range of hospital environments. It uses the transpulmonary thermodilution method
and the pulse contour analysis to generate the measurement.
Measurements
The C.O. #C10 Module produces a thermodilution curve, together with numerical
values for the transpulmonary thermodilution Cardiac Output (C.O.), IntraThoracic
Blood Volume (ITBV) and ExtraVascular Lung Water (EVLW)1. The thermodilution
measurement is also used for the calibration of the Continuous Cardiac Output
(CCO), derived by pulse contour analysis from the arterial blood pressure wave.
Components
The following components carry out the major signal processing functions within the
module.
Table 1-10 Major C.O. #C10 Module Components
Block Diagram
Component
Function
Reference Switching Matrix
Calibrates the measurement using reference resistors.
Differential Amplifier
Amplifies the signals from the reference switching matrix.
Dual-Slope, Analog-to-Digital
Converter
Digitizes the analog signals from both the blood and injectate
channels.
Figure 1-18 shows the block diagram of the C.O. Module M1012A #C10.
1. EVLW is not available in U.S.A.
1-52
Basic Plug-In Modules
INJECT
BLOOD
DIFFERENTIAL
AMPLIFIER
LOW
PASS
FILTER
CURRENT
SOURCE
REFERENCE
SWITCHING
MATRIX
DIFFERENTIAL
AMPLIFIER
LOW
PASS
FILTER
REFERENCE CONTROL
REFERENCE
SWITCHING
MATRIX
CURRENT
SOURCE
GAIN CONTROL
VARIABLE
GAIN
AMPLIFIER
MUX
A/D
CONVERTER
D/A
CONVERTER
CONTROLLER
SYSTEM
PATIENT
ISOLATION
RACK
INTERFACE
RACK
C.O. #C10 (CCO) Module (CMS only)
Figure 1-18 M1012A C.O. #C10 Module Block Diagram
Basic Plug-In Modules
1-53
C.O. #C10 (CCO) Module (CMS only)
Theory of Operation
The module has two separate circuits for measuring blood and injectate temperatures.
The signals progress through the module as follows:
1 Blood Channel: The temperature sensor distal, Tblood, in the catheter is
connected to a reference switching matrix that continuously compares the input to
reference resistors for continuous calibration of the measurement. The
sequentially produced voltages across the reference and sensor resistors are
amplified before being input to a low-pass filter. The filtered signals are then
passed through the multiplexer to the analog-to-digital converter.
2 Injectate Channel: The temperature sensor, Tinjectate, which is a flow-through
probe, is connected to a separate reference-switching matrix on its own circuit.
The matrix compares the signals to the same reference resistors used for the blood
circuit. The output is amplified, filtered, and then multiplexed with the blood
temperature signal before the signals are digitized for the microcontroller.
3 The cardiac output measurement is obtained by first compensating for the blood
temperature by the digital-to-analog converter. The difference signal is then
amplified by a variable amplifier with a high gain, which increases the sensitivity
for measuring the thermodilution curve.
The continuous calibration, linearization, control, and conversion to degrees C is
performed by the software.
1-54
Basic Plug-In Modules
C.O. #C10 (CCO) Module (CMS only)
C.O. #C10 (CCO)
Module Features
Figure 1-19 shows the user controls and connector for the C.O. #C10 Module. The
parts are described following the figure.
C.O. M1012A
#C10
T
(2)
C.O.
START
(1)
(3)
80x40
12
PIN
(4)
Figure 1-19 C.O. #C10 Module Controls and Connectors
User Controls
1 C.O. Setup Key -- A single-press key used to enter the cardiac output setup
screen.
2 C.O. Setup Indicator -- A green LED, lit when the cardiac output setup screen is
activated.
3 Start Key -- A single-press key, used to enter the measurement cycle.
Connectors
Safety
4 This is a standard 12-pin connector for use with a catheter, thermistor, and start/
stop switch.
To ensure the safety of the patient, the patient-applied part is isolated from ground by
opto-couplers and a transformer. The module is also encapsulated in plastic.
Basic Plug-In Modules
1-55
SpO2 Measurement
Arterial Oxygen Saturation/Plethysmography (SpO2/Pleth) Module
Concepts
SpO2 Measurement
Description
SpO2 is a measure of arterial oxygen saturation obtained using the pulse oximetry
method. Pulse oximetry is a continuous, non-invasive method of measuring the
oxygen content of the arterial hemoglobin. It measures the amount of light
transmitted from a light source through a patient’s tissue to the receiving sensor.
Concepts
The following concepts are important to the measurement of arterial oxygen
saturation:
SaO2 - Arterial oxygen saturation, or the percentage of oxygen carried by the red
blood cells within the arteries. Approximately 97 per cent of the oxygen is normally
carried on the red blood cells; the rest is dissolved in the plasma. A decrease in
hemoglobin will decrease the amount of oxygen available to the tissues.
SpO2 - The arterial oxygen saturation measurement obtained from pulsations in the
arterioles using pulse oximetry.
Hemoglobin - The protein in red blood cells that transports oxygen (O2) and carbon
dioxide (CO2) molecules to and from the body’s tissues. A hemoglobin molecule
(Hb) attaches to oxygen molecules in the pulmonary alveoli and releases them to
other systemic tissue cells. When carrying oxygen, it forms oxyhemoglobin (HbO2).
Oxygen saturation can be measured by calculating the percentage of HbO2 to Hb.
Ventilation - The volume of air that reaches the pulmonary alveoli through breathing.
Ventilation refers to the process in which air enters the alveoli, enabling the
capillaries to receive oxygen and release carbon dioxide.
Perfusion - Passage of blood through a vascular bed. Perfusion facilitates gas
exchange in the capillary beds of the lung and the tissue. In well perfused organs,
blood flows evenly through the capillaries, ensuring a steady supply of available
oxygen. Perfusion also enables the body to release carbon dioxide.
Photo plethysmography - A method of measuring oxygen saturation in relation to
blood volume using the principle of light absorption. Also called absorption
plethysmography.
Pulse oximetry - A method of measuring arterial oxygen saturation using two
wavelengths of light and the pulsatile activity of the blood.
1-56
Basic Plug-In Modules
SpO2 Measurement
Measurement
Principle
Pulse oximetry is based on the principle that red blood cells absorb different amounts
of light depending on the amount of oxygen they contain. When light is transmitted
through body tissue such as a finger, it is absorbed differently by skin pigments,
tissue, cartilage, bone, arterial blood, and venous blood. Most of these substances
absorb light at a constant rate. The blood in the arteries and arterioles, however, is
pulsatile. As the blood vessels expand and contract, the length of the light path is
altered, affecting its absorption. Because the only significant variable is due to
pulsing blood, the ratio of HbO2 to Hb can be measured in the pulsatile part of the
signal to reveal the oxygen saturation of the arterial flow. The measurement is derived
using two wavelengths of light -- one in the red region and one in the infrared -- to
measure maximum and minimum absorption differences between the two molecules.
Measurement
Acquisition
The SpO2 measurement is taken by means of an optical cuff that is placed on the
patient’s fingertip. From the transmitting side of the transducer, red and infrared light
is scattered through the capillary bed and detected by a photo-diode on the receiving
side. The measurement is independent of skin permantation, tissue absorbtion, and
other constants.
Output
The resulting measurement is plotted as a plethysmogram. The waveform is
proportional to the blood volume changes, the pulse rate, and the relative perfusion of
the skin and transducer.
Criteria for Proper
Measurement
A number of factors can affect the accuracy of the measurement or the ability to
obtain it.
•
Incorrect positioning may cause incorrect measurement. The light emitter and the
photodetector are directly opposite each other and all the light from the emitter
passes through the patient’s tissues when it is positioned correctly. Pushing the
transducer on too far or not far enough, may result in inaccurately low or high
SpO2 readings, respectively.
•
The measurement requires pulsatile activity. When pulses drop below a certain
threshold, no measurement can be taken. This situation might arise from
conditions such as shock, hypothermia, vasoactive drugs, inflated blood pressure
cuffs, or any condition in which tissue perfusion is impaired.
Conversely, situations may exist in which venous blood is pulsatile, such as from
venous obstructions or certain cardiac conditions. In such cases, the measurement
will be erroneously low due to the inclusion of the venous blood in the pulsatile
signal.
•
Optical interference can cause inaccurate measurements. Pulse oximetry assumes
that only two light absorbers will be measured: HbO2 and Hb. However, other
elements may be present in the blood with similar absorption properties, thus
causing falsely low readings. Examples of these are carboxyhemoglobin (HbCO),
methemoglobin (MetHb), and several dyes used in clinical tests.
Interference from ambient lights can be prevented by covering the finger cuff with
an opaque material.
•
Any factor that affects the transmission of light through the tissue, such as nail
polish, can affect the measurement.
Basic Plug-In Modules
1-57
SpO2 Measurement
•
Plug-In Modules
Motion artifact may interfere with the accuracy of the measurement, as it has the
same frequency range as pulse activity.
The M1020A SpO2/PLETH Module provides the arterial oxygen saturation
measurement. References
Ahrens, Tom. Respiratory Monitoring in Critical Care, in AACN Clinical Issues in
Critical Care Nursing. [For bibliography: Susan Osguthorpe, ed. Philadelphia, JB
Lippincott, 1993.]
1-58
Basic Plug-In Modules
SpO2 Measurement
SpO2 Measurement
Exercises
1. Which measurement method is based on principles of light-absorbing properties of
blood?
a. Plethysmography
b. Pulse Oximetry
c. Thermodilution
2. What factor determines the difference in definition between SaO2 and SpO2?
a. The site where the measurement is taken.
b. The method used to take the measurement.
c. The clinical application for which the measurement is needed.
3. The molecule in the blood that transports oxygen to the cells of the body is:
a. Hb
b. HbCO
c. HbO2
d. MetHb
4. Which term refers to the process of gas exchange in the cells by means of capillary
blood flow?
a. Perfusion
b. Transmutation
c. Ventilation
5. Which condition does pulse oximetry require in order to measure SpO2?
a. Adequate ambient light
b. The absence of CO2 in the blood
c. Pulsatile blood activity
d. An unconscious patient
Answers
1. b
2. b
3. c
4. a
5. c
Basic Plug-In Modules
1-59
SpO2/PLETH Module
SpO2/PLETH Module
Description
The M1020A SpO2/PLETH Module is a pulse, arterial oxygen saturation, and
plethysmogram measurement parameter unit.
Measurements
The module produces numerics for the arterial oxygen saturation value and the pulse
rate, along with a real-time waveform for the plethysmogram. The module also
provides a perfusion indicator value for the pulsatile arterial blood flow.
Components
The following components carry out the major signal processing functions within the
module.
Table 1-11 Major SpO2/PLETH Module Components
Block Diagram
1-60
Basic Plug-In Modules
Component
Function
Input Protection Network
Protects the module against defibrillator spikes.
Current-to-Voltage Converter
Converts the current from the photodiode, and removes ESU
interference.
Ambient Light Rejection
Circuitry
Subtracts ambient light from the signal
Over-range Detector
Detects overload voltages caused by strong ambient light and
high LED currents.
Dark Light Subtracter
Subtracts the dark voltage from the red and infrared voltage.
Analog-to-Digital Converter
Converts the signal for processing;
Figure 1-20 shows the block diagram of the SpO2/PLETH Module M1020A.
INPUT CONNECTOR
CHOPPED
CURRENT
SOURCE
AMBIENT
LIGHT
REJECTION
SENSOR DETECTION
CURRENT
VOLTAGE
CONVERTER
TEST SIGNAL
PROTECTION
NETWORK
MUX
GAIN
VARIABLE
GAIN
AMP
D/A
CONVERTER
A/D
CONVERTER
LOW
PASS
FILTER
CONTROL
CIRCUIT
PATIENT
ISOLATION
DARK
LIGHT
SUBTRACT.
CONTROL
CIRCUIT
OVER
RANGE
DETECTOR
PROCESSOR
SYSTEM
GAIN
SHIFT
AMP
DISPLAY
LOW
PASS
FILTER
SpO2/PLETH Module
Basic Plug-In Modules
1-61
SpO2/PLETH Module
Figure 1-20 M1020A SpO2/PLETH Module Block Diagram
Theory of Operation
The signals progress through the module as follows:
Light Transmission: Two LEDs in the transducer generate red and infrared light that
is transmitted through a well-perfused capillary bed in the patient’s finger or toe.
The LEDs are controlled by the software and are supplied with a chopped current of
375 Hz. Sensor-detection circuitry detects both the presence and type of transducer
connected. To optimize the amplitude in the pulse sequence, the chopped current
source is independently controlled by the digital-to-analog converter. A test signal
can be generated in the input stage by switching the sensor signals off.
A photodiode directly opposite the LEDs detects the amount of light passing through
the tissue, and generates a current that represents the intensity of the light detected for
each wavelength. The current consists of a DC part, representing ambient light,
modulated with a small AC signal from the pulsatile blood flow. The current passes
through the input protection network and is converted to voltage.
Over-range Detection: The over-range detector checks the input voltage for
overload due to an excessively high current from ambient light. It also checks the
pulsatile signal for overload from the transducer light source.
Ambient Light Rejection: The ambient light is then subtracted by the high pass
filter. The signal amplitude is optimized in the variable amplifier and passed to a low
pass filter, where the dark signal, representing the ambient light current, is subtracted
from the red signal. The high pass and low pass filters act as a demodulator. The pulse
sequence representing red, infrared, and plethysmogram voltages is then amplified,
multiplexed, and digitized.
Signal Processing: From the digitized signal, the microprocessor derives the oxygen
saturation value and the plethysmogram waveform for display. It can also derive a
pulse value from the PLETH signal, if configured to do so.
1-62
Basic Plug-In Modules
SpO2/PLETH Module
SpO2/PLETH
Module Features
Figure 1-21 shows the user controls and connector for the module. The parts are
described following the figure.
SpO 2 / PLETH T
M1020A
(2)
(4)
SpO2
PLETH
(1)
(5)
(3)
12
PIN
Figure 1-21 SpO2/PLETH Module Controls and Connectors
User Controls
1 SpO2 Setup Key -- A single-press key used to enter the SpO2 setup screen.
2 SpO2 Setup Indicator -- A green LED, lit when the SpO2 setup screen is
activated.
3 PLETH Setup Key -- A single-press key used to enter the PLETH setup screen.
4 PLETH Setup Indicator -- A green LED, lit when the PLETH setup screen is
activated.
Connectors
Safety
This is a standard 12-pin connector for use with an SpO2/PLETH transducer.
To ensure the safety of the patient, the patient-applied part is isolated from ground by
opto-couplers and a transformer. The module is also encapsulated in plastic.
Basic Plug-In Modules
1-63
SpO2/PLETH Module
PLETH Waveform
The waveform can be configured for either of two settings: Perfusion or SpO2 SQI Mode.
These settings control the way the PLETH wave is adjusted for display on the screen.
The Perfusion Indicator, if configured, functions independently from the selected wave
presentation and gives additional information about arterial blood perfusion. It is a scaled
ratio between two different light-absorbing volumes: one that varies with time and one that
is constant. The perfusion indicator is directly related to the amount of blood perfusion at
the transducer site.
SpO2 SQI Mode is the factory default. It automatically and continuously adjusts the size of
the wave, which represents the quality of the SpO2 measurement signals. Manual wave
adjustments in this mode are not possible. If the signal quality becomes weak, the
waveform becomes progressively smaller, and the perfusion indicator reading typically
falls below 1. If the signal degrades below an acceptable level, the wave becomes flat and
an INOP alarm results. A poor signal may be caused by poor perfusion at the transducer
site, or by the transducer; it is not related to low oxygen saturation.
Figure 1-22 contains an example of a typical waveform in SpO2 SQI Mode.
Figure 1-22 Waveform in SpO2 SQI Mode
Perfusion Mode automatically adjusts the waveform but also allows manual adjustment by
the user. In this mode, the size of the waveform is not related to the quality of the SpO2
signal.
1-64
Basic Plug-In Modules
SpO2/PLETH Module
SpO2/PLETH
Module Exercises
1. Which component controls the current to the chopped current source?
a. Current-to-voltage converter
b. Digital-to-analog converter
c. Input protection network
d. Over-range detector
2. Which component removes ESU interference?
a. Current-to-voltage converter
b. Digital-to-analog converter
c. Input protection network
d. Low-pass filter
3. Which setting produces a waveform that indicates the quality of the SpO2 measurement
signal?
a. Perfusion mode
b. Pulse mode
c. SpO2 SQI mode
Answers
1. b
2. a
3. c
Basic Plug-In Modules
1-65
TEMP Measurement
Temperature (TEMP) Module Concepts
TEMP Measurement
Description
Temperature is the measurement of the amount of heat present in a region of the body.
Various regions and tissues within the body have widely divergent temperatures, and
many factors can influence temperature change. Body temperature can indicate
conditions such as infection, inflammation, and antigenic responses, as well as
effectiveness of treatment. Careful monitoring of body temperature is vital for
critically ill patients.
Concepts
Thermometry can include a broad range of temperature-sensing devices, such as
mercury thermometers, thermistors, thermocouples, and units that reflect infrared
light. Because heat increases the movement of molecules, thermometry uses scales
based on the thermodynamic properties of given substances.
Measurement
Principle
The temperature measurement used by Philips’ patient monitoring systems is based
on a thermistor whose resistance is inversely proportional to its temperature. By
measuring the thermistor’s resistance, its temperature can be calculated. The
resistance of the thermistor is measured by passing a current through it and measuring
the voltage developed across it.
The delta temperature measurement reflects two different temperature probe values
and calculates the difference in temperature between the two measurements. A
temperature delta from different sites can be diagnostic of an altered physiologic
state.
Measurement
Acquisition
Temperature can be measured by a variety of temperature probes designed for use
with different anatomic sites. The choice of site is determined by the type of
information needed by the clinician.
Output
Temperature measurements can be graphed over time or represented as numerics,
depending on the application.
Criteria for Proper
Measurement
A thermometer should provide a quick, accurate, and reliable measurement of
temperature. Factors affecting accurate measurement of temperature include:
1-66
Basic Plug-In Modules
•
Frequency and accuracy of calibration.
•
Appropriateness of the reference standard against which the thermometer is
calibrated.
•
Choice of anatomic site for taking the measurement.
TEMP Measurement
•
Environmental conditions.
•
Activity and movement of the patient.
Plug-In Modules
The M1029A TEMP Module provides the temperature measurement. I
References
Holtzclaw, Barbara, Monitoring Body Temperature, in AACN Clinical Issues in
Critical Care Nursing. [For bibliography: Susan Osguthorpe, ed. Philadelphia, JB
Lippincott, 1993.]
Basic Plug-In Modules
1-67
TEMP Measurement
TEMP Measurement
Exercises
1. Thermistors, thermocouplers, and infrared reflectors are an integral part of which
measurement technique?
a. Thermodilution
b. Thermometry
c. Pulse Oximetry
2. The resistance of the temperature thermistor is _______________ proportional to
its temperature.
3. How many temperature measurements are taken to calculate an individual’s
temperature difference?
a. one
b. two
c. three
4. Factors affecting accurate measurement of temperature include
______________________________ and ________________________________.
Answers
1. b
2. inversely
3. b
4. Any of the following:
Calibration
Reference standard
Anatomic site
Environmental conditions.
Patient’s Activity
1-68
Basic Plug-In Modules
TEMP Module
TEMP Module
Description
The M1029A TEMP Module is a temperature measurement parameter unit. It is
designed to be used with adult, pediatric, or neonatal patients in an ICU or OR
environment.
Measurements
The TEMP Module produces numerics in degrees Celsius for the temperature.
Different labels can be selected for temperature readings from different measurement
sites.
Components
The following components carry out the major signal processing functions within the
module.
Table 1-12 Major TEMP Module Components
Block Diagram
Component
Function
Reference Switching Matrix
Calibrates the measurement using reference resistors.
Differential Amplifier
Amplifies the signals from the reference switching matrix.
Dual-Slope, Analog-to-Digital
Converter
Digitizes the analog signals from the temperature and
thermistor calibration.
Figure 1-23 shows the block diagram of the TEMP Module M1029A.
Basic Plug-In Modules
1-69
1-70
Basic Plug-In Modules
REFERENCE
SWITCHING
AMPLIFIER
CURRENT
SOURCE
REFERENCE CONTROL
DIFFERENTIAL
AMPLIFIER
LOW PASS
FILTER
A/D
CONVERTER
CONTROLLER
SYSTEM
PATIENT
ISOLATION
RACK
INTERFACE
RACK
TEMP Module
Figure 1-23 TEMP Module Block Diagram
INPUT CONNECTOR
TEMP Module
Theory of Operation
The signals progress through the module as follows:
The thermistor in the temperature probe is connected to a reference switching matrix
that continuously compares the input to reference resistors for continuous calibration
of the measurement. The sequentially produced voltages across the reference and
probe resistors are amplified, filtered, and digitized. The continuous calibration,
linearization, control, and conversion to degrees C is performed by the software.
TEMP Module
Features
Figure 1-24 shows the user controls and connector for the TEMP Module. The parts
are described following the figure.
TEMP M1029A T
(2)
TEMP
(1)
2
PIN
(3)
Figure 1-24 TEMP Module Controls and Connectors
User Controls
1 TEMP Setup Key -- A single-press key used to enter the temperature output
setup screen.
2 TEMP Setup Indicator -- A green LED, lit when the temperature setup screen is
activated.
Connectors
3 This is a 2-pin connector for use with standard 217xx series temperature probes
(yellow spring series 400 characteristics) and 218xx series disposable temperature
probes (the 218xx series probes are not sold in Germany.)
Safety
To ensure the safety of the patient, the patient-applied part is isolated from ground by
opto-couplers and a transformer. The module is also encapsulated in plastic.
Basic Plug-In Modules
1-71
TEMP Module
TEMP Module
Exercises
1. The M1029 TEMP Module can be used with which patients?
a. adults
b. adults and pediatrics
c. adults, pediatrics, and neonates
2. To which component is the temperature probe connected?
a. Current source
b. Reference switching matrix
3. The module can be used with YSI Series _____ temperature probes.
a. 100
b. 200
c. 400
4. What isolates the patient from the module’s current?
a. Opto-couplers
b. Input Connector
c. Input Protection Network
Answers
1. c
2. b
3. c
4. a
1-72
Basic Plug-In Modules
Recorder Module (M1116A)
Recorder Module Concepts
Recorder Module (M1116A)
Description
The M1116A Recorder Module provides thermal array recording capability for the
Philips patient monitoring family, including the V24/V26. Like the M1116B Recorder
Module, it can write up to three overlapped waveforms and three lines of annotation.
The M1116A offers eight recording speeds; the M1116B offers ten speeds.
The following components carry out the major functions within the M1116A
Recorder Module.
Table 1-13 Major Recorder Module (M1116A) Components
Block Diagram
Component
Function
DC-to-DC Converter
Generates power for the digital circuitry and printing
mechanisms.
Motor Control Circuits
Control the operation of the paper drive motor.
I/O Microcontroller
Manages the I/O operations for the module.
Print Microcontroller
Regulates print speed and contrast.
Random Access Memory
Provides storage for data accessed by the microcontrollers.
Paper Drive Motor
Feeds the paper through the printer.
Thermal Printhead
Provides the printing mechanisms for the recorder.
Figure 1-25 shows the block diagram of the Recorder Module M1116A.
Basic Plug-In Modules
1-73
1-74
Basic Plug-In Modules
60 VDC
DC TO DC
+10 VDC
+10
MOTOR
CONTROL
CIRCUITS
+16 VDC
+5 VDC
SHARED
DATA
MEMORY
(RAM)
MOTOR
AND
PRINT
FORMAT
MICROCONTROLLER
+16
CONVERTER
+5
OPTO ISOLATORS
POWER SUPPLY BOARD
FE LINK
PROTOCOL
DATA
SIGNALS
DIGITAL BOARD
I/O
MICROCONTROLLER
FRONT PANEL
CONTROLS & LAMPS
RECORDER
MECHANISM
PAPER DRIVE
MOTOR
THERMAL
PRINTHEAD
Recorder Module (M1116A)
RACK
Recorder Module (M1116A)
Figure 1-25 M1116A Recorder Module Block Diagram
Theory of Operation
The functional components for the M1116A Recorder Module are contained on two
printed circuit boards and in a recorder mechanism unit. The circuit boards are
referred to as the power supply board and the digital board. The power supply board
runs parallel to the back of the module. It contains a DC-to-DC converter, optical
isolators, and motor control circuits for the paper drive motor. The digital board runs
along the length of the module from the front panel to the power supply board. It
contains two microcontrollers, a shared data RAM, and the front panel controls and
lamps.
Signal processing through the module proceeds as follows:
Power Supply Board: Power and data signals enter the module from the monitor
through the power supply board. The DC-to-DC converter converts the 60V DC from
the front-end rack into +5V DC for the digital circuits and +15V DC for the motor
drivers and printhead. Data signals from and to the rack are passed through infrared
optical isolators for noise suppression.
Digital Board: Signals enter the board through the I/O Microcontroller’s built-in
serial data port. The serial data link between the monitor and Recorder Module
operates asynchronously on two separate lines, providing full duplex communication
at a 500 KB baud rate. The I/O Microcontroller interprets messages from the monitor,
and sends back identification and status messages through the power supply board.
The I/O Microcontroller is responsible for:
•
receiving and responding to commands and data from the monitor
•
sensing and reporting on the state of the control keys and switches
•
converting waveforms and annotation into a format suitable for driving the
printhead
The user controls, door-open switch, and paper-out sensor are mounted directly on the
digital board near the front of the module. The paper-out sensor is an optical device
that aims an infrared beam at the paper as it passes around the paper drive roller.
When paper is present, the infrared light is strongly reflected back to a phototransistor
connected to the I/O Microcontroller.
The I/O Microcontroller translates waveform and annotation data into row and
column format, merges the data into a matrix that represents the dot pattern to be
printed, and writes the matrix to the dual-port RAM. The RAM is maintained as a
rotating buffer, so that memory locations can be reloaded as soon as a column of dots
is sent to the printhead.
The Motor and Print Format Microcontroller sends each column of dots to the thermal
printhead at 2 msec intervals through its built-in serial communications port and
directs reloading of the printhead’s shift register at a 3MHz clock rate. The Motor and
Print Format Microcontroller maintains uniform print contrast by monitoring the
printhead’s temperature and watt consumption, and modulating the strobe width that
is applied to the dots during printing. The Motor and Print Format Microcontroller
Basic Plug-In Modules
1-75
Recorder Module (M1116A)
also sends instructions to the motor control circuits on the power supply board to
regulate the paper drive motor speed.
Recorder Mechanism: This unit contains the thermal printhead and paper drive
motor. Both components receive signals generated by the Motor and Print Format
Microcontroller on the digital board.
The printhead assembly contains a column of 384 heater elements for printing the
dots, oriented perpendicular to the direction of paper travel. It also contains a 384stage-shift register, which serves as a data-holding buffer for one column of dots to be
printed. Each heater element has its own driver circuit. When a column of data is
received from the Motor and Print Format Microcontroller, the shift register is loaded;
the dots are printed as their respective heater elements are turned on. Print density is
controlled by the width of the strobe applied to each dot and by the temperature of the
printhead.
The signals to the paper drive motor are sent through the motor control circuits on the
power supply board. These circuits regulate the speed of the paper motion.
Altering Power Consumption: During frequency response tests, or when the
recorded waveform exhibits rapid vertical transitions, the Recorder Module may
decrease its power consumption by reducing the intensity of the thermal array head.
When this occurs, a lighter waveform segment may appear in brief intervals on the
recorder output strip. An example of such output is shown in Figure 1-26.
Reduced Intensity
1-76
Basic Plug-In Modules
Recorder Module (M1116A)
Figure 1-26 Example of Reduced Intensity Waveform Segments
Recorder Module
Features
Figure 1-27 shows the user controls for the module.
REC M1116A
(1)
RUN/
CONT
80x100
STOP
(2)
(3)
Figure 1-27 Recorder Module Controls and Connectors
User Controls
The M1116A and M1116B Recorder Modules have the same controls.
1 Continue Indicator: An LED that is lit steadily during continuous recordings. It
blinks twice when the module is first plugged in, indicating that the recorder selftest has been completed successfully.
2 Run/Continue Key: If the recorder is not running, it starts a time-delayed
recording. If the recorder is running, it makes the current recording continuous, if
possible.
3 Stop Key: Stops the current recording.
Recordings
The M1116A Recorder can produce several types of recordings:
•
delayed
•
real-time
•
monitoring procedure
Basic Plug-In Modules
1-77
Recorder Module (M1116A)
•
vital signs
•
alarm -- generated automatically when clinical criteria are violated.
Recordings are made on 50mm-wide recording strip paper.
Delayed recordings are recordings of waveforms whose measurement began before
the recording was initiated. For example, if a waveform is being displayed on the
monitor, a user can set the recording to start from an earlier time. Delayed recordings
run for a preset time. They can be initiated manually by the user, or automatically
when an alarm occurs.
Real-time recordings begin immediately at the time they are requested and are
stopped manually. They can also be preset to begin recording pre-selected waveforms
at a specific time. For pre-selected waveforms, three separate recording modes (A, B,
and C) can be configured. A preset recording begins printing when the preconfigured
recording key is pressed.
Monitoring procedure recordings can be made during cardiac output and pulmonary
artery wedge pressure measurements and during ST analysis. They are accomplished
with soft keys during the procedures.
Vital sign recordings can be initiated automatically by an NBP measurement, by an
internal timer in the monitor, or by a user. The NBP measurements can be taken by
the NBP plug-in module or by an NBP monitor connected through VueLink. Vital
sign recordings are made only at the bedside by the M1116A and M1116B Recorder
Modules; they are not re-routed to a central recorder if the bedside recorder is not
available.
Alarm recordings are a type of delayed recording. They include waveform
information from before the alarm was initiated, so clinicians can see the change in
the patient’s condition. When a patient goes into an alarm condition, an alarm
recording is generated automatically according to the monitor’s configuration.
Settings for alarm severity level, as well as for enabling or disabling alarm recordings,
are possible for each individual parameter.
1-78
Basic Plug-In Modules
Recorder Module (M1116A)
Recorder Module
Exercises (M1116A)
1. The M1116A Recorder Module can write ____ different waveforms at ____
speeds.
2. The two printed circuit boards in the module are referred to as the
___________________________ board and the ________________________ board.
3. Which component supplies the power for the digital circuits and recorder
mechanism?
a. DC-to-DC converter
b. front-end rack
c. motor control circuits
d. I/O Microcontroller
4. Which component converts the waveforms and annotation into dot matrix for
printing?
a. DC-to-DC converter
b. I/O Microcontroller
c. Motor and Print Format Microcontroller
d. motor control circuits
5. The recorder mechanism consists of the ___________________________ and
_______________________________ components.
6. Which type(s) of recording can be set to begin automatically?
a. delayed
b. delayed and vital sign
c. delayed, real-time, and vital sign
d. delayed, real-time, monitoring procedure, and vital sign
Answers
1. three, eight
2. power supply, digital
3. a
4. b
5. thermal printhead, paper drive motor
6. b
Basic Plug-In Modules
1-79
Recorder Module (M1116B)
Recorder Module (M1116B)
Description
The M1116B Recorder Module provides thermal array recording capability for the
Philips patient monitoring family, including the V24/V26. Like the M1116A
Recorder Module, it can write up to three overlapped waveforms and three lines of
annotation. The M1116B has several additional capabilities not offered by the
M1116A. It provides ten recording speeds, two more than the M1116A. It can also
provide oxygen-cardiorespirogram recordings.
The following components carry out the major functions within the M1116B
Recorder Module.
Table 1-14 Major Recorder Module (M1116B) Components
Block Diagram
1-80
Basic Plug-In Modules
Component
Function
DC-to-DC Converter
Generates power for the digital circuitry and printing
mechanisms.
Motor Control Circuits
Control the operation of the paper drive motor.
Microcontroller
Manages the I/O and print operations for the module.
Random Access Memory
Provides storage for data accessed by the microcontrollers.
Paper Drive Motor
Feeds the paper through the printer.
Thermal Printhead
Provides the printing mechanisms for the recorder.
Figure 1-28 shows the block diagram of the Recorder Module M1116B.
RACK
60 VDC
78 kHz
POWER SUPPLY BOARD
+15
DC TO DC
CONVERTER
+5
OPTO
ISOLATORS
DATA
SIGNALS
DIGITAL BOARD
MICROCONTROLLER
+5VDC
SHARED
DATA
MEMORY
(RAM)
MOTOR
CONTROL
CIRCUITS
FRONT PANEL
15VDC
RECORDER
MECHANISM
PAPAER DRIVE
MOTOR
+5VDC
THERMAL
PRINTHEAD
FRONT PANEL
CONTROLS &
LAMPS
Recorder Module (M1116B)
Figure 1-28 M1116B Recorder Module Block Diagram
Basic Plug-In Modules
1-81
Recorder Module (M1116B)
Theory of Operation
The M1116B Recorder Module contains a power supply circuit board, a digital circuit
board, and a recorder mechanism unit. The components for the M1116B Module are
slightly different from those of the M1116A. The power supply board contains a DCto-DC converter, optical isolators, and motor control circuits for the paper drive
motor. The digital board contains only one microcontroller and a single-port RAM.
The front panel controls and lamps are mounted directly on the board, as they are on
the M1116A.
Signal processing through the module proceeds as follows:
Power Supply Board: Power and data signals enter the module from the monitor
through the power supply board. The DC-to-DC converter converts the 60V DC from
the front-end rack into +5V DC for the digital board and +15V DC for the motor
drivers and printhead. Data signals from and to the rack are passed through infrared
optical isolators for noise suppression.
Digital Board: Signals enter the board through the single microcontroller’s built-in
serial data port. The serial data link between the monitor and Recorder Module
operates asynchronously on two separate lines, providing full duplex communication
at a 500 KB baud rate. The microcontroller interprets messages from the monitor and
sends back identification and status messages through the power supply board. The
microcontroller is responsible for:
•
receiving and responding to commands and data from the monitor
•
sensing and reporting on the state of the control keys and switches
•
converting waveforms and annotation into a format suitable for driving the
printhead
The user controls, door-open switch, and paper-out sensor are mounted directly on the
digital board near the front of the module. The paper-out sensor is an optical device
that aims a pulsed infrared beam at the paper as it passes around the paper drive roller.
When paper is present, the infrared light is strongly reflected back to a phototransistor
connected to the microcontroller. The M1116B Module has an infrared sensing circuit
to determine if the paper-loading door is open. If the door is closed, a tab on the door
interrupts the light beam. Software routines control the infrared beam for the optical
interrupt. The door-open sensor is absent from the M1116A.
The microcontroller translates waveform and annotation data into a row and column
format, merges the data into a matrix that represents the dot pattern to be printed, and
writes the matrix to the RAM. The RAM is maintained as a rotating buffer so that
memory locations can be reloaded as soon as a column of dots is sent to the printhead.
The microcontroller maintains uniform print contrast by monitoring the printhead’s
temperature and watt consumption, and modulating the strobe width that is applied to
the dots during printing. The microcontroller also sends signals to the motor control
circuits for regulating the paper drive motor speed.
Recorder Mechanism: This unit contains the thermal printhead and paper drive
motor. Both components receive signals generated by the microcontroller on the
digital board.
1-82
Basic Plug-In Modules
Recorder Module (M1116B)
The printhead assembly contains a column of 384 heater elements for printing the
dots, oriented perpendicular to the direction of paper travel. It also contains a 384stage-shift register, which serves as a data-holding buffer for one column of dots to be
printed. Each heater element has is own driver circuit. When a column of data is
received, the shift register is loaded; the dots are printed as their respective heater
elements are turned on. Print density is controlled by the width of the strobe applied
to each dot and by the temperature of the printhead.
The signals to the paper drive motor are sent through the motor control circuits on the
power supply board. These circuits regulate the speed of the paper motion.
Recorder Module
Features
Figure 1-29 shows the user controls for the M1116B Module.
REC M1116B
(1)
RUN/
CONT
80x100
STOP
(2)
(3)
Figure 1-29 Recorder (M1116B) Module Controls
User Controls
The M1116A and M1116B Recorder Modules have the same user controls.
1 Continue Indicator: An LED that is lit steadily during continuous recordings. It
blinks twice when the module is first plugged in, indicating that the recorder selftest has been completed successfully.
2 Run/Continue Key: If the recorder is not running, it starts a time-delayed
recording. If the recorder is running, it makes the current recording continuous, if
possible.
3 Stop Key: Stops the current recording.
Basic Plug-In Modules
1-83
Recorder Module (M1116B)
Recordings
The M1116B Recorder can produce the same recordings as the M1116A Module, plus
the additional type:
•
delayed
•
real-time
•
monitoring procedure
•
vital signs
•
alarm -- generated automatically when clinical criteria are violated
•
oxygen-cardiorespirogram (oxyCRG) -- oxyCRG recordings cannot be made by
the M1116A Module.
Recordings are made on 50mm-wide recording strip paper.
Delayed recordings are recordings of waveforms whose measurement began before
the recording was initiated. For example, if a waveform is being displayed on the
monitor, a user can set the recording to start from an earlier time. Delayed recordings
run for a preset time. They can be initiated manually by the user, or automatically
when an alarm occurs.
Real-time recordings begin immediately at the time they are requested and are
stopped manually. They can also be preset to begin recording pre-selected waveforms
at a specific time. For pre-selected waveforms, three separate recording modes can be
configured. A preset recording begins printing when the preconfigured recording key
is pressed.
Monitoring procedure recordings can be made during cardiac output and pulmonary
artery wedge pressure measurements, and during ST analysis. They are accomplished
with soft keys during the procedures.
Vital sign recordings can be initiated automatically by an NBP measurement, by an
internal timer in the monitor, or by a user. The NBP measurements can be taken by
the NBP plug-in module or by an NBP monitor connected through VueLink. Vital
sign recordings are made only at the bedside by the M1116A and M1116B Recorder
Modules; they are not re-routed to a central recorder if the bedside recorder is not
available.
Alarm recordings are a type of delayed recording. They include waveform
information from before the alarm was initiated, so clinicians can see the change in
the patient’s condition. When a patient goes into an alarm condition, an alarm
recording is generated automatically according to the monitor’s configuration.
Settings for alarm severity level, as well as for enabling or disabling alarm recordings,
are possible for each individual parameter.
OxyCRG recordings are delayed recordings that begin six minutes prior to the most
recent data on the screen. The time delay enables the clinician to have a printout of
events leading up to the current situation. Recordings can be requested manually or
configured as alarm recordings. In an alarm recording, six minutes of pre-alarm data
and two minutes of post-alarm data are produced. When a recording is stopped, the
most recent six minutes of patient data are not recorded. The oxyCRG is recorded in
1-84
Basic Plug-In Modules
Recorder Module (M1116B)
three distinct non-overlapping channels on the strip. Three speeds are possible for
recording the data.
Recorder Module
Exercises (M1116B)
1. The M1116B Recorder Module can write ____ different waveforms at ____ speeds.
2. The two printed circuit boards in the module are referred to as the
__________________________ board and the ________________________ board.
3. Which component supplies the power for the digital circuits and recorder
mechanism?
a. DC-to-DC converter
b. opto-isolators
c. motor control circuits
d. microcontroller
4. Which component converts the waveforms and annotation into a dot matrix for
printing?
a. DC-to-DC converter
b. microcontroller
c. thermal printhead
d. motor control circuits
5. The M1116B provides __________________ that is not available on the M1116A.
Answers
1. three, ten
2. power supply, digital
3. a
4. b
5. ten recording speeds (versus 8) or
oxygen-cardiorespirogram (OxyCRG) recordings
Basic Plug-In Modules
1-85
Data Transfer Module
Data Transfer Module Concepts
Data Transfer Module
Description
The M1235A Data Transfer Module provides data transfer capability for the CMS,
including the Anesthesia CMS, the Component Transport System, and V24/V26. It is
designed to transfer a patient’s vital signs and demographics between monitors in a
range of critical care environments. The module retains patient information for an
hour or longer when not plugged into a monitor.
Components
The following components carry out the major functions within the module.
Table 1-15 Major Components
Block Diagram
1-86
Basic Plug-In Modules
Component
Function
Power Supply
Generates power for the digital circuitry and LEDs.
Microcontroller
Manages the operation of the module.
Memory
Provides storage for data and instructions.
Back-Up Power Supply
Provides power for one hour or longer when the main power
supply is unavailable.
Real-Time Clock
Tracks the time the module is removed from a monitor during
data transfer.
Figure 1-30 shows the block diagram of the Data Transfer Module M1235A.
FRONT -END
LINK
(TO RACK)
5V
SERIAL DATA LINES
POWER
SUPPLY
5V
12V
REAL TIME
CLOCK
MICRO
CONTROLLER
37702
A/
D
L
U
I
A
N
R
E
T
S
BUTTONS
LED's
5V
BACK-UP
POWER
SOURCE
(SUPER
CAP)
256K
RAM
128K
ROM
Data Transfer Module
Basic Plug-In Modules
1-87
Data Transfer Module
Figure 1-30 Data Transfer Module Block Diagram
Theory of Operation
The module contains two circuit boards on one assembly; the boards are referred to as
the front panel board and the main board. The front panel board consists of the
indicator LEDs and control keys. The main board consists of the major functional
components, which are described in more detail below.
Power Supply: The power supply receives 60V, synchronized to 78KHz from the
front end link, and generates 5V and 12V unregulated. The 5V is regulated to provide
power for the digital circuitry; the 12V unregulated drives the LEDs. Circuit ground
throughout the Data Transfer Module is common for both power and digital circuitry.
Microcontroller: The 37702 microcontroller manages the operation of the Data
Transfer Module. It has a 16MB address range, multiple configured I/O ports, and
two UART ports that can be used in either asynchronous or synchronous mode. The
microprocessor is responsible for:
•
addressing the 256KB RAM and 128KB ROM in basic read and write cycles
•
communicating in asynchronous serial mode to the monitor through the front-end
link
•
driving the LEDs, and receiving key pushes from the front panel
•
accessing the serial RTC chip
Memory: The Data Transfer Module contains 256KB of RAM and 128KB of ROM.
The RAM is implemented using two banks of 128 x 8 low-standby-power SRAM,
which are specifically designed for low power consumption in battery back-up mode.
When power is disconnected, the RAM goes into battery back-up mode, and its power
supply is switched over to the back-up source. Program storage for the Data Transfer
Module consists of one 128KB OTP ROM.
Back-Up Power Supply: The digital circuitry uses a 0.1F super capacitor to provide
back-up power to the RAM and RTC. Back-up power is supplied whenever main
power is unavailable, such as when power fails, the monitor is turned off, or the
module is removed from the monitor for transfer. The back-up power supply charges
in less than 20 seconds and provides at least one hour of data retention and RTC
operation in back-up mode.
Real-Time Clock: The RTC keeps track of how long the module is disconnected
from a monitor for data transfer. The RTC is located in a semi-isolated area of the
main board to ensure low noise. The RTC oscillator timing pulse, which is configured
to 0.1Hz, is used as an interrupt to the microcontroller to measure the RTC for
accuracy. If the pulses fall outside of the tolerance limit, an error is flagged.
1-88
Basic Plug-In Modules
Data Transfer Module
Data Transfer
Module Features
Figure 1-31 shows the user controls and connector for the module. Two versions of
the front panel are available: universal and English. The parts are described following
the figure.
UNIVERSAL
ENGLISH
M1235A
DATA
TRANSFER
M1235A
(2)
(4)
(2)
(1)
(3)
(1)
(4)
MODULE
MONITOR
(3)
!
Figure 1-31 Data Transfer Module Controls
User Controls
1 Transfer to Module Key -- A single-press key used to transfer data from the
monitor to the module.
2 Transfer to Module Indicator -- A green LED that indicates several functions. It
is lit steadily when a Data Transfer setup screen is active. It blinks rapidly when
initial data are being transferred to the module. It blinks slowly when continuous
updates are being transferred to the module.
3 Transfer to Monitor Key -- A single-press key used to transfer data from the
module to the monitor.
4 Transfer to Monitor Indicator -- A green LED that is lit steadily when a Data
Transfer setup screen is active. It blinks rapidly when blocks of data are being
transferred to the monitor.
Safety
Capabilities
The Data Transfer Module complies with UL-544, IEC 601-1, and CSAC22.2 No.
125.
The Data Transfer Module transfers patient demographics and up to 24 hours of trend
data between patient monitors. It can transfer up to 32 continuously monitored vital
signs from one monitor to another. Vital signs transferred to the module from a
monitor are updated continuously.
Data transfers can be accomplished in as few as 30 seconds. The module provides a
minimum of one hour of back-up power when removed from a monitor to transfer
data. Data in the module are erased after transfer to the monitor is complete.
Basic Plug-In Modules
1-89
Data Transfer Module
Data Transfer
Module Exercises
1. The Data Transfer Module transfers data between the CMS Release E, Component
Transport System Release E, Anesthesia CMS, and
________________________________.
2. Which types of data are transferred by the module?
a. patient demographics only
b. trends only
c. vital signs only
d. a and c
e. a, b, and c
3. Which two components reside on a separate circuit board from the other
components?
a. LEDs and control keys
b. microcontroller and memory
c. back-up power supply and clock
d. power supply and front-end-link
4. The module contains _____ kB of RAM and _____ kB of ROM. The module can
transfer patient trends for up to ______ hours.
Answers
1. V24 and V26 Patient Monitors
2. e
3. a
4. 256 kB RAM, 128 kB ROM, 24 hours
1-90
Basic Plug-In Modules
Data Transfer Module
Basic Plug-In Modules
1-91
Data Transfer Module
1-92
Basic Plug-In Modules
Data Transfer Module
Basic Plug-In Modules
1-93
Data Transfer Module
1-94
Basic Plug-In Modules
Chapter 2 Advanced Plug-In Modules
Introduction
This chapter covers the advanced set of plug-in parameter modules used by Philips’
patient monitoring system and the measurement principles on which they are based.
The categorization of “advanced” modules is based on the complexity of their dataprocessing functions rather than on the ease or difficulty of taking the measurements.
Engineers who maintain and repair the equipment may want to familiarize themselves
with the basic modules before moving on to the more advanced ones.
Goals
Objectives
After successfully completing this chapter, you should be able to:
•
Describe the physiologic measurements that can be acquired and processed by
Philips’ advanced plug-in parameter modules.
•
Explain how the Philips’ plug-in modules acquire and process measurements.
In order to meet the chapter’s goal, you should be able to:
•
Define each of the physiologic measurements.
•
State the principle by which each measurement is derived.
•
Recognize the forms in which the data for each measurement are represented.
•
Identify the criteria and influencing factors which relate to the proper acquisition
of the measurement.
•
Describe the methods, components and mechanisms by which the measurement’s
electrical signals are processed by the corresponding module.
•
Identify and describe the features and accessories of the plug-in module.
Advanced Plug-In Modules
2-1
Introduction
Topics
This chapter contains the following topics:
Chapter Topics
2-2
Measurements and Modules
Page
Invasive Blood Pressure Measurement
2-3
Invasive Blood Pressure Module (M1006A)
2-6
Invasive Blood Pressure Module (M1006A/Option #C01)
2-11
Invasive Blood Pressure Module (M1006B)
2-16
CO2 Respiratory Gas Measurement
2-20
CO2 Respiratory Gas Module (M1016A)
2-23
Sidestream CO2 Module (M1015A)
2-28
FIO2 Respiratory Measurement
2-33
FIO2 Module (M1017A)
2-35
tcpO2/tcpCO2 Measurement
2-40
tcpO2/tcpCO2 Module (M1018A)
2-43
SvO2 Blood Gas Measurement
2-50
SvO2 Module (M1021A)
2-52
Blood Analysis Measurement
2-58
Blood Analysis Module (M1022A)
2-62
VueLink Module
2-68
EEG Measurement
2-74
EEG Module
2-79
BIS Measurement
2-86
BIS Module
2-93
Advanced Plug-In Modules
Invasive Blood Pressure Measurement
Invasive Blood Pressure Module Concepts
Invasive Blood Pressure Measurement
Description
Blood pressure is the measured force of the movement of a patient’s blood within the
blood vessels. The first measurement registers ventricular contraction and the second
measurement registers closure of the aortic valve. When the measuring device is in
the patient’s blood stream, the measurement is called an invasive blood pressure.
This information indicates the status of the patient’s overall cardiac condition.
Concepts
Blood Pressure concepts important to this section are:
•
Normal Blood Pressure- The blood’s pressure within the systemic arterial system
•
Systolic Pressure- The greatest pressure of the blood against the blood vessel
walls following ventricular contraction.
•
Diastolic Pressure- The least pressure of the blood against the blood vessel walls
following closure of the aortic valve.
•
Pulse Pressure- The difference between the systolic and diastolic readings. This
is the range of the pressure in the arteries.
•
Mean Arterial Pressure- The average pressure pushing blood through the
circulatory system.
Measurement
Principle
When measuring invasive blood pressure, the force of movement of the blood in the
patient’s systemic arterial system is transported by a fluid column in the pressure line
to the transducer. This pressure causes an electrical signal to be generated which is
then amplified to display the pressure wave and the numerics for the systolic,
diastolic, and mean pressure values.
Measurement
Acquisition
An invasive blood pressure measurement is collected through a pressure transducer
that is connected to a pressure line by means of a catheter which is invasively placed
in the patient’s blood stream.
Advanced Plug-In Modules
2-3
Invasive Blood Pressure Measurement
Measurement
Output
Blood pressure is depicted as a pressure wave with the numerics for systolic,
diastolic, and mean pressure values. The blood pressure shows the cycles of
contraction and release within the heart and the resultant pressure that is generated to
move the blood through the vessels.
Figure 2-1 An Example of a Typical Invasive Pressure Wave
Criteria for Proper
Measurement
Plug-In Modules
2-4
Factors affecting accurate measurement of invasive blood pressure are:
•
Proper connection between the pressure transducer, pressure line, and patient
catheter.
•
Systolic pressure readings in lower extremities are usually higher than readings in
higher extremities.
•
Moving from a reclining position to a standing position can cause the systolic
pressure to fall and the diastolic pressure to rise slightly.
•
The positioning of both the patient and the pressure transducer can influence the
pressure measurement. It is normal practice to position the transducer at heart
level (4th intercostal space and the midaxillary line: known as phlebostatic axis)
and to zero the system to compensate for the static and atmospheric pressure.
Three of Philips’ plug-in modules can measure invasive blood pressure: the PRESS
Module (M1006A), PRESS Module (M1006B) and the PRESS Module (M1006A
Option C01).
Advanced Plug-In Modules
Invasive Blood Pressure Measurement
Invasive Blood
Pressure
Measurement
Exercises
1. Invasive blood pressure measurement is an indication of:
a. the force of a patient’s blood within the blood vessels
b. the amount of oxygen present in the blood vessels
c. the force of CO2 exerted within the blood vessels
2. Invasive blood pressure measurement uses a technique based on:
a. absorption of infrared radiation
b. temperature of measurement being collected
c. blood force being transported by a fluid column in the pressure line to a
transducer
3. Invasive blood pressure measurement is displayed as:
a. a blinking light
b. percentage amount
c. waveform with numerics
4. What factor can influence the accurate measurement of invasive blood pressure?
a. temperature of patient’s blood
b. amount of dissolved Oxygen in the patient’s blood
c. going from a reclining position to a standing position
Answers
1. a
2. c
3. c
4. c
Advanced Plug-In Modules
2-5
Invasive Blood Pressure Module (M1006A)
Invasive Blood Pressure Module (M1006A)
Description
The Pressure (PRESS) M1006A Module is an invasive blood pressure measurement
parameter unit. It is designed to be used with adult, pediatric, or neonatal patients in a
range of Critical Care environments.
Measurements
The PRESS M1006A Module produces a real-time waveform, together with the pulse
rate and numeric readings for the systolic, diastolic, and mean blood pressure values.
Components
The PRESS Module M1006A consists of the following major functional components:
Table 2-1 Major PRESS Module (M1006A) Components
Component
Block Diagram
2-6
Description
Input Protection Network
Protects the module from extraneous signals, i.e., defibrillation
and electro surgery.
Input Amplifier
Amplifies the signal before it is sent to the microcontroller.
Demodulators
Demodulates the amplifier carrier signal before it is input1 to the
low pass filter.
Zeroing/Calibration Test
To compensate for an input pressure offset, an offset
compensation signal is generated by the Digital-to-Analog
converter. The Digital-to-Analog converter also generates the
calibration staircases (CAL2) for the recorder calibration and the
test signal.
Figure 2-2 shows the block diagram of the recorded patient signal flow through the
PRESS Module M1006A.
Advanced Plug-In Modules
40 uV/ 5uv
INPUT CONNECTOR
EXITATION
PROTECTION NETWORK
CAL 1
+
ZERO / CAL2 /TEST
INPUT
AMP
DEMODULATOR
SYNC
GAIN 40 uV/ 5uV
40 uV/ 5uV
TRANSDUCER
DETECTION
24 kHz
EXCITATION
CIRCUITS
LOW
PASS
FILTER
TRANSDUCER
DETECTION
MUX
VARIABLE
GAIN
AMP
TRANSDUCER SIGNAL 40uV/ 5uV
D/A
CONVERTER
A/D
CONVERTER
EEPROM
CONTROLLER
SYSTEM
PATIENT
ISOLATION
RACK
INTERFACE
RACK
Invasive Blood Pressure Module (M1006A)
Figure 2-2 M1006A Invasive Pressure Module Block Diagram
Advanced Plug-In Modules
2-7
Invasive Blood Pressure Module (M1006A)
Theory of Operation
There are four major sections that the electrical signal must pass through in order to
reach the Monitor interface:
1 The amplitude modulated signal from the patient is received electrically through
the input connector from the transducer connected to the patient’s catheter.
2 The signal then gets passed through the Input Protection Network where
extraneous signals are filtered out. This network provides protection against
defibrillation spikes. The signal, together with the zero compensation signal, then
travels from the Input Protection Network to the input amplifier.
3 The signals are received from the Input Protection Network. The sensitivity of the
transducer is corrected by the 40µV/5µV Transducer Sensitivity circuitry and is
then transmitted to the microcontroller. The gain of the Input Amplifier for either
40µV or 5µV sensitivity is set by the microcontroller.
The amplifier carrier signal is synchronously demodulated before being input to
the lowpass filter. The filter is then optimized by a variable amplifier before being
digitized by the Analog-to-Digital converter.
To compensate for input pressure offset (caused by static or atmospheric pressure
at the pressure transducer) an offset compensation signal is generated by the
Digital-to-Analog converter. The offset values are stored in an EEPROM. The
Digital-to-Analog converter also generates the calibration staircases (CAL2) for
the recorder calibration and the test signal. Both the calibration signal and the test
signal are generated on user request.
4 The signal is then passed through the patient isolation to the rack interface and
then to the receiving rack.
PRESS M1006A
Features
2-8
Figure 2-3 shows the user controls and connectors for the PRESS Module M1006A.
Refer to this figure for the User Controls and Connector descriptions.
Advanced Plug-In Modules
Invasive Blood Pressure Module (M1006A)
PRESS M1006A T
(2)
PRESS
ZERO
(1)
(3)
12
PIN
(4)
Figure 2-3 PRESS Module (M1006A) Controls and Connectors
User Controls
1 Pressure Setup Key- a single-press key which is used to enter the Pressure Setup
Screen.
2 Pressure Setup Indicator - a green LED light which is lit when user is in the
Pressure Setup Screen.
3 Zero Key - a single-press key which is used to zero the transducer without using
the master display controls.
Connectors
Safety
4 The PRESS M1006A uses a standard 12-pin connector with a pressure
transducer that has a sensitivity of either 5µV (+/- 10%) or 40µV (+/- 40%).
To ensure the safety of the patient, the patient applied parts are isolated from ground
by optical isolators and a transformer. In addition, the entire module is encapsulated
in plastic.
This module complies with UL544, IED-601-1, CSA C22.2 No. 125. Patient leakage
current is less than 10µA at 120V/60Hz.
It has an isolated patient connection to Class I protection, Type Cardiac Floating
(CF).
There is also protection against damage from defibrillation and electro surgery.
Advanced Plug-In Modules
2-9
Invasive Blood Pressure Module (M1006A)
PRESS M1006A
Module Exercises
1. The PRESS M1006A Module measures:
a. cardiac output
b. invasive blood pressure
c. blood oxygen concentration level
2. The PRESS M1006A Module produces a waveform along with all but:
a. systolic numeric value
b. instantaneous CO2 numeric value
c. diastolic numeric value
3. The PRESS M1006A Module Input Amplifier performs which of the following
functions?
a. amplifies the signal before it is sent to the microcontroller
b. demodulates the signal before it is sent to the microcontroller
c. protects the module from extraneous signals
4. The PRESS M1006A Module has all but the following user controls:
a. Zero Key
b. Pressure Setup Indicator
c. CAL Indicator
Answers
1. b
2. b
3. a
4. c
2-10
Advanced Plug-In Modules
Invasive Blood Pressure Module (M1006A/Option #C01)
Invasive Blood Pressure Module (M1006A/Option #C01)
Description
The PRESS M1006A/Option #C01 Module is an invasive blood pressure
measurement parameter unit. It is designed to be used with adult, pediatric, or
neonatal patients in a range of Critical Care environments.
Measurements
The PRESS M1006A/Option #C01 Module produces a real-time waveform, together
with the pulse rate and numeric readings for the systolic, diastolic, and mean blood
pressure values.
This module provides an analog pressure output signal for use with intra-aortic
balloon pumps (IABP).
Components
The PRESS Module M1006A/Option #C01 consists of the following major functional
components:
Table 2-2 Major PRESS Module (M1006A Option #C01) Components
Component
Block Diagram
Description
Input Protection Network
Protects the module from extraneous signals, i.e., defibrillation
and electro surgery.
Input Amplifier
Amplifies the signal before it is sent to the Microcontroller.
Analog Output Jack
This 1/4 inch phone jack contains three terminals: tip, ring, and
sleeve. Tip provides the analog pressure output signal. Ring and
sleeve are connected to analog ground.
Demodulator
Demodulates the carrier signal.
Zeroing/Calibration Test
To compensate for an input pressure offset, an offset
compensation signal is generated by the Digital-to-Analog
converter. The Digital-to-Analog converter also generates the
calibration staircases (CAL2) for the recorder calibration and the
test signal.
Figure 2-4 shows the block diagram of the patient’s recorded signal flow through the
PRESS M1006A/Option #C01 Module.
Advanced Plug-In Modules
2-11
Advanced Plug-In Modules
PRESS
OUT
BAND
PASS
AMP
AMP
INPUT CONNECTOR
EXCITATION
ISOLATION
TRANSFORMER
POWER
5uV
PROTECTION NETWORK
CAL1
2-12
CONTROL
PRESS
AMP
INPUT
SYNC
DEMODULATOR
24kHz
EXCITATION
CIRCUITS
LOW
PASS
FILTER
VARIABLE
GAIN
AMP
TRANSDUCER
DETECTION
MUX
TRANSDUCER SIGNAL 40uV/5uV
GAIN 40uV/5uV
ZERO / CAL2 / TEST
+
40uV/5uV
TRANSDUCER
DETECTION
D/A
CONVERTER
A/D
CONVERTER
u-
EEPROM
CONTROLLER
SYSTEM
PATIENT
ISOLATION
RACK
RACK
INTERFACE
Invasive Blood Pressure Module (M1006A/Option #C01)
Figure 2-4 M1006A Invasive Pressure Module Option #C01 Block Diagram
EXCITATION
Invasive Blood Pressure Module (M1006A/Option #C01)
Theory of Operation
There are four major sections that the electrical signal must pass in order to reach the
Monitor interface:
1 The amplitude modulated signal from the patient is electrically received through
the input connector from the 5µV/V/mmHg transducer connected to the patient’s
catheter. Only 5µV/V/mmHg transducers may be used with this module.
2 The signal then gets passed through the Input Protection Network where
extraneous signals are filtered out. This network provides protection against
defibrillation spikes. The signal then goes from the protection network to the
Input Amplifier.
3 The signals are received from the Input Protection Network. The sensitivity of the
transducer is corrected by the 5µV Transducer Sensitivity circuitry and
transmitted to the microcontroller. The gain of the Input Amplifier for a 5µV
sensitivity is set by the microcontroller.
The amplifier carrier signal is synchronously demodulated before being input to
the lowpass filter. The filter is then optimized by a variable amplifier before being
digitized by the Analog-to-Digital converter.
To compensate for input pressure offset (caused by static or atmospheric pressure
at the pressure transducer) an offset compensation signal is generated by the
Digital-to-Analog converter. The offset values are stored in an EEPROM. The
Digital-to-Analog converter also generates the calibration staircases (CAL2) for
recorder calibration and the test signal. Both the calibration signal and the test
signal are generated on user request.
4 The signal is then passed through the patient isolation to the rack interface and
then to the receiving rack.
Advanced Plug-In Modules
2-13
Invasive Blood Pressure Module (M1006A/Option #C01)
PRESS M1006A/
Option #C01 Module
Features
The features (User Controls, Connectors, Safety, and Accessories) for the PRESS
M1006A/Option #C01 Module are the same as those for the PRESS M1006A Module
with the exception of the analog output jack.
Figure 2-5 shows the user controls and connectors for the PRESS M1006A/Option
#C01 Module. Refer to this figure for the User Controls and Connector descriptions.
T
PRESS M1006A
80x100
PRESS OUT
PRESS
(2)
ZERO
(3)
(1)
(5)
CAUTION: OUTPUT HAS
OFFSET ON 6 AND 10 SCALE
CAUTION:
(4)
5uv/V/mm Hg
TRANSDUCERS
ONLY
Figure 2-5 PRESS Module (M1006A Option #C01) Controls and Connectors
User Controls
1 Pressure Setup Key- a single-press key which is used to enter the Pressure Setup
Screen.
2 Pressure Setup Indicator - a green LED light which is lit when user is in the
Pressure Setup Screen.
3 Zero Key - a single-press key which is used to zero the transducer without using
the master display controls.
Connectors
4 The PRESS M1006A #C01 uses a standard 12-pin connector with a pressure
transducer that has a sensitivity of 5µV (+/- 10%).
5 Analog Output Jack: This is standard 1/4 inch phone jack, used to provide
analog signals to an intra-aortic balloon pump. Philips recommends that a molded
phone plug cable (Product Number M1181A-#A62) be used with this output jack.
2-14
Advanced Plug-In Modules
Invasive Blood Pressure Module (M1006A/Option #C01)
PRESS M1006A/
Option #C01 Module
Exercises
1. What does the PRESS M1006A/Option #C01 Module Measure?
a. CO2 Output
b. Invasive Blood Pressure
c. Cardiac Output
2. What component of the PRESS M1006A/Option #C01 Module provides the analog
output signal?
a. Analog Output Jack
b. Analog-to-Digital Converter
c. Microcontroller Unit
3. The PRESS M1006A/Option #C01 Module uses the following:
a. 40 µV/V/mmHg transducers
b. 40 µV/V/mmHg and 5µV/V/mmHg transducers
c. 5 µV/V/mmHg transducers
Answers
1. b
2. a
3. c
Advanced Plug-In Modules
2-15
Invasive Blood Pressure Module (M1006B)
Invasive Blood Pressure Module (M1006B)
Description
The PRESS M1006B Module is an invasive blood pressure measurement parameter
unit. It is designed to be used with adult, pediatric, or neonatal patients in a range of
Critical Care environments. It contains the same functionality of the M1006A except
it has no 40 µV/V/ mmHg sensitivity.
Measurements
The PRESS M1006B Module produces a real-time waveform, together with the pulse
rate and numeric readings for the systolic, diastolic, and mean blood pressure values.
Components
The PRESS Module M1006B consists of the following major functional components:
Table 2-3 Major PRESS Module (M1006B) Components
Component
Block Diagram
2-16
Description
Input Protection Network
Protects the module from extraneous signals, i.e., defibrillation
and electro surgery.
Analog-to-Digital Converter
Amplifies, filters, and digitizes the input signal.
Microcontroller Unit
Sets all control information.
Figure 2-6 shows the block diagram of the patient’s recorded signal flow through the
PRESS M1006B Module.
Advanced Plug-In Modules
5uV
8 MHz
EXCITATION
CIRCUITS
SIGNAL
CONDITIONING
A/D CONVERTER
TRANSDUCER
DETECTION
16 MHz
WATCHDOG
MICROCONTROLLER
EEPROM
256 BYTES
PATIENT
ISOLATION
16 MHz
CLOCK
OSCILLATOR
Invasive Blood Pressure Module (M1006B)
Figure 2-6 M1006B Invasive Pressure Module Block Diagram
Advanced Plug-In Modules
2-17
CMS
PROTECTION NETWORK
INPUT CONNECTORS
Invasive Blood Pressure Module (M1006B)
Theory of Operation
There are four major sections that the electrical signal must pass through in order to
reach the Monitor interface:
1 The amplitude modulated signal from the patient is received electrically through
the input connector from the 5µV/V/mmHg transducer connected to the patient’s
catheter.
2 The signal then gets passed through the Input Protection Network, where
extraneous signals are filtered out. This network provides protection against
defibrillation spikes. The signal then travels from the protection network to the
Analog-to-Digital Converter.
3 The signals are received from the Input Protection Network. The Analog-toDigital Converter amplifies, filters, and digitizes the input signal and sends it to
the Microcontroller Unit.
The Microcontroller sets all information needed by the converter and receives the
converter’s data. An EEPROM stores the information needed for correct converter
setup. The timing of the Microcontroller is regulated by the clock oscillator.
4 The signal is then passed through the patient isolation to the rack interface and
then to the receiving rack.
PRESS M1006B
Module Features
2-18
The features (User Controls, Connectors, Safety, and Accessories) for the PRESS
M1006B Module are the same as those for the PRESS M1006A Module except the
M1006B has no 40 µV/V/ mmHg sensitivity.
Advanced Plug-In Modules
Invasive Blood Pressure Module (M1006B)
PRESS M1006B
Module Exercises
1. What does the PRESS M1006B Module Measure?
a. Invasive Blood Pressure
b. Cardiac Output
c. CO2 Output
2. What component of the PRESS M1006B Module sets all control information?
a. Input Protection Network
b. Analog-to-Digital Converter
c. Microcontroller Unit
3. The PRESS M1006B Module uses the following:
a. 40 µV/VmmHg transducers
b. 5 µV/VmmHg transducers
c. 40 µV/VmmHg and 5µV/VmmHg transducers
Answers
1. a
2. c
3. b
Advanced Plug-In Modules
2-19
CO2 Respiratory Gas Measurement
CO2 Respiratory Gas Module Concepts
CO2 Respiratory Gas Measurement
Description
CO2 respiratory gas measurements indicate the efficiency of the transfer of oxygen
from alveolar air into pulmonary capillary blood and the elimination of carbon
dioxide from pulmonary capillary blood and its transfer into alveolar air.
The CO2 respiratory gas measurements are an indication of the patient’s overall
respiratory status.
Concepts
Measurement
Principle
Blood Gas concepts important to this section are:
•
Airway Respiration Rate (AWRR) - The number of inspirations and expirations
per minute.
•
End Tidal Volume - The total volume of air expired in one breath.
•
End Tidal CO2 (ETCO2) - The total volume of CO2 expired in one breath.
•
Inspired Minimum CO2 (IMCO2) - The minimum amount of CO2 inspired in
one breath.
•
Instantaneous CO2 - The CO2 measurement at any instant.
•
Ventilation - The movement of air in and out of the lungs by inspiration and
expiration.
The ETCO2 (End Tidal Carbon Dioxide) measurement for Carbon Dioxide uses a
technique based on the absorption of infrared radiation by certain gases.
Infrared light is absorbed by C02. The amount of absorption varies according to the
CO2 concentration in the gas mixture. By using an infrared detector to measure the
absorption, the CO2 concentration in a gas can be derived.
Measurement
Acquisition
CO2 respiratory gas measurements are evaluated as gas passes through the airway
adapter on the patient’s intubation system.
Measurement
Output
Respiratory CO2 gas readings are depicted as a real-time CO2 waveform together
with numerics for ETCO2, Airway Respiration Rate (AWRR), and Inspired Minimum
Carbon Dioxide (IMCO2).
During calibration, the value for instantaneous CO2 is also obtained.
2-20
Advanced Plug-In Modules
CO2 Respiratory Gas Measurement
Criteria for Proper
Measurement
Plug-In Modules
Factors affecting accurate measurements of CO2 respiratory gas are:
•
Proper connection between the measurement module and the patient’s respiratory
system.
•
Temperature of the patient’s breath.
•
Amount of water vapor in the patient’s breath.
•
Barometric pressure at the site of measurement acquisition.
•
Other gases, most notably N2O and O2, in the gas mixture.
Two of Philips’ plug-in modules can measure respiratory CO2: the M1016A CO2
Module and M1015A Sidestream CO2 Module. The M1015A module requires the
M1016A module to measure sidestream CO2.
Advanced Plug-In Modules
2-21
CO2 Respiratory Gas Measurement
CO2 Respiratory
Gas Measurement
Exercises
1. CO2 respiratory gas measurement is an indication of
a. overall cardiac status
b. overall pulmonary status
c. overall respiratory status
2. CO2 respiratory gas measurement uses a technique based on:
a. absorption of infrared radiation
b. amount of partial pressure exerted
c. temperature of measurement being collected
3. CO2 respiratory gas measurement is displayed as a:
a. numeric value
b. waveform
c. percentage amount
d. a and b
4. What factors can influence the accurate measurement of CO2 respiratory gas?
a. temperature of patient’s breath
b. amount of water vapor in patient’s breath
c. a and b
Answers
1. c
2. a
3. d
4. c
2-22
Advanced Plug-In Modules
CO2 Respiratory Gas Module (M1016A)
CO2 Respiratory Gas Module (M1016A)
Description
The CO2 M1016A Module is a carbon dioxide measurement parameter unit. It is
designed to be used with adult, pediatric, or neonatal patients in a range of Critical
Care environments.
Measurements
The CO2 M1016A Module produces a real-time CO2 waveform, together with
numeric readings for the End Tidal CO2, Inspired Minimum CO2, and Airway
Respiration Rate.
During the calibration of the module, the numeric value for instantaneous CO2 is
displayed.
Components
The CO2 M1016A Module consists of the following major functional components:
Table 2-4 Major CO2 Module Components
Component
Block Diagram
Description
Microprocessor
Controls the overall CO2 Module functions.
Heater Control
Maintains the temperature of the transducer.
Motor Control
Responsible for rotating the filter wheel at a speed of 40 rotations
per minute.
Infrared Detector Signal Transfer
Amplifies signals from the infrared detector and passes it through
a dual slope Analog-to-Digital converter.
EEPROM
Calibration constants for the module are stored in the EEPROM
during power down. This makes it possible to transport the
module together with the sensor without requiring recalibration.
Power Supply
Generates all necessary supplies for the module and the high
voltage supply for the infrared detectors. The +60V output from
the Computer Module is used to generate the required voltages
within the module.
Figure 2-7 shows the block diagram of the patient’s recorded signal flow through the
CO2 M1016A Module.
Advanced Plug-In Modules
2-23
GAS
2-24
Advanced Plug-In Modules
TRANSDUCER
HEATER
TEMP
SENSOR
SENSE
COIL
DRIVE
COIL
IR
DETECTOR
IR SOURCE
CO2INPUT
CO
2 MODULE
AMPLIFIER
MOTOR
DRIVE
BIAS
REGULATION
AMPLIFIER
HEATER
CONTROL
A/D
POSITION
PULSE
AMPLIFIER
MOTOR
PHASE
COMPARATOR
AZ PULSE
MONOFLOP
DUAL
SL0PE
A/D
EEPROM
MICROPROCESSOR
COUNTERS
OPTOCOUPLER
TO RACK
INTERFACE
CARD
CO2 Respiratory Gas Module (M1016A)
Figure 2-7 M1016A Carbon Dioxide (CO2) Module Block Diagram
CO2 Respiratory Gas Module (M1016A)
Theory of Operation
There are four major sections that the electrical signal must pass through in order that
it reach the Monitor interface:
1 The Microprocessor is in overall control of the CO2 Module functions and also
performs the following functions:
• Serial communication, via optocouplers, with the rack
interface card in the Computer Module.
• Calculation of the calibration constants.
• Calculation of the raw data of the CO2 waveform.
Data are passed from the microprocessor to other areas of the module over an
internal data bus.
2 The temperature of the transducer is maintained at approximately 33°C to prevent
condensation and to negate any discrepancies due to temperature changes. Signals
from the temperature sensor in the transducer are amplified and then passed
through an Analog-to-Digital converter. The microprocessor then adjusts the
output of the motor drive circuitry accordingly.
The microprocessor derives the measurement timing from the motor drive
circuitry.
3 Signals from the infrared detector are amplified and passed through a dual slope
Analog-to-Digital converter. This converter is controlled by the microprocessor
via the counters. The conversion is started at a predefined time and is performed
synchronously with the motor rotation.
The “Zero” (GZ), “Sample” (GS), and “Reference” (GR) signals are produced and
used as the input values for the CO2 algorithm.
An auto zero signal (AZ), which is derived from the output of the motor phase
comparator, controls the bias regulation of the infrared detector. The AZ signal is
enabled or disabled by the microprocessor.
CO2 M1016A
Features
Figure 2-8 shows the user controls and connectors for the CO2 M1016A Module.
Refer to this figure for the User Controls and Connector descriptions.
Advanced Plug-In Modules
2-25
CO2 Respiratory Gas Module (M1016A)
CO2
M1016A
T
(2)
(4)
CO2
CAL
(3)
(1)
(5)
12
PIN
Figure 2-8 C02 Module Controls and Connectors
User Controls
1 CO2 Setup Key: This is a single-press key, used to enter the CO2 setup screen.
2 CO2 Setup Indicator: This is a green LED, which will be lit when in the CO2
setup screen. If, after pressing the setup key, the LED is not lit, the system is busy
and the CO2 setup screen cannot be entered.
3 CAL key: This is a single-press key used to enter the CO2 calibration screen and
calibration mode. The calibration screen can be exited by pressing this key a
second time, (and calibrations already in progress will not be influenced.)
4 CAL Indicator: This is a green LED, which is lit when in the CO2 calibration
mode.
Connectors
Safety
5 This is a standard 12-pin connector for use with a CO2 Transducer.
To ensure the safety of the patient, the patient-applied parts are isolated from ground
by optical isolators and a transformer. In addition the entire module is encapsulated in
plastic.
This module complies with UL544, IED-601-1, CSA C22.2 No. 125. Patient leakage
current less than 10µA at 120V/60Hz.
Isolated patient connection to Class 1 protection, Type Cardiac Floating (CF).
There is also protection against damage from defibrillation and electro surgery.
2-26
Advanced Plug-In Modules
CO2 Respiratory Gas Module (M1016A)
CO2 M1016A
Module Exercises
1. The CO2 M1016A Module measures:
a. Cardiac Output
b. Carbon Dioxide
c. Oxygen concentration
2. The CO2 M1016A Module produces a CO2 waveform along with all but:
a. Airway Respiration Rate
b. Instantaneous CO2
c. End Tidal Nitrogen
3. The CO2 M1016A Module Microprocessor performs which of the following
functions?
a. overall controls the CO2 Module functions
b. regulates temperature
c. regulates the filter wheel at 40 rpms
4. The CO2 M1016A Module has all but the following user controls:
a. Partial Pressure alarm key
b. Setup Key
c. CAL Indicator
Answers
1. b
2. c
3. a
4. a
Advanced Plug-In Modules
2-27
Sidestream CO2 Module (M1015A)
Sidestream CO2 Module (M1015A)
Description
The M1015A Sidestream CO2 (SSCO2) Module is designed for use with the M1016A
CO2 Module to provide a solution for measuring CO2 in long-term intubated patients
weighing more than 7 kg. Use of the module means that the transducer is not directly
placed on the patient’s breathing circuit.
Measurements
The M1015A Sidestream CO2 Module, when used with the CO2 M1016A Module,
produces a real-time CO2 waveform, together with numeric readings for the End
Tidal CO2, Inspired Minimum CO2, and Airway Respiration Rate.
During the calibration of the module, the numeric value for instantaneous CO2 is
displayed.
Components
The M1015A SSCO2 Module consists of the following major functional components:
Table 2-5 Major SSCO2 Module Components
Block Diagram
2-28
Component
Description
Microprocessor
Controls the overall calculations and communication
with the CMS function box.
EEPROM
A peripheral to the Microprocessor and where the
calibration constants, error codes, and pump driver
renting data are stored.
Power Supply
The Floating Power Supply generates the necessary
voltage and ensures that there is an electrical
separation between the circuitry.
Flow Channel
Controls the offset compensation for the pressure
sensors.
Pressure Channel
Uses no offset adjustment.
Pump Driver and Valve
The pump driver and valve are driven by a pulse
width modulation signal.
Temperature Sensor
The temperature sensor is used to compensate for the
semi conductor and pressure drives.
Multiplexer and A/D Converter
The multiplexor measures the ground signal, 2.5 volt
reference, and the 5 volt power supply. All voltages
are switched by the multiplexer to the A/D (Analogto-Digital) converter.
Figure 2-9 shows the block diagram of the patient’s recorded signal flow through the
Sidestream CO2 M1015A Module.
Advanced Plug-In Modules
Gas
Inlet
Gas
Outlet
Gas Flow
Amplifier
Amplifier
Pump
Driver
Valve
Driver
Gas Connection
Flow Measurements
Differential
Pressure
Sensor
Absolute
Pressure
Sensor
Temp
Sensor
Pump
Servo
Valve
Electrical Connections
Timer
A/D
Converter
Pulse width
Modulation
Timer
Floating
Supplies
Floating
Power
Supply
EEPROM
Optocoupler
Watchdog
from
CMS
from/to
CMS
Sidestream CO2 Module (M1015A)
Microprocessor
Multiplexer
Sensor Adapter
Figure 2-9 Sidestream CO2 Module M1015A Block Diagram
Advanced Plug-In Modules
2-29
Sidestream CO2 Module (M1015A)
Theory of Operation
The four major sections that the electrical signal must pass through in order to reach
the Monitor interface are:
1 The Microprocessor which is in overall control of all calculations and
communications with the CMS function box. The Microprocessor performs the
following functions:
• Serial communication, via optocouplers, with the rack
interface card in the Computer Module.
• Data Acquisition for the differential pressure sensors.
• Control of the pump driver and valve.
• The flow control algorithm.
Data are passed from the microprocessor to other areas of the module over an
internal data bus.
2 The flow channel, which consists of a differential pressure sensor and a variable
gain amplifier. The flow channel controls the offset compensation for the pressure
sensors.
The following two types of sensors may be used:
• Motorola MPX 10
• Sensym SX 01.
The offset compensation is set up so that both types of sensor can be used without
changing the software.
3 The pressure channel; no offset adjustment is necessary for the pressure channel.
The following two types of sensor can be used:
• Motorola MPX 100
• Sensym SX 15
4 The pump driver and valve which are driven by a pulse width modulation signal.
Both drivers contain a comparator and level switch and a power MOSFET. The
pump driver is driven by the positive 7 volt power supply; the valve is driven by
the negative 7 volt power supply. Both the pump driver and the valve current can
be measured across a resistance (R154, R164). The pump driver contains a safety
switch off which is tested cyclically.
2-30
Advanced Plug-In Modules
Sidestream CO2 Module (M1015A)
M1015A Sidestream
CO2 Module
Features
Figure 2-10 shows the user controls and connectors for the M1015A Sidestream CO2
Module. Refer to this figure for the User Controls and Connector descriptions.
(1)
(2)
(3)
(4)
(5)
(6)
Figure 2-10 Sidestream C02 Module Controls and Connectors
Connectors
1 Gas Outlet Connector: The gas outlet connector lets out the gas after it has been
sampled.
2 Gas inlet Connector: The gas inlet connector provides the connection for the
sample tubing (and bacterial filter) which receives the patient’s gas sample.
3 Slide Cover: The cover protects the gas inlet connector when the module is not in
use.
4 Sample Cell: The CO2 transducer is mounted on the sample cell of the sidestream
module. The transducer plug is connected to the M1015A CO2 Plug-in Module.
5 Switch: The switch activates the Sidestream pump when the CO2 transducer is
mounted on the sample cell.
6 Mounting Clamp: The mounting clamp holds the CO2 transducer in place.
Safety
To ensure the safety of the patient, the patient-applied parts are isolated from ground
by optical isolators and a transformer. In addition, the entire module is encapsulated
in plastic.
This module complies with UL544, IED-601-1, CSA C22.2 No. 125. Patient leakage
current is less than 10µA at 120V/60Hz.
Isolated patient connection to Class 1 protection, Type Cardiac Floating (CF).
There is also protection against damage from defibrillation and electro surgery.
Advanced Plug-In Modules
2-31
Sidestream CO2 Module (M1015A)
M1015A Sidestream
Module Exercises
1. What does the M1015A Sidestream CO2 Module measure?
a. Invasive Blood Pressure
b. Cardiac Output
c. CO2 Output
2.What component of the M1015A Sidestream CO2 Module controls the offset
compensation for the pressure sensors?
a. Flow Channel
b. Pressure Channel
c. Power Supply
3. The M1015A Sidestream CO2 Module is used in conjunction with the:
a. PRESS M1006B Module
b. CO2 M1016A Module
c. PRESS M1006A Module
4. What does the slide cover on the M1015A Sidestream CO2 Module do?
a. provides the connection for the sample tubing
b. activates the sidestream pump
c. protects the gas inlet connector
Answers
1. c
2. a
3. b
4. c
2-32
Advanced Plug-In Modules
FIO2 Respiratory Measurement
FIO2 Module Concepts (CMS only)
FIO2 Respiratory Measurement
Description
FIO2 respiratory measurements indicate the percentage of oxygen that is inspired.
The FIO2 respiratory measurement is an indication of the percentage of oxygen a
patient is breathing.
Concepts
Measurement
Principle
Respiratory concepts important to this section are:
•
Fractional Concentration of Oxygen in the inspired air (FIO2)- The percent of
Oxygen in the inspired air.
•
Total Inspired Gas - The total volume of gas inspired during one inspiration.
•
Ventilation - The movement of air in and out of the lungs by means of inspiration
and expiration.
The measurement method used to determine the fractional oxygen is called the
polarographic method.
The transducer comprises an anode and a cathode mounted in an electrolyte and
protected by a gas permeable membrane. A polarization voltage is applied between
the anode and cathode. Oxygen passing through the membrane is reduced (consumed)
at the cathode, resulting in an output current proportional to the amount of O2
consumed. The fraction of O2 can then be derived from the measured current.
As the transducer is placed in the inspired pathway of a ventilated patient, the
measurement provides a value for the O2 concentration, expressed as a fraction of the
inspired air.
The temperature dependency of the polarographic method is compensated by an
internal thermistor in the sensor.
Normal values for FI02 are: ambient air, 21% or 0.21. Depending on the patient’s
condition, the percentage of Oxygen sent to the patient may vary from this amount.
Measurement
Acquisition
The FIO2 respiratory measurement is collected by way of an airway adapter on the
patient’s intubation system.
Measurement
Output
The respiratory FIO2 reading is depicted as a numeric value expressed as a fraction of
the total inspired gas.
Advanced Plug-In Modules
2-33
FIO2 Respiratory Measurement
Criteria for Proper
Measurement
Factors affecting accurate measurements of FIO2 are:
•
Plug-In Modules
Proper connection between the measurement module and the patient’s ventilation
system.
The M1017A FIO2 Plug-in Module measures fractional inspired oxygen.
Automatic compensation for O2 interference when measuring respiratory CO2 is
achieved when the FIO2 Module is in use.
FIO2 Respiratory
Measurement
Exercises
1. FIO2 respiratory measurement is an indication of
a. the percent of inspired oxygen
b. the percent of expired oxygen
c. the percent of inspired CO2
2. FIO2 respiratory measurement uses a technique based on:
a. the polographic method
b. amount of partial pressure exerted
c. absorption of infrared radiation
3. FIO2 respiratory measurement is displayed as a:
a. blinking light
b. waveform
c. numeric value
4. What factors can influence the accurate measurement of FIO2?
a. temperature of patient’s breath
b. proper connection between the module and the patient’s ventilation system
c. amount of water vapor in patient’s breath
Answers
1. a
2. a
3. c
4. b
2-34
Advanced Plug-In Modules
FIO2 Module (M1017A)
FIO2 Module (M1017A)
Description
The FIO2 M1017A Module is an inspired oxygen measurement parameter unit. It is
designed to be used with adult, pediatric, or neonatal patients in a range of Critical
Care environments.
Measurements
The FIO2 M1017A Module produces a numeric display for the fractional inspired
oxygen.
Components
The FIO2 M1017A Module consists of the following major functional components:
Table 2-6 Major FiO2 Module Components
Block Diagram
Component
Description
Polarization Circuitry
The polarization voltage is derived from the power
supply of the module when the power is ON. When the
power is OFF, this voltage is derived from a built-in
battery (for a minimum of four days).
Low Battery and Test Signal
The voltage of the built-in polarization battery is sensed
so that a failed battery can be detected. For testing
purposes, a test signal is generated in the current-tovoltage converter circuitry. The numeric 0.21 FIO2
indicates that the module is working correctly. This
battery is rechargeable.
Figure 2-11 shows the block diagram of the recorded patient signal flow through the
FIO2 M1017A Module.
Advanced Plug-In Modules
2-35
2-36
Advanced Plug-In Modules
LOW
PASS
FILTER
BATTERY VOLTAGE
AMPLIFIER
TEST SIGNAL / SENSOR CONTROL
CONVERTER
CURRENT
TO
VOLTAGE
POLARIZATION
CIRCUITRY
MUX
VERTER
CON-
A/D
CONTROLLER
SYSTEM
MICRO-
PATIENT
ISOLATION
RACK
RACK
INTERFACE
FIO2 Module (M1017A)
INPUT CONNECTOR
Figure 2-11 M1017A FIO2 Module Block Diagram
FIO2 Module (M1017A)
Theory of Operation
The major actions on the electrical signal before it reaches the Monitor interface are
as follows:
The FIO2 signal is generated when the current produced by the electro-reduction of
oxygen at the cathode is converted to a voltage. This voltage is then input to a low
pass filter and the filtered signal is amplified before being passed through the
multiplexer to the Analog-to-Digital converter.
FIO2 M1017A Features
Figure 2-12 shows the user controls and connectors for the FIO2 M1017A Module.
Refer to this figure for the User Controls and Connector descriptions.
FIO2
M1017A
T
(2)
(1)
(5)
(4)
FIO2 21% CAL
(3)
3
PIN
Figure 2-12 FIO2 Module Controls and Connectors
User Controls
1 FIO2 Setup Key: This is a single-press key, used to enter the FIO2 setup screen.
2 FIO2 Setup Indicator: This is a green LED, which will be lit when in the FIO2
setup screen. If, after pressing the setup key, the LED is not lit, the system is busy
and the FIO2 setup screen cannot be entered. The setup key must be pressed again.
3 21% CAL Key: This is a single-press key used to initiate the FIO2 21%
calibration procedure. The key must be pressed for at least one second to start
calibration. The calibration task window is not displayed when the calibration is
initiated using this key.
4 CAL Indicator: This is a green LED, which is lit when in the FIO2 calibration
mode.
Connectors
5 This is a standard 3-pin connector for use with a FIO2 Transducer.
Advanced Plug-In Modules
2-37
FIO2 Module (M1017A)
Safety
To ensure the safety of the patient, the patient-applied parts are isolated from ground
by optical isolators and a transformer. In addition, the entire module is encapsulated
in plastic.
This module complies with UL544, IEC-601-1, CSA C22.2 No. 125. Patient leakage
current is less than 10µA at 120V/60Hz.
Isolated patient connection to Class 1 protection, Type Cardiac Floating (CF).
There is also protection against damage from defibrillation and electrosurgery.
2-38
Advanced Plug-In Modules
FIO2 Module (M1017A)
FIO2 M1017A
Module Exercises
1. The FIO2 M1017A Module measures:
a. Fractional inspired Oxygen
b. Carbon Dioxide
c. Oxygen concentration
2. The FIO2 M1017A Module produces a:
a. Numeric display
b. Waveform
c. Blinking light
3. The FIO2 M1017A Module low battery and test signal performs which of the
following functions?
a. Controls the FIO2 Module overall functions
b. Detects a failed battery
c. regulates temperature
4. The FIO2 M1017A Module has all but the following user controls:
a. CAL Indicator
b. Setup Key
c. Partial Pressure alarm key
Answers
1. a
2. a
3. b
4. c
Advanced Plug-In Modules
2-39
tcpO2/tcpCO2 Measurement
Transcutaneous Gas (tcpO2/tcpCO2) Module Concepts
tcpO2/tcpCO2 Measurement
Description
Transcutaneous gas measurements indicate the partial pressures of oxygen and carbon
dioxide in a patient’s blood system as measured through the skin.
The transcutaneous gas measurement is an indication of the amount of oxygen a
patient is getting and how well the heart is working.
Concepts
Transcutaneous gas concepts important to this section are:
•
Measurement
Principle
Transcutaneous - Through the skin.
Different measurement principles exist for the tcpO2 and tcpCO2 parameters. One, or
both, can be implemented with the transducer, and, when both are implemented, they
are implemented by a “combined” transducer. Both measurement principles require
the use of a topical electrolyte.
For tcpO2 measurement, a silver/platinum Clark electrode is used. When a constant
voltage is applied to the electrode, it produces a very small electrical current
proportional to the tcpO2 pressure. This current is converted into a voltage and
amplified in the transducer plug.
For tcpCO2 measurement, a solid state pH glass electrode is used. This electrode
produces a voltage related to the electrolyte’s pH value. The pH value is dependent on
the CO2 pressure. The electrode voltage and the CO2 pressure are logarithmically
related. The electrical signal from the electrode is amplified within the transducer
plug.
The O2 and CO2 in the patient’s blood diffuses through the skin and then passes
through the sensor’s membrane into the electrolyte. The O2 molecules are reduced on
the platinum electrode and generate a small current proportional to the O2 pressure.
The CO2 molecules alter the pH of the electrolyte until an equilibrium is obtained.
The change in pH is converted into a voltage proportional to the CO2.
To establish that the voltage or current levels correspond to the CO2 or O2 partial
pressures, the transducer is calibrated. The transducer is exposed to a calibration gas
of defined values for pCO2 and pO2. The transducers require calibration due to the
fact that CO2 transducers have an unknown offset and O2 transducers have an
unknown sensitivity. Any transducer not calibrated regularly will misread, and the
measurement is inhibited until a calibration is performed.
2-40
Advanced Plug-In Modules
tcpO2/tcpCO2 Measurement
The transducer is heated to improve the diffusion of CO2 and O2 from the patient’s
skin and to maintain an absolute constant temperature. Any change in the transducer’s
temperature changes its characteristics, so the user must make a new calibration if and
after the set temperature has been changed.
Measurement
Acquisition
The transcutaneous gas measurement is noninvasive using a transducer attached to
the patient’s skin.
Measurement
Output
The transcutaneous gas readings are depicted as numerics on the display and as
graphical and numeric trend information for the partial O2 and CO2 measurements.
Criteria for Proper
Measurement
Factors affecting accurate measurements of transcutaneous gas are:
Plug-In Modules
•
proper connection between the measurement module and the patient’s transducer.
•
any change in the transducer’s temperature, which changes its characteristics and
may affect accurate measurement
The M1018A tcpO2/tcpCO2 Plug-in Module, in conjunction with a transducer,
measures transcutaneous O2 and CO2 carbon dioxide partial pressures.
Advanced Plug-In Modules
2-41
tcpO2/tcpCO2 Measurement
tcpO2/tcpCO2
Measurement
Exercises
1. tcpO2/tcpCO2 measurement is an indication of:
a. partial pressure of oxygen
b. partial pressure of carbon dioxide
c. both a and b
2. tcpO2/tcpCO2 measurement requires the use of:
a. an electrode
b. an invasive catheter
c. a respiration transducer
3. tcpO2/tcpCO2 measurement is displayed as a:
a. numeric values and as graphical and numeric trend information
b. waveform
c. fraction
4. What factors can influence the accurate measurement of tcpO2/tcpCO2?
a. temperature of patient’s blood
b. amount of water vapor in patient’s blood
c. any change in the transducer’s temperature
Answers
1. c
2. a
3. a
4. c
2-42
Advanced Plug-In Modules
tcpO2/tcpCO2 Module (M1018A)
tcpO2/tcpCO2 Module (M1018A)
Description
The Transcutaneous Gas (tcpO2/tcpCO2) Module M1018A is a measurement
parameter unit measuring transcutaneous oxygen and carbon dioxide partial
pressures.
Measurements
The tcpO2/tcpCO2 M1018A Module produces graphical and numeric trend
information for the partial O2 and partial CO2 pressure measurements.
Calibration
Algorithm
The tcpO2/tcpCO2 M1018A Module uses a calibration algorithm consisting of four
check procedures:
Warm-up Check - The transducer temperature is tested in this check. Under normal
conditions, the temperature will be heated to the preset temperature within 2 minutes.
The test allows a maximum of 3 minutes for the transducer to warm-up to the preset
temperature.
Range Check - The tcpO2 and tcpCO2 signals are checked in this test. If they are not
within the acceptable range in 1 minute, the monitor rejects the calibration and
displays the calibration failed message.
Stability Check - The stability of the electrode is checked in this test. The stability
check is activated on successful completion of the range check. The calibration is
completed when the transducer signal fluctuation is less than 1% per minute. A
maximum of 15 minutes is allowed for this check.
tcpCO2 Post Calibration Check - This check ensures that the CO2 element of the
transducer responds to the change in the CO2 level that occurs when removing the
transducer from the calibration chamber.
If the signal does not change within 10 seconds after removing the transducer from
the chamber, the message tcpO2/tcpCO2, transducer, or Cal Unit Malf will be
displayed.
Advanced Plug-In Modules
2-43
tcpO2/tcpCO2 Module (M1018A)
Calibration
Transducer
Signal (mV)
Calibration complete if x -x < 1% n n-1
Acceptance
Range
x1
x2
x3
x4
x5
x6
x7
x8
.
xn
if within acceptance range, cal value displayed
in task window (not in standard display)
time (min)
Warmup
0-3 min
Range Check
Stability Check
10 sec-1min
1min - 15min
Figure 2-13 Graphic Representation of the Calibration Algorithm
2-44
Advanced Plug-In Modules
tcpO2/tcpCO2 Module (M1018A)
Components
The tcpO2/tcpCO2 M1018A Module consists of the following major functional
components:
Table 2-7 Major tcpO2/tcpCO2 Module Components
Component
Block Diagram
Description
Microprocessor
Controls overall functions of the tcpO2/tcpCO2 Module.
Heater
Heats the transducer to improve diffusion of gases.
Polarization Supply
Produces a polarization voltage of 680 mV for the O2 sensor via
the O2 amplifier. The polarization voltage is monitored by the
microprocessor.
Relay
The relay replaces raw signals from the transducer with test
signals designed to test the two separate analog signal paths for O2
and CO2.
Identifier
The identifier circuitry identifies which transducer is being used: a
tcpO2 transducer, a tcpCO2 transducer, or the Philips combined
transducer.
Multiplexer
The multiplexer collects the analog signals, interleaves them, and
feeds them to the dual-slope analog-to-digital converter.
EEPROM
The calibration constants for the module are stored in the
EEPROM along with other data.
Calibration Chamber
The calibration chamber determines whether the transducer has
been positioned in the calibration chamber on the module, or is
actually being used on a patient.
Power Supply
All necessary supplies for the tcpO2/tcpCO2 Module are generated
in an internal power supply. The +60V output from the Computer
Module is used to generate the required voltages within the
module.
Figure 2-14 shows the block diagram of the recorded patient signal flow through the
tcpO2/tcpCO2 M1018A Module.
Advanced Plug-In Modules
2-45
2-46
Advanced Plug-In Modules
CODE
HEATER
TEMP AMP. 1
TEMP.
SENSOR 1
RELAY
(TEST CIRCUITRY)
HEATER
CURRENT
CONTROLLER
SAFETY
SWITCH
POLARIZATION
SUPPLY
M1018A PLUG_IN MODULE
HEATER
CURRENT
RETURN
HEATER
CURRENT
TEMP. AMP. 2
TRANSDUCER
P.S. (POWER
CONDITIONER)
INTERNAL
TEST
VOLTAGES
TEMP.
SENSOR 2
O2
AMP.
M1918A TRANSDUCER
O2
CURRENT
CO2
VOLTAGE
CO2
AMP.
CALIBRATION
CHAMBER
IDENTIFIER
TEMPERATURE
COMPARATOR
GND
Vref
CO2 INPUT
AMP
MULTIPLEXER
LATCH
TEST
CIRCUITRY
DUAL SLOPE
A/D
CONVERTER
INTERNAL
SUPPLIES
FLOATING
POWER
SUPPLY
EEPROM
OPTO
COUPLER
WATCH DOG
FROM
CMS
FROM/TO
CMS
tcpO2/tcpCO2 Module (M1018A)
Figure 2-14 M1018A Transcutaneous Gas (tcpO2/tcpCO2) Module Block
Diagram
MICROPROCESSOR
tcpO2/tcpCO2 Module (M1018A)
Theory of Operation
The major actions that the electrical signal must pass through in order to reach the
Monitor interface:
1 The microprocessor which controls the overall functions of the module and also
controls transducers, safety tasks, and all application software (e.g. calibration,
value calculation). Additionally, the microprocessor performs the following
functions:
• serial communication, via optocouplers, with the rack
interface card in the Computer Module
• calculation of the calibration constants
• calculation of the tcpO2/tcpCO2 numerics
• transducer temperature control
2 The heater control, which heats the transducer to improve the diffusion of gases
from the blood to the skin surface by maintaining constant absolute temperature.
The transducer temperature is measured by two independent sensors
simultaneously.
Power is supplied to the heater by the heater current controller, which in turn is
controlled by the microprocessor; the microprocessor derives this control signal
from the measured temperature.
The heater can be switched off using the safety switch whenever any abnormal
conditions occur; this safety switch is controlled by both the microprocessor and
the temperature comparator. Test circuitry provides both the switch and the
current controller with a continuous self-test.
3 The Relay, which routes the CO2 signal to the CO2 input amplifier, which, in turn,
amplifies the signal and passes it on to the multiplexer. The relay reroutes the O2
signal directly to the multiplexer.
4 The Calibration Chamber. The calibration chamber circuitry determines whether
the transducer has been positioned in the calibration chamber on the module, or is
actually being used on a patient. A standby mode is initiated when the transducer
has been placed in the chamber for more than 30 minutes; for example, the heater
is switched off to minimize transducer dehydration, therefore extending the time
between remembraning.
The tcpO2/tcpCO2 limit alarms are suspended automatically when a transducer is
inserted into the calibration chamber.
Advanced Plug-In Modules
2-47
tcpO2/tcpCO2 Module (M1018A)
tcpO2/tcpCO2
M1018A Features
Figure 2-15 shows the user controls and connectors for the tcpO2/tcpCO2 M1018A
Module. Refer to this figure for the User Controls and Connector descriptions.
tcpO2 /tcpCO2
T
M1018A
(2)
80x100
O2/CO2
(4)
CAL
(1)
(3)
(5)
(6)
Figure 2-15 tcpO2/tcpCO2 Module Controls and Connectors
User Controls
1 O2/CO2 Setup Key: This is a single press-key, used to enter the tcpO2/tcpCO2
setup screen.
2 O2/CO2 Setup Indicator: This is a green LED, which will be lit when in the
tcpO2/tcpCO2 Setup Screen.
3 CAL key: This is used to start the calibration process directly when in the Task
Window.
4 CAL Indicator: This LED will be lit when the CAL key is pressed and during
calibration.
Connectors
5 Calibration chamber with gas inlet.
6 A 20-pin connector for use with the tcpO2/tcpCO2 transducer.
Safety
To ensure the safety of the patient, the patient-applied parts are isolated from ground
by optical isolators and a transformer. In addition, the entire module is encapsulated
in plastic.
This module complies with UL544, IED-601-1, CSA C22.2 No. 125. Patient leakage
current is less than 10µA at 120V/60Hz.
Isolated patient connection to Class 1 protection, Type Cardiac Floating (CF).
There is also protection against damage from defibrillation and electro surgery.
2-48
Advanced Plug-In Modules
tcpO2/tcpCO2 Module (M1018A)
tcpO2/tcpCO2
M1018A Module
Exercises
1. The tcpO2/tcpCO2 M1018A Module measures:
a. Partial pressures of oxygen and carbon dioxide
b. Mixed Venous Oxygen
c. Oxygen concentration
2. The tcpO2/tcpCO2 M1018A Module produces a:
a. Graphical and numeric trend information
b. Waveform
c. Numeric Value
3. The tcpO2/tcpCO2 M1018A Module Relay performs which of the following
functions?
a. Manages light intensity
b. Routes the O2 and CO2 signals to the multiplexer
4. The tcpO2/tcpCO2 M1018A Module uses which kind of connector?
a. Standard 12-pin
b. Standard 3-pin
c. 20-pin
Answers
1. a
2. a
3. b
4. c
Advanced Plug-In Modules
2-49
SvO2 Blood Gas Measurement
SvO2 Blood Gas Module Concepts (CMS only)
SvO2 Blood Gas Measurement
Description
SvO2 blood gas measurements indicate the amount of mixed venous oxygen
saturation in a patient.
The SvO2 blood gas measurement is an indication of the amount of oxygen a patient
is consuming and how well the heart is working.
Concepts
Blood gas concepts important to this section are:
•
Measurement
Principle
Oxygen Saturation- The amount of dissolved oxygen in a blood sample.
The SvO2 measurement is based on the progressive change in color of the blood from
scarlet to purple as oxygen saturation decreases.
Light of different selected wavelengths illuminates the blood. The light is absorbed,
refracted, and reflected by the blood. The amount of light detected depends on the
blood’s color and, from this information, the venous oxygen saturation is obtained.
Measurement
Acquisition
The mixed venous oxygen saturation measurement is continuous and invasive, using
a fiber optic catheter. The catheter is usually combined with the C.O. pulmonary
artery catheter (Swan-Ganz) and routed via the right side of the heart into the
pulmonary artery.
Measurement
Output
The SvO2 reading is depicted as a numeric value. A trend and a displayed light
intensity are displayed in the Task Window.
Criteria for Proper
Measurement
Factors affecting accurate measurements of SvO2 are:
Plug-In Modules
2-50
•
Proper connection between the measurement module and the patient’s blood
catheter
•
Positioning of the catheter.
The M1021A SvO2 Plug-in Module measures mixed venous oxygen saturation.
Advanced Plug-In Modules
SvO2 Blood Gas Measurement
SvO2 Blood Gas
Measurement
Exercises
1.SvO2 blood measurement is an indication of:
a. amount of CO2 in the blood
b. amount of mixed venous oxygen saturation
c. amount of Fractional Oxygen in the blood
2. SvO2 blood measurement uses a technique based on:
a. the polographic method
b. progressive change in blood color
c. amount of partial pressure exerted
3. SvO2 blood measurement is displayed as a:
a. numeric value
b. waveform
c. fraction
4.What factors can influence the accurate measurement of SvO2?
a. temperature of patient’s blood
b. amount of water vapor in patient’s blood
c. proper connection between the measurement module and the patient
Answers
1. b
2. b
3. a
4. c
Advanced Plug-In Modules
2-51
SvO2 Module (M1021A)
SvO2 Module (M1021A)
Description
The SvO2 M1021A Module is a mixed venous oxygen saturation measurement
parameter unit. It is designed to be used with adult, pediatric, or neonatal patients in a
range of Critical Care environments.
Measurements
The SvO2 M1021A Module produces the numerics, trends, and a displayed light
intensity for the mixed oxygen saturation value.
Components
The SvO2 M1021A Module consists of the following major functional components:
Table 2-8 Major SvO2 Module Components
Block Diagram
2-52
Component
Description
Analog-to-Digital Converter
Converts the signal from the Optical Module.
Data Flow Manager
(Analog CPU)
Receives and processes signal from the A/D converter
and checks the heater, LED current, and fuse
functions.
Data Processor
(Algorithm CPU)
Receives the first-level averaged data and calculates
the SvO2 measurement.
Data Communication Circuitry
Processes the signal and sends it to the rack interface.
Figure 2-16 shows the block diagram of the recorded patient signal flow through the
SvO2 M1021A Module.
Advanced Plug-In Modules
GND
GND
GND
Serial
Com.
-9V
+12V
-12V
LED
Currents
To Optical
Module
INPUT
CONNECTOR
Ser. Com.
Optical
Module
Presence
Detector
Heater
Control
Driver
LED
Test
Circuitry
Mux
-12V
Offset and
Ambient
Light
Compensation
PreAmpl
Timing
Control
S&H
A
D
Disable
Analog
LED FAULT
CPU
HEATER FAULT
(6805)
AGC
DATA
CONTROLS
EEPROM
8KX8
Parallel
IF
+5 V
+12V/-12V
+7.5V/-7.5V
Parallel
IF
Watchdog
DC VOLTAGE
RAM 8K
Algo.
CPU
(6303)
EEPROM
32KX8
DC
DC
60V
OptoCoupler
P
CPU
80C51
EEPROM
u
Analog
Signal
+60V FROM
RACK
RACK
FROM/TO
SvO2 Module (M1021A)
Figure 2-16 SvO2 M1021A Module Block Diagram
Advanced Plug-In Modules
2-53
SvO2 Module (M1021A)
Theory of Operation
The major actions that the electrical signal must pass through in order to reach the
Monitor interface:
1 The signal is obtained by the Abbott catheter and processed by the Abbott Optical
Module (50131-04) used with the M1021A SvO2 Module.
There are three light emitting diodes in the Optical Module. Each diode emits a
light with a specific wavelength at a frequency of 244 pulses per second through a
single fiber-optic filament within the catheter. The light illuminates the blood at
the fiber tip. The blood absorbs, refracts, and reflects the light. The reflected light
is collected by the aperture of a second fiber-optic filament within the catheter and
returned to the photodetector in the Optical Module. The photodetector converts
the light sample into an analog signal. This signal is then amplified and
transmitted to the SvO2 Module by the signal amplifier.
An EEPROM in the Optical Module stores:
• up to 15 minutes of parameter related physiological data.
This stored data can be recalled and displayed.
• all calibration constants
2 The signal gets processed in the SvO2 Module by going through four distinct
stages:
• Signal Conversion (analog-to-digital)
• Data flow manager (Analog CPU)
• Data Processing (Algorithm CPU)
• Data communication processing (Module - rack interface)
3 Signal Conversion - the analog signal that represents the three reflected
wavelengths from the Optical Module is amplified by a variable gain stage and
then converted into a digital signal by the analog-to-digital (A/D) converter. This
digital signal is passed via the Data Flow Manager (Analog CPU 6805) for the
Data Processor (Algorithm CPU 6303).
4 Data Flow Manager (Analog CPU) - The primary functions of the Analog CPU
(6805) are as follows:
• collection and first level averaging of the data received
from the A/D Converter
• gain Control of the analog processing channel
• low-level EEPROM memory for driver functions
• performs self-test which checks the heater, LED current,
and fuse functions of the module
2-54
Advanced Plug-In Modules
SvO2 Module (M1021A)
5 Data Processor (Algorithm CPU) -the Algorithm CPU (6303) receives the firstlevel averaged data from the Analog CPU and calculates the SvO2 measurement
value. The oxygen saturation is derived based on the relative signal intensity ratio
of each reflected wavelength. The resulting value is passed to the data
communication processing circuitry of the module.
The Algorithm CPU is also responsible for managing light intensity data and
generating light intensity alarms.
6 Data Communication Processing - The parallel signal (SvO2 value) from the
Algorithm CPU is converted to a serial signal. This signal is passed via the data
communication processing circuitry to the rack interface of the CMS.
The EEPROM stores the settings transfer data which it receives from the CMS for
module transport purposes.
SvO2 M1021A
Features
Figure 2-17 shows the user controls and connectors for the SvO2 M1021A Module.
Refer to this figure for the User Controls and Connector descriptions.
SvO2
M1021A
T
(4)
(2)
SvO2
CAL
(3)
(1)
20
PIN
(5)
Figure 2-17 SvO2 Module Controls and Connectors
User Controls
1 Setup Key: This is a single-press key, used to enter the SvO2 setup screen.
2 Setup Indicator: This is a green LED, which will be lit when in the SvO2 setup
screen. If, after pressing the setup, key the LED is not lit, the system is busy and
the SvO2 setup screen cannot be entered. The setup key must be pressed again.
3 CAL key: This is a single-press key used to enter the module’s calibration screen
and initiate SvO2 calibration procedures.
Advanced Plug-In Modules
2-55
SvO2 Module (M1021A)
4 CAL Indicator: This is a green LED, which is lit during an SvO2 calibration
procedure.
Connectors
Safety
This is a customized 20-pin connector for use with the Abbott Optical Module.
To ensure the safety of the patient, the patient-applied parts are isolated from ground
by optical isolators and a transformer. In addition, the entire module is encapsulated
in plastic.
This module complies with UL544, IEC-601-1, CSA C22.2 No. 125. Patient leakage
current is less than 10µA at 120V/60Hz.
Isolated patient connection to Class 1 protection, Type Cardiac Floating (CF).
There is also protection against damage from defibrillation and electrosurgery.
2-56
Advanced Plug-In Modules
SvO2 Module (M1021A)
SvO2 M1021A
Module Exercises
1. The SvO2 M1021A Module measures:
a. Carbon Dioxide
b. Mixed Venous Oxygen
c. Oxygen concentration
2. The SvO2 M1021A Module produces a:
a. Fraction Value
b. Waveform
c. Numeric Value
3. The SvO2 M1021A Module Data Flow Manager performs all but which of the
following functions?
a. Manages light intensity
b. Performs self-tests to check the heater
c. Receives data from the A/D Converter
4. The SvO2 M1021A Module uses which kind of connector?
a. Standard 12-pin
b. Customized 20-pin
c. Standard 3-pin
Answers
1. b
2. c
3. a
4. b
Advanced Plug-In Modules
2-57
Blood Analysis Measurement
Blood Analysis Module Concepts
Blood Analysis Measurement
Description
Depending on cartridge configuration, the concentration of a combination of
electrolytes, blood gases and other analytes in whole blood is determined. A detailed
description of each analyte and its clinical relevance can be found in the i-STAT
System Manual in the Cartridge and Test Information section.
Concepts
Blood analysis concepts important to this section are:
Measurement
Principle
•
Plasma - the fluid component of blood; a solution of proteins (approx. 7%), salt
(approx. 0.9%) and glucose (approx. 0.1%) in water.
•
Whole blood - blood that has not been separated into its components such as
leukocytes, red blood cells, plasma or platelets.
•
Electrolyte - a substance that yields ions in solution so that its solutions conduct
electrolytes.
There are three types of electrodes incorporated into the cartridges:
• Potentiometric
• Amperometric
• Conductometric
These are all thin film electrodes microfabricated onto silicon chips. Sensing
functionality is imparted to each electrode by a number of chemically sensitive films
coated over the active region of the electrodes.
Potentiometric
Measurements
Potentiometry is the measurement of the difference in potential that exists between an
indicator electrode and a reference electrode. Ion-selective electrodes (ISE) are
examples of potentiometric systems. The indicator electrode is designed to be
sensitive to a particular ion in a solution. In cases where other ions are sensed by the
system, selectivity coefficients can be used to correct for this interference. An enzyme
can be added to an ISE to produce ions from other analytes.
The Nernst Equation
The Nernst equation relates the measured potential to the activity of the ion being
measured.
E=E° + RT/nF ln a
2-58
Advanced Plug-In Modules
Blood Analysis Measurement
Where E is the potential, E° is a constant dependent on the electrode/sensor system, R
is the gas constant, T is the absolute temperature, F is Faraday’s constant and n is the
valance or charge, either positive or negative, for the ion being measured, and a is the
activity of that ion.
The Nernst equation can be rewritten as:
E=E° + S log a
Where S replaces the constant terms which define the slope of the sensor. The slope is
the change in millivolts per tenfold change in activity. For a positively charged
monovalent ion, the theoretical slope would be 59.16mV at 25°C.
When the potential for a calibrant, with known activity, and a sample are measured,
the activity of the sample can be calculated from
Esample - Ecalibrant = S log (asample/acalibrant)
Complex solutions such as blood, deviate slightly from Nernstian behaviour due to
interfering ions and matrix effects which result in junction potentials. By including
selectivity coefficients in the Nernst equation (Nikolsky equation) these effects can be
minimized. By characterizing the reference electrode in different solutions, effects of
matrix on the reference junction potential can also be minimized.
Activity versus Concentration
Ion-selective electrodes measure activity rather than concentration. Activity (a) is
related to concentration (c) through the activity coefficient (γ): a = γ c.
While ion activities, which reflect free rather than total ion concentrations, are
physiologically important, activity values are converted to conventional concentration
units so that values obtained by direct ISE can be compared to values obtained from
indirect (diluted) ISE methods which have activity coefficients close to unity or one,
and to flame photometric, atomic absorption and titration methods, all of which
measure total ion concentration.
Amperometric
Measurement
Conductometric
Measurement
In amperometric measurements, a potential is applied to the measuring electrode
while current generated by the oxidation or reduction reactions in the test system is
measured. The current generated is directly proportional to the concentration of the
analyte. Concentration can be calculated using:
•
the known value of the analyte in the calibrant
•
the measured current generated by the analyte in the calibrant
•
the measured current generated by the analyte in the test solution.
The conductometric measurement involves the application of an alternating current to
the test solution. In aqueous solutions, conductivity is dependent upon the
concentration of electrolytes, with an increase in the electrolytes causing an increase
in conductivity. In whole blood, the plasma conducts electricity while the cellular
Advanced Plug-In Modules
2-59
Blood Analysis Measurement
constituents, red and white blood cells and platelets, do not. As the number of cells
per unit volume of plasma increases, the conductivity of the sample decreases. Cell
concentration can be calculated using:
Measurement
Acquisition
•
the known electrolyte concentration of the calibrant
•
the measured electrolyte concentration of the sample
•
the measured conductivity of the calibrant, and
•
the measured conductivity of the sample.
Measurements are performed on undiluted specimens of whole blood. Undiluted
methods are also called direct methods while methods requiring dilution of the
sample are called indirect methods.
It is known that direct methods read up to 7% higher than indirect methods for
electrolytes because of the excluded volume occupied by plasma protein and lipids.
Typically, however, the elevation of results is less than the full 7% because some of
the analyte is bound to protein and other ions and is not assayed by direct methods.
Indirect methods measure the total molar concentration of analyte per unit volume of
plasma. Direct methods measure the total molar activity of analyte (apparent or free
ion activity) per unit volume of plasma water. It is understood that the direct method
result is the clinically significant result for electrolytes, and when there is
disagreement between methods, such as when the patient has abnormal total protein
or lipid levels, it is due to an interference on the indirect method.
At normal levels of protein and lipids the systematic offset between methods is often
corrected for in commercial direct measuring instruments so that the normal ranges
for all instruments are in agreement. Sensor outputs have been set so that normal
ranges are in agreement with indirect reference methods at normal levels of total
protein and lipids.
Direct measurement of hematocrit by the conductometric technique gives a result
related to the non-conducting excluded volume fraction of the sample fluid. Red
blood cell volume is the predominant component of the non-conducting volume, but
proteins, lipids and white blood cells also contribute. Elevated hematocrit readings
are expected at abnormally elevated levels of these components. Decreased
hematocrit readings are expected at abnormally low levels of protein, such as found in
samples taken from patients on perfusion pumps.
Osmotic imbalance causes a discrepancy between direct (conductometric, spun) and
indirect (Coulter) measurements, because of variation in mean cell volume in vivo.
Measurement
Output
2-60
The analysis results are depicted as a numerics listing with the cartridge type and
sample type shown at the top. The measured parameter results are displayed together
with the corresponding units. Calculated results are marked with a’ for example
’HCO3. Temperature adjusted values are marked with an &, for example &PCO2.
Advanced Plug-In Modules
Blood Analysis Measurement
Figure 2-18 Blood Analysis Results Window
Negative Factors
Affecting Proper
Measurement
The main factors affecting accurate blood analysis results are:
•
Not remixing the sample. If the cartridge is not filled immediately after drawing
blood, the blood must be remixed thoroughly. (Mix tubes by gentle inversion 7
times and syringes by rolling between the palms for at least 5 seconds in two
directions.)
•
Exposing the sample to air when measuring pH, PCO2 and PO2
•
Time delays before filling the cartridge
•
Drawing a sample from an arm with an I.V.
•
Samples collected in vacuum tubes with anticoagulant other than lithium or
sodium heparin
•
Syringe for pH, PCO2 and PO2, with air bubbles in sample
Advanced Plug-In Modules
2-61
Blood Analysis Module (M1022A)
Blood Analysis Module (M1022A)
Description
The Blood Analysis Module M1022A uses blood analysis technology from i-STAT®
Corporation. The module is used together with i-STAT single-use, disposable
cartridges for point-of-care determination of specific analytes in whole blood.
Measurements
Depending on the cartridge configuration, a subset of the following measured and
calculated values will be displayed:
Measured
Calculated
Components
pCO2
pO2
pH
Glucose
Sodium
Potassium
Chloride
Ionized Calcium
BUN or Urea
Hematocrit
HCO3
Base excess (BE)
Oxygen Saturation (sO2)
Anion Gap
Hemoglobin (Hb)
Total Carbon Dioxide (TCO2)
The Blood Analysis Module M1022A consists of the following major functional
components:
Table 2-9 Major Blood Analysis Module Components
Block Diagram
2-62
Component
Description
Mechanical System
A DC gear motor drives all mechanical system parts.
Sensor Interface
Amplifies the signals from the sensors so that they
can be further processed by the main electronic
circuits.
Analog to Digital convertor
An A/D convertor converts all analog signals into
digital form for input to the microprocessor. An
analog signal multiplexer makes it possible for the
microprocessor to measure eight different types of
analog signals.
Figure 2-20 shows the block diagram of the blood analysis module
Advanced Plug-In Modules
AC Conductivity
AC
Conductivity
Thermistor and
Interface Circuit-
Pressure Transducer and Interface Circuitry
AC Conductivity
Thermal Subsystem
Cartridge Connector
Thermal System
Actuation
Amperometric
Applied Voltage
Cartridge
Heater
Circuit
Digital-toAnalog
Converter
Analog-toDigital
Converter
Clock
Connector
Actuation
Digital Identification Signal
DC
Motor
Motor
Driver
Circuit
RS 232
Fan
Dual
Port
RAM
Fan Control
Frontend
Link
Calibrant
Delivery
Actuation
Cartridge
Latch
Mechanical System
Microprocessor
Control System
EEPROM
60 volt
EPROM
Sample
Delivery
Actuation
RAM
Lithium Battery
DC/DC
Converter
Motor Speed
Sensor Interface
Circuit Board
Amperometric Signals
Motor Feedback Signal
Motor Power
Cartridge Heater Power
Digital Power
Analog Power
Analog
Multiplexer
Power Supply
Digital Power
6.5 volt
Upgrade
Connector
(rear side)
CMS
Standard
Frontend Link
Blood Analysis Module (M1022A)
.
Module Key/LEDs
Potentiometric Signals
Cartridge Temperature Signals
Figure 2-19 BAM Module - Hardware Block Diagram
Advanced Plug-In Modules
2-63
Blood Analysis Module (M1022A)
Theory of Operation
1 Electrical signals from the sensors on the cartridge are conducted from the contact
pads, through the internal connector in the module, to the sensor interface circuits.
These circuits amplify the signals from the sensors so that they can be further
processed by the main electronic circuitry.
Four signals are relayed to the main electronic circuits:
• a multiplexed potentiometric signal line
• a multiplexed amperometric signal line
• an AC fluid conductivity signal
• a digital identification code for the type of cartridge
2 An analog-to-digital convertor converts all analog signals into digital form so that
the microprocessor can process the signals. An analog signal multiplexer makes it
possible for the microprocessor to measure eight different types of analog signals:
• the potentiometric signals from the sensor interface
• the amperometric signals from the sensor interface
• a DC conductivity signal
• the power supply voltage
• a thermistor signal representing the internal temperature of the module
• a motor feedback signal used to control the speed of the mechanical
motion
• cartridge temperature signals used to control the cartridge temperature
to 37°C
• a pressure transducer signal representing the barometric pressure of the
environment
3 The microprocessor control system manages all functions of the module. It
accesses three types of memory storage devices. “FLASH” EPROM stores the
software in the module. The RAM, which is backed up by an internal lithium
battery, is used for temporary storage of sensor signals measured during operation
and for storage of test records. Another EEPROM stores factory calibration
information, the instrument serial number and a cumulative count of uses. Neither
of the EEPROMS rely on the lithium battery for maintaining information.
4 The module creates and applies two types of signals to the sensors: a digital-toanalog convertor generates a voltage which is applied to amperometric sensors,
and the AC conductivity circuit generates an AC excitation signal which is
applied to the conductivity sensors. The digital-to-analog convertor also provides
voltages to the motor driver circuit.
5 A DC motor drives all the mechanical system components:
2-64
Advanced Plug-In Modules
Blood Analysis Module (M1022A)
• a connection actuator which brings the module internal connector into
contact with the contact pads on the cartridge
• a calibrant delivery system
• a sample delivery system
• a thermal system actuator which brings the module’s thermal
controller into contact with heater elements on the back of the
cartridge.
In addition, a latching mechanism locks the cartridge in place upon insertion.
Blood Analysis
Features
Figure 2-20 shows the user controls and connectors for the Blood Analysis M1022A
module. The descriptions of the numbered items are below the figure.
Figure 2-20 Blood Analysis Module Controls and Connectors
User Controls
1 Blood Analysis Setup Key: This is a single-press key used to enter the Blood
Analysis setup screen. If no measurement is running when the key is pressed, you
will enter the Blood Analysis window where the results of the last measurement
are displayed.
2 Blood Analysis Setup Indicator: this is a green LED which will be lit when in
the Blood Analysis screens.
3 Cartridge Locked Indicator: This green LED will be blinking when a cartridge
is being processed in the module. The cartridge must remain in the module until
the LED goes off, showing that the analysis is complete.
Connectors
4 The cartridge slot where a cartridge is inserted for processing.
Advanced Plug-In Modules
2-65
Blood Analysis Module (M1022A)
5 (Rear Panel) RS232 connector for upgrade purposes
Safety
Blood Analysis
Module - Software
Update
Requirements
There are no patient-applied parts in the Blood Analysis Module. This module
complies with UL544, IEC 601-1, CSA C22.2 No. 125-M84
The software is divided into two parts - the application software and the
standardization software (CLEW). Software updates are required regularly to reestablish standardization values. Each update is delivered to the customer with full
instructions for performing the update on the module. The delivered software consists
of DOS executable files and does not require any other files to run.
The software can be run on a Central Data Station or another IBM-compatible PC.
The connection to the module requires:
a) with CDS - connecting one of the RS232 cables (for IR Links) to the module
b) with an IBM-compatible PC - connecting a special adapter connector (M3663A
for standard PC COM1) and modular data cable (e.g. M3642A #A03) to the
module.
2-66
Advanced Plug-In Modules
Blood Analysis Module (M1022A)
Blood Analysis
Module Exercises
1 What type of sample does the Blood Analysis module require?
a. Plasma
b. Diluted whole blood
c. Undiluted whole blood
2 How are calculated results indicated on the results screen?
a. Marked with?
b. Marked with *
c. Marked with ‘
3 In amperometric measurements a current is generated by oxidation or reduction
processes in the test system. Is the current generated?:
a. Directly proportional to the concentration of analyte
b. Inversely proportional to the concentration of analyte
c. Inversely proportional to the concentration of red blood cells
4 The connector for making software updates is situated:
a. On the front of the module
b. On the module rack
c. On the rear of the module
Answers
1. c.
2. c.
3. a.
4. c.
Advanced Plug-In Modules
2-67
VueLink Module
VueLink Module Concepts
VueLink Module
Description
The VueLink Module is used to connect an external device (such as a ventilator, gas
analyzer, or stand-alone parameter monitor) to the CMS. The module provides a
combined RS232 and analog interface to collect information from external devices
that can be displayed, recorded, and trended on the system.
There are three different VueLink Module options:
1.
2.
3.
Measurements
Auxiliary - connects external stand-alone parameters to the monitor
Ventilator - connects ventilators to the monitor
Gas Analyzer - connects gas analyzers to the monitor
VueLink Modules fall into two basic types:
Type A - can show up to 1 wave and 2 numerics
Type B - can show up to 2 waves and 6 numerics
Each module option is a fixed type as shown in the following table:
Ventil.
A
Aux.
Plus
B
Waves
1
Numerics
2
Option:
Type:
Aux
B
Gas
Analyzer
B
Anesthesia
Machine
B
2
2
2
2
6
6
6
6
Each module enables only one external device to be connected at any one time, but
supports the connection of several devices within a device group.
2-68
Advanced Plug-In Modules
VueLink Module
Components
The VueLink Module consists of the following major functional components:
Table 2-10 Major VueLink Module Components
Block Diagram
Component
Description
Microprocessor
Controls the overall calculations and
communication.
Input Protection Network
Provides ESD protection and protection against
defibrillator voltage transients.
RS232 Driver
Converts the internal logic level to the RS232 level
and vice- versa.
Digital Interface
Acquires data from external devices (ventilators,
gas analyzers, etc.).
Analog Interface
Provides eight analog channels consisting of up to
two wave channels, five numeric channels, and
one alarm channel.
Figure 2-21 shows the block diagram of the signal flow through the VueLink Module.
Advanced Plug-In Modules
2-69
EAROM
2-70
Advanced Plug-In Modules
SWITCHES
INPUT
ROM
RAM
MULTIPLEXER
ANALOG
DRIVER
RS232
8 MHz
8 MHz
SETTINGS
ADC
AMPLIFIER
PORT
PARALLEL
&
UART
OF
(START
SOC
1
CLIPPING
OFFSET &
2
A-D CONVERTER
DUAL-SLOPE
CONVERSION)
0
COUNTER
+1.0V (REF.)
+5.0V (REF.)
GND
+5V
-7V
+7V
-12V
+12V
ADC_INT
UART_INT
WATCH DOG
8 MHz
16 MHz
NON-FLOATING
INPUT PROTECTION
NETWORK
ANALOG & DIGITAL
INPUT SIGNALS
Figure 2-21 M1032 VueLink Module Block Diagram
TRANSFORMER
HIGH ISOLATION
COUPLER
OPTO
FLOATING
COMMUNICATION
SERIAL
MICROPROCESSOR
DATA BUS
RXM/TXM
ALTERNATOR
:2
(16MHz)
OSCILLATOR
PGND
SYNC
+60V
VueLink Module
VueLink Module
Theory of Operation
The electrical signal must pass through three major sections of the Vuelink module,
which are:
1
The Microprocessor which, in conjunction with the ROM, RAM, EPROM, and
control logic, performs the following functions:
• Controls the input signal paths: the input switches connect
the digital signals to the RS232 UART and the analog
signals to the multiplexer
• Controls the analog multiplexer and the Analog-to-Digital
converter
• Communicates with the RS232 UART
• Communicates with the rest of the CMS via the module
link
• Converts external device-specific protocols to the internal
standardized CMS protocol by using Device Drivers
which are device-specific protocol translators.
• Controls the downloading and Flash-EPROM
programming of device drivers via the built-in RS232
interface. A Flash-EPROM is used instead of a ROM or
EPROM; the capacity of the EPROM supports several
device drivers, and up to three device drivers can be
selected by the user.
2 The RS232 Digital Interface, which acquires data from external devices
(ventilators, gas analyzers, etc.). Typically, the data consist of waveforms,
measured values, device settings, alarm status, and alarm and INOP information.
The specific device drivers are converting these vendor/type specific data to the
standardized CMS data types representing waveforms, numeric values, settings,
alarm status, alarms, and INOPs.
3 The Analog Interface, which provides eight analog channels consisting of up to
two wave channels, five numeric channels, and one alarm channel. Each channel
can be adapted individually to the output voltage level of the external device. The
adaptation is executed by hardware gain switching and/or software scaling
controlled by the specific device driver. The alarm channel is also used to identify
a cable disconnect status as long as the active level is different to zero Volts.
The analog input signals are fed from the input connector via the input protection
network, the input switches, and an analog multiplexer to an input amplifier. All
input signals are digitized sequentially using the dual-slope Analog-to-Digital
converter.
M1032A VueLink
Module Features
Figure 2-22 shows the user controls and connectors for the VueLink Module. Refer to
this figure for the User Controls and Connector descriptions.
Advanced Plug-In Modules
2-71
VueLink Module
VueLink
M1032A
T
A
AUXILIARY
VueLink
M1032A
VENTILATOR
NELLCOR N-100C
PB 7200a/ae
CRITIKON 1846
SIEMENS
900C/D/E NEO
T
B
VueLink
M1032A
GAS ANALYZ.
M1025A/B
T
VueLink
B
ANES.MACH.
M1032A
T
B
Dräger
CICERO
VueLink
AUX.PLUS.
M1032A
T
B
(3)
BAXTER
EXPLORER
BAXTER
VIGILANCE
SIEMENS
900C/D/E AD
VueLink
VueLink
VueLink
VueLink
VueLink
60x145
(2)
(1)
(4)
Figure 2-22 VueLink Module Controls and Connectors
User Controls
1 Setup Key: A single-press key used to enter the VueLink setup screen.
2 VueLink Setup Indicator: a green LED, which will be lit when in the VueLink
Setup screen.
3 Labels: giving names of the external devices to which the VueLink Module can
be connected, and an LED beside each label indicating the selected device.
Connectors
Safety
4 12-pin connector for use with external devices.
To ensure the safety of the patient, the patient-applied parts are isolated from ground
by optical isolators and a transformer. In addition, the entire module is encapsulated
in plastic.
This module complies with UL544, IED-601-1, CSA C22.2 No. 125. Patient leakage
current is less than 10µA at 120V/60Hz.
Isolated patient connection to Class 1 protection, Type Cardiac Floating (CF).
There is also protection against damage from defibrillation and electro surgery.
2-72
Advanced Plug-In Modules
VueLink Module
VueLink Module
Exercises
1. The VueLink Module options can be all but which of the following?
a. Liquid
b. Gas
c. Ventilator
2. The Type A VueLink Module can show up to:
a. one wave and six numerics
b. one wave and two numerics
c. two waves and two numerics
3. The VueLink Module RS232 Digital Interface acquires data from the:
a. microprocessor
b. analog interface
c. external devices
4. The labels on the VueLink show the names of:
a. VueLink Setup Screen options
b. external devices to which the Vuelink Module can be connected
c. internal VueLink Module components
Answers
1. a
2. b
3. c
4. b
Advanced Plug-In Modules
2-73
EEG Measurement
EEG Module Concepts (CMS only)
EEG Measurement
Basics
The electroencephalogram (EEG) is the measurement of the electrical activity of the
brain. This activity creates an electrical signal that, depending on the person’s state of
consciousness or well-being, produces characteristic waveforms. Although its origin
is unclear, there is strong evidence that the signal is a summation of the tens of
billions of active nerve cells (neurons) in the brain. The waves seen are generated
from electrical potentials located on the surface of the brain. These potentials are
recorded by placing electrodes on the scalp.
The following terms and concepts are important to understanding EEG monitoring.
EEG Channels
Standard EEG “machines” are capable of recording many channels, 16 to 32 or more.
These channels are produced by electrode placement (see electrode placement).
Routinely, the electrode pairs are placed over specific areas of the brain frontal,
temporal, parietal, occipital, etc. Then, just like ECG monitoring, the voltage
differences between the electrodes are measured.
With most bedside EEG monitors, fewer channels (2 to 8) are recorded. Logic tell us
that the more channels you record, the more information you derive.
EEG Signal
The EEG signal is extremely low voltage, measured in microvolts, compared to the
ECG, which is measured in millivolts. The EEG voltages are very minute and must be
amplified. Since 60 Hz noise is approximately 10000 times stronger, the signal is also
filtered.
Brain Waves
The EEG varies with alterations in the function and metabolism of the brain, but there
are classic characteristics.
•
•
•
•
2-74
Waves - The electrical potentials change in a rhythmic, repeating fashion. These
changes are recorded as waves.
Frequency - The pattern of waves, or rhythm, is called the frequency, and is
expressed in Hertz (Hz) or cycles per second.
Amplitude - This is the voltage measurement of the EEG wave from the top of
the peak to the bottom of the peak.
Spike - A spike is a fast wave with steep slopes on each side that may appear
randomly or in bursts. It is an abnormal sign which can indicate the location of
pathology. It’s often seen with epilepsy or enflurane overdose.
Advanced Plug-In Modules
EEG Measurement
The changes in the EEG waves can be:
•
•
•
Background - The pattern indicating what the brain is doing all the time.
Transient - A single wave, such as a spike, that differs from the background
pattern.
Paroxysmal - A sudden burst of change, such as multiple spikes, which return to
normal.
Though it takes significant training to provide a clinical interpretation of the EEG,
some basic techniques used to describe the EEG can be mastered and used to
communicate changes in the EEG. The four areas used to describe the EEG are
frequency, amplitude, symmetry and patterns.
Frequency
Specific brain wave patterns are recognized by analyzing the EEG signal in
relationship to its frequency and amplitude. Most EEG signals are in the 1 to 30 Hz.
range.
The four most common frequency bands for classifying EEG signals are Beta, Alpha,
Theta and Delta.
Alpha
Alpha waves are what the spontaneous EEG looks like in the normal, awake, relaxed
with eyes closed adult. It has the appearance of rather large, smooth, and rhythmic
waves. These waves suggest a high degree of electrical coordination even in the idle
brain.
Alpha frequency is defined as 8 to 12.5 Hz.
Advanced Plug-In Modules
2-75
EEG Measurement
Beta
During periods of conscious effort, the EEG rapidly desynchronizes and is replaced
by the low amplitude, high frequency “jumbles” of Beta.
Beta frequency is defined as 13 to 30 Hz.
Theta
Theta waves are usually not seen in the awake alert adult except in the presence of
pathology. They can also be seen in certain stages of anesthesia.
Theta frequency is defined as 4 to 8 Hz.
Delta
Likewise, Delta waves are usually not seen in the awake alert adult except in the
presence of pathology, coma and certain stages of anesthesia.
Delta frequency is defined as 0.5 to 4 Hz.
2-76
Advanced Plug-In Modules
EEG Measurement
Amplitude
Amplitude refers to the height of the EEG and is measured in microvolts.
•
•
•
Low Amplitude:
< 20 microvolts
Medium Amplitude: 20 to 50 microvolts
High Amplitude:
> 50 microvolts
Symmetry
The EEG is generally symmetrical over both hemispheres. Anesthetics and metabolic
problems affect the hemispheres symmetrically. Where there is a loss of symmetry,
there may be pathology or ischemia in one of the hemispheres.
Patterns
Many things can change the EEG. The most common things that change the EEG are
drugs, seizures, cerebral ischemia and coma.
Drugs
Most anesthetics have an effect on the EEG since the target organ of their action is the
brain. Typically as the dose increases the EEG initially slows and the amplitude
increases, followed by a decrease in amplitude until the EEG becomes isoelectric.
However, some anesthestics cause the normally continuous EEG to break up into
successive bursts with periods of almost flat EEG in between. This is called burst
suppression and is seen with barbituates used for brain suppression.
•
•
•
Seizures
EEG is the definitive way to diagnose a seizure. Seizures come in many different
varieties but many start with a rhythmic pattern in one or a few channels and progress
to a very high amplitude pattern and then back to the pre-seizure EEG. Some seizures
have a period of almost flat EEG following the seizure.
•
•
•
•
Coma
Rhythmic pattern
Gradual build
Multiple channels with high amplitude
Return to normal or a brief isoelectric period
There are several patterns that can be seen in coma depending on the etiology, depth
and prognosis of the coma. In most comatose states there is a diffuse slowing of the
EEG. In general a variable EEG is a good prognostic sign and monotonous EEG is
considered a poor prognostic sign.
•
•
•
•
Cerebral Ischemia
Initial amplitude increases and frequency slows
Decreases in amplitude
isoelectric and/or burst suppression
Patterns depend on the etiology, depth and prognosis of coma
Generalized slowing
Variable EEG = Good prognosis
Monotonous, invariable EEG = poor prognosis
Lack of oxygen or hypoxia to the entire brain causes a generalized slowing over the
entire cerebral cortex. Slowing of the EEG one area of the brain is seen in embolic
Advanced Plug-In Modules
2-77
EEG Measurement
phenomenon such as stroke or clamping of the carotid artery. If prolonged the EEG
becomes isoelectric or flat.
•
•
•
2-78
Generalized slowing if hypoxic
Focal slowing if ischemic event
Progresses to isoelectric if prolonged
Advanced Plug-In Modules
EEG Module
EEG Module
Description
The M1027A EEG Module monitors the patient’s cerebral function by measuring the
electrical activity of the brain. EEG monitoring assists in diagnosing many
neurological illnesses and diseases, such as epilepsy, tumor, cerebrovascular lesions
(e.g. seizures). ischemia and problems associated with head trauma.
In the Operating Room, EEG monitoring provides a record of the adequacy of
anesthesia and information about cortical blood flow.
Measurements
The EEG module produces two channels of EEG realtime waves which can be
displayed and recorded. They are labeled EEG1 and EEG2. For each channel, the
following eight numerics are calculated:
•
Spectral Edge Frequency (SEF) -The frequency below which a defined
percentage (configurable) of the total power lies.
•
Mean Dominant Frequency (MDF)
•
Peak Power Frequency (PPF) - The frequency with the highest power.
•
Total Power (TP) - Power content of a channel, i.e. the voltage squared over an
impedance of 1 ohm.
Percentage of total power in each frequency band:
•
Alpha - Alpha waves represent the EEG in a normal awake adult. Their frequency
is defined as 8-13 Hz.
•
Beta - Beta waves represent the EEG during periods of conscious effort. Their
frequency is defined as 13 to 30 Hz
•
Theta - Theta waves are usually seen in the presence of pathology. Their
frequency is defined as 4 to 8 Hz
•
Delta - Delta waves are seen in the presence of pathology, coma and certain stages
of anesthesia. Their frequency is defined as 0.5 to 4 Hz
Two of these numerics can be selected for continuous display, trending and recording.
The selected numerics are displayed in large digits next to their respective wave. If
one of the selected numerics is a frequency (i.e. SEF, MDF or PPF), a trend line for
this frequency will be displayed in the Compressed Spectral Array (CSA). See section
below for details.
Advanced Plug-In Modules
2-79
EEG Module
Components
The EEG Module consists of the following major functional components:
Table 2-11 Major EEG Module Components
2-80
Component
Description
Input Preamplifiers
The input preamplifiers provide high impedances
to the electrodes connected to the patient's head.
They pre-amplify the input lead signals
analogically. They achieve pre-filtering of the
input lead signals in order to perform an antialiasing function prior to digitizing the signals.
Analog to Digital Converter
The analog to digital converter converts each
single electrode voltage delivered from the input
preamplifiers into digital form and transmits the
results to the system central processing unit
(CPU).
Impedance Measurement Signal
Generator
The impedance measurement signal generator is
made up of two AC-currents of different
frequency. The CPU generates said frequencies.
The voltages are converted into two very small
currents fed into the electrodes.
Central Processing Unit (CPU)
The central processing unit (CPU) processes all
input signals from the EEG electrodes. It filters
said signals, calculates the compressed spectral
array data and derives the single electrode
impedance measurement values. The CPU
provides a small multi-tasking internal operating
system to control internal and external appliances.
It controls the non-volatile read / write storage
device and ensures the system integrity, i.e. it
detects possible failure conditions and generates
appropriate error messages. All system events are
handled and it acts as an interface between the
plug-in module and the CMS.
Isolation
Two functions are performed by the isolation
block: It delivers the necessary power from the
CMS to the plug-in module and its optical
communication path for the data transfer from the
CMS and to the CMS. It isolates the patient
electrically from the CMS.
Advanced Plug-In Modules
EEG Module
Block Diagram
Electrode and
Impedance Signals
Figure 2-21 shows the block diagram of the signal flow through the EEG Module.
Input Preamplifiers
Analog to Digital
Converter
Impedance
Measurement
Signal Generator
System CPU
Isolation
To CMS
Theory of Operation
Introduction
There are drawbacks to continuously monitoring the raw EEG signals with
conventional EEG machines. These include the need for constant analysis of the
waves by a skilled technician and the acquisition of volumes of recording paper.
Therefore the use of computerized processing, called frequency analysis, is the
method of choice.
Frequency analysis takes the raw EEG waves, mathematically analyzes them and
breaks them into their component frequencies. The method of doing this is called Fast
Fourier Transform or FFT.
FFT
In Fourier analysis, changes in the EEG are more easily detected because the original,
complex signal is digitized for computer analysis and converted into a simplified
waveform called a spectrum. It is then separated into frequency bands: delta (<4 Hz),
theta (4 to 8 Hz), alpha (8 to 13 Hz), and beta (>13 Hz). The redistribution of
electrical activity in the brain among certain frequency bands or the predominance of
one band over the others correlates with specific physiologic and pathologic
conditions.
FFT Computation
To compute the FFT, the module samples the continuous EEG signal periodically and
stores the value. Then by using a number of samples, the distribution of energy at
each frequency is computed. This results in a frequency spectrum for each sample.
Advanced Plug-In Modules
2-81
EEG Module
Compressed Spectral
Array
After processing the EEG by FFT, the resulting spectrum is displayed. The method of
display is Compressed Spectral Array (CSA). CSA compresses a large amount of data
into a compact, easy to read trend.
The CSA “stacks” each sample’s spectrum one right below the other, usually at 2
second intervals. Hidden lines are removed for clarity. This way, it’s easy to pick up
changes in the frequency and amplitude of each sample over longer periods of time.
0Hz
10
20
30
Figure 2-23 Compressed Spectral Array (CSA)
2-82
Advanced Plug-In Modules
EEG Module
Impedance
The main quality indicator for the measured EEG signal is the electrode-to-skin
impedance. During normal EEG monitoring, electrode-to-skin impedance is
measured continuously and disconnected electrodes are detected. An INOP message
is displayed if the user-adjustable impedance threshold is exceeded. The impedance
value for each single, independent electrode is displayed in the Electrode Impedance
Task Window and the Electrode Montage Task Window.
EEG Electrode Location
Terminology
The International 10/20 System of Electrode Placement is a procedure for the
measured location of equally spaced electrodes on the scalp. This system is based on
the relationship between the cortical areas of the brain and the location of the EEG
electrodes that reside directly above them.
Electrode
Application
Traditionally there are 21 electrode locations in the 10/20 system. All of these are
needed for diagnostic recordings; however in EEG monitoring a sub-set of these
electrodes may be used to determined the neurological status of the patient.
Each location is marked with a unique letter/number combination. The letters
correspond to the cortical areas of the brain where they are located. The numbers are
odd for the left positions, even for the right positions, and increase as they move away
from the midline (which is designated as Z for zero).
When using a EEG monitor locating the proper place for electrodes can be simplified.
The electrode pair can be marked using landmarks on the head such as the hairline,
ears and top of the head to approximate the 10/20 locations.
A pattern of electrodes on the head and the channels they are connected to is called a
montage. There are many different combinations of electrode pairs. However, when
dealing with a small number of channels there are only a few things you need to
know.
Central
Sulcus
Cz
Fz
Fp1
Frontal
F3
P3
T3
Nasion
Pz
Occ
ipit
al
Parietal
O1
Temporal
Inion
Sylvian
Fissure
Advanced Plug-In Modules
2-83
EEG Module
Front
Fp1
F7
A1
F3
Fp2
Fz
Cz
C3
T3
Pz
P3
F8
F4
C4
P4
T4
T4
A2
T5
O2
O1
Back
International 10/20
They are:
•
•
•
Montages are always symmetrical.
Choose a montage based on clinical setting.
A reference electrode is generally placed on a non-active site such as the
forehead or earlobe.
Front
Reference
Fpz
Fp1
Channel 1
Fp1 - P3
Fp2
+
+
-
-
Channel 2
Fp2 - P4
P4
P3
Back
Montage
2-84
Advanced Plug-In Modules
EEG Module
EEG Module
Features
Figure 2-24 shows the user controls and connector for the EEG Module. The parts are
described following the figure.
(2)
(1)
(3)
Figure 2-24 EEG Module controls and connectors
User Controls
1 Setup Key: This is a single-press key, used to enter the EEG setup screen.
2 Setup Indicator: This is a green LED, which will be lit when in the EEG setup
screen.
Connectors
3 The EEG M1027A uses a standard 12-pin connector for use with an EEG trunk
cable and EEG electrodes.
Safety
To ensure the safety of the patient, the patient applied parts are isolated from ground
by optical isolators and a transformer. In addition, the entire module is encapsulated
in plastic.
This module complies with UL544, CSA No. 125-M1984 (for use with model
M1165/66/75/76) and UL2601-1, CAN/CSA-C22.2 No.601.1-M90 (for use with
model M1167/77), IEC-601-1, IEC-601-2-26. Patient leakage current is less than
10µ A at 120V/60Hz.
It has an isolated patient connection to Class I protection, Type Cardiac Floating (CF).
There is also protection against damage from defibrillation and electro surgery.
Advanced Plug-In Modules
2-85
BIS Measurement
BIS Module Concepts
BIS Measurement
Introduction
The Bispectral Index® (BIS®) 1is a continuous processed EEG parameter that
provides a measure of the state of the brain during the administration of anesthetics
and sedatives. BIS® was designed to correlate with “hypnotic” clinical endpoints
(sedation, lack of awareness and memory) and to track changes in the effects of
anesthetics on the brain. To properly interpret the clinical relevance of BIS®
responses, users should familiarize themselves with this new parameter and its
dynamic changes in response to common interventions.
This section briefly describes the use of BIS® for monitoring the effects of anesthetics
and sedatives. The goal is to provide a concise summary of factors to consider about
BIS® monitoring in order to assure appropriate interpretation and use of the
information provided by this new parameter.
Depth of Anesthesia
Previous research on neurophysiological monitors of “depth of anesthesia” has often
suffered from lack of a clear definition of what constitutes adequate anesthetic depth.
It has been proposed that there are various distinct clinical goals of optimum balanced
anesthesia, hypnosis, lack of recall, analgesia, and muscle relaxation /areflexia
(Figure 2-25).
Awareness/Recall
Hypnosis
Consciousness
Balanced Anesthesia
Analgesia
Autonomic and Somatic
Responses
Areflexia
Reflex Movement
Figure 2-25 Components of Anesthesia
Given these multiple goals, the concept of a unitary “depth of anesthesia” may need
to be revised to reflect the separate clinical components of the ideal anesthetic state.
Consequently, monitoring of anesthesia may require separate measures of each of
these components, i.e. hypnosis, obtunding of responses to noxious stimulation, and
neuromuscular blockade. Current clinical practice relies primarily on vigilant
1. BIS and Bispectral Index are registered trademarks of Aspect Medical Systems
2-86
Advanced Plug-In Modules
BIS Measurement
observation of hemodynamic, autonomic and somatic responses as endpoints for
anesthetic titration. Unfortunately, none of these parameters is a direct measure of
how asleep or awake (“hypnotic”) the patient is. While these physiological signs may
correlate with the hypnotic state in some instances, many factors can interfere with
this relationship:
•
The combination of multiple agents with varying effects and sites of action
•
Synergistic effects of the drugs
•
The cardiovascular and hemodynamic status of the patient
•
The use of drugs that attenuate cardiovascular responses (e.g. vasodilators, alpha
and beta blockers, etc.)
•
The varying amounts of noxious stimulation to which the patient is subjected.
Hemodynamic, autonomic and somatic measures of anesthetic effect react when
stimulus strength significantly exceeds the level of sensory suppression provided
by hypnotics and analgesics, but this dynamic balance can vary considerably
during surgery
•
Dissociation between the dose required to achieve the therapeutic effect
(hypnosis) versus undesired cardiovascular effects. Traditional vital signs provide
a measure of cardiovascular tolerance and indicate when significant autonomic
responses have occurred, but often do not accurately reflect the state of the brain.
This sometimes results in the use of anesthetics to manage the hemodynamic
status of patients rather than their hypnotic state.
Despite the absence of a reliable “depth of anesthesia” measure, the practice of
anesthesia remains one of the safest and most effective in medicine. However, a
quantitative measure which differentiates brain responses from somatic, autonomic
and hemodynamic responses can provide useful information which contributes to
improved safety, effectiveness and efficiency in anesthetic delivery.
Monitoring the hypnotic effects of anesthetics with BIS®, in combination with current
monitored parameters and clinical signs, has been shown to allow better balancing of
hypnotic and analgesic administration. Demonstrated benefits include:
•
Continuous monitoring for the risk of awareness
•
Better management of responses to surgical stimulation
•
More rational selection of drugs
Additional studies have shown that monitoring with BIS® can also aid the anesthetic
provider in delivering the most appropriate doses of hypnotics and analgesics,
resulting in:
•
Faster wake up and recovery
•
More cost-effective use of drugs
•
Fewer unwanted intraoperative responses
Advanced Plug-In Modules
2-87
BIS Measurement
The Bispectral Index
(BIS) and Depth of
Anesthesia
Because BIS® reflects changes in anesthetic dosing, it might be assumed that this
information can be used in isolation to gauge depth of anesthesia. However, utility of
the BIS® depends on the users expectations of “depth of anesthesia” monitoring and
the goals of the particular anesthetic regimen being used. It is recommended that
users integrate the information provided by BIS® with other commonly used
indicators of anesthetic effect to achieve their clinical objectives. In order to facilitate
this process, several performance characteristics must be taken into consideration.
BIS Response to
Commonly Used
Anesthetic Drugs
As a measure of the hypnotic state of the patient, or “depth of hypnosis”, BIS® will
usually decrease when doses of anesthetics are increased and increase when doses are
being reduced. If the drug being used has good hypnotic properties (e.g., propofol,
potent inhalational agents, thiopental, etc.), lower BIS® levels will be observed at
concentrations typically used for general anesthesia (e.g. 1% isoflurane, 150 ug/kg/
min propofol). In the presence of a constant level of stimulation, BIS® thus provides
an excellent pharmacodynamic measure of the individual’s brain response to a given
drug concentration which tracks the clinical state. This means that sensitive patients
will show bigger decreases in BIS® than those who are more tolerant to a given dose,
as demonstrated in an extensive series of volunteer and patient trials. Lower BIS®
values are associated with progressive suppression of brain activity and a
correspondingly lower probability of response to a given stimulus, assuming that the
stimulation is consistent. For example, patients with BIS® levels of 60 are unlikely to
respond to verbal command, but may become aroused when given a painful
stimulation. These clinical arousals (i.e. waking up) of a patient can be followed by
observing increases in the hypnotic BIS® level.
In general, opioids do not have a significant influence on the patient’s state of
consciousness or BIS® at concentrations used to achieve adequate analgesia in
routine general surgery. Opioid analgesics, or regional blocks, can be very effective at
attenuating sensory input, thereby substantially reducing the intensity of stimulation
and preventing subsequent patient responses. If low levels of hypnotics are used in
this situation, patients could be awake or lightly sedated hypnotically (BIS® 70-80)
without exhibiting any signs of inadequate anesthesia as measured by traditional
signs.
Changes in the
Bispectral Index in
Response to Drugs and
Stimulation
2-88
Like cardiovascular and somatic responses, the hypnotic state of patients undergoing
surgery is influenced by the intensity of stimulation that is applied. In the absence of
stimulation, relatively little drug is required to induce and maintain loss of
consciousness. During the course of a surgical procedure, however, the balance
between the intensity of stimulation and sensory suppression may be constantly
changing. Figure 2 presents a simplified diagram outlining how stimulation and
Advanced Plug-In Modules
BIS Measurement
anesthetic suppression may contribute to determining the hypnotic state at any given
point in time.
Sur gic al Stimulation
Baseline Hypnotic Level
Analgesics/ Loc al Bloc ks
(Sensor y Attenuation)
Anesthetics/ Sedatives
(Depth of Hypnosis)
Pe r
e
L ev
o t ic
yp n s io n )
H
t
r es
ge
T a r ( De p
c e iv
ed
(A r St i m
ou s u la
t ion
a l)
Modulated Hypnotic State
BIS
l
Figure 2-26 Factors influencing the modulated hypnotic state during surgery
Painful surgical stimulation can be attenuated by local anesthetics or analgesics at
several levels of the sensory pathway. The resulting amount of stimulation reaching
the brain can then be thought of as the perceived stimulus. A net increase in the
perceived stimulus can lead to a lightening in the patient’s hypnotic state, while a net
decrease can result in a return to deeper hypnotic levels. This phenomenon can often
be seen by observing real-time changes in BIS® when constant anesthetic levels are
being maintained. Oscillations in BIS® can potentially provide a direct measure of the
brain’s response to stimulation and an alternative measure of responsiveness/
reactiveness similar to other vital sign endpoints.
The following example case illustrates several different patterns of BIS® changes
that can occur during a typical anesthetic regimen.
HR
BP Map
200
180
160
140
120
100
80
60
40
20
0
14:23
14:17
14:11
14:05
13:59
13:53
13:47
13:38
13:41
13:22
13:25
13:28
13:16
13:10
13:04
12:58
12:52
12:46
12:40
12:34
12:28
12:22
12:16
pt movement
BP/HR
Propofol Inf. Rate
pt movement
12:10
BIS --- Propofol Inf. Rate/ 10
BIS
100
90
80
70
60
50
40
30
20
10
0
At the start of the case, following rapid sequence induction with propofol and
alfentanil, BIS® falls rapidly from an awake value of 98 to below 50. Conversely, a
rapid rise in the BIS® after propofol is discontinued occurs at the end of the case, just
prior to the time when the patient opens her eyes and becomes responsive. In both
instances, BIS® clearly tracks the expected changes in propofol effect which occur
at these times. Intraoperatively, however, additional types of responses are evident:
•
A slow upward trend (>10 points over several minutes) prior to the two
movement events.
•
A sudden rise (5-30 seconds), such as the increase associated with the second
movement response.
Advanced Plug-In Modules
2-89
BIS Measurement
•
Cyclical oscillations which occur during apparent steady-state anesthetic delivery
conditions.
A slow upward trend in BIS® usually is associated with a progressive lightening of
the hypnotic state. This can be due to one or more of the following factors:
pharmacokinetic redistribution of a drug from its effect site in the brain, as might
occur following a rapid bolus drug administration; a reduction in hypnotic effect due
to a disruption in drug delivery; increased tolerance to the drug effect; or a slow
increase in the level of stimulation. Conversely, a slow downward trend in BIS® can
indicate a deepening of the hypnotic state of the patient. Possible causes include:
reduction in surgical stimulation; hypnotic or analgesic drug accumulation;
inadvertent or unrecognized increases in drug delivery, or progressive hypothermia,
especially as might occur during long cardiac procedures.
When large, abrupt changes in BIS® occur, it is important to rule out that they are
not triggered by artifact. Assuming that there is no obvious artifact, such changes are
usually caused by significant changes in stimulation, resulting in patient arousal.
Users should be cautious about using a particular BIS® value in isolation as a
predictor of such patient responsiveness, because arousal can potentially occur from
any hypnotic level. Anesthetic techniques that rely heavily on hypnotics and use little
or no opioid allow highly variable levels of perceived stimulation, which can arouse
the patient even if the BIS® is low. This causes a rapid hypnotic lightening, reflected
by a significant increase in the BIS®. Such increases in BIS® can occur prior to the
appearance of other clinical signs, such as hypertension or movement, but in some
cases the 30-second time averaging used in the display of BIS® data may result in
some lag in tracking this response. In contrast, a sudden reduction in stimulation (for
example, tourniquet release or completion of a stimulating surgical dissection) can
lead to a significant drop in BIS®, especially if high doses of hypnotics and analgesics
were used to maintain adequate hypnosis and hemodynamic/autonomic status while
the stimulus was large.
Cyclic oscillation in BIS® under steady state conditions may provide an indication of
the shifting balance between sensory suppression and stimulation. Clinical experience
suggests that smaller volatile changes are seen when sufficient levels of narcotics are
used as part of the anesthetic regimen to reduce the effects of stimulation. In volunteer
studies, higher BIS® variability was observed when sedatives were used alone
compared to when alfentanil was used concurrently.
Several other physiological factors may also alter the hypnotic state of the patient.
As a result, changes in BIS® may occur even when all obvious determinants of
hypnosis remain unchanged. Some of these additional factors include:
1.
2.
2-90
Ischemia or severe hypoxia, resulting in a decrease in the BIS® if severe enough
to cause global EEG slowing or outright suppression. It is important to bear in
mind, however, that the frontal montage used for BIS® monitoring usually will
not detect episodes of focal ischemia caused by embolic events.
Hypothermia (< 33oC) will generally result in a corresponding decrease in BIS®
levels as brain processes slow. More profound hypothermia used during cardiac
bypass procedures will cause suppression of the EEG and, consequently, a very
low BIS®.
Advanced Plug-In Modules
BIS Measurement
3.
Artifact.
Therefore, in order to properly interpret unexpected BIS® changes, it is important to
consider all current clinical signs, ongoing stimulation, drug delivery and raw EEG
signal quality.
Using BIS to Optimize
Anesthetic Delivery
As discussed above, BIS® provides ongoing information about the hypnotic state
which can be useful in determining patient response to anesthetics and stimulation.
Since there is no single anesthetic technique that is appropriate for everyone,
optimum use of the BIS® will depend on clinical goals of the anesthetist. Based on
this consideration, there is no single BIS® value or range that can be
recommended or is appropriate for all patients or conditions. For those who
prefer to keep their patients deeply anesthetized to suppress all unwanted responses,
BIS® can provide an opportunity for reducing the relative overdosing of the hypnotic
state (BIS® <40) which may occur with this approach. Clinicians who seek to keep
their patients light can utilize the BIS® response to help determine the minimum
effective dose of anesthetic required by each individual to reduce the risk of
awareness. For sedation during MAC cases with regional blocks, prevention of
unnecessary sedation (BIS®<70) may be the monitoring goal. Because of this
diversity in clinical need, most new users of BIS® monitoring benefit from first
characterizing their standard practice using the BIS® in an observational fashion.
During this initial evaluation phase, typical practice ranges and BIS® responses to
various interventions can be observed in the context of the individual’s own practice.
In this way, opportunities for possible improvements in anesthetic delivery can be
identified, while confidence in the information provided by the BIS® is established.
The BIS® response can then be incorporated as an additional parameter to help guide
appropriate anesthetic dosing adjustments to achieve the desired clinical goals.
Minimum Effective Dose
Paradigm
A large multicenter clinical study involved use of the BIS® to help determine the
minimum effective dose of anesthetics. Following induction and intubation,
anesthesia is initially maintained using infusions of propofol (120 - 140 ug/kg/min)
and alfentanil (0.5ug/kg/min) with 50% N2O. As shown in the following example
where the user was blinded to the BIS® value, a relatively deep (BIS®< 40) but stable
anesthetic profile was maintained, resulting in a 11 minute recovery at the end of
surgery.
Propofol Inf. Rate
HR
BP Map
13:04
BP/HR
0
13:01
20
0
12:55
40
10
12:49
60
20
12:43
80
30
12:37
100
40
12:31
120
50
12:25
140
60
12:19
160
70
12:13
180
80
12:07
200
90
12:01
BIS --- Propofol Inf. Rate/ 10
BIS
100
Advanced Plug-In Modules
2-91
BIS Measurement
While this was considered to be a very acceptable anesthetic outcome, further
improvement in efficiency is possible, as shown in the following example.
BIS
Propofol Inf. Rate
HR
BP Map
200
90
180
80
160
Incision
140
2nd Incision
60
120
12:30
12:33
12:36
12:26
12:20
12:14
0
12:08
20
0
12:02
40
10
11:54
60
20
11:48
80
30
11:42
100
40
11:34
50
BP/HR
70
11:22
BIS --- Propofol Inf. Rate/ 10
100
In this example of BIS®-directed anesthesia, the propofol infusion rate is
incrementally reduced in order to achieve a BIS® increase to about 55-60 and then
maintained at the minimum dose (70 ug/kg/min) required to stay in this range until
the last 15 minutes of the case, when a BIS® target of 60-70 is used. Since sufficient
analgesia is provided by the opioid and N2O, relatively low propofol infusion rates
(i.e. < 100 ug/kg/min) are often sufficient to maintain adequate hypnosis. In this case,
significantly less drug was used and the patient was awake and responding to
questions within minutes.
This clinical research demonstrated that BIS® monitoring can consistently allow costeffective intraoperative management of anesthetic drug delivery, resulting in
significantly faster recovery and earlier eligibility for discharge from the PACU.
2-92
Advanced Plug-In Modules
BIS Module
BIS Module
Description
The method for measuring Bispectral Index® (BIS®) is based on an algorithm
developed by Aspect Medical Systems. The Bispectral Index® (BIS®) is a continuous
processed EEG parameter that provides a measure of the hypnotic state of the brain
during the administration of anesthetics and sedatives. The technology enables
anesthesia providers to track a patient’s level of consciousness and administer the
appropriate amount of anesthesia for each patient, leading to improved drug titration,
faster and more predictable patient wake-up times after surgery and improved patient
recovery from anesthesia. The BIS® technology uses a sensor placed on the forehead
to capture the EEG signals which are translated into a single number ranging from
100 (for wide awake) to zero (indicating absence of brain electrical activity).
Measurement
The BIS® application displays three numerical values on the main screen of the CMS
or V24/V26:
•
Bispectral Index®
•
Signal Quality Index
•
Electromyography
Additionally, the Suppression Ratio can be configured to be displayed in the lower
right corner of the EEG wave sector. Total Power and the Spectral Edge Frequency
are only displayed in the BIS® Task Window.
Components
The BIS® Module consists of the following major functional components:
Table 2-12 Major BIS® Module Components
Component
Description
Digital Signal Converter (DSC)
A sensor placed on the patient’s head transmits
EEG signals to the DSC. The DSC amplifies and
digitizes signals from the sensor.
BIS® Engine
Filters the raw data from the DSC, analyzes it for
artifact and processes data to calculate the BIS®
index.
BIS® Module
Connects the BIS® Engine to the monitor
Advanced Plug-In Modules
2-93
BIS Module
Theory of Operation
Bispectral analysis is a computational method, which examines the relationships or
“coupling” among the frequency components of the EEG signal. Specifically,
Bispectral analysis quantifies the level of synchronization in the EEG, along with the
traditional amplitude and frequency parameters. Aspect Medical Systems has reduced
the complex data arrays generated from Bispectral analysis using a sophisticated
algorithm to generate a composite, numerical Bispectral Index® which tracks changes
in the cerebral state.
Therefore Bispectral analysis determines the components of the EEG that are due to
harmonic and phase relationships, and thus can provide more information regarding
interactions between cortical and subcortical neural generators. These bicoherence
patterns in the EEG have been found to change with increasing amounts of hypnotical
drugs.
The Bispectral Index® is computed real-time using a combination of three analysis
steps:
2-94
•
The first step is an EEG preprocessor, which breaks the EEG signal down - second
by second - and marks those segments containing artifact that might arise from
movement, EMG or electrocautery equipment. Segments of suppressed EEG are
also identified. These segments are excluded from further processing.
•
The second step is the calculation of the hypnosis/sedation index by combining
selected EEG features using the algorithm, which was developed as previously
described.
•
In the third step, the hypnosis sedation index is modified to better reflect the level
of suppression in the EEG. The suppression ratio (SR) is computed as the
percentage of suppressed EEG in the non-artifact data.
Advanced Plug-In Modules
BIS Module
Figure 2-27 shows the user controls and connector for the BIS® Module. The parts
are described following the figure.
BIS Module
Features
(1)
(2)
(3)
Figure 2-27 BIS® Module controls and connectors
User Controls
1 Setup Key: This is a single-press key, used to enter the BIS® setup screen.
2 Setup Indicator: This is a green LED, which will be lit when in the BIS® setup
screen.
Connectors
3 The BIS® M1034A uses a 12-pin connector for use with the BIS® Module Cable
and the subsequent components.
Safety
To ensure the safety of the patient, the patient applied parts are isolated from ground
by optical isolators and a transformer. In addition, all components are encapsulated in
plastic.
This module complies with UL544, CSA No. 125-M1984 (for use with model
M1165/66/75/76) and UL2601-1, CAN/CSA-C22.2 No.601.1-M90 (for use with
model M1167/77), IEC-601-1, IEC-601-2-26. Patient leakage current is less than
10µ A at 120V/60Hz.
It has an isolated patient connection to Class I protection, Type Body Floating (BF).
There is also protection against damage from defibrillation and electro surgery.
Advanced Plug-In Modules
2-95
BIS Module
2-96
Advanced Plug-In Modules
Chapter 3
CMS Patient Monitoring System
Introduction
This chapter is organized into four sections. Each section contains its own
introduction, objectives and topics list.
This chapter covers the CMS, Philips’ comprehensive, modular system for
monitoring the entire range of a patient’s clinical data. The CMS contains
the superset of functions for the products in its family. The V24 and V26
offer many but not all of these functions and is described in chapter 4.
The CMS is also available in an Anesthesia specific model and a Neonatal
specific model; for Anesthesia, the Anesthesia CMS (ACMS), and for
Neonatal, the Neonatal CMS (NCMS). The components and parameter
modules of the ACMS and NCMS are the same as those found in the
Standard CMS with the exception of the Anesthesia Gas Module, which is
an Anesthesia specific module.
This chapter presents an overview of the CMS/ACMS/NCMS, describes
the modules it contains, and provides details on the individual function
cards that carry out its operations. Important concepts are previewed at the
beginning of each section. Exercises on the content of each section are
included at the end of the first two sections and after each of the function
cards.
Goals
After successfully completing this chapter, you should be able to:
•
Describe the system’s features
•
Describe the system’s functions
•
Identify the system’s components
Objectives
Each section of the chapter contains specific objectives that are focused on
enabling you to meet these goals.
Topics
This chapter contains the following sections.
Table 3-1 Chapter Topics
Topic
Page
“CMS Patient Monitoring System Overview”
3-4
“CMS Patient Monitoring System Description”
3-6
“CMS Patient Monitoring System Modules”
3-8
“CMS Patient Monitoring System Bus Structure”
3-10
“CMS Patient Monitoring System Power System”
3-17
“CMS Patient Monitoring System Hardware Configurations”
3-19
“CMS Patient Monitoring System Software Configurations”
3-31
CMS Patient Monitoring System 3-1
Introduction
Table 3-1 Chapter Topics
Topic
Page
“CMS Patient Monitoring System Functional Modules”
3-34
“Computer Module”
3-35
“Remote Power Supply (M1047A)”
3-41
“Display Module”
3-43
“Remote Keypad”
3-54
“Module Racks”
3-55
“Plug-in Parameter Modules”
3-58
“CMS Master Function Cards”
“Master Card Overview”
3-64
“Application CPU”
3-69
“Configurable Processor Card”
3-74
“Monochrome Display Controller”
3-78
“Color Display Controller Cards”
3-81
“Color Display Controller Card (New Version)”
3-84
“Flatscreen Display Controller Card”
3-87
“DSPC_FLAT_ASIA Flatscreen Controller Card”
3-89
“Utility CPU”
3-92
“RS232/RS422 Dual Interface Card”
3-98
“HDLC Interface Card”
3-102
“Analog Interface Card”
3-105
“CMS Local Function Cards”
Definitions
3-63
3-110
“Local Card Overview”
3-111
“EPROM”
3-113
“SRAM”
3-115
“Color Display Video Card”
3-118
“Serial Distribution Network Interface”
3-122
“Rack Interface”
3-126
“Aux Connector Card”
3-129
“Remote Switch Card”
3-129
Concepts important to the Philips patient monitoring system:
•
CMS - CMS Patient Monitoring System Models 54 through 68. These models are
the bedside monitors with full displays for the critical care environment.
•
ACMS - Anesthesia CMS Patient Monitoring System Models 74 through 88.
These models are the anesthesia monitors with full displays for the operating
room.
3-2 CMS Patient Monitoring System
Introduction
•
NCMS - Neonatal CMS Patient Monitoring System Model 36 through Model 48.
These models are the neonatal monitors with customized displays and parameter
combinations for the Neonatal Intensive care unit.
•
V24/V26 - This model is a bedside monitor with an LCD display for most critical
and acute patient care areas of a hospital.
•
patient monitoring system - A system that measures various aspects of a
patient’s medical condition.
•
SDN - Serial Distribution Network. A monitoring network that allows monitors to
display their patient information and data at other monitors on the network.
CMS Patient Monitoring System 3-3
Introduction
CMS Patient Monitoring System Overview
Introduction
This section of the chapter provides an overview of the CMS, including its hardware
and software components. Subsequent sections go into more detail on the individual
parts of the system.
Objectives
After successfully completing this section, you should be able to:
Concepts
•
Describe the purpose of the CMS and the clinical settings in which it can be used.
•
Describe its significant features and capabilities.
•
Identify its major components and their functions.
•
Describe its bus architecture and power system.
•
Identify its possible hardware configurations.
•
Describe its software operating levels and displays.
The following concepts are explained in this section of the chapter.
•
The CMS is a fully modular computer system dedicated to acquiring and
processing patient physiologic data. It is used in a range of clinical settings for all
types of patients. A comprehensive set of patient parameters can be measured by
this one system. The system can also connect to external monitoring devices for
data integration. The system’s modules can be easily configured and expanded to
match the specific needs of clinicians and patients.
•
The system consists of four types of modules: the Computer Module, Display
Module, Module Rack, and Plug-in Parameter Modules. The Computer Module
contains the function cards for the system and is responsible for distributing the
power, data, and clocks throughout the system. The Display Module provides the
power and the human interface for the system and, for the CRT version of the
Display as well. The Module Racks are the interface between the monitor and the
measurement parameter units. The Plug-In Parameter Modules provide the
measurements and the patient interface.
•
The Computer Module contains a backplane with three distinct buses. The
Message Passing Bus distributes data and control signals among the processing
cards on the backplane. The Local Bus groups the function cards into clusters and
connects processor cards with their supporting cards. The Utility Bus distributes
the power and clock signals through the system. The backplane has 24 slots for a
variety of function cards of two types: processor cards, called master cards, and
supporting cards, called local cards.
•
Power for the CMS is provided by the Display and Computer Modules or, in some
combinations with the Flatscreen display, the Remote Power Supply. The power
supply in the Display Module or the Remote Power Supply connects to the
facility’s main power source and generates 60V DC for the system’s use. Within
the Computer Module, the DC-to-DC converter generates the voltages needed by
the function cards; those voltages are distributed to the cards by the Utility Bus.
3-4 CMS Patient Monitoring System
Introduction
On power-up, the CPU first initiates diagnostics and then executes the application
software.
•
Topics
Several models and software releases for CMS are in use as of this writing. The
configuration of the model determines which CPU and function cards it uses, as
well as the card placement on the backplane. Two types of CPU are in use:
Application CPU cards, which are either 10 or 15 MHz, and Configurable
Processor Cards (CPCs), which are 40 MHz. Application CPU cards require
separate memory cards; CPCs contain their own memory arrays.
This section contains the following topics.
Table 3-2 Topics in this Section
Topic
Page
“CMS Patient Monitoring System Description”
3-6
“CMS Patient Monitoring System Modules”
3-8
“CMS Patient Monitoring System Bus Structure”
3-10
“CMS Patient Monitoring System Power System”
3-17
“CMS Patient Monitoring System Hardware Configurations”
3-19
“CMS Patient Monitoring System Software Configurations”
3-31
CMS Patient Monitoring System 3-5
CMS Patient Monitoring System Description
CMS Patient Monitoring System Description
Introduction
The CMS is a modular patient monitoring system that can: (1) receive patient
management data and physiologic measurements, (2) process the data in a variety of
ways, and (3) display the results in multiple formats.
The CMS is designed to be used in a wide range of clinical settings, from nursing
stations to critical care units. Its power and flexibility enable it to accommodate
everything from basic monitoring requirements to complex and highly specialized
applications.
The system’s modular nature splits all major patient monitoring functions into
individual modules that can be added as needed, interchanged between systems, and
serviced as required. This modularity enables clinicians to put together systems to suit
both the physical layouts of their units and the special needs of individual patients.
HEWLETT
PACKARD
Display
Module
Plug-in
Modules
Computer
Module
Module
Rack
Figure 3-1 Philips CMS
CMS Functionality
The CMS is connected to the patient by means of electrodes, probes, transducers, or
pressure catheters. The accessories attached to the patient are connected to individual
modules that take specific measurements.
The system is switched on by pressing the On/Off switch on the front of the Main
Display Module. After approximately 20 seconds, a display is shown on the screen.
The number of waveforms displayed depends on the model of the system and how it
is configured. Alongside each waveform, a corresponding numeric value for a
measured parameter is also displayed.
3-6 CMS Patient Monitoring System
CMS Patient Monitoring System Description
The patient’s vital signs are shown on the screen. The screen is set up according to
either the default settings stored in the module or those settings made during
installation. Changes can be made to the screen display or to the parameter settings.
Alarms are set to on by pressing the Suspend key, which enables the system to
announce alarms as it monitors the patient.
CMS Features
The CMS has a wealth of features that make it flexible, powerful, and easy to use. It
provides a comprehensive set of patient measurements for use in a broad spectrum of
clinical applications.
Some modules can be transferred from one system to another without losing their
parameter settings. The VueLink module allows vital sign measurements to be
imported from other monitors and auxiliary devices for correlation with other patient
data.
The system offers networking and database management capabilities, as well as
several useful analyses, calculations, and presentation capabilities, such as a drug
calculator and an oxycardiorespirogram. It comes with a set of default configurations
for four different patient care categories, and it has online help. Its open architecture
enables it to use a number of standard interfaces to connect to external devices, and
also allows for easy upgrades.
CMS Functions
Among the functions that the CMS can perform are the following.
•
Retrieve and display physiologic signals, such as ECG waveforms.
•
Determine numeric values, such as heart rate.
•
Check values against user-programmable limits and generate alarms.
•
Detect life threatening events, such as apnea.
•
Collect, store, and retrieve long-term data to provide trends of patient data.
•
Communicate patient information to the Serial Distribution Network (SDN) and
to printers.
CMS Patient Monitoring System 3-7
CMS Patient Monitoring System Modules
CMS Patient Monitoring System Modules
The CMS is made up of individual modules that can either be assembled together in
the same location or positioned apart from each other in different locations. The
components are as follows.
•
Computer Module - contains all of the function cards. The front of the unit may
contain a module rack or a cover piece for the module rack opening. The
computer module also consists of the mechanical covers, guides, and backplane
(bus). The function of this module is to process the data and to distribute the
power, data, and clocks to the appropriate locations in the system.
•
Display Module(s) - used to display patient data. The main display for the system
is either a 14-inch CRT display monitor, monochrome or color, or a 10.4-inch
Flatscreen LCD color display. Up to two independent displays, controlled from
the main display, can be set up. Remote (or slave) displays can also be used; these
are either 14- or 20-inch color or monochrome units. The main display contains an
integral keypad called the Control Panel. An optional remote keypad is also
available.
Flatscreen Display Setup
The setup requirements for the Flatscreen are different from those of the CRT
Display Modules since no power supply is integrated into the flatscreen
assembly. Possible setups for the Flatscreen are as follows:
Flatscreen as Main Display - either a separate power supply or an integral
power supply in the M1046B computer Module provides power for the system
including up to two Flatscreens.
Flatscreen as Independent Display - when the Main Display is a CRT display,
this module can provide power for one Flatscreen independent display.
The Flatscreen does not support any Remote (slave) displays.
•
Module Rack(s) - used to hold the parameter modules. The rack(s) can be
integral (connected to the front of the computer module) or external (for locating
away from the monitor). If the rack is external, it is called a satellite rack.
•
Plug-in Parameter Modules - used to acquire and process the patient data. Each
module is dedicated to a specific set of measurements or functions. These modules
are placed in the module racks. Most use accessories to attach to patients. A few,
such as the Recorder, VueLink, and Data Transfer modules, have no patient
connections
3-8 CMS Patient Monitoring System
CMS Patient Monitoring System Modules
.
Independent Display
Remote Displays
(CRT)
(color or monochrome)
(color and monochrome)
Main Display
i-Stat
Central Data Station
Or XGA Display
(4 or 8 channels in color)
Defibrillator
(color only)
(Flatscreen)
Defib. Sync.
XGA Display
Gateway
Interface
8 Channel Analog Output Interface
8 Channel
Analog Recorder
Philips
Monitoring
Network
RS-232 Interface
(standard)
Satellite Racks
Digital Recorder
Interface
PC
4 Channel
Recorder
LaserJet
“VueLink” M1032A
(link to external devices)
M1167A/77A
Philips CMS Patient Monitoring System (Flatscreen or XGA) System Overview
i-Stat
Central Data Station
Remote Displays
(color or monochrome)
Independent
Display
Main Display
(6 channels in monochrome,
4 or 8 channels in color)
Defibrillator
Defib. Sync.
8 Channel Analog Output Interface
Gateway
Philips
Philips Monitoring Network Interface Monitoring
Network
8 Channel
Analog Recorder
RS-232 Interface
Integral Rack
(8 slots)
Digital Recorder
Interface
PC
Satellite Racks
(8 or 6 slots)
4 Channel Recorder
LaserJet
“VueLink” M1032A
(link to external devices)
M1165A/66A/75A/76A
Philips CMS Patient Monitoring System (CRT) System Overview
Figure 3-2 Philips CMS Components
CMS Patient Monitoring System 3-9
CMS Patient Monitoring System Bus Structure
CMS Patient Monitoring System Bus Structure
Introduction
The bus structure of the CMS includes three distinct signal buses: a Message Passing
Bus, a Local Bus, and a Utility Bus. The overall structure of the CMS is shown in
Figure 3-3.
125x120.tif
DISPLAY mono / color
CRT DISPLAY mono / color
Power
Supply
Power
Supply
DC/DC
Converter
Human
Interface
Human
Interface
Utility
CPU
SDN
Interface
Display
Controller
Rack
Interface
MPB
MPB
Message Passing Bus
40 MHz CPC
MPB
MPB
RAM
CPU
10 MHz
or
15 MHz
MPB Bus
EPROM
Interfaces
e.g. SDN,
RS232,
HDLC
Rack
with Parameter Modules
Rack with Parameter Modules
Local Bus
Figure 3-3 Philips CMS Bus Structure
3-10 CMS Patient Monitoring System
CMS Patient Monitoring System Bus Structure
Physical Backplane
The backplane of the computer module contains the buses used to interconnect the
pieces of the CMS system. This backplane is made up of 24 connectors; 23 are for
various function cards; one is dedicated to the DC-to-DC converter.
The connectors are mounted on both sides of the backplane, dividing the computer
module into two halves.
The function cards are plugged into the connectors located either in the front of the
computer module (2-24 even-numbered connectors) or the rear (1-21 odd-numbered
connectors).
Message Passing Bus
The Message Passing Bus (MPB) is used to pass data among the processors in the
system. The processors are located in the CPU cards and the interface cards, such as
the RS232 Interface. These data are passed as messages.
Functionally, the MPB transfers data, performs arbitration to determine the next bus
owner, and provides control signals.
Data Transfers
Data are transferred as a message on the MPB. Addresses are not used on this bus
because data are not sent to a specific card; rather, it is broadcast to all cards on the
bus. In addition, it is not necessary that a card know where the data have originated
from because any required information is in the message.
The message contains a one word header describing the type of data (for example,
ECG lead 1) and the length. Other cards on the bus read the header and determine
whether they require the data.
Arbitration is necessary because there is more than one participant on the bus.
Local Bus
The Local Bus is used to connect a processor card, such as a CPU, with its supporting
card or cards, such as a memory card. The functions of the Local Bus are to provide
data transfers, addressing, and controls for data and address cycles.
Addressing
Utility Bus
The Local Bus is capable of accessing specific addresses in memory. The memory is
contained on cards such as Static Random Access Memory (SRAM) or Erasable
Programmable Read Only Memory (EPROM).
The Utility Bus distributes the power and clock signals for the system.
CMS Patient Monitoring System 3-11
CMS Patient Monitoring System Bus Structure
System Power
The power is placed on the bus by the DC-to-DC converter, which produces the
required voltages from the Display Module’s 60V DC output. The following voltages
are placed on the Utility bus.
Table 3-3 Utility Bus Voltages
System Timing
Voltage
Origin
+12V
Power Supply (from the DC-to-DC converter).
-12V
Power Supply (from the DC-to-DC converter).
+5V
Power Supply (from the DC-to-DC converter).
+60V
Power Supply (from the display module or separate power supply via
the DC-to-DC converter).
The clock signals are placed on the bus by the Utility CPU and are used to clock the
rate of data acquisition. The clock used are as follows.
Table 3-4 Clocks on the Utility Bus
Clock Speed
Type of Clock
20MHz
System Clock (from the Utility CPU).
32ms
Frame Clock (C32MS) (from the Utility CPU).
2ms
Sample Clock (C02MS) (from the Utility CPU).
The system clock is derived from an IC on the Utility CPU. If power is lost, this chip
is powered by a special capacitor. In a worst case scenario, the capacitor can supply
power for at least 100 hours. In a typical scenario, the capacitor would supply power
for at least 255 hours, or approximately 11 days.
Function Card
Description
Summary
Table 3-5 Function Card Summary
Component
Description
DC/DC Converter
Provides the voltages for the system.
Application CPU
One of the CPU types responsible for processing the data.
Configurable
Processor Card
One of the CPU types responsible for processing the data.
DSPC Card
Outputs display data to the monochrome display.
CDSPC Cards
Outputs display data to the color displays.
Utility CPU
Provides interfacing to several devices.
3-12 CMS Patient Monitoring System
CMS Patient Monitoring System Bus Structure
Table 3-5 Function Card Summary
Component
Description
RS232/RS422 Dual
Interface Card
Provides the CMS with an interface to the outside world.
EPROM Card
Stores the executable code and/or language dependent
characters.
SRAM Card
Stores data before and after processing.
SDN Interface Card
Interfaces the CMS to the Serial Distribution Network.
Rack Interface Card
Interfaces the CMS with the module racks.
HDLC Interface Card
Interfaces the CMS with real time recorders using STRIP.
Analog Interface Card
Provides eight channels of analog output which can be
connected to data collection instruments.
Remote Switch Card
(M1046B only)
Provides connection and the remote switching of the DC
power to the computer module, the module racks and the
flatscreen display.
Aux Connector Card
(M1046B only)
Provides access to the Rack Interface behind the
Computer Modules integral power supply.
Function Cards
The function cards that reside on the backplane are grouped into two basic types:
master cards and local cards. Master cards, which perform processing functions,
connect to the MPB Bus; they may also connect to the Local Bus. Local cards connect
to only the local bus.
Local Clusters
The backplane is divided into ten clusters to accommodate groupings of specific
function cards. Each slot in the backplane belongs to a local cluster. Each cluster has
its own dedicated portion of the local bus for connecting the cards in that cluster.
Clusters have between one and five card slots with predefined slot numbers. A cluster
contains one master card and zero to four local cards, depending on the cluster. With
the exception of the SDN Interface card, SRAM, and Rack IF card, more than one of
each local card may be used on the backplane.
Figure 3-4 shows how the clusters are grouped on the backplane. Note that the DC-toDC converter is located in a triple-sized gap on the rear of the backplane to the left of
connector 21. The connectors within each cluster have the same color-coding for easy
identification.
CMS Patient Monitoring System 3-13
CMS Patient Monitoring System Bus Structure
Front Slots
Rear Slots
1
2
3
Gray
4
5
6
7
Blue
Green
Yellow
Red
8
9
10
11
12
13
14
15
16
Red Strips
17
Blue Strips
18
19
20
21
Green Strips
22
24
DC-DC Converter
Figure 3-4 Backplane Configuration with Local Clusters
Card Placement
The rules associated with placement of the cards in the backplane are as follows.
•
The DC-to-DC converter must be placed in the unnumbered slot (cluster 1).
•
The Rack Interface card is placed in slot 18.
•
If used, the DSPC_LANG card for Asian languages is placed in slot 3.
(not required if the DSPC_FLAT_ASIA card is used in slot 1)
•
Master cards can be used only once within any cluster.
•
Local cards must be placed in the same cluster as their associated master card;
they may be placed in any free slot within that cluster.
•
Cards with external connections must be placed in the rear part of the backplane.
•
The DSPC monochrome display controller has a connection to the local bus,
although no local cards may be required for its operation. It must be located in the
rear of the backplane for easy access.
•
M1046B only: Aux Connector card must be placed in slot 24 and connected to the
Rack Interface card.
3-14 CMS Patient Monitoring System
CMS Patient Monitoring System Bus Structure
•
M1046B only: Remote Switch card must be placed in slot 8.
Table 3-6 Master Cards and their Associated Local Cards
Master Card
Associated Local Cards
Utility CPU
SDN Interface and Rack Interface
CDSPC-Control
CDSPC-Video
Application CPU
EPROM
SRAM
Table 3-7 Rear Card Connections
Card
Connects to:
Utility CPU
HIL to the Monitor and Nurse Paging System
RS232 Interface
Printers or computer systems
SDN Interface
SDN network
HDLC Interface
M1117A Strip Recorder
Analog Interface
Analog device
CDSPC-Video
Color monitor
DSPC
Monochrome monitor
DSPC_FLAT
LCD monitor and Remote Switch to Remote Power
Supply
Table 3-8 Display Interface and Slot Location
Type of interface
Slot Location
Monochrome
DSPC #1 in slot 1, DSPC #2 in slot 7
Color
CDSPC_CTRL #1 in slot 2 CDSPC_CTRL #2 in slot 6
CDSPC_VIDEO #1 in slot 1 CDSPC_VIDEO #2 in slot 7
Minimum System
Requirements
The minimum card requirements to start-up the system are defined in Table 3-8
CMS Patient Monitoring System 3-15
CMS Patient Monitoring System Bus Structure
Table 3-9 Required Cards for System Start-up
System
Required Cards
Systems with 10MHz
and/or 15MHz
Application CPU's in
Backplane
All Application CPU cards (3,4, or 5 cards, depending on
CMS model and CPU type)
A display controller card
EPROM MASTER and EPROM SLAVE
SRAM
Utility CPU
Rack Interface Card
M1046B only: Aux Connector Card
M1046B only: Remote Switch Card
Systems with 40MHz
CPC or combined
40MHz CPC and
15MHz APP_CPU in
Backplane
CPC Card
Application CPU card(s) (depending on CMS model)
A display controller card
Utility CPU
Rack Interface
M1046B only: Aux Connector Card
M1046B only: Remote Switch Card
3-16 CMS Patient Monitoring System
CMS Patient Monitoring System Power System
CMS Patient Monitoring System Power System
Introduction
The power system in the CMS uses the facility’s AC source voltage and converts this
AC line voltage to the DC voltages required for the CMS computer module and the
various plug-in modules.
Components
The components in the power system network and their functions are as follows.
Table 3-10 Power Systems & Distribution Components and Functions
Component
Function
Power Cord
Used to plug into the main power source.
Source Voltage
Source voltage is from 92 to 262V AC. The voltage is selfselected.
DC-to-DC converter
Generates the voltages (+5,+12, and -12V DC) for the
cards located in the computer module.
Display Module SwitchMode Power Supply,
Remote Power Supply,
or
Integral Power Supply
in the M1046B
Computer Module
Generates the 60V DC input to the DC-to-DC converter.
Utility Bus
Used to distribute the voltages (+5, +12, -12, and +60V
DC).
CPU
Performs a hardware test, identifies the cards in the cluster,
and starts executing the application software.
Theory of Operation
The CMS system is connected to the facility source voltage with an AC power cord to
the AC outlet. This AC cord is connected to a connector on the back of the Display
Module, the Remote Power Supply, or the Integral Power Supply in the M1046B
Computer Module.
Computer Module
(M1046A)
When the power is turned on, the Display Module (or the Remote Power Supply)
receives the 120V AC (depending on the source voltage) and converts this voltage to
60V DC. The 60V DC is output through a connector on the back of the display (or
Remote Power Supply) and is fed to the computer module through the 15-pin
connector of the DC-to-DC converter.
Computer Module
(M1046B)
When the power is turned on, the Computer Module M1046B receives the 120V AC
(depending on the source voltage) and converts this voltage to 60V DC. The 60V DC
is output through a connector on the back of the Integral power supply to the Remote
CMS Patient Monitoring System 3-17
CMS Patient Monitoring System Power System
Switch card in slot 8 of the Computer Module. This 60 V DC is routed internally to
the DC-to-DC converter.
As no connection is made to the 15-pin connector of the DC-to-DC converter, a
shorting stub MUST be connected to it so that the system operates correctly.
NOTE
DC-to-DC Converter
A delay of between one to two seconds occurs between the time that the 60V DC
arrives at the input to the DC-to-DC converter and the time that the DC-to-DC
converter outputs the regulated voltages. This delay is used to ensure that the
SYSRES (system reset) and PFAIL (powerfail) signals are in the correct state.
If the condition is determined to be a power-up, the DC-to-DC converter outputs the
converted voltages (+5, +12, and -12), along with the 60V DC input voltage, onto the
Utility bus.
Power-Up and
Diagnostics
Before the CMS system can be powered up, it must have a base configuration of
cards, including an application processor card, a display controller, a Utility CPU, and
a Rack Interface.
After the power-up is complete, the CPU performs a hardware test. After the
hardware test is finished, the CPU locates and identifies the other cards in the cluster.
This is done by sending out an address that identifies the slot(s), and an ACCESS
signal that results in the local card placing an identifier onto the local bus.
If an EPROM card is connected, the CPU begins executing application software code
from the EPROM card. If an EPROM card is not present, the CPU begins execution
of the application software code from the CPCs flash EPROMS.
Note: Depending on the type of configuration, the CPU is either an APP_CPU or a
CPC CPU. The APP_CPU is available as either a 10 or 15 MHz card. The CPC is 40
MHz. Both a CPC and a 15 MHz APP_CPU can be present on the backplane.
System Reset
If the CPU detects an error in the system, or the watchdog timer detects a failure on
the CPU, the signal PFAIL is generated by the CPU and sent to the Utility CPU. The
Utility CPU, in turn, generates the SYSRES signal, which resets all the cards in the
computer module.
3-18 CMS Patient Monitoring System
CMS Patient Monitoring System Hardware Configurations
CMS Patient Monitoring System Hardware Configurations
Introduction
The CMS is available in different models, each configured differently. The monitor’s
configuration determines the CPU and function cards it can include, as well as their
arrangement. The configuration of cards in the CMS depends on both the model of
the system and the type of application CPU used.
Application CPUs
Several types of CPU cards are used in the system for processing application data:
•
M1054 Application CPU, 10 MHz.
•
M1051 Application CPU, 15 MHz.
•
M1053 Configurable Processing Card (CPC), 40MHz.
CMS models delivered with Releases A or B software may use either 10 or 15 MHz
Application CPUs. Models delivered with Release C software use only 15 MHz
Application CPUs. However, models with 10 MHz cards that upgrade to Release C
software use a combination of 10 and 15 MHz cards.
Releases C and subsequent software provide support for models with a CPC in slot
12. In these models, additional 15 MHz Application CPUs may be required,
depending on the model, or may be left in for future use. Beginning with Rel. A.0 two
40 MHz CPC cards in slot 4 and 12 are required for all models.
Figure 3-5 through Figure 3-12 show the backplane configurations for these systems.
Memory
Application CPU cards use both EPROM and SRAM cards. Two types of SRAM card
are available:
•
M1055-66501 SRAM LO: standard for 10 and 15 MHz systems.
•
M1056-66501 SRAM HI: used with option #CO3 in 10 and 15 MHz systems.
CPCs contain their own memory arrays, including four types of memory. Two
versions of CPC are available: the M1053-66514 and M1053-66515. These CPCs are
discussed in the Master Cards section of this document.
Models which use the CPC cards will not have EPROM and SRAM cards.
CMS Patient Monitoring System 3-19
CMS Patient Monitoring System Hardware Configurations
Function Card
Placement
The function cards are interconnected by the backplane within the Computer Module.
The function cards are mounted on both sides of the backplane and may be located
either in the front of the Computer Module (even-numbered connectors) or the rear
(odd-numbered connectors). The local clusters of the backplane are color-coded on
the Computer Module, so that they can be easily identified. On the rear of the
backplane, to the left of connector 21, there is a triple-sized gap. This is the only place
where the dc-dc converter can be located.
The newer Computer Module (M1046B) has an integral power supply. As a result
these Computer Modules have additional function cards.
Function Card Placement in the backplane of the monitor is dependent upon the
following:
1. The monitor model (“(S)” indicates the non-US-models):
• CMS: Models 54 (S), 56 (S), 64 (S), 66 (S), 68 (S)
• ACMS: Models 74 (S), 76 (S), 84 (S), 86 (S), 88 (S)
• NCMS: Models 36 (S), 44 (S), 46 (S), 48 (S)
2. Type of processor cards used
• 10 MHz CPU cards M1054-66501
• 15 MHz CPU cards M1051-66501
• 40 MHz CPC card M1053-66515
3. Type and combination of display controllers used
• M1066-66501 DSPC (Monochrome)
• M1066-66531 DSPC (Monochrome)
• M1066-66543 DSPC (Monochrome with integrated DSPC-lang)
• M1072-66521 CDSPC-CTRL (Color) together with M1072-66501 CDSPCVIDEO
• M1072-66531 CDSPC (Color)
• M1072-66543 (Color with integrated DSPC-lang)
• M1074-66501 DSPC-FLAT (Flatscreen color)
• M1074-66502 DSPC-FLAT (Flatscreen color)
• M1074-66503 DSPC-FLAT (Flatscreen Color with integrated DSPC-lang)
• M1075-66503 XGA DSPC (XGA with integrated DSPC-lang)
3-20 CMS Patient Monitoring System
CMS Patient Monitoring System Hardware Configurations
Software Release A
10 and 15 MHz
APP-CPUs
Using 10MHz Application CPUs
REAR
FRONT
BLANK or
CDSPC_CTRL
EPROM MASTER
CDSPC_CTRL #2
APP_CPU
SRAM
EPROM SLAVE
APP_CPU
(Model 68 only)
DSPC or
CDSPC_VIDEO
1
2
3
4
5
APP_CPU
7
DSPC #2 or
CDSPC_VID #2
9
HDLC_IF
11
APP_CPU
13
RS232_IF (if present)
6
8
(If present)
10
12
14
15
16
RACK_IF
17
UTIL_CPU
19
SDN_IF (if present)
18
20
21
APP_CPU
22
24
DC/DC CONVERTER
200 x 90
Using 15MHz Application CPUs
FRONT
BLANK or
CDSPC_CTRL
EPROM MASTER
CDSPC_CTRL #2
APP_CPU
(Model 68 only)
SRAM
EPROM SLAVE
REAR
1
2
DSPC or
CDSPC_VIDEO
3
4
5
APP_CPU
7
DSPC #2 or
CDSPC_VID #2
9
HDLC_IF
11
APP_CPU
13
RS232_IF (if present)
6
8
(if present)
10
12
14
15
16
RACK_IF
17
UTIL_CPU
19
SDN_IF (if present)
18
20
21
APP_CPU
22
24
DC/DC CONVERTER
Figure 3-5 Software Release A Backplane Configuration
CMS Patient Monitoring System 3-21
CMS Patient Monitoring System Hardware Configurations
Software Release B
10 and 15 MHz
APP_CPUs
Using 10MHz Application CPUs
REAR
FRONT
BLANK or
CDSPC_CTRL
EPROM MASTER
6
APP_CPU
8
EPROM SLAVE
APP_CPU
(Model 56 with #C10,
66 with #C10, or 68)
DSPC or
CDSPC_VIDEO
3
DSPC_KANJI (if present)
4
CDSPC_CTR #2
SRAM
1
2
5
APP_CPU
7
DSPC #2 or
CDSPC_VID #2
9
HDLC_IF
11
APP_CPU
13
RS232_IF (if present)
15
ANALOG_IF (if present)
17
UTIL_CPU
19
SDN_IF (if present)
(If present)
10
12
14
16
RACK_IF
18
20
21
APP_CPU
22
24
DC/DC CONVERTER
200 x 90
Using 15MHz Application CPUs
FRONT
BLANK or
CDSPC_CTRL
EPROM MASTER
CDSPC_CTR #2
APP_CPU
(Model 68 only)
SRAM
EPROM SLAVE
REAR
1
DSPC or
CDSPC_VIDEO
3
DSPC_KANJI (if present)
5
APP_CPU
7
DSPC #2 or
CDSPC_VID #2
9
HDLC_IF
11
APP_CPU
13
RS232_IF (if present)
15
ANALOG_IF (if present)
17
UTIL_CPU
19
SDN_IF (if present)
2
4
6
8
(if present)
10
12
14
16
RACK_IF
18
20
21
APP_CPU
22
24
DC/DC CONVERTER
Figure 3-6 Software Release B Backplane Configuration
3-22 CMS Patient Monitoring System
CMS Patient Monitoring System Hardware Configurations
Software Upgrade,
Release C, 10 MHz CPU
Models 54(S)/64(S) and Models 56(S)/66(S) without #C26
REAR
FRONT
BLANK or
CDSPC_CTRL #1
2
EPROM MASTER
4
CDSPC_CTRL #2
1
DSPC #1 or
CDSPC_VID #1
3
DSPC_LANG
5
15 MHz APP_CPU
7
DSPC #2 or
CDSPC_VID #2
9
HDLC-IF
(KANJI, TAI or PRC)
6
15 MHz APP_CPU8
SRAM
EPROM SLAVE
10
11
15 MHz APP_CPU
13
RS232_IF
15
ANALOG_IF
17
UTIL_CPU
19
SDN_IF
12
14
16
RACK_IF
18
20
21
APP_CPU
22
24
DC/DC CONVERTER
200 x 90
Models 56(S)/66(S) with #C26 and Model 68(S)
REAR
FRONT
BLANK or
CDSPC_CTRL #1
2
EPROM MASTER
4
CDSPC_CTRL #2
1
DSPC #1 or
CDSPC_VID #1
3
DSPC_LANG.
5
15 MHz APP_CPU
7
DSPC #2 or
CDSPC_VID #2
9
RS232_IF #1
6
15 MHz APU_CPU8
SRAM
EPROM SLAVE
(KANJI, TAI or PRC)
10
11
15 MHz APP_CPU
13
RS232_IF #2 or
DSPC #3 (only 68(S))
15
ANALOG_IF
17
UTIL_CPU
19
SDN_IF
21
HDLC_IF
12
15 MHz APU_CPU
14
16
RACK_IF
18
20
15 MHz APP_CPU
22
24
DC/DC CONVERTER
Figure 3-7 Software Release C Backplane Configuration (10MHz CPU)
CMS Patient Monitoring System 3-23
CMS Patient Monitoring System Hardware Configurations
Release C (without CPC)
Upgrade Backplane
The table below shows the slot locations and quantity of 10 MHz (M1054-66501) and
15 MHz (M1051-66501) APP_CPUs for those CMS that have been upgraded from
software release A or B with 10 MHz CPU’s exclusively, to software release C
without CPC.APP_CPU Slot Location and Quantity
A54S/A66S
51, 8, 11, 14, 22
A56S,/A66S
51, 8, 11, 14, 22
A56(S)/A66(S) (#C10)
51, 8, 11, 14, 162, 22
A56(S)/A66(S) (#C26)
51, 8, 11, 14, 161, 22
1 This is a 15 MHz CPU.
2 The systems that have been upgraded from
software release B to software release C with
existing C10 will contain a 10 MHz processor in
slot 16. If C10 is added to a Software Release C
monitor, there will not be a 10 MHz processor in
slot 16.
Rel. C+ to Rel. G 15 MHz APP_CPU Requirements
Model
Slot 22
Slot 4
Standard CMS
A68(S)
Required
Extra card
A56(S)/A66(S)
Required1
Extra card
A54(S)/A64(S)
Extra card
Extra card
Anesthesia CMS (from Rel. Eß)
A88(S)
Required
Required
A76(S)/A86(S) (#C25)
Required
Required
A76(S)/A86(S) without (#C25)
Extra card
Extra card
A74(S)/A84(S) (#C24)
Required
Extra card
A74(S)/A84(S) w/o (#C24)
Extra card
Extra card
Required
Extra card
Neonatal CMS (from Rel. F)
A36(S)/A46(S)/A48(S)
1. Not required in certain earlier releases.
3-24 CMS Patient Monitoring System
CMS Patient Monitoring System Hardware Configurations
Software Release C with
CPC and Release D
Models 54(S)/64(S) and Models 56(S)/66(S)
FRONT
BLANK or
CDSPC_CTRL #1
*
15 MHz APP_CPU
1
2
3
4
REAR
DSPC #1 or
CDSPC_VID #1
DSPC_LANG
(KANJI, TAI or PRC)
5
CDSPC_CTRL #2
6
7
DSPC #2 or
CDSPC_VID #2
9
RS232_IF
8
10
11
40 MHz CPC
12
13
14
15
ANALOG_IF
17
UTIL_CPU
19
SDN_IF
21
HDLC_IF
16
18
RACK_IF
20
*
15 MHz APP_CPU
22
24
DC/DC CONVERTER
200 X 90
Models 56(S)/66(S) with #C26 and Model 68(S)
FRONT
BLANK or
CDSPC_CTRL #1
15 MHz APP_CPU
*
1
2
3
4
REAR
DSPC #1 or
CDSPC_VID #1
DSPC_LANG
(KANJI, TAI or PRC)
5
CDSPC_CTRL #2
6
7
DSPC #2 or
CDSPC_VID #2
9
RS232_IF #1
8
10
11
40 MHz CPC
12
13
RS232_IF #2 or
DSPC #3 (only 68(S))
15
ANALOG_IF
17
UTIL_CPU
19
SDN_IF
21
HDLC_IF
14
16
RACK_IF
18
20
15MHz APP_CPU
22
24
DC/DC CONVERTER
* An extra CPU may be left in for future use.
Figure 3-8 Software Release C and D Backplane Configuration
CMS Patient Monitoring System 3-25
CMS Patient Monitoring System Hardware Configurations
Software Release E or Eß
FRONT
BLANK or
CDSPC_CTRL #1
15 MHz APP_CPU
CDSPC_CTRL #2
40 MHz CPC
RACK_IF
15 MHz APP_CPU
REAR
1
3
5
7
9
2
4
6
8
10
12
14
16
18
20
22
24
11
13
15
17
DSPC #1 or
CDSPC_VIDEO #1
DSPC_LANG #1
(KANJI, TAI or PRC)
DSPC #2 or
CDSPC_VIDEO #2
RS232_IF #1
ANALOG_IF or
DSPC #3 (only model 88)
RS232 IF #2
UTIL_CPU
19
21
HDLC_IF
25
DC/DC CONVERTER
SDN_IF
Figure 3-9 Software Release E or Eß Backplane Configuration
Software Release F
FRONT
* BLANK
15 MHz APP_CPU
CDSPC_CTRL #2
40 MHz CPC
100/140
RACK_IF
15 MHz APP_CPU
bacone1.tif
2
4
6
8
10
12
14
16
18
20
22
24
REAR
1
3
5
7
9
11
13
15
17
DSPC #1 or
CDSPC #1 or DSPC_FLAT #1
19
21
SDN_IF
HDLC_IF
25
DC/DC CONVERTER
DSPC_LANG #1
(KANJI, TAI or PRC)
DSPC #2 or
CDSPC #2 or DSPC_FLAT #2
RS232_IF #1
ANALOG_IF or
DSPC #3 or DSPC_FLAT #3
or CDSPC #3
(only model 88)
RS232 IF #2
UTIL_CPU
* If upgraded (to F) may still have CDSPC_CTRL #1.
Figure 3-10 Software Release F Backplane Configuration
3-26 CMS Patient Monitoring System
CMS Patient Monitoring System Hardware Configurations
Software Release G
M1046A Computer Module
FRONT
* BLANK
15 MHz APP_CPU
CDSPC_CTRL #2
40 MHz CPC
100/140
RACK_IF
15 MHz APP_CPU
bacone1.tif
2
4
6
8
10
12
14
16
18
20
22
24
REAR
1
3
5
7
9
11
13
15
17
DSPC #1 or
CDSPC #1 or DSPC_FLAT #1
19
21
SDN_IF
HDLC_IF
25
DC/DC CONVERTER
DSPC_LANG #1
(KANJI, TAI or PRC)
DSPC #2 or
CDSPC #2 or DSPC_FLAT #2
RS232_IF #1
ANALOG_IF or
DSPC #3 or DSPC_FLAT #3
or CDSPC #3
(only model 88)
RS232 IF #2
UTIL_CPU
* If upgraded (to G) may still have CDSPC_CTRL #1.
M1046B Computer Module
FRONT
BLANK
15 MHz APP_CPU
CDSPC_CTRL #2
REMOTE_SWITCH
40 MHz CPC
100/140
RACK_IF
15 MHz APP_CPU
AUX_CONNECTOR
bacone1.tif
2
4
6
8
10
12
14
16
18
20
22
24
REAR
1
3
5
7
9
11
13
15
17
DSPC_FLAT_NON_ASIA #1 or
DSPC_FLAT_ASIA #1
19
21
SDN_IF
HDLC_IF
25
DC/DC CONVERTER
DSPC #2 or
CDSPC #2 or DSPC_FLAT #2
RS232_IF #1
ANALOG_IF or
DSPC #3 or DSPC_FLAT #3
or CDSPC #3
(only model 88)
RS232 IF #2
UTIL_CPU
Figure 3-11 Software Release G Backplane Configuration
CMS Patient Monitoring System 3-27
CMS Patient Monitoring System Hardware Configurations
Software Releases
A.0 to C.0
M1046A Computer Module
Systems with M1066-66501 (DSPC) or
M1072-66521 (CDSPC_CTRL) +
M1072-66501 (CDSPC_VIDEO)
FRONT
CDSPC_CTRL #1
40 MHz CPC #2
CDSPC_CTRL #2
40 MHz CPC #1
100/140
RACK_IF
*
15 MHz APP_CPU
REAR
2
4
6
8
10
12
14
16
18
20
22
24
1
3
5
7
9
11
13
15
17
DSPC #1 or
CDSPC_VIDEO #1
DSPC_LANG
(JAP, PRC, ROC)
DSPC #2 or
CDSPC_VIDEO #2
RS232_IF #1
ANALOG_IF or
DSPC #3 (only model 88)
RS232 IF #2
UTIL_CPU
19
21
HDLC_IF
25
DC/DC CONVERTER
SDN_IF
* For future use – if upgraded.
M1046B Computer Module
Systems with M1075-66503 (XGA_DSPC) or
M1074-66503 (DSPC_FLAT)
FRONT
40 MHz CPC #2
REMOTE
40 MHz CPC #1
100/140
RACK_IF
*
15 MHz APP_CPU
AUX
2
4
6
8
10
12
14
16
18
20
22
24
* For future use – if upgraded.
3-28 CMS Patient Monitoring System
REAR
1
3
5
7
9
11
13
15
17
XGA_DSPC #1 or DCPC_FLAT #1
XGA_DSPC #2 or DSPC #2 or
CDSPC#2 or DSPC_FLAT #2
RS232_IF #1
ANALOG_IF or XGA_DSPC or
DSPC #3 or CDSPC #3
or DSPC_FLAT #3(only model 88)
RS232 IF #2
UTIL_CPU
19
21
HDLC_IF
25
DC/DC CONVERTER
SDN_IF
CMS Patient Monitoring System Hardware Configurations
M1046A Computer Module
Systems with M1066-66531 or M1066-66643** (DSPC) or
M1072-66531 or M1072-66543** (CDSPC) or
M1074-66501 (DSPC_FLAT) or
M1074-66502 (DSPC_FLAT)**
FRONT
40 MHz CPC #2
40 MHz CPC #1
100/140
RACK_IF
*
15 MHz APP_CPU
REAR
1
3
5
7
9
11
13
15
17
2
4
6
8
10
12
14
16
18
20
22
24
*For future use – if upgraded
DSPC #1 or
CDSPC #1 or DSPC_FLAT #1
DSPC_LANG #1
(JAP, PRC, ROC, GRK, POL,
RUS, CZE)
DSPC #2 or
CDSPC #2 or DSPC_FLAT #2
RS232_IF #1
ANALOG_IF or
DSPC #3 or CDSPC #3
or DSPC_FLAT #3(only model 88)
RS232 IF #2
UTIL_CPU
19
21
HDLC_IF
25
DC/DC CONVERTER
SDN_IF
** with these controllers no DSPC_LANG is required
M1046B Computer Module
Systems with M1074-66501(DSPC_FLAT) or
M1074-66502 (DSPC_FLAT)
FRONT
40 MHz CPC #2
REMOTE
40 MHz CPC #1
100/140
RACK_IF
*
15 MHz APP_CPU
AUX
2
4
6
8
10
12
14
16
18
20
22
24
REAR
1
3
5
7
9
11
13
15
17
DSPC_FLAT #1or DSPC #1
DSPC_LANG #1
(JAP, PRC, ROC, GRK,
POL, RUS, CZK)
DSPC #2 or CDSPC #2 or
DSPC_FLAT #2
RS232_IF #1
ANALOG_IF or
DSPC #3 or CDSPC #3
or DSPC_FLAT #3(only model 88)
RS232 IF #2
UTIL_CPU
19
21
HDLC_IF
25
DC/DC CONVERTER
SDN_IF
*For future use – if upgraded
CMS Patient Monitoring System 3-29
CMS Patient Monitoring System Hardware Configurations
Figure 3-12 Software Release A.0 to C.0 Backplane Configuration
Plug-in Parameter
Modules
The number of Plug-in Parameter Modules that can be used with a system, depends
on the model and software revision. Please refer to Appendix A “Product
Information” in the Philips CMS Patient Monitoring System Service Guide for
detailed information.
If too many modules are plugged in, a message is displayed in the system message
field on the screen as follows:
Currently ignored module in rack position R-P
where:
R = the number of the rack (1 = internal, 2 = first satellite, and so on)
P = the slot number in that rack (1 = left-most slot, 8 = right-most slot)
The following message is displayed if an unknown module is plugged into the rack:
Unrecognized module in rack position R-P
3-30 CMS Patient Monitoring System
CMS Patient Monitoring System Software Configurations
CMS Patient Monitoring System Software Configurations
Introduction
The CMS display module shows one of three types of screen, depending on the level
of operation taking place. The screens are: the Standard Display, the Selection
Window, and the Task Window.
Standard Display
This display shows the parameter information that previously had been selected to be
monitored. The information is displayed as waveforms and numeric readouts. In
addition, alarms, INOP messages, bed labels, date and time, and arrhythmia messages
(when assigned) are displayed.
The numeric values associated with each waveform are displayed with the waveform.
Numeric information is updated every two seconds. If a color display is being used,
the waveform and its associated parameter value are displayed in the same color.
Pressing the Standard Display key (or Main Screen in later versions) returns the
display to Standard Display.
Selection Window
The selection window is used to select an activity or function. The window is entered
by pressing one of the blue-labeled hardkeys on the control panel or the keypad.
When the selection window appears, the last line is highlighted, indicating that it is
active. The highlight can be moved to a different row by using the arrow keys on the
control panel or the handheld keypad (if they are highlighted), or by pressing the
same hardkey that was used to open the window. Then, pressing the softkey
associated with the desired function invokes the task window for that function.
Task Window
The task window is used to make changes to parameters or screen displays, or to
perform functions. Each parameter or procedure has a task window.
The task window is entered either by using the selection window or by pressing the
setup key on the module. Once in a task window, the softkeys can be used to select
one of the options that appears at the bottom of the display.
Screen Messages
At any time, two types of message can appear on the display: prompt messages,
which instruct the user to perform an action, or status messages, which give
information about a current situation.
An example of a status message is as follows:
sync output not available, plug-in ECG module
The previous message would be displayed as long as the ECG module was not
plugged in. Depending on the operating level, the message would be displayed either
in the appropriate Task window or at the top of the Standard Display screen.
CMS Patient Monitoring System 3-31
System Overview Exercises
System Overview Exercises
1. The types of patient data collected and processed by the CMS are
__________________ and ____________________ data.
2. Which CMS module uses integral or external keypads to accept user input?
a. Computer Module
b. Display Module
c. Module Rack
d. Plug-in Parameter Modules
3. Which bus transfers data and control signals among its users?
a. Message Passing Bus
b. Local Bus
c. Utility Bus
4. Which bus connects master and local cards into clusters?
a. Message Passing Bus
b. Local Bus
c. Utility Bus
5. Which component of the power system generates 60V DC from the facility’s main
power?
a. Computer Module’s DC-to-DC converter
b. Computer Module’s Utility Bus
c. Computer Module’s central processor
d. Display Module’s power supply
6. Which component of the power system distributes the required voltages to the
monitor’s other components?
a. Computer Module’s DC-to-DC converter
b. Computer Module’s Utility Bus
c. Computer Module’s central processor
d. Display Module’s power supply
7. Which component performs diagnostics when the system is powered up?
a. Computer Module’s DC-to-DC converter
b. Computer Module’s Utility Bus
c. Computer Module’s central processor
d. Display Module’s power supply
3-32 CMS Patient Monitoring System
System Overview Exercises
8. Which software releases support both 10 and 15 MHz CPU cards?
a. Release A and B
b. Release A, B, and C
c. Release A, B, C, and D
9. Which processor contains its own memory array for the application software code?
a. Configurable Processor Card
b. Application CPU
c. Utility CPU
10. Which of the following will get a user directly to the task window for performing
a function?
a. The Standard Display key
b. A blue-labeled hardkey
c. The plug-in module’s setup key
d. a and b
e. b and c
Answers
1. physiologic, management
2. b
3. a
4. b
5. d
6. b
7. c
8. b
9. a
10. c
CMS Patient Monitoring System 3-33
System Overview Exercises
CMS Patient Monitoring System Functional Modules
Introduction
This section of the chapter covers the functional modules of the CMS in more depth.
It includes details on the physical and functional components and operations for
several of the modules.
Information on the components and operation of the Computer Module is covered in
the two Functional Card sections of this document. Information on the components
and operation of the Plug-in Parameter Modules is covered in Chapters 1 and 2.
Objectives
Concepts
After successfully completing this section, you should be able to identify the:
•
Purpose and functions of each major functional module of the CMS.
•
Physical components, including controls and connectors.
•
Functional components and operations of the Display Module.
The following concepts are covered in this section of the chapter.
•
Computer Module- This receives and processes data from the Plug-In Parameter
Modules and sends it to the Display Module to be displayed as waveforms and
numeric values. The front of the Computer Module can have either an integral
module rack or a blank panel. The Computer Module contains connectors on the
front for a rack and other external devices, such as defibrillators. The rear of the
module contains connectors for power, ground, network, video, and several
interfaces.
•
Display Module- This provides the video display and, in the case of the CRT
display, power for the CMS. Several models are available; displays may be the
main displays, independent displays, or slave displays. Up to three slave displays
may be connected. Main displays have a Control Panel on the front, but
independent and slave displays do not. The number and type of controls and
connectors depend upon whether a display is a main display or not. The Control
Panel controls are used to display screens of data, respond to alarms, and access
various functions of the system’s software.
•
Module Rack- This connects the Plug-In Parameter Modules to the Computer
Module. The rack may be an integral rack, which is connected to the front of the
Computer Module, or a satellite rack, which is connected remotely. An integral
rack can support up to eight single-width plug-in modules and up to three satellite
racks. A satellite rack can support either six or eight plug-in modules and one
additional satellite rack. The integral rack also has a connector for defibrillator
synchronization.
•
Plug-In Parameter Module- Collects most of the patient data and processes
patient measurements; three of the modules do not take measurements. Fourteen
types of module are available. Some of them have transferable settings that are
retained when the module is transferred from one rack to another. Each module
has a connector on the back for the rack; most have front connectors for
accessories that are connected to the patient.
3-34 CMS Patient Monitoring System
Computer Module
Topics
This section contains the following topics.
Table 3-11 Topics in the Function Modules Section
Topic
Page
“Computer Module”
3-35
“Integral Power Supply - Computer Module (M1046B)”
3-40
“Remote Power Supply (M1047A)”
3-41
“Display Module”
3-43
“Remote Keypad”
3-54
“Module Racks”
3-55
“Plug-in Parameter Modules”
3-58
Computer Module
Introduction
The Computer Module is the heart of the CMS. It distributes all of the power, clocks,
and data for the entire system. The Computer Module receives data on patient
measurements from the Plug-In Parameter Modules, processes the data, and sends it
to the Display Module to be displayed as waveforms and numeric values.
All of the functional cards for the CMS reside within the Computer Module, which
manages their operations. For details on the bus architecture and configuration of the
module, refer to CMS Bus Structure in the System Overview Section (“CMS Patient
Monitoring System Bus Structure” on page 3-10). For details on the operations and of
the function cards, see the Master Card section (“Master Card Overview” on page 364) and Local Card section (“Local Card Overview” on page 3-111) of this document.
Front of the
Computer Module
Front Connectors
The front of the Computer Module is shown in the following figure. The module can
have an integral module rack at the front, where the plug-in modules are connected. If
the module uses a satellite rack instead of an integral rack, the front panel is blank.
The front of the Computer Module contains two function cards with connectors, the
Rack Interface card connector in slot 18 and the CPC card connector in slot 12 in later
releases. The Rack Interface connector is used to collect output for the Computer
Module from the plug-in module rack (integral or blank) and the CPC Flash port is
used by the CPC Programming Tool for programming functions. Most models contain
a Sheet Metal Cover over the front function cards. The cover has two ports for access
to the front connectors
CMS Patient Monitoring System 3-35
Computer Module
.
FRONT FUNCTION CARDS
SIT BEHIND SHEET METAL COVER
CPC FLASH
PORT
SHEET METAL
COVERING THE FRONT
FUNCTION CARDS
RACK INTERFACE
CONNECTOR PORT
INTEGRAL RACK
Figure 3-13 M1046A Computer Module Front Connectors
3-36 CMS Patient Monitoring System
Computer Module
Front Connectors new
Computer Modules
(M1046B)
There are extra connectors on the front of the M1046B Computer Modules with an
integral power supply.
Remote Switch
This connects the integral power supply to the backplane of the computer module and
allows the flatscreen display to control the power for the Computer Module.
FE-Link & ECG sync
These connectors are found on the AUX_CONNECTOR card in slot 24 to allow
access to the RACK_IF card in slot 18 behind the power supply. An ECG adapter
allows you to connect to the ECG sync connector through a hole in the front plastic
cover.
CPC Connector
ECG Adaptor
FE-Link Connector
Remote_Switch
Connector
Rack-IF Connector
ECG Connector
FE-Link
Connector
Remote_Switch
Function Card
Rack_IF
Function Card
Aux_Connector
Function Card
Figure 3-14 M1046B Computer Module Front Connectors
CMS Patient Monitoring System 3-37
Computer Module
Rear Connectors
The rear panel of the Computer Module will have several connectors. The number
and the type of connectors present is dependent upon which function cards are fitted
in the Computer Module backplane. Any unused rear backplane function card slots
are fitted with blank slot covers. A typical Computer Module rear panel is shown
below.
Table 3-12 Computer Module Rear Connectors
Connector
Function
1
System Power Connector
(DC/DC Convertor)
15-pin “D”-type connector, used to input the 60V dc from either a Main CRT Display
Module or the Remote Power Supply Module if a flatscreen is used as the main display.
For M1046B: The 60V dc is supplied from an integral power supply. A shorting stub
MUST be installed in this connector or the system will not function correctly.
2
Equipotential Grounding
Terminal
Used to connect the Computer Module to the hospital's grounding system.
3
SDN Connectors
(SDN Interface)
Philips connectors, used to input/output information to/from a SDN network.
4
Human Interface Connector
(Utility CPU)
Human Interface Link (HIL) connector, used to input the information from the Control
Panel in the Main Display Module and the Remote Keypad.
5
Nurse Paging Relay output
Mini-phone jack, used to connect to the hospital's Nurse Paging System.
6
Analog Interface Connector
37-pin “D” type connector used to output information to analog devices.
3-38 CMS Patient Monitoring System
Computer Module
Table 3-12 Computer Module Rear Connectors (Continued)
Connector
Function
7
RS232 Connectors
(RS232 Interface)
Two 25-pin “D” type connectors used to output information to a printer or computer
systems. Only the upper connector (port 2) can be used to output RS232 information to
printers.
8
HDLC Connector
Used to connect to a STRIP recorder, M1117A.
9
Video Out Connector
(CDSPC-Video or DSPC)
9-pin “D” type connector, used to output information to be displayed on the
Display Module.
10
PS ON/OFF connector
(DSPC_Flat)
Used to control remotely the 60V DC output of the Remote Power Supply Module.
For M1046B with an integrated power supply, this connector is not used.
11
Video Out Connector
(Flatscreen)
Used to output information to be displayed on the Flatscreen Display Module and also to
output 60V DC to the Flatscreen Display Module.
NOTE
No connection can be made to the following cards: Application CPU, CDSPC
Control, EPROM, or SRAM.
CMS Patient Monitoring System 3-39
Integral Power Supply - Computer Module (M1046B)
Integral Power Supply - Computer Module (M1046B)
The M1046B Computer Modules use a flatscreen M1095A as the main display. The
power supply previously located in either the main CRT display or the Remote Power
Supply is replaced by an Integral Power Supply located in this Computer Module
(M1046B).
Integral Power
Supply - Connectors
and Controls
Power
Indicator
(1)
Fuse Holders
(3)
Power
Connector
(4)
Remote_Switch
Card Connector
(2)
Figure 3-15 Integral Power Supply Connectors and Controls
3-40 CMS Patient Monitoring System
Remote Power Supply (M1047A)
Table 3-13 Integral Power Supply Controls and Connectors
Controls and Connectors
Function
1
LED mains power indicator
This indicates that the Integral Power Supply is connected to the local power.
2
REMOTE_SWITCH card
connector
This is a cable-end connector, used to connect the Integral Power Supply to
the REMOTE_SWITCH card in the Computer Module.
3
Fuse Holders
Two fuse holders for the line protection fuses. (2 x 3.15 A H)
4
Local Power Connector
This is a 3-pin connector, used to input the local line voltage.
Remote Power Supply (M1047A)
The CMS can use the flatscreen M1095A as the main display instead of a CRT
display. In this case, the power supply usually located in the main CRT display has to
be replaced by a Remote Power Supply.
Front Panel Controls
- Remote Power
Supply
The controls on the front panel of the Remote Power Supply are shown below:
1
2
Figure 3-16 Remote Power Supply Front Panel
Table 3-14 Remote Power Supply Controls and Connectors
Controls
Function
1
ON/OFF Switch
Used to turn the Remote Power Supply ON/OFF.
2
Power ON indicator
Green LED which is lit when the power supply is switched ON.
CMS Patient Monitoring System 3-41
Remote Power Supply (M1047A)
Remote Power
Supply - Rear
Controls and
Connectors
The controls on the rear panel of the Remote Power Supply are shown below:
Figure 3-17 Remote Power Supply Rear Panel
Table 3-15 Remote Power Supply Rear Panel Controls and Connectors
Controls and Connectors
Function
1
Remote ON/OFF Input
This cable connects the Power Supply to the video interface board (located in
the CMS Computer Module). It is a female “modular jack” connector with 6pins, used to input the power supply output ON/OFF signal from the
Flatscreen Display.
2
60 V DC (120W max) Output
This is a female 15-pin Sub-D-Type connector, used to output the 60 V dc
line voltage to the Computer Module.
3
Fuse Holders
Two fuse holders for the line protection fuses.
4
Local Power Connector
This is a 3-pin connector, used to input the local line voltage.
5
Equipotential Grounding
Terminal
This is a grounding stud connector, used to connect the system to an
equipotential grounding system.
3-42 CMS Patient Monitoring System
Display Module
Display Module
Introduction
The Display Module is the hub of the system’s human interface. Its video display
terminals and keypads enable users to set and change measurement parameters and
alarms, enter and view data on multiple patients, and configure the system’s software.
The Display Module also supplies power to the system through its connection to the
main power source and its internal power supply.
Each CMS may have up to two independent displays. For 14” CRT displays, each
main or independent display can support up to three slave (slave) displays. Main
displays have an integral keypad, called a Control Panel, on the front panel, and also
support a handheld keypad.
Display Models
Several models of the Display Module are available:
•
M1092A 14” Monochrome Display
•
M1094A 14” Color Display
•
M1094B 14” Color Display
•
M1095A 10.4” Flatscreen Color Display
•
M1097A 15” XGA Flatscreen Color Display
•
M1234B 21” Color Display
•
Any off-the-shelf XGA Display
The 10.4”, 14” and 15” and off-the-shelf XGA displays can be used as main displays,
independent displays, or slave displays. The 21” display is a remote display.
Front of Main
Display
The following figures show the front of the main display, which contain a Control
Panel and various switches, controls, and connectors.
NOTE
From Rel. B.0 any XGA display can be used as main display.
Since these displays do not provide a Control Panel,
operation is possible with either the Remote Keypad or, from
Rel. C.0, via touchscreen or mouse. The External Alarm
Device is required for connections and alarm lights and
sounds (please refer to Figure 3-24 “External Alarm Device
controls and connectors”).
CMS Patient Monitoring System 3-43
Display Module
mar2bb.mif
CONFIRM
SILENCE /
RESET
ALARMS/
VOLUM E
SUSPEND
MAIN
SCREEN
OTHER
PATIENTS
MONITOR
PROCEDURES
SETUP
CHANGE
SCEEN
REALTIME
RECORD
TRENDS/
CALC
DELAYED
RECORD
MODULE
SETUP
AIRWAYS GASES/
VENTILATION
HIL
ON/OFF Switch
Power ON
Indicator
Contrast
Control
Brightness
Control
Control
Panel
Human
Interface
Connector
Figure 3-18 Front Panel of Main Display Unit
Power Indicator
Light
Screen Brightness
Control
Control Panel
Power On/Off switch
(also remote on/off
for power supply)
Figure 3-19 Front Panel of 10.4” Flatscreen Display
On-Screen Display
Operation Keys
Power Switch / OSD On/Off
Power-On Indicator LED
Figure 3-20 Front Panel of 15” Flatscreen Display
3-44 CMS Patient Monitoring System
Display Module
Front Panel Controls
and Connectors
On/Off Switch
Power On Indicator
Contrast Control
Brightness Control
Human Interface Link
Connector
Control Panel
The following is a description of the control panel on the front of the CRT display.
A push button switch, used to turn the complete system on and off. The switch is
pushed in for power on.
A green LED, which is lit when the system is switched on.
A rotary control, used to vary the contrast of the display (not available on the
Flatscreen Display).
A rotary control, used to vary the brightness of the display.
A Philips-HIL connector, used to input information from a remote keypad connected
to the master display. This connector may be covered by a plastic insert when not in
use (see rear of flatscreen display for this connector).
The user interface of the Display Module. See the following section.
The following is a description of the control panel on the front of the M1095A 10.4”
Flatscreen display.
On/Off Switch
A push button switch, used to turn the display on and off. The switch is pushed in for
power on.
Brightness Control
A rotary control, used to vary the brightness of the display.
Power On Indicator
A green LED, which is lit when the system is switched on.
Control Panel
The user interface of the Display Module. See the following section.
CMS Patient Monitoring System 3-45
Display Module
Rear of Main
Display
The rear of the M1092A and M1094A main displays is shown in Figure 3-21. The
rear of the M1094B main display is shown in Figure 3-22 and rear of M1095A in
Figure 3-23.
90 xHuman
120Interface
Equipotential
rounding Terminal
Connector
Video Out
Connector
M1092A
xxxxx x
N
SA
C
R
LR 493 94
HIL
STANDARD NORM E
C22 NO 12 b
RISA
CATEGORIE
CLASS DE RISQUES
FI
tuv
GS
871-8
VIDEO
CAUTION
ATTENTION
VORSICHT
CUIDADO
U
System Power
Connector
Limited
UL MEDICAL
E QUIPMENT
Video Termination
Switch
U
75
U
HIGH
IMP.
VIDEO
U
Video IN
Connector
Local Power
Connector
Fuses
mar5b
Figure 3-21 Rear of M1092A and M1094A Main Displays
Local Power Connector
(7)
Fuses (6)
Equipotential Grounding
Terminal (12)
Video Termination Switch (1)
Video Out Connector (10)
Video In Connector (9)
Human Interface
Line Connector
(11)
System Power
Connector
(8)
rear1
Figure 3-22 Rear of M1094B Main Display
3-46 CMS Patient Monitoring System
Display Module
Combined
Video In /
Power Connector
Brightness
Control
Standby
Switch
Human Interface
Link Connector In
Human Interface
Link Connector Out
M10953d.tif
Figure 3-23 Rear of M1095A 10.4” Flatscreen Display
External Alarm
Device Connectors
and Controls
The External Alarm Device, for use with XGA displays, provides visual and audible
alarm indicators. It has a bracket to hold the Handheld Keypad. It also provides an on/
off switch to remotely control the M1046B CMS Computer Module.
CAUTION
Red Alarm
indicator
Always locate this device in such a way that the speaker at
the rear and the lights on the front are not blocked.
Yellow Alarm
indicator
Alarms-Off indicator
Green LED
Remote On-Off
to Computer Module
On-Off Switch
Keypad
Mounting
Bracket
HIL to Computer Module
HIL to Keypad
Universal Mounting Clamp
eadevice.hpg
Figure 3-24 External Alarm Device controls and connectors
CMS Patient Monitoring System 3-47
Display Module
CRT Display Rear
Panel Connectors
and Controls
Video Termination
Switch
Fuse Holders
Local Power Connector
The following is a list of the controls and connectors on the rear of the CRT display.
A switch used to terminate the video signal at this display; it must be switched to the
75 Ohm position if only a main display is used. When a remote display is connected,
the video termination switch on the main display must be switched to High Imp.
However, the last display in the chain must be switched to 75 Ohm.
There are two fuse holders for the line protection fuses, one for the higher operating
voltage range and one for the lower operating voltage range.
A 3-pin connector, used to input the local line voltage. The display is powered
directly from the main power source through a 3-pin IEC power inlet plug. A voltage
selector is not necessary; the voltage is detected and selected automatically by the
display. This works for a voltage range of 90V AC to 264V AC.
The French ICU version has a mains-operated relay with one pair of contacts
connected to a mini-phone jack socket. When the power is present, the contacts are
closed. Therefore, loss of power breaks the circuit, which can be used to control an
alarm.
System Power Connector
When the display is used as a main display, the 60V output at the 15-pin System
Power connector is used to power the DC-to-DC converter in the Computer Module.
The System Power connector is not present on remote displays.
Equipotential Grounding
Terminal
A grounding stud connector, used to connect the display module to an equipotential
grounding system, if required. The overall system is normally grounded at the
grounding terminal on the Computer Module.
Human Interface Link
Connector
Input and Output
Signals
The Philips-HIL connector on the rear of the display provides the connection to the
Utility CPU in the Computer Module. Another Philips-HIL connector on the bezel of
the display allows a handheld keypad to be connected. When this connector is not in
use, it may be covered with a blanking plug.
The horizontal sync, vertical sync, and video input signals enter the display through
the Video In plug on the rear of the display. For main displays, the input signals are
delivered by the video controller card in the Computer Module. For slave remote
displays, the signals are from the main display.
The Video Out connector allows a remote display to be daisy-chained to a main or
remote display. Up to three remote displays may be connected to the system. The
Video Termination switch allows you to select the correct impedance for the display:
1 kOhm if a slave display is connected within the chain and 75 Ohm for the last
display in the chain. The switch is a push-button on the M1092A and M1094A
displays, a two-pole on the M1094B display.
3-48 CMS Patient Monitoring System
Display Module
The following is a list of the controls and connectors on the rear of the Flatscreen
display.
Brightness Control
Standby Switch
Combined Video In/
Power Connector
A rotary control, used to vary the brightness of the display.
Controls the M1047A Power Supply 60 V DC output.
This is a male SCSI connector with 25 pin pairs used to input the video signal and the
60 V dc line voltage.
Human Interface Link
Connector In
This is a Philips-HIL Connector used to connect the handheld keypad.
Human Interface Link
Connector Out
This is a Philips-HIL Connector used to output the information from the keypad and
control panel to the Utility CPU function card in the computer module.
CMS Patient Monitoring System 3-49
Display Module
Switch-Mode Power
Supply (SMPS)
The SMPS supplies all the power for the operation of the local equipment and the
integral and satellite module racks, including the Plug-in Parameter Modules.
Three types of SMPS are used: one for the M1092A display, one for the 1094A
display, and one for the M1094B display. The differences are noted and covered
separately in Table 3-16
Table 3-16 SMPS Characteristics
M1092A and M1094A
M1094B Display
A 28V supply is provided for the
deflection board of the M1092A
Monochrome Display.
Line voltage is routed through the SMPS
to another SMPS on the deflection board
of the M1094A Color Display.
One SMPS for all voltages required.
Supplies the de-gausing coils for the display screen. (M1094A/B only)
Supplies the power-on LED and the Philips-HIL board on the bezel of the display.
For the main display, it also provides 60V for the Computer Module. The DC-to-DC
converter receives the 60V and produces the voltages for the function cards.
The SMPS in the
M1092A and
M1094A Displays
The SMPS is connected to the line voltage through a line filter. With the M1094A
color display, the line filter is located externally. With the M1092A monochrome
display, the line filter is located internally.
Although difficult to see, light from a red LED can be seen through the rear of the
SMPS case to show that the 60V is present.
SMPS in the
M1094B Display
Human Interface Board
The SMPS is connected directly to the line voltage.
The Human Interface board, shown in Figure 3-25, controls the interface between the
user and the system. This board includes the following functions: Philips-HIL control,
sound generation and audio power amplification, lamp (LED) control and driver, key
pad scanning, key encoding, key code transmission to the Computer Module through
the Philips-HIL, and brightness and contrast controls.
3-50 CMS Patient Monitoring System
Display Module
Figure 3-25 Human Interface Board of the Display Unit
CMS Patient Monitoring System 3-51
Display Module
Data
Transfer
Data transfer to and from the Computer Module in the CMS is performed serially.
This is done by the Philips-HIL using the transmit/receive circuit called CHARON.
This device sends data in response to a POLL command and receives data from the
HIL master using the WRITE REGISTER command.
The data received are used to control the various LEDs on the keypad (for example:
visual alarms and key back lighting), activate or trigger the audible tones (for
example: alarms, QRS tick, and prompts), and enable or disable on-board functions.
Sound
Generation
The Human Interface board generates an audible tone for various conditions. To
prevent ambiguity, each condition has its own tone. Each tone has its own control
word which controls it. When this control word is sent to the processor, it generates
the required tone.
The tones for non-alarm conditions are derived directly from the processor. The alarm
tones are processor-generated, based on variable frequency steps.
Volume
Control
The Human Interface board has three volume controls: Alarms, QRS tick, and
Miscellaneous.
All three controls function in the same manner. The analog tone is applied to the Vref
input of a digital-to-analog converter (DAC). The digital input to the DAC is the
volume control. The attenuated tone (DAC output) is summed and input to the power
amplifier for the loud speaker. The click tone has a fixed volume and is routed to the
summing amplifier.
Lamp Control
The Human Interface board controls and drives seven keypad lamps. The processor
receives the lamp ON/OFF data and latches a control register/driver.
Key Switches
The processor scans the 25 keys, records a change in switch position, and performs a
key bounce function. When a switch position change is registered, the corresponding
key code is transmitted to the Philips-HIL master.
Brightness
and Contrast
Two rotary controls are provided to adjust the display. The brightness and contrast
have part of the control exposed through two holes in the bezel. The brightness
control is on the left and the contrast control is on the right.
The brightness control for the flatscreen display is on the rear of the display.
3-52 CMS Patient Monitoring System
Control Panel
Remote Displays
Video Termination
Switch
There are three types of remote (slave) display: 14-inch color, 14-inch monochrome,
and 21-inch color. The controls and connections for the 14-inch monochrome and
color remote displays are identical.
The only control on the rear panel of the 14-inch remote display is the Video
Termination switch. It is a push-button switch, used to terminate the video signal at
this display. This switch must be ON (in) if the remote display is the last in the chain.
Otherwise the switch must be OFF (out).
There are also two fuse holders for the line protection fuses, one for the low operating
voltage range and one for the high operating voltage range. The M1094B is shipped
with fuses for 3V and 1.5V.
Control Panel
The main display module contains a Control Panel or integral keypad located on the
bezel of the main display module. It is used to allow the user to display different
screens on the main and independent displays, respond to alarms, and access the
various functions of the system.
The keypad comprises 25 keys and lamps for the alarms on/off and key back-lighting.
The controls and indicators on the Control Panel fall into one of three categories: a
softkey, hardkey, or an alarm lamp, as shown in Figure 3-26.
The hardkeys are engraved with black letters and their function is always the same.
The softkeys, which are the seven keys nearest the screen, are blank. Their function
changes during the operation of the system. The current function of each key is
displayed as a highlighted block at the bottom of the screen directly over each softkey.
On the right of the keypad are four blank keys arranged as a diamond. They are used
to move the highlighted block cursor around the screen. On the left of the keypad is
the alarm status indicator and the Silence/Reset and Suspend hardkeys.
The Suspend key is only present on the M1106B and M1106C versions of the integral
keypad.
Alarm Lamps
Three alarm lamps are located in the upper left corner of the Control Panel. These
lamps are lit when a red or yellow alarm condition exists.
CMS Patient Monitoring System 3-53
Remote Keypad
Softkeys
(1)
50/140
Alarm Indicators (2)
(18)
Confirm
Silence/
Reset
Alarms/
Volume
Suspend
Main
Screen
Other
Patients
Monitor
Setup
Change
Screen
Procedures
Realtime
Record
Trends/
Calcs
Delayed
Record
Module
Setup
Airway Gases
Ventilation
wclo12a7.tif
(3)
(4)
Hardkeys (6-16)
(5)
Arrow Keys (17)
Figure 3-26 Standard Control Panel
Softkeys
The function of the control panel softkeys is defined by the application that is current
on the display. The label of the key actually appears on the screen and flows to the
appropriate softkey. If there is no label on the screen pointing to a softkey, then that
key has no function in that application.
Hardkeys
The function of a control panel hardkey is defined by the label on the key. The first
row of keys, labeled in blue, moves the user to another level of functionality. The
second row of keys, labeled in grey, performs actions such as recording a waveform.
The hard key descriptions are as follows.
Remote Keypad
Introduction
The Remote Keypad is used to enter data. The keypad has the same softkeys and
hardkeys as the Control Panel. It also has data entry keys for entering letters,
numbers, punctuation, and arithmetic symbols. The Suspend hardkey is only present
on newer versions of the handheld keypad.
Connections
The Remote Keypad is connected to the Philips-HIL connector on the right corner of
the bezel on the master display module, or to the outer Philips-HIL connector on the
rear of the flatscreen display.
Data Entry Keys
The data entry keys are located at the bottom half of the keypad. To enter the value
that is on the key, simply press that key. To enter the value that is above the key, press
shift and then the key. Once you are done entering the letters or punctuation marks,
press the Shift key.
Note: When the Shift key is pressed, the shift light goes on and stays on until the Shift
key is pressed again.
3-54 CMS Patient Monitoring System
Module Racks
Module Racks
Introduction
The Module Racks are used in the CMS to connect the Plug-In Parameter Modules to
the Computer Module. The racks can either be integral to the Computer Module or
connected remotely as satellites.
Racks can support either six or eight single-width plug-in modules. The Rack
Interface card in the Computer Module can support up to four racks; a CMS may have
up to two rack interface cards. The maximum number of Plug-In Modules a CMS can
use is 32.
Types of Racks
Internal Rack
Satellite Racks
There are three types of rack: integral, satellite, and blank.
The internal rack is attached directly to the Computer Module. It can contain up to
eight single-width modules and a defibrillator synchronization output connector. It
has a satellite rack connector for connecting up to three satellite racks.
A satellite rack is mounted away from the Computer Module, usually by the bedside
or on an IV pole. It holds either six or eight single-width modules and has a connector
for another satellite rack. The M1276A Satellite Rack holds six modules, while the
M1041A Satellite Rack holds eight modules.
Satellite Racks are identical in function to the integral rack. However, no defibrillator
connector is provided, and the input connector connects to either another satellite rack
or to the Computer Module.
Blank Rack
Integral Rack
Connectors
The blank rack is used when the Plug-In Parameter Modules do not require close
placement to the Computer Module. The blank rack has only two functions. These
are: (1) to provide a path for the Rack Interface connection to the front of the
computer module and (2) to provide a defibrillator connection on the front of the
computer module.
The internal rack has connectors for:
•
Eight single-width plug-in modules.
•
Three satellite racks.
•
A defibrillator connector, for synchronizing the defibrillator firing and receiving a
marker pulse.
CMS Patient Monitoring System 3-55
Module Racks
Satellite Module
Rack Connectors
There are three types of connector on the satellite racks. These are described as
follows.i
Module
Connectors
These are female module connectors, used to input the information from the plug-in
modules to the rack.
Rack Input
Connector
This is a male rack interface connector, used to connect the rack to the Computer
Module or to the previous rack in the chain.
Rack Output
Connector
Module Rack
Theory of Operation
This is a female rack interface connector, used to connect the rack to the next rack in
the chain.
The following section details the operations of the Module Rack.
Power Supply
The Module Rack power supply supplies the +5V for the decoding and addressing
logic of the rack, as well as for the opto-couplers in the plug-in modules. One
secondary winding of the power supply transformer provides the SYNC-Signal for
the individual power supplies of the plug-in modules.
Data Transfer
The internal module rack provides a communication path, or Front-End Link
(FE_LINK), between the Rack Interface card in the Computer Module and the
satellite racks as well as the plug-in modules in the internal rack.
Each of the eight plug-in connectors is addressed (by the addressing and decoding
logic) and then polled by the Rack Interface Card. If the connector has a module
present, then the plug-in module places data about its identity on the Tx line. This Tx
line is connected to the Rack Interface card. The Rack Interface places the identities
of the plug-in modules into a scan table. (For more information about the FE-LINK
and module polling, see Rack Interface Card in the section on Local Function Cards.)
The rack's differential receiver and transmitter ensures the fast and reliable passage of
data over the FE-LINK for up to 30 minutes.
Module Rack Block
Diagram
The module rack consists of the power system, decoding logic, input, output, and the
module connectors.
3-56 CMS Patient Monitoring System
Module Racks
Figure 3-27 Module Racks
CMS Patient Monitoring System 3-57
Plug-in Parameter Modules
Plug-in Parameter Modules
The parameter modules are used to derive physiologic measurements from patients.
Several modules do not take measurements but print or transfer data among monitors
or external equipment.
Plug-in modules use a variety of accessories for obtaining physiologic data from
patients. These may be electrodes, probes, or other types of transducers. The
accessories used by each module are color-coded to match the module’s connectors
for easier identification.
Types of Module
The following types of plug-in module are available for the CMS. Some modules
have more than one model for different patient groups or options.
Table 3-17 Plug-In Parameter Modules
Module Name
Measurement
ECG
Electrocardiogram
ECG/RESP
Electrocardiogram/Respiration
ECG/RESP (Option
#C01)
Electrocardiogram/Respiration with Analog Respiration
Output
PRESS
Invasive Blood Pressure
NBP
Non-invasive Blood Pressure
C.O.
Cardiac Output
CO2/SSCO2
Carbon Dioxide/Side-Stream Carbon Dioxide
FIO2
Fractional Inspired Oxygen
tcpO2/tcpCO2/
Transcutaneous Oxygen and Carbon Dioxide Pressures
SpO2/PLETH
Arterial Oxygen Saturation/Plethysmogram
SvO2
Mixed Venous Oxygen Saturation
TEMP
Temperature
BLOOD ANALYSIS
Blood Analysis
VueLink
This module does not take measurements. It provides data
from external devices.
Recorder
This module does not take measurements. It prints
measurements that are being displayed.
Data Transfer
This module does not take measurements. It transfer
measurements between monitors.
3-58 CMS Patient Monitoring System
Plug-in Parameter Modules
Alarms
The front of the parameter module has a setup key labeled with the name of the
module. For example: the setup key on the ECG module would be labeled ECG.
Depending on the module, there may be more keys in addition to the setup key.
Pressing the Setup key on a parameter module results in a light appearing above the
Setup key.
Installing a
Parameter Module
The parameter module slides into the rack until the lever on the base of the module
clicks into place. To remove a module, push the lever upwards and pull the module
out.
“T” Parameter
Module
If a “T” is present on the front of the parameter module, some of the parameter
settings may be transferable when that module is moved from rack to rack. There is a
special service mode setting that is made by either a Philips service engineer or the
biomedical engineering department to allow this function.
Connection to the
Rack
The parameter modules can be plugged into two types of rack: integral and satellite.
The integral rack is connected to the front of the Computer Module. The satellite rack
is a free-standing rack that can be attached to an I.V. pole, the bedside, or the wall.
Connection to the
Patient
The front of the parameter module has a connector socket, which is the same color as
the corresponding connector plug on the transducer or patient cable.
Precautions
If a satellite rack is located in close quarters with intravenous solutions such as saline,
severe damage can occur to the equipment if the saline solution is spilled onto the
connectors of either the parameter modules or the satellite rack.
CMS Patient Monitoring System 3-59
CMS Patient Monitoring System Module Exercises
CMS Patient Monitoring System Module Exercises
1. Which CMS module distributes the power, clocks, and data to the rest of the
system?
a. Computer Module
b. Display Module
c. Module Rack
d. Plug-In Parameter Modules
2. How many main displays can be used with one CMS?
a. one
b. two
c. three
d. four
3. Which module has a connector for the SDN Interface?
a. Computer Module
b. Display Module
c. Module Rack
d. Plug-In Parameter Modules
4. Which module provides physiologic measurements from patients?
a. Computer Module
b. Display Module
c. Module Rack
d. Plug-In Parameter Modules
5. Which connector is common to both the Computer Module and the Display
Module?
a. Analog Interface connector
b. Local Power connector
c. System Power connector
6. Which module supports an integral rack in its front?
a. Computer Module
b. Display Module
c. Module Rack
d. Plug-In Parameter Modules
7. Which module contains a DC-to-DC converter?
a. Computer Module
b. Display Module
3-60 CMS Patient Monitoring System
CMS Patient Monitoring System Module Exercises
c. Module Rack
d. Plug-In Parameter Modules
8. Which module includes a Switch-Mode Power Supply?
a. Computer Module
b. Display Module
c. Module Rack
d. Plug-In Parameter Modules
9. Which module has a Control Panel on its front panel?
a. Computer Module
b. Main Display Module
c. Independent Display Module
d. Plug-In Parameter Modules
10. What is the maximum number of single-width plug-in modules that an integral
module rack can hold?
a. four
b. six
c. eight
d. twelve
11. Which module provides a communication path called the Front-End Link?
a. Computer Module
b. Display Module
c. Module Rack
d. Plug-In Parameter Modules
CMS Patient Monitoring System 3-61
CMS Patient Monitoring System Module Exercises
Answers
1. a
2. b
3. a
4. d
5. c
6. a
7. a
8. b
9. b
10. c
11. c
3-62 CMS Patient Monitoring System
CMS Patient Monitoring System Module Exercises
CMS Master Function Cards
Introduction
This section provides detailed information on the master function cards contained in
the Computer Module of the CMS. The information includes connections, theory of
operation, functional block diagrams, and testing information.
Information on local function cards is contained in another section.
Refer to the Computer Module description in the CMS Modules section for details on
card configurations.
Objectives
Concepts
After successfully completing this module, you should be able to:
•
Identify the master function cards used by the CMS.
•
Describe the function and operations of each card.
The following concepts are important to the operation of master function cards.
Bus Arbitration -- A method of determining which card may have access to a bus at
any given time for transmitting messages. Master function cards arbitrate their own
access to the Message Passing Bus through an Arbiter function. The Arbiter uses the
data’s priority level, which is set by the CPU, to gain access to the bus.
Bus Error Logic -- A timer that watches the microprocessor’s address strobe for an
unusually long activity, indicating that a memory address may be invalid. The logic
then asserts a Bus-Error to tell the processor that the memory was not accessed
correctly.
FIFO -- First In, First Out. This term indicates the way in which a memory buffer
works. With a FIFO buffer, the first data put into the buffer is the first data pulled out.
In contrast, a LIFO buffer works the opposite way: the last data put in is the first data
pulled out.
EPROM -- Erasable Programmable Read-Only Memory. The EPROM card holds the
operating software for the Master Application CPU. If the CPU is a Configurable
Processor Card, the EPROM is a Flash EPROM.
The Application CPU card is placed in the lowest-numbered slot on the backplane. At
system start-up, this CPU executes the diagnostics and application software.
SRAM -- Static Random Access Memory.
CMS Patient Monitoring System 3-63
Master Card Overview
Tune RAM -- A type of RAM used by master cards to listen for data on the Message
Passing Bus. It matches message headers that it is storing with headers being
transmitted on the bus, in order to determine which messages to read into receive
buffers on the bus interface.
Wait State -- The devices that a microprocessor may be required to receive
information from, or write information to, may not be as fast as the microprocessor. If
the device is slower, the microprocessor can go into a wait state so that the device can
complete its current operation before more data are transferred. Wait states are
implemented by additional clock cycles being placed into the data sequence.
Topics
This section contains the following topics.
Table 3-18 Topics in the Master Function Card Section
Topic
Page
“Master Card Overview”
3-64
“Application CPU”
3-69
“Configurable Processor Card”
3-74
“Monochrome Display Controller”
3-78
“Color Display Controller Cards”
3-81
“Color Display Controller Card (New Version)”
3-84
“Flatscreen Display Controller Card”
3-87
“Utility CPU”
3-92
“RS232/RS422 Dual Interface Card”
3-98
“HDLC Interface Card”
3-102
“Analog Interface Card”
3-105
Master Card Overview
Introduction
The CMS contains two types of function card: master cards and local cards. Master
cards have a microprocessor and connect to the Message Passing Bus (MPB); most
also have a connection to the Local Bus. Local cards perform supporting functions for
the master cards and connect to only the Local Bus. Master cards communicate with
the system over the MPB and with their corresponding local cards over the Local Bus.
Refer to CMS Bus Structure in the System Overview section for a description of the
bus architecture.
3-64 CMS Patient Monitoring System
Master Card Overview
Master Card
Functions
The following table describes the functions of the master cards.
Table 3-19 Master Cards
Card Name
Function
Application CPU
APP_CPU
Executes software held on an EPROM Card, an SRAM
card, or on the CPU’s SRAM. Data to be processed are
taken from either the CPU’s SRAM, an SRAM Card, or
the MPB. The number of Application CPUs that may be
used by the Computer Module is limited only by the
number of local clusters on the backplane.
Monochrome Display
Controller
DSPC
Controls the monochrome video display. In addition to
this card, the cluster may also contain a language-specific
local card such as the DSPC LANG for Asian character
set.
Color Display
Controller
CDSPC_CTRL
Controls the color video display, along with the local card
CDSPC VIDEO (if present).
DSPC_FLAT
Controls the Flatscreen Display.
Utility CPU
UTIL_CPU
Generates the system clocks for system synchronization
and provides the interface to the Philips-HIL devices. The
Utility CPU uses the local bus to interface with the SDN
and with the Module Racks through the SDN Interface
and Rack Interface local cards.
RS232 Interface
RS232_IF
Allows the computer module to be connected to external
equipment through the use of an RS232 or RS422
interface. This would include equipment such as a local
printer or PC.
HDLC Interface
HDLC_IF
Provides an interface to real-time wave recorders that use
the Standard Recorder Interface Protocol (STRIP). This
card does not connect to the local bus.
Configurable Processor
Card
CPC
Responsible for all application data processing for the
CMS. The CPC receives data from the MPB, processes
the data, and places the results back on the MPB.
Analog Interface
Provides eight channels of analog output that can be
connected to recorders and other data collection
instruments.
CMS Patient Monitoring System 3-65
Master Card Overview
Communication with
the MPB
All master cards contain, as part of their functional components, an MPB Interface
that is used to pass data back and forth from the MPB. The MPB Interface consists of
a custom IC and an external SRAM. The external SRAM is a pair of receive and
transmit FIFO buffers, as shown in Figure 3-28.
Data on the MPB are broadcast to all attached cards for use by any card that requires
it. The broadcast message has a header that identifies the type of data contained in the
message. The MPB does not designate a particular master card to be solely
responsible for bus arbitration; rather, arbitration is determined by the cards
themselves.
Taking Data from
the MPB Bus
The master card prepares to receive messages by designating desired message types
in a memory area called a Tune RAM. The MPB interface reads the header from each
message on the bus. If the message header on the bus matches a header in its Tune
RAM, the MPB Interface reads the entire message and places the data into one of the
receive FIFOs. The data can then be fetched by the CPU. The operation of reading
data from the bus is independent of any other operation taking place on the card.
Placing Data
on the MPB
Data to be written to the MPB are placed into two Transmit FIFOs by the CPU. When
the card receives access to the bus through arbitration, the MPB interface writes the
data to the bus.
Bus Arbitration
When a master card wishes to transmit a message on the MPB, the card’s CPU
assigns the transmit FIFOs a priority level for gaining access to the bus. Each FIFO
may have a priority level of Low, Mean, or High. Access to the bus is gained by the
Arbiter on the MPB Interface. This task, performed by all the cards connected to the
MPB, is how the Computer Module performs bus arbitration for the MPB.
3-66 CMS Patient Monitoring System
Master Card Overview
Figure 3-28 Master Card MPB Interface
MPB Messages
MPB messages consist of words that are each 16 bits in length. Each message has a
header describing the content of the message, such as ECG Wave Lead 1, and the
length of the message. The second part of the message, after the header, is the data.
DC-to-DC Converter
The DC-to-DC converter is a card used in the Computer Module to provide the
operating voltages for the rest of the system.
Functional Block
Diagram
The functional block diagram of the DC-to-DC converter is shown in chapter 3the
following figure.
+5V
60 V
+ 12 V
– 12 V
+ 60 V
Figure 3-29 DC-to-DC Converter Block Diagram
CMS Patient Monitoring System 3-67
Master Card Overview
Theory of Operation
The DC-to-DC converter receives 60V DC as an input from the Display Module. It
converts this input to the +5, +12, and -12V DC required for the operation of the
system. These voltages, along with the 60V DC, are output onto the Utility bus.
Between the input of the 60V DC and the output of the +5, +12, and -12V DC
voltages is a delay of between one to two seconds to make sure that the SYSRES and
PFAIL signals are in the proper state.
SYSRES
SYSRES is the system reset signal. This signal is usually activated when the system
first comes up or when the reset button on a system is pressed. Activating the signal
initiates a sequence of events that results in the system clearing out necessary
registers and reloading appropriate software to start operations.
PFAIL
PFAIL is the powerfail signal. This signal is usually activated very shortly before the
power goes down. This is done to initiate a graceful shutdown rather than an abrupt
ceasing of operations. This allows cards to save required information or, in some
cases, to shut access to their memories in order to prevent corruption of data during
the stages of a powerfail.
Power Fail
Process
If the power fails, the PFAIL signal is asserted by the DC-to-DC converter to alert the
Utility CPU that power is going down.
The Utility CPU would then activate the SYSRES on the MPB. This is to allow the
system to reset all the cards synchronously.
3-68 CMS Patient Monitoring System
Application CPU
Application CPU
Introduction
The Application CPU (APP_CPU) card is one type of CPU used to process data in the
CMS. This CPU would receive data, process it, and then place the results of the data
operation back onto the MPB. The data could be received from its internal SRAM, an
SRAM card connected by the Local Bus, or the MPB.
Two versions of Application CPU card are available: the M1054 10 MHz card, and
the M1051 15 MHz card. The only functional difference in the two versions is that the
15Mhz has increased processing speed. Even though these CPUs are very similar,
they are not interchangeable. A 10 MHz card must be replaced with another 10 MHz
card, and a 15 MHz card must be replaced with a 15 MHz card.
The model of the CMS determines which CPU is used, whether both are used, and
how many are used.
Components
Both types of Application CPU contain the following functional areas: MPB
Interface, FIFO, Local Bus Buffers, Address Decoder and Stack, Output Register,
SRAM (buffered), EPROM, and the 68000 Microprocessor. In addition, the 15 Mhz
CPU contains a Synchronizer, Wait State Generator, and Clock Generator/Divider.
MPB Interface
The MPB Interface is used to interface to the MPB. This is covered in greater detail in
the Master Card Overview in this section of the document.
FIFO
This is a First In First Out buffer. The data written to the buffer first are the data that
are read out first.
Bus Error Logic
The bus error logic is simply a timer that watches the microprocessor's address strobe.
When the processor outputs an address on its bus, it asserts the address strobe to
indicate that a valid memory address is available. However, if the signal is asserted
for too long, the logic assumes that the access was not terminated correctly, that is, the
address strobe was not negated or removed. The logic then asserts a Bus-Error to tell
the processor that it could not access the memory correctly.
Local Bus Buffers
The local bus buffers are used to buffer the address between the card and the Local
Bus. The data are is also buffered between the bus and the card. These bus buffers
connect to the Local Bus, which allows data to be passed between the processor and
the local cards in that cluster.
Address Decoder
and Dtack
The address decoder generates the strobes and select signals for the other devices on
the card, such as the SRAM, EPROM, and the MPB Interface. Access acknowledge
signals are also generated for all devices except the MPB Interface chip, which
generates its own acknowledge signal.
CMS Patient Monitoring System 3-69
Application CPU
SRAM (buffered)
and SRAM
EPROM
68000
Microprocessor
Theory of Operation
The Static RAM (capacity 512 Kbytes) is used for data storage, such as trends, and
may also hold the application software. Note: 64 Kbytes of the 512 Kbytes are
buffered by a special capacitor.
Also called the BOOT ROM (capacity 64 kilobytes), the EPROM contains firmware
start-up code, which locates and identifies the rest of the cards in the cluster.
The Application CPU Card is based around a 68000 Microprocessor.
When the system is turned on, the on-board microprocessor starts to execute code in
the EPROM. The code instructs the microprocessor to perform a hardware test of the
CPU card. After the hardware test is complete, the Application CPU locates and
identifies the other cards in its cluster by using a local card identifier.
The microprocessor on the card then starts to execute the application software. The
application software is located on either the EPROM card, if one exists in the cluster,
or on the buffered SRAM card.
Memory Location
Addressing
Each memory location, on either the CPU card or local memory cards, is addressed
using the processor's 23-bit address bus.
Interrupts
There is a support chip to encode interrupts so the processor can react to interrupts.
Signals such as power fail (PFAIL) and external interrupt (EXINT) from the Local
Bus are treated as interrupts.
LEDs
There are two LEDs connected to the processor through an output latch. These LEDs
are controlled by software and are generally used to indicate either errors during the
boot phase or the status of the board during normal operation. The rest of the latch is
used to generate test signals and identifier access (ACC) signals.
Power Failure
& System Reset
The PFAIL signal is used to inform all other function cards that a SYSRES should be
expected from the Utility CPU. The SYSRES signal is used to reset all the cards. The
PFAIL signal is placed on the Utility Bus by the CPU output latch.
The PFAIL signal is asserted by the Application CPU for two reasons:
(1) the CPU detects that a serious error has occurred in the system, and (2) the
watchdog timer detects a failure in the Application CPU.
The PFAIL signal can also be asserted by the DC-to-DC converter when the power is
about to fail.
3-70 CMS Patient Monitoring System
Application CPU
Functional Block
Diagram
The functional block diagram of the 10MHz and 15MHz Application CPUs are in
Figure 3-30 and Figure 3-31.
Figure 3-30 10 MHz Application CPU
CMS Patient Monitoring System 3-71
Application CPU
Figure 3-31 15 Mhz Application CPU
3-72 CMS Patient Monitoring System
Application CPU
LEDs
The Application CPU card contains three LEDs. The function of each is listed in
Table 3-20
Table 3-20 Application CPU LEDs
Summary of
Functions
LED
Description
One MPB Error LED
(red)
Used to indicate a problem with a device on the board.
Two Error/Status LEDs
(green)
Controlled by software, and may be implemented to
indicate a hardware failure on the card during the boot
phase, when no MPB messages can be sent. When the
system is running, they may also be used to reflect the
status of the card.
The functions of the Application CPU Card are summarized as follows:
•
Performs data processing for the system.
•
Large volatile SRAM (up to 448 kilobytes) work area for processor.
•
Application software is held on an EPROM for the master CPU (the Application
CPU card which is placed in the lowest-numbered slot). For subsequent CPUs, the
application software is held in SRAM.
•
Watchdog facility to detect errors on the CPU Card and report to the system using
a PFAIL signal.
•
Large parameter trends and other data management results may be stored on a
buffered local SRAM Card.
•
Three Error / Status LEDs.
•
Board Hardware is tested every time the system is reset.
•
Power fail protection inhibits access to the on-board buffered SRAM (64
kilobytes). Data retention is better than five hours using a special capacitor.
CMS Patient Monitoring System 3-73
Configurable Processor Card
Configurable Processor Card
Introduction
The Configurable Processor Card (CPC) is a CPU card. It is used to process the
application data for the CMS. The CPC receives data from the MPB, processes the
data, and places the results of the data processing back on the MPB.
The CMS has two CPC versions available. The first version is a CPC with Flash
EPROM, which contains on-board flash EPROM for the application memory PROM
packs and the boot ROM. The second version is a CPC with UV EPROM Daughter
Card, which contains on-board flash EPROM for the boot ROM, and a piggyback
daughter card, connected to the CPC through two 42-pin connectors. The daughter
card contains the application memory PROM packs.
Components
The CPC contains the following functional areas: an 68030 Microprocessor, MPB
Interface, a Flash ROM, DRAM, Fast SRAM, Buffered SRAM, Interface, Temp
Sensor, Service Port, and Daughter Board Interface.
68030
Microprocessor
The CPC CPU is based on the 68030 microprocessor chip.
MPB Interface
This is the interface between the CPC and the MPB. This interface is covered in
greater detail in the opening part of the Master Function Cards section.
Flash EPROM
The Flash EPROM contains the operating software. The flash EPROM is
programmed using the CPC programming tool. The EPROM normally has VPP set
low (between 4.0V and 4.5V) and functions as read-only memory. The tool operates
by setting VPP high (12V) and writing an appropriate instruction to the EPROM.
Two versions of the Flash EPROM are available: M1053-66515 and M1053-66514.
The M1053-66515 contains two types of flash EPROM: a 4 Mb 32 bit wide bank
containing the application memory PROM packs, and a 64 Kbyte 8 bit wide bank
containing the boot ROM. The M1053-66514 contains a 64 Kbyte 8 bit wide bank
containing the boot ROM. It also contains a non-flash daughter card, the M106166501, configured as 768K x 32 bits of memory and occupying up to 3 MB of
processor space.
DRAM
The DRAM is used for two purposes: to download programs from the flash EPROM
for faster execution, and to provide unbuffered storage for applications. The DRAM
is configured as two 32 bit wide banks of 1 MB each.
Fast SRAM
The fast SRAM is used primarily for program execution speed enhancement. The fast
SRAM is configured as one 32 bit wide bank.
3-74 CMS Patient Monitoring System
Configurable Processor Card
Buffered SRAM/
SRAM 3-Hour
The buffered SRAM stores application data in the event of a power failure. The
buffered SRAM is configured as one 32 bit wide (512 Kbytes) bank and four 8 bit
wide (256 Kbytes) banks. All banks are backed up by a super-capacitor to provide a
minimum of three hours of storage.
Daughter
Board Interface
The interface consists of two 42 pin connectors which is connected to the daughter
board.
Address
Decoding
Theory of Operation
The address decoding logic generates strobes and select signals for the on-board
devices (MPB, SRAM, EPROM). Access acknowledge signals are also generated for
all the devices except the MPB Interface Chip, which generates its own acknowledge
signal.
The following defines the operations of the Configurable Processor Card.
Interrupts
The CPC contains a support chip to encode interrupts and to present the interrupts to
the processor.
Bus Error
Logic
The bus error logic consists of a timer that monitors the microprocessor's address
strobe. When the processor outputs an address on its bus, it asserts the address strobe
to indicate that a valid memory address is available. However, if the signal is asserted
for too long, the logic assumes that the access was not terminated correctly, that is, the
address strobe was not negated or removed. The logic then asserts a Bus-Error to tell
the processor that it could not access the memory correctly.
PFAIL and
SYSRES
The PFAIL signal is used to inform all other function cards that a SYSRES should be
expected from the Utility CPU. This is to allow the system to reset all cards
synchronously. One bit of the CPU output latch is used to place PFAIL on the utility
bus.
The PFAIL signal is asserted for two reasons by the CPU: (1) if the CPU detects that a
serious error has occurred in the system, and (2) if the watchdog timer in the MPBchip detects a failure in the CPU. Note: the PFAIL signal may also be asserted by the
DC-to-DC converter.
DRAM
Refresh
The DRAM refresh is controlled by the microprocessor. A 3.2768 millisecond timer
interrupts the processor at set intervals to do the refresh cycle. The refresh cycle is
accomplished by the processor writing to a single address. The DRAM chips cycle
through the banks each time a refresh is performed.
CMS Patient Monitoring System 3-75
Configurable Processor Card
Functional Block
Diagram
Figure 3-32 CPC Card Block Diagram
Daughter Card
Block Diagram
The daughter card contains the following functional areas: Output Enable Decoder,
Memory Select PAL, Address Buffer, and the ROM Banks.
Figure 3-33 Daughter Card Block Diagram
3-76 CMS Patient Monitoring System
Configurable Processor Card
CPC LEDs
The LEDs on the CPC are defined inTable 3-21.
Table 3-21 CPC LEDs
Summary of CPC
CPU Features
LED
Description
One MPB Error LED
(red)
Used to indicate a problem with a device on the card.
Two Error/Status LEDs
(green)
Controlled by software, and may be implemented to
indicate a hardware failure on the card during the boot
phase, when no MPB messages can be sent. When the
system is running, they may also be used to reflect the
status of the card.
The following is a summary of the CPC CPU features.
•
Processes the application data.
•
Contains a large SRAM and DRAM work area for the processor.
•
Includes a watchdog timer to detect errors on the CPU and report to the system
using a PFAIL signal.
•
Error / Status LEDs.
•
Card hardware is tested every time the system is reset.
•
Power fail protection inhibits access to the on-board buffered SRAM.
•
Provides a minimum of three hours of data retention in SRAM using a supercapacitor.
CMS Patient Monitoring System 3-77
Monochrome Display Controller
Monochrome Display Controller
Introduction
The Display Controller (DSPC) card is used by the system to output display data to a
main monochrome display and up to three remote displays. A second DSPC card is
required if the system has to produce two different displays. The second DSPC card is
plugged into a separate cluster.
The DSPC card is a master card, based on a 68000 Microprocessor, with a connection
to the local bus.
Connection to
Display Module
The DSPC card must be connected to the display; therefore, it is plugged into the rear
of the Computer Module rather than into the front. The DSPC card has a 9-pin, Dtype connector on the card edge, which is used to connect to a similar connector on
the rear of the Display Module. Note: the video output connector on the display can
be used to connect to a remote display.
Components
The DSPC card contains the following functional areas: a 68000 Microprocessor,
MPB Interface, FIFO, EPROM, SRAM, Horizontal Wavescroll Logic, Video System
Controller, Pixel Maps, SLIP Chip, Video Buffer and Protection Network, and
Oscillator.
68000
Microprocessor
MPB Interface
FIFO
EPROM
SRAM
Video Ram
The 68000 is the microprocessor used on this card.
The MPB Interface is used to read and write data to the MPB. For more information
refer to the beginning of the Master Function Cards section.
First In First Out buffer.
The EPROM is used to hold the code to be executed at powerup.
The SRAM holds data during operation of the card.
The video RAM has four parts:
Table 3-22 Video RAM Functionality
Plane/Map
Description
Alphanumerics /
Graphics plane 1
(Each plane is 1024 x 512 pixels.) The two alphanumeric /
graphics planes display text, figures and basic graphics
(lines, boxes etc.).
Alphanumerics /
Graphics plane 2
3-78 CMS Patient Monitoring System
Monochrome Display Controller
Table 3-22 Video RAM Functionality
Theory of Operation
Plane/Map
Description
Wave Plane
(2048 x 512 pixels) This higher resolution wave plane
displays the parameter waves, such as ECG.
Attribute Map
(256 x 256 bytes) The attribute map enables parts of the
screen and selects between full-, half-brightness and
blinking.
The DSPC only controls the mechanism of actually displaying information on the
screen. More than one CPU may be required to produce data for the display.
All display data, including local language characters, are produced by the CPUs and
transferred using the MPB.
Data Transfers
Display data, waves, lines, numerics, display attribute data, and control messages are
transferred from the CPUs using the MPB to the DSPC. The microprocessor on the
DSPC places these data into the dual-ported Video RAM using a Video System
Controller. Display attributes -- for example, half-brightness -- are also placed in the
Video RAM.
The pixel data are clocked out of the Video RAM by the on-chip shift registers. These
data then pass through the SLIP Chip, which contains all the video and addressing
logic, before passing it to the video buffers. The data then pass through the protection
network for output to the display; an oscillator is used to synchronize the picture
sweep.
Wave Plane
Character Sets
The wave plane, used for displaying up to six overlapping parameter waves, is
implemented in a different way than for the other planes. The reason for this is that
the wave plane must display waves that scroll horizontally on the monitor. The
scrolling logic moves a pointer, indicating the left of the screen, through the video
RAM and new data are written directly behind it. This has the result of moving the
trace by adding new data onto the right of the screen as old data are displaced on the
left.
The Japanese, Taiwanese, and Chinese character sets are too large to be handled by
the standard EPROM cards. These characters are therefore stored on a dedicated
EPROM card, the DSPC Language card, which is placed in the same cluster as the
Display Controller.
CMS Patient Monitoring System 3-79
Monochrome Display Controller
Functional Block
Diagram
Figure 3-34 DSPC Card Block Diagram
3-80 CMS Patient Monitoring System
Color Display Controller Cards
Summary of DSPC
Card Features
The features of the DSPC card are as follows:
•
Two alphanumeric/graphic planes (1024 x 512 pixels) for display text, figure and
simple graphics.
•
One wave plane with extended resolution (2048 x 512 pixels) that can display up
to six overlapping waves with horizontal scrolling.
•
Three character sizes: large = 32 x 40 pixels, normal = 16 x 20 pixels, and dense =
12 x 16 pixels.
•
Attributes resolution 256 x 256 bytes.
•
Can drive slave displays.
•
60 Hz operation.
Color Display Controller Cards
Introduction
The Color Display Controller (CDSPC) cards are a set of two cards used by the
system to output display data to a color monitor. The CDSPC cards are similar in
operation to the DSPC card, with the exception that the Video RAM is three times
larger. Therefore, two cards are required: CDSPC_CTRL and CDSPC_VIDEO.
The CDSPC_CTRL card, the video controller, is a master card connected to the MPB
Bus and the Local Bus. The CDSPC_VIDEO card is a local card that contains the
Video RAM and output circuits to the Display Module. The two cards are connected
by the Local Bus.
Connections
Both cards must be placed in the same cluster of the Computer Module. The
CDSPC_VIDEO card must be inserted into the rear of the Computer Module so that it
can be connected to the display. It is connected to the display by using a cable
between the 9-pin, D-type connector on the card edge and a similar connector on the
rear of the display. The video output on the rear of the display may be used to connect
a remote display.
If Kanji characters are to be supported, the EPROM and DSPC_KANJI cards must
also be inserted into the same cluster as the two CDSPC cards.
Each pair of CDSPC cards supports either one master display and three remote
displays or four remote displays. If the system is required to produce two different
color displays, a second pair of CDSPC cards must be used in a separate cluster.
For details on the components and operation of the CSDPC_VIDEO card, refer to the
Local Functional Cards section of this chapter, “Local Card Overview” on page 3111.
CMS Patient Monitoring System 3-81
Color Display Controller Cards
CDSPC_CTRL
Components
The video controller card consists of the following functional areas: 68000
Microprocessor, MPB Interface, FIFO, SRAM, PROM, Extension PROM, and buffer.
68000
Microprocessor
MPB
Interface
FIFO
The CDSPC_CTRL card is based on the 68000 Microprocessor.
The MPB Interface is used to pass data back and forth between the card and the MPB.
For more information, refer to the beginning of the Master Functional Cards section,
“Master Card Overview” on page 3-64.
First In First Out buffer.
SRAM
The SRAM contains code for communications with the CDSPC_VIDEO card.
PROM
The PROM contains the firmware for communications with the CDSPC_VIDEO
card.
Theory of Operation
The CDSPC-CTRL card acts as an interface between the system and the video card.
The CDSPC-VIDEO card connects the Computer Module to the display.
The CDSPC cards only control the mechanism of actually displaying information on
the screen. All display data, including local language characters and color
information, are produced by the Application CPUs or CPCs. More than one CPU
may produce data for the display.
Data Transfer
The CDSPC controller card receives display data, waves, lines, numerics, display
attribute data and control messages from the CPU over the MPB. The microprocessor
on the controller card sends the data over the Local Bus to the video card. The Video
System Controller on the video card places the data into the dual-ported Video RAM.
Display attributes, such as half-brightness are also placed in the Video RAM.
The pixel data is clocked out of the Video RAM by the on-chip shift registers. This
data then passes through the SLIP Chip which contains all the video and addressing
logic before passing it to the video buffers. The data then passes through the
protection network for output to the display. An oscillator is used to synchronize the
picture sweep.
Character
Sets
The Japanese, Taiwanese and Chinese character sets are too large to be stored on the
standard EPROM cards. These characters are therefore stored on a dedicated EPROM
card, the DSPC Language card, which is placed in the same cluster as the display
controller cards.
3-82 CMS Patient Monitoring System
Color Display Controller Cards
CDSPC_CTRL
Functional Block
Diagram
Figure 3-35 CDSPC_CTRL Card Block Diagram
Summary of CDSPC
Cards Features
A summary of the features of the CDSPC cards follows.
•
Displays up to 8 overlapping waves in 7 colors, with horizontal scrolling.
•
Two alphanumeric/graphic planes (1024 x 512 pixels x 3 color banks) for
displaying text, figures, and simple graphics.
•
One wave plane with extended resolution (2048 x 512 pixels x 3 color banks) that
can display up to 8 overlapping waves with horizontal scrolling.
•
Three character sizes: large = 32 x 40 pixels, normal = 16 x 20 pixels, dense = 12
x 16 pixels.
•
Attributes resolution 256 x 256 bytes.
•
Can drive a master and up to 3 remote displays.
•
Color luminance equalization.
•
60 Hz operation.
CMS Patient Monitoring System 3-83
Color Display Controller Card (New Version)
Color Display Controller Card (New Version)
Introduction
The Color Display Controller (CDSPC) card is used by the system to output display
data to a color monitor. The CDSPC card is similar in operation to the DSPC card,
with the exception that the Video RAM is three times larger. The CDSPC was
introduced as a direct replacement for two cards, CDSPC_CTRL and
CDSPC_VIDEO and has the same functionality as these cards. The CDSPC is fully
backwards compatible.
Connections
The CDSPC card must be inserted into the rear of the Computer Module so that it can
be connected to the display. It is connected to the display by using a cable between the
9-pin D-type connector on the card edge and a similar connector on the rear of the
display. The video output on the rear of the display may be used to connect a remote
display.
If Asian characters are to be supported, the DSPC_LANG card must also be inserted
into the same cluster as the CDSPC card.
Each CDSPC card supports either one master display and three remote displays, or
four remote displays. If the system is required to produce two or three (slave)
different color displays, a second or third CDSPC card must be used in a separate
cluster.
CDSPC Components
68000
Microprocessor
MPB
Interface
FIFO
The video controller card consists of the following functional areas: 68000
Microprocessor, MPB Interface, FIFO, SRAM, PROM, Extension PROM, and buffer.
The video component of the card consists of: Color Register, Buffer, Horizontal Wave
Scroll Logic, Video System Controller, Attributes, Oscillator, Video Buffers, Color
Mapping Circuit, Protection Network, and the Color Planes.
The CDSPC card is based on the 68000 Microprocessor.
The MPB Interface is used to pass data back and forth between the card and the MPB.
For more information, refer to the beginning of the Master Functional Cards section.
First In First Out buffer.
SRAM
The SRAM contains code for communications with the CDSPC_VIDEO card.
PROM
The PROM contains the firmware for communications with the CDSPC_VIDEO
card.
3-84 CMS Patient Monitoring System
Color Display Controller Card (New Version)
Theory of Operation
Color
Register
Video System
Controller
Video RAM
The color register chooses the color.
The three color banks of the Video RAM are controlled by the Video Controller chip.
The video RAM has four parts as shown in the following table.
Table 3-23 Video RAM Components
Pane/Map
Description
Alphanumerics /
Graphics plane 1
(1024 x 512 pixels x 3 color banks) The two alphanumeric
/ graphics planes are used to display text, figures, and
basic graphics (lines, boxes etc.).
Alphanumerics /
Graphics plane 2
Wave Plane
(2048 x 512 pixels x 3 color banks) The higher resolution
wave plane is used for displaying the parameter waves,
such as ECG.
Attribute Map
(256 x 256 bytes) The attribute map is used to enable parts
of the screen and select between full-brightness, halfbrightness, and blinking.
The CDSPC card controls the mechanism of actually displaying information on the
screen. All display data, including local language characters and color information,
are produced by the Application CPUs or CPCs. More than one CPU may produce
data for the display.
Data Transfer
The CDSPC card receives display data, waves, lines, numerics, display attribute data
and control messages from the CPU over the MPB. The microprocessor on the
controller card sends the data over the Local Bus to the video card. The Video System
Controller places the data into the dual-ported Video RAM. Display attributes, such
as half-brightness are also placed in the Video RAM.
The pixel data is clocked out of the Video RAM by the on-chip shift registers. This
data then passes through the SLIP Chip which contains all the video and addressing
logic before passing it to the video buffers. The data then passes through the
protection network for output to the display. An oscillator is used to synchronize the
picture sweep.
Character
Sets
The Japanese, Taiwanese and Chinese character sets are too large to be stored on the
standard EPROM cards. These characters are therefore stored on a dedicated EPROM
card, the DSPC Language card, which is placed in the same cluster as the display
controller cards.
CMS Patient Monitoring System 3-85
Color Display Controller Card (New Version)
Wave Plane
The wave plane displays up to eight overlapping parameter waves. This plane is
implemented in a different way than for the other planes, because the wave plane
must display waves that scroll horizontally on the screen. The scrolling logic moves a
pointer, indicating the left of the screen, through the Video RAM, and new data is
written directly behind it. This has the result of adding new data onto the right of the
screen as old data is displaced on the left.
Color
Equalization
The seven colors produced by the color display have their intensities equalized, so
that they appear similar in intensity to the human eye. This is done by using a resistor
network in combination with some transistors; red and green are added to lighten the
output of the blue output on the display. The red output has a slightly higher full
intensity voltage to get brighter alarms.
CDSPC Functional
Block Diagram
UP 68000
ROM FW
64k x 16
UP_CTRL
SRAM
32k x 8
SRAM
32k x 8
UP_CLK
UP_ADDR
UP_DATA
SMEC
CTRL
DATA BUF
VID BUF
SLIP II
SMEC
MPB
Mux
Address
MPB
CLK
VRAM
ARRAY
Serial
Data
SYNC
A
D
Shift
CLK
VIDEO
OUT
SLIP to SMEC CTRL
SRAM
32k x 8
LOC BUS
OSZ 32MHz
OSZ VIDEO
SYSCLK
MPB BUS
Figure 3-36 CDSPC Card Block Diagram
Summary of CDSPC
Cards Features
A summary of the features of the CDSPC cards follows.
•
Displays up to 8 overlapping waves in 7 colors, with horizontal scrolling.
•
Two alphanumeric/graphic planes (1024 x 512 pixels x 3 color banks) for display
text, figures, and simple graphics.
•
One wave plane with extended resolution (2048 x 512 pixels x 3 color banks) that
can display up to 8 overlapping waves with horizontal scrolling.
•
Three character sizes: large = 32 x 40 pixels, normal = 16 x 20 pixels, dense = 12
x 16 pixels.
•
Attributes resolution 256 x 256 bytes.
3-86 CMS Patient Monitoring System
Flatscreen Display Controller Card
•
Can drive a master and up to 3 remote (slave) displays.
•
Color luminance equalization.
•
60 Hz operation.
Flatscreen Display Controller Card
Introduction
The Flatscreen Display Controller (DSPC_FLAT) card is used by the system to output
display data to the Flatscreen.
Connections
The DSPC_FLAT card must be inserted into the rear of the Computer Module so that
it can be connected to the flatscreen display. It is connected to the display by using a
cable between the 25-pin SCSI connector on the card edge and a similar connector on
the rear of the display.
If Asian characters are to be supported, the DSPC_LANG card must also be inserted
into the same cluster as the DSPC_FLAT card.
Each DSPC_FLAT card supports one master display - no remote (slave) displays can
be connected. If the system is required to produce two different flatscreen displays, a
second DSPC_FLAT card must be used in a separate cluster.
60 V power for the flatscreen display itself is fed through the DSPC_FLAT via a fuse.
The remote on/off connection from the flatscreen display to the external power supply
is fed directly from J2 to J3.
DSPC_FLAT
Components
The DSPC_FLAT card consists of the following functional areas: 68000
Microprocessor, MPB Interface, SRAM, PROM, buffer, VRAM and Video Control
Logic. The DSPC_FLAT card is based on the 68000 Microprocessor. The MPB
Interface is used to pass data back and forth between the card and the MPB. For more
information, refer to the beginning of the Master Functional Cards section.
Theory of Operation
The DSPC_FLAT card controls the mechanism of actually displaying information on
the screen. All display data, including local language characters and color
information, are produced by the Application CPUs or CPCs. More than one CPU
may produce data for the display.
Data Transfer
The DSPC_FLAT controller card receives display data, waves, lines, numerics,
display attribute data and control messages from the CPU over the MPB. The
Microprocessor places the data into the dual-ported Video RAM. Display attributes,
such as half-brightness are also placed in the Video RAM.
The pixel data is clocked out of the Video RAM by the on-chip shift registers. This
data then passes through the SLIP Chip which contains all the video and addressing
logic before passing it to the video buffers. The data is transmitted differentially to the
Flatscreen.
CMS Patient Monitoring System 3-87
Flatscreen Display Controller Card
The Japanese, Taiwanese and Chinese character sets are too large to be stored on the
standard EPROM cards. These characters are therefore stored on a dedicated EPROM
card, the DSPC Language card, which is placed in the same cluster as the
DSPC_FLAT card.
DSPC_FLAT
Functional Block
Diagram
UP 68000
ROM FW
64k x 16
UP_CTRL
SRAM
32k x 8
SRAM
32k x 8
Display ID
Character
Sets
Hi-Z
Buff.
UP_CLK
J2
DATA BUF
SLIP II
SMEC
MPB
CLK
MPB
Mux
Address
VRAM
ARRAY
Serial
Data
Shift
CLK
DIFF VID. OUT
VID BUF
SYNC,
CLK
SMEC
CTRL
VID. DATA OUT
UP_ADDR
UP_DATA
SLIP to SMEC CTRL
OSZ 32MHz
OSZ VIDEO
SYSCLK
+60V
LOC BUS
SRAM
32k x 8
from Backplane
Remote ON/OFF
from Display to
external PS
J3
Figure 3-37 DSPC_FLAT Card Block Diagram
Summary of
DSPC_FLAT Card
Features
A summary of the features of the DSPC_FLAT card follows.
•
Displays up to 8 overlapping waves in 7 colors, with horizontal scrolling.
•
Two alphanumeric/graphic planes (640 x 480 pixels x 3 color buffers) for
displaying text, figures, and simple graphics.
•
One wave plane with resolution (640 x 480 pixels x 3 color buffers) that can
display up to 8 overlapping waves with horizontal scrolling.
•
Three character sizes:
large = 20 x 36 pixels, standard = 10 x 18 pixels, dense = 7 x 14 pixels.
•
Attributes resolution 320 x 480 cells.
•
Can drive a master flatscreen.
•
Color luminance equalization.
•
60 Hz operation.
3-88 CMS Patient Monitoring System
DSPC_FLAT_ASIA Flatscreen Controller Card
DSPC_FLAT_ASIA Flatscreen Controller Card
Introduction
The DSPC_FLAT_ASIA controller card is a replacement for the DSPC_FLAT
controller card. This improved controller is backwards compatible and can be used to
replace the DSPC_FLAT in M1046A Computer Modules that have a flatscreen as a
main display and use the M1074A Remote Power Supply to power the system.
Additionally, the remote switch path is also connected to the backplane so that it can
be used with the M1046B Computer Module that is powered by its integral power
supply. The original DSPC_FLAT cannot be used in the M1046B for the main
flatscreen display.
This controller provides an Asian/Eastern Europe language option consisting of a 4way DIP-switch and a Multilanguage ROM allowing character sets for Japanese,
Taiwanese, Chinese, Russian, Greek, Polish and Czech to be selected. Therefore, this
controller does not need a DSPC_LANG card.
Connections
All connections are the same as that for the DSPC_FLAT controller. In addition, the
remote switch is also routed to the backplane for M1046B compatibility.
DSPC_FLAT_ASIA
Components
The circuit design for the flatscreen controller remains unchanged from the original
DSPC_FLAT controller. Additional components have been added to route the remote
switch to the blackplane.
These two parts of the circuit communicate over the local bus as if they were two
separate cards on the same cluster.
Theory of Operation
This is the same as the original DSPC_FLAT controller card.
Summary of
Features
All the features of the original DSPC_FLAT are supported. Additional features for the
DSPC_FLAT_ASIA controller are as follows.
•
Compatible with the M1046B Computer Module.
•
Provides an Asian and Eastern Europe multi-language package.
•
Selectable Asian languages: Japanese, Taiwanese and Chinese. The language
package can be disabled.
•
Selectable Eastern Europe languages: Russian, Greek, Polish, Czech. The
language package can be disabled.
CMS Patient Monitoring System 3-89
DSPC_XGA Display Controller Card
DSPC_XGA Display Controller Card
Introduction
The XGA Display Controller (DSPC_FLAT) card is used by the system to output
display data to a XGA compatible display.
Connections
The DSPC_XGA card must be inserted into the rear of the Computer Module so that
it can be connected to the display. It is connected to the display by using a cable
between the 15-pin XGA connector on the card edge and a similar connector on the
rear of the display.
Each DSPC_FLAT card supports one master display - no remote (slave) displays can
be connected. If the system is required to produce two different XGA displays, a
second DSPC_XGA card must be used in a separate cluster.
The remote on/off connection from the Remote Alarm Device to the M1046B integral
power supply is fed directly from J2 to J3.
DSPC_XGA
Components
The DSPC_XGA card consists of the following functional areas: 68000
Microprocessor, MPB Interface, SRAM, PROM, buffer, VRAM and Video Control
Logic. The DSPC_XGA card is based on the 68000 Microprocessor. The MPB
Interface is used to pass data back and forth between the card and the MPB. For more
information, refer to the beginning of the Master Functional Cards section.
Theory of Operation
The DSPC_XGA card controls the mechanism of actually displaying information on
the screen. All display data, including local language characters and color
information, are produced by the Application CPUs or CPCs. More than one CPU
may produce data for the display.
Data Transfer
The DSPC_XGA controller card receives display data, waves, lines, numerics,
display attribute data and control messages from the CPU over the MPB. The
Microprocessor places the data into the dual-ported Video RAM. Display attributes,
such as half-brightness are also placed in the Video RAM.
The pixel data is clocked out of the Video RAM by the on-chip shift registers. This
data then passes through the SLIP Chip which contains all the video and addressing
logic before passing it to the video buffers. The data is converted to analogue XGA
video signals.
3-90 CMS Patient Monitoring System
DSPC_XGA Display Controller Card
DSPC_XGA
Functional Block
Diagram
UP 68000
ROM FW
64k x 16
UP_CTRL
SRAM
32k x 8
SRAM
32k x 8
UP_CLK
UP_ADDR
UP_DATA
SMEC
CTRL
DATA BUF
VID BUF
SLIP II
SMEC
Mux
Address
MPB
CLK
MPB
VRAM
ARRAY
Serial
Data
SYNC
A
D
Shift
CLK
VIDEO
OUT
SLIP to SMEC CTRL
LOC BUS
SRAM
32k x 8
OSZ 32MHz
OSZ VIDEO
SYSCLK
MPB BUS
Figure 3-38 DSPC_XGA Card Block Diagram
Summary of
DSPC_XGA Card
Features
A summary of the features of the DSPC_XGA card follows.
•
Displays up to 8 overlapping waves in 7 colors, with horizontal scrolling.
•
Two alphanumeric/graphic planes (1024 x 5121 pixels x 3 color buffers) for
displaying text, figures, and simple graphics.
•
One wave plane with resolution (1024 x 5121 pixels x 3 color buffers) that can
display up to 8 overlapping waves with horizontal scrolling.
•
Three character sizes:
large = 20 x 36 pixels, standard = 10 x 18 pixels, dense = 7 x 14 pixels.
•
Attributes resolution 320 x 480 cells.
•
Can drive a master XGA compatible display.
•
Color luminance equalization.
•
60 Hz operation.
1. The resolution 1024 x 512 is made XGA compatible (1024 x 768) via repeating every
second row.
CMS Patient Monitoring System 3-91
Utility CPU
Utility CPU
Introduction
The Utility CPU is responsible for interfacing to several devices and providing the
synchronization and clock signals for the rest of the CMS.
Some of the interfaces connect to the MPB, others connect to the same cluster as the
Utility CPU. Therefore, these interfaces are kept separate from the CPUs. The
individual applications do not have to handle their own interfaces such as the SDN.
Connections or
Interfaces
The Utility CPU supports a number of interfaces for the CMS. These are either on the
card itself or on local cards in its cluster.
Table 3-24 Utility Card Interfaces
Location
Type
Description
On the CPU board
Philips-HIL
Used for the user inputs,
integral and remote
keypads, and touchscreen.
Nurse Paging Relay
Used for connecting to a
light or other alarm.
Rack Interface
Connects to the Module
Racks (maximum of 2
interfaces).
SDN Interface
Connects to an ICU/CCU
Serial Distribution
Network.
On local cards
Components
The Utility Card contains the following functional areas: 68000 Microprocessor,
EPROM, EEPROM, CERBERUS, Output Register, Address Decoder and Dtack
Logic, SRAM, Real Time Clock, Relay, HIL Rear Panel Connector, Phone Jack Rear
Panel Connector (Nurse Paging), MPB Interface, FIFO, Pull Up Arrays, Reset Logic,
32 millisecond synchronizer, Main Clock, and the Local Bus buffers.
68000
Microprocessor
EPROM
EEPROM
SRAM
The 68000 Microprocessor is used on the Utility CPU card.
The EPROM (capacity 64 Kbytes) contains firmware that is executed when the
system is switched on.
The EEPROM (capacity of 8 Kbytes) stores the current configuration of the system.
Non-Buffered static RAM with a capacity of 128 Kbytes.
3-92 CMS Patient Monitoring System
Utility CPU
HIL Rear
Panel Connector
Phone Jack
Rear Panel Connector
(Nurse Paging)
Philips-HIL is the Philips Human Interface Link. This is a proprietary interface for
any human interface. Examples of supported devices are: Human Interface Board for
the Control Panel of the Display Module, Remote Keypad, and the Touchscreen.
The phone jack used for nurse paging is intended to give some type of alarm that is
either visual, audio, or both.
This is a single-closure relay with its contacts connected to a stereo (trs) phone jack
on the card edge of the Utility CPU Card.
MPB Interface
FIFO
Main Clock
Local Bus buffers.
This is the interface between the card and the MPB. For more information, refer to the
beginning of the Master Function Cards section.
First In First Out buffer.
The main clock provides the clock signals to the rest of the CMS. The clocks
provided are: 20 MHz, 16 MHz, and 10 MHz.
The local bus buffers are between the Local Bus and the rest of the utility card. They
act as a buffer for information passing back and forth between the bus and the card.
Rack Interface
This is a high-speed, serial, Front-End Link (FE-LINK) for the connection of the
Module Racks. A locally generated 78 kHz clock is also passed over this interface:
(1) for power synchronization for the Plug-In Parameter Modules and (2) as an
excitation frequency for the invasive pressure transducers. Also refer to the Rack
Interface Card FE-LINK in the Local Function Cards section of this chapter, “Local
Card Overview” on page 3-111.
SDN Interface
The digital Serial Distribution Network (SDN) connects to bedside units within an
ICU/CCU environment. This allows the CMS to access all the data and status signals
on the network. Refer to the SDN Interface in the Local Function Cards section for
more information.
Theory of Operation
Interrupts
Address Decoding
Bus Error Logic
The following describes the operations of the Utility CPU card.
There is a support chip to encode interrupts so the processor can react to interrupts.
For example, power fail (PFAIL) and external interrupt (EXINT) from the local bus.
The address decoding logic is used to generate enable signals for the on-board
devices, such as the MPB, SRAM, and EPROM.
The bus error logic is a timer that watches the microprocessor's address strobe. When
the processor outputs an address on its bus, it asserts the address strobe to indicate
that a valid memory address is available. However, if the signal is asserted for too
long, then the logic assumes that the access was not terminated correctly; that is, the
address strobe was not negated or removed. The logic then asserts a Bus-Error to tell
the processor that it could not access the memory correctly.
CMS Patient Monitoring System 3-93
Utility CPU
PFAIL and
SYSRES
The PFAIL signal is used to inform all other function cards that a SYSRES should be
expected from the Utility CPU. This is to allow the system to reset all the CPU cards
synchronously. One bit of the CPU output latch is used to place PFAIL on the utility
bus.
The PFAIL signal is asserted by the CPU if the CPU detects that a serious error has
occurred in the system or the watchdog timer detects a failure in the CPU.
The PFAIL is also asserted by the DC-to-DC converter when the power is about to
fail.
Real-Time Clock
There is a real-time clock chip that outputs a one-second clock to the MPB. This chip
receives its power from a special capacitor when power is lost. The worst case would
power the chip for 100 hours, but more typically the supply would last 255 hours, or
over 10 days.
Timing
Generation
The Utility CPU generates the clock signals from a 40 MHz oscillator. The oscillator
output is fed to a divide-by-2 network to produce the main 20 MHz system clock. The
Utility CPU provides, for internal use, the 16 MHz and 10 MHz CPU clocks and an
inverted 10 MHz local clock.
An 8 MHz clock signal is produced for the Philips-HIL Chip.
A 78 kHz clock signal is sent to the Rack Interface. This clock is an excitation signal
for the invasive pressure transducers and is used to synchronize the plug-in module
power supplies.
Nurse Paging
Relay
The Nurse Paging Relay is a single-closure relay, used to control an external device
such as a light or buzzer. It is operated under software control. The contacts of the
relay are connected to a stereo phone jack on the edge of the Utility CPU card.
When the relay is operated, a loop connection is closed between the tip and the ring of
the phone jack. The sleeve is at ground. This allows control over an external device.
For example, a lamp or buzzer and a power supply, connected through a power relay,
can be used to give an alarm that is either visual, audible, or both.
WARNING
Philips-HIL Interface
Connecting power voltages to the phone jack results in a hazard to personnel
when removed.
The Philips-HIL is Philips’ Human Interface Link. Devices supported by this link are
the keypads and touchscreen used by the Display Module.
The Philips-HIL is a serial digital link that uses a two-wire bus. The devices it
connects are daisy-chained to the HIL Master on the Utility CPU card. Each device
tags its data with its identity.
Before data are placed on the bus by a device, the device looks downstream to see if
there are any other data on the bus. If data are present on the bus, the device adds its
3-94 CMS Patient Monitoring System
Utility CPU
own data to the end of the data stream. The data stream is interpreted by the HIL
Master.
Memory Addressing
Data Transfers
SDN Synchronization
Each memory location, on either the CPU card or local memory cards, is addressed
absolutely using the processor's 23-bit address bus.
There are buffers on the processor bus to connect to the local bus of the cluster. This
allows data to be passed between the processor and the local memory cards.
This is performed by the Utility CPU Card. Refer to the SDN Interface functional
description in the Local Functional Cards section of this chapter,“Local Card
Overview” on page 3-111.
CMS Patient Monitoring System 3-95
Utility CPU
Functional Block
Diagram
Figure 3-39 Utility Card Block Diagram
3-96 CMS Patient Monitoring System
Utility CPU
Utility Card LEDs
The utility card has six LEDs. Three of these are for error status and the other three
are for the voltage. These are described in Table 3.26.
Table 3-25 Utility Card LEDs
Summary of Utility
CPU Features
LED
Description
1. MPB Error LED (red)
When lit, indicates there is a problem with the MPB
Interface Chip.
2. Error/Status LEDs
(green)
Connected to the processor through the output latch, these
LEDs are under software control. They may be lit to
indicate a hardware failure on the card during the boot
phase when no MPB messages can be sent. When the
system is running, they may reflect the status of the card.
3. Voltage Indicator
LEDs (green)
Used to monitor the presence of the DC-to-DC converter
voltages +12V DC, -12V DC, and +5V DC on the Utility
Bus.
The functions of the Utility CPU card are as follows.
•
Real-Time Clock, buffered power supply (>100 hours).
•
Nurse Paging Relay.
•
System Clock.
•
32 millisecond Frame Clock
•
2 millisecond Sample Clock.
•
Power-On Reset.
•
Voltage indicator LEDs for +12V, -12V and +5V.
•
EEPROM (8 Kbytes) for system configuration.
•
Philips-HIL Master Controller.
•
SDN Synchronization.
•
Rack Interface with excitation signals for plug-in modules.
•
Error LEDs (3).
CMS Patient Monitoring System 3-97
RS232/RS422 Dual Interface Card
RS232/RS422 Dual Interface Card
Introduction
The RS232/RS422 Dual Interface card is used to interface the CMS with the outside
world. Computer interface communication is only possible with RS232. The interface
uses the RS232 standard.
The RS422 standard is currently not available. The RS422 hardware has been
included on the interface card for possible future applications.
This card connects to the MPB and is therefore, a master card. This card does not
have any associated local cards. Therefore, it does not have any connection to the
Local Bus. This card can be placed in any vacant slot of the CMS, even a vacant slot
in another master cards’s cluster.
Software Release
Changes
Software
Release C
Connections
The following is information on software releases that affect the functionality of the
card.
With Software Release C, the card provides a computer interface that allows
connection through two independent ports to a printer (for example, the HP ThinkJet
and HP LaserJet series equipped with an RS232 interface) and computer system. The
port is driven from firmware associated with an Application CPU or CPC card. Refer
to the Computer Interface Programming Guide for further details on this capability.
The interface card is designed to be connected to equipment that has a compatible
RS232 interface using one of the two 25-pin, D-type connectors.
The ability to output to computer systems using the RS232 standard can be switched
on or off in the Configuration Mode for both ports. The differences between the ports
is outlined in Table 3-26.
Table 3-26 Port Description
Port
Description
Port 2 (upper connector)
Can be used to output RS232 information to printers or
computer systems.
If you only require an output to a printer (port 2), the
configuration for port 2 should be CompOff.
Older models allow connection to a printer through the
upper port only.
Port 1 ( lower
connector)
Is exclusively used as the output to computer systems.
Does not provide an output for printers.
Provides faster (configurable) baud rates than port 2.
3-98 CMS Patient Monitoring System
RS232/RS422 Dual Interface Card
14
15
16
17
18
19
20
Data Terminal Ready (DTR)
21
n/c
22
Ring Indicator (RI)
23
10
n/c
11
n/c
n/c
n/c
24
9
T422B
12
T422A
n/c
R422B
n/c
R422A
2
6
GND
Data Carrier Detect (DCD)
n/c
8
Data Set Ready (DSR)
7
Clear To Send (CTS)
n/c
25
Request To Send (RTS)
n/c
3
Receiver (RXD)
n/c
4
Transmitter (TXD)
5
Shield
1
The connector is wired as a standard RS232 connector with the additional data lines
used for RS422 data transmission.
13
Pinouts
Figure 3-40 Connector Pin Signals
Components
The RS232/RS422 Dual Interface card consists of the following functional areas:
MPB chip, FIFO, Micro Controller, UART, RS232/RS422 Drivers, RS232/RS422
Receivers.
MPB Interface
FIFO
Microcontroller
UART
Theory of Operation
Data
Transfers
The MPB Interface is the interface between the card and the MPB. For more
information, refer to the beginning of the Master Function Cards section.
First In First Out buffer.
The interface uses an 8051 Microprocessor, which provides one of the serial ports.
This provides the second serial port on the card.
The following defines the operations of the dual interface card.
Data are passed between the MPB and the interface. On data being sent out of the
RS232 port 1 or 2, the data are converted from parallel to serial format. On data being
received from the RS232 port 1 or 2, the data are converted from serial to parallel
format.
CMS Patient Monitoring System 3-99
RS232/RS422 Dual Interface Card
Transmission
The data are loaded into the MPB Interface's RAM. The processor reads these data
and writes it into the serial port register. Port 1 uses the microprocessor's internal
serial port register, and port 2 uses the UART. Data are then shifted-out of the
registers at the chosen baud rate. The RS232/422 drivers transform the TTL voltages
into those suitable for the RS232 and RS422 transmission.
RS232 Data
Reception
The RS232 voltages received are converted to TTL levels. The data are written into
the serial port input registers for each port and then buffered in the MPB Interface
RAM before being output to the MPB. Note: the RS422 interface is not used.
RS232
Baud Rate
The interface can be switched, under control of application software in the
DEV_CONFIG command of the session, to accommodate a range of devices that use
fixed data transmission speeds. The baud rates available for the interface are as
follows: 150, 300, 600, 1200, 2400, 4800, 9600, 19200, and 38400 (port 1 only).
3-100 CMS Patient Monitoring System
RS232/RS422 Dual Interface Card
Functional Block
Diagram
Figure 3-41 RS232/RS422 Dual Interface Card Block Diagram
CMS Patient Monitoring System 3-101
HDLC Interface Card
Summary of RS232/
RS422 Features
The Features of the RS232/RS422 are as follows.
•
Provides 2 serial ports using 8051 microprocessor with an additional UART.
•
Communicates directly between external devices and the MPB.
•
Translates MPB parallel data broadcast on a 16-bit bus to serial data over RS232
and RS422 standard interfaces.
•
Translates received serial data from the RS232 to MPB parallel data.
•
Switchable baud rate, under control of application software.
HDLC Interface Card
Introduction
The HDLC Interface card provides the Computer Module with an interface to any
real-time wave recorders which use the Standard Recorder Interface Protocol
(STRIP). Two recorders linked in a daisy chain can be connected to the Computer
Module using this card.
The HDLC is a master card and therefore connects to the MPB. The card does not
require any local cards in its cluster. Therefore, it does not have a connection to the
local bus.
This card may be located in any unused slot in the computer module, even a slot that
is part of another master card’s cluster.
Components
The HDLC card consists of the following functional areas: MPB Interface, FIFO,
HSCX, Driver, 68000 CPU, EPROM, SRAM, Test Loop Register, and Address
Decoder and Dtack Logic.
MPB Interface
FIFO
The MPB Interface provides the interface between the MPB and the card. For more
information, refer to the beginning of the Master Functional Cards section of this
chapter, “Master Card Overview” on page 3-64.
First In First Out buffer.
HSCX
This is the HDLC Controller. It is controlled by the CPU in interrupt mode.
68000
CPU
The HDLC card contains a 68000 Microprocessor. This processor controls the
operation of the card.
Theory of Operation
The HSCX can control two identical independent synchronous serial channels (A and
B). These channels are built-up using transmit and receive FIFOs and control
registers which can be accessed asynchronously by the processor without wait states.
3-102 CMS Patient Monitoring System
HDLC Interface Card
Only channel B is used for the HDLC link, and it is connected to the operational port.
The inverted RTS output of the HSCX controls the direction of the HDLC driver.
Data Transfer
The HDLC Interface communicates with the connected devices in a Master-Slave
configuration, with the HDLC Interface as the Master.
Commands and data from the MPB are received by the CPU on the HDLC Interface.
The CPU interprets the commands and rearranges the data into the format required by
the HSCX and STRIP protocol. It then loads the data into the HSCX to be transmitted
to the external HDLC devices.
Data received from the devices are reformatted by the CPU and transmitted via the
MPB.
The CPU can also be commanded to poll the connected devices automatically every
32 milliseconds for synchronization.
ESD Protection. The HDLC connector shields all ESDs when a cable is not
connected to the port on the HDLC link. However, ESDs into the unconnected
end of an HDLC cable, which is connected to the HDLC Interface on the
Computer Module, will result in driver damage. Always disconnect the HDLC
cable at the Computer Module end when other equipment is not attached to the
cable.
CAUTION
Ground Safety Connection. There is no signal ground connection on the HDLC
cable to STRIP devices; the cable shield is only connected at one end of the cable.
For this reason, the signal ground and safety ground in each HDLC device must
be tied together. Additionally, there must be a connection between the safety
ground of all devices and the power cord safety ground or additional grounding
cables.
WARNING
Testing/Diagnostics
Loop Tests
Testing/Diagnostics available on the HDLC card are detailed in the following.
An internal loop test checks HSCX operation. The HDLC drivers are tested by an
HSCX external loop, which can be opened or closed by resetting/setting the test loop
register.
CMS Patient Monitoring System 3-103
HDLC Interface Card
Functional Block
Diagram
Figure 3-42 HDLC Interface Card Block Diagram
Summary of HDLC
Features
The features of the HDLC card are detailed in the following.
•
Provides an interface to real-time wave recorders.
3-104 CMS Patient Monitoring System
Analog Interface Card
•
Performs internal tests to check the operation of the controller and drivers.
•
Controls a maximum of two devices in daisy chain.
•
Receives commands and data via the MPB.
•
Formats the data to HSCX and STRIP protocol, then transmits to connected
devices.
•
Receives data from devices, which it then transmits over the MPB.
Analog Interface Card
Introduction
The Analog Interface card provides the Computer Module with eight channels of
analog output, which can be connected to recorders and other data collection
instruments.
This card is a master card, but it does not require any connections to the Local Bus, as
there are no dependent local cards required for its operation. Therefore, it may be
located in any vacant slot in the Computer Module, even a slot that is part of another
master card’s cluster.
Both wave and numeric outputs are available; channels can be controlled individually
with respect to wave or numeric display and gain and offset control. In addition, eight
alarm/INOP status lines are provided as digital outputs, which can be used to trigger
alarm recorders or other data collection instruments.
Components
The Analog Interface card consists of the following functional areas: MPB Chip,
FIFO, Micro Controller, Multiplying DAC, Error Measurement Unit, Gain Error
Compensation DAC, Sample and Hold Register, Sample and Hold Circuits, Low Pass
Filters, and Digital Port.
MPB Interface
FIFO
Microcontroller
Multiplying
DAC
The MPB interface provides the interface between the MPB and the card. For more
information, refer to the beginning of the Master Function Cards section of this
chapter.
First In First Out buffer.
The microprocessor used on the Analog Interface card is the 8051.
This is one of the two digital-to-analog converters (DACs) that provide eight analog
output channels.
CMS Patient Monitoring System 3-105
Analog Interface Card
Gain Error
Compensation DAC
Digital Port
Theory of Operation
This is one of the two DACs that provide eight analog output channels.
The Digital Port is an 8-bit port.
The operations of the Analog Interface card are defined in the following.
Absolute
Wave Handling
When switching the scale or size of an absolute wave, the analog output may be
affected for up to two seconds. This is due to the internal handling of scaled waves by
the CMS.
Noise
The Analog Interface has grounded inputs. Ground loops in the installation (through
grounded inputs at the receiving device) may introduce additional noise to the analog
signals. Lowest noise is obtained when the external analog device is connected with
floating inputs or to devices with differential inputs.
Remote
Installations
When the Display Module is installed remotely from the Computer Module, the
analog interface ground (digital and analog ground) shows a DC voltage with respect
to safety ground (approximately 3 mV/m of cable length between the Computer
Module and the Display Module). When connecting the Analog Interface to devices
with grounded inputs, this voltage leads to an additional offset error at the inputs of
the connected devices. The offset can be compensated for, either at the connected
device or by adjusting the offset for the analog channels. The offset can be avoided by
connecting the Analog Interface to devices with floating or differential inputs.
Output Delay
The waves available from the Analog Interface are filtered and processed by the
parameter-specific algorithms in the CMS. The processing delay from parameter
input to analog output is approximately 250 milliseconds. This delay is constant for
each channel and between channels.
WARNING
Do not synchronize balloon pumps or defibrillators using the Analog Interface
on the CMS. An output delay of approximately 250 milliseconds is present on the
signal’s output from the Analog Interface.
Digital Output
The digital output port comprises an eight-bit register with ESD and short-circuit
protection. The low output impedance of the port guarantees proper TTL output
levels for up to 1.6 mA output current.
Analog System
The analog system consists mainly of a 12-bit multiplying DAC, a precision +5V
reference, an error compensation loop, and eight analog channels.
3-106 CMS Patient Monitoring System
Analog Interface Card
Digital-to-Analog
Conversion
The +5V reference signal is input to the 12-bit multiplying DAC to regulate the DAC
output. A second (8-bit) DAC unit provides gain error correction of the conversion
process.
Error
Compensation
Loop
Continuous error compensation is used to improve analog accuracy by compensating
for component tolerances and drift. Gain and offset error are measured by the error
measurement unit, while all sample and hold circuits are switched to Hold. Firmware
adjusts the values for offset correction and the Gain Error Correction DAC
accordingly.
Analog Channels
Each analog channel is built up by sample and hold circuits and a low-pass filter. The
ground for the analog circuit is derived from the Computer Module’s digital ground,
which, in turn, is connected to the safety ground in the Display Module.
Analog Interface
Output Connector
The signals available on the Analog Interface output connector are shown below:
analog ground
37
analog ground
36
analog ground
35
analog ground
34
analog ground
33
analog ground
32
analog ground
31
analog ground
30
reserved
29
reserved
28
digital ground
27
digital ground
26
digital ground
25
digital ground
24
digital ground
23
digital ground
digital ground
digital ground
22
19
shield (chassis ground)
18
analog channel 8
17
analog channel 7
16
analog channel 6
15
analog channel 5
14
analog channel 4
13
analog channel 3
12
analog channel 2
11
analog channel 1
10
reserved
9
digital port 7: low output = alarm recording active (for 20 sec.)
8
digital port 6: low output = no alarm recording
7
digital port 5: low output = no INOP
6
digital port 4: low output = no active alarm
5
digital port 3: low output = main alarms on
4
digital port 2: low output = no ECG INOP
3
digital port 1: low output = no active ECG alarm
2
digital port 0: low output = ECG alarms on
1
shield (chassis ground)
high output = no alarm recording
high output = alarm recording active (for 20 sec.)
high output = INOP
high output = active alarm
high output = all alarms suspended
high output = ECG INOP
high output = active ECG alarm
21
20
high output = ECG alarms off
analcon.mif
Figure 3-43 Analog Interface Output Connector
CMS Patient Monitoring System 3-107
Analog Interface Card
Functional Block
Diagram
Figure 3-44 Analog Interface Card Block Diagram
3-108 CMS Patient Monitoring System
Analog Interface Card
Summary of Analog
Card Features
The features of the Analog Interface card are as follows.
•
Provides an interface to devices with analog inputs needing real-time waves or
slowly changing trend data.
•
Provides eight digital alarm/INOP status lines to trigger alarm recorders or other
data collection instruments.
•
Provides eight analog signals, output on a 37-pin connector.
•
Incorporates an error compensation loop to compensate for component tolerances
and component drift.
CMS Patient Monitoring System 3-109
Analog Interface Card
CMS Local Function Cards
Introduction
This section provides detailed information on the local function cards contained in the
Computer Module of the CMS. The information includes connections, theory of
operation, functional block diagrams, and testing information.
Information on master function cards is contained in another section.
Refer to the Computer Module description in the CMS Modules section for details on
card configurations.
Objectives
Concepts
After successfully completing this module, you should be able to:
•
Identify the local function cards used by the CMS.
•
Identify the master cards they support.
•
Describe the function and operations of each card.
The following concepts are important to the operation of local function cards.
Local Card Identifier -- A mechanism that identifies the type of card in a cluster and
its position. It may also be used to test the compatibility of the local card with the
master card in the cluster. The identifier is hardwired onto the card, and contains the
board type, hardware revision, and version.
EPROM -- Erasable Programmable Read Only Memory. This type of memory is
used on local cards to store executable code and data for master cards. The EPROM
card stores operating and application software for Application CPU cards. The
Display Language EPROM card stores language-dependent display characteristics.
Front-End Link -- A high-speed serial communications link used by the Rack
Interface card to transfer data between the Computer Module and the Module Racks.
The CMS receives a patient’s measurement data from the plug-in modules over this
link.
Polling -- A mechanism by which a communications device identifies the presence,
location, and identities of connected devices, and whether they have data to transfer.
The Rack Interface card polls the Plug-In Parameter Modules over the Front-End
Link. The modules place data onto the link in response to being polled.
SRAM -- Static Random-Access Memory. This type of memory is used on local cards
to store data for a master card before and after processing. The type of data stored
depends on the application software used.
3-110 CMS Patient Monitoring System
Local Card Overview
SDN Synchronization -- The timing method used to synchronize the SDN Interface
with the Utility CPU. A 32 millisecond frame interrupt on the SDN interface is
synchronized with the SDN synchronization signal on the Utility CPU. The utility
card’s signal is used to indicate the start of a poll cycle for data transfer.
Topics
This section contains the following topics.
Table 3-27 Topics in this Section
Topic
Page
“Local Card Overview”
3-111
“EPROM”
3-113
“SRAM”
3-115
“Color Display Video Card”
3-118
“Serial Distribution Network Interface”
3-122
“Rack Interface”
3-126
“Aux Connector Card”
3-129
“Remote Switch Card”
3-129
Local Card Overview
Introduction
The CMS contains two types of function card: master cards and local cards. Master
cards have a microprocessor and connect to the Message Passing Bus (MPB); most
also have a connection to the Local Bus. Local cards perform supporting functions for
the master cards and connect to only the Local Bus. Master cards communicate with
the system over the MPB, and with their corresponding local cards over the Local
Bus.
Refer to CMS Bus Structure in the System Overview section for a description of the
bus architecture.
Local Card
Functions
The local cards do not interface with the MPB bus; rather, they connect to the Local
Bus. A local card is never used alone in a cluster; there is always a master card in a
cluster.
CMS Patient Monitoring System 3-111
Local Card Overview
Table 3-28 Local Cards
Local Card
Identifier
Card Name
Function
EPROM
EPROM
Pre-Release C Software:
Contains software used by a master CPU card. For
example, in the case of an Application CPU, the EPROM
card would contain the application software.
Post-Release C Software:
The application software is integrated into the CPU card.
Display Language
EPROM
DSPC-LANG
An EPROM card that is used to store the Asian characters
used by the Japanese, Chinese and Taiwanese systems.
These characters require more memory capacity than is
available on the display controller’s ROM.
Static RAM
SRAM
Used to hold data before and after processing.
Color Video Card
CDSPC-VIDEO
Contains the pixel Video RAM for the color display.
Used in CMS, delivered prior to Release G.
Serial Distribution
Network Interface
SDN-IF
Used to acquire serial data, messages, and alarms from the
SDN. Messages and data may also be broadcast back onto
the SDN for use by bedside monitors, arrhythmia
computers, or the System Communications Controller
(SCC) at the hub of the SDN star network.
Rack Interface
RACK-IF
Provides access to the Module Racks.
Auxiliary Connector
AUX_CONNECTOR
M1046B Only: Provides access to the Rack Interface
behind the Computer Modules integral power supply.
Remote Switch
REMOTE_SWITCH
M1046B Only: Provides connection and the remote
switching of the DC power to the computer module, the
module racks and the flatscreen display.
With the exception of the SDN card, local cards can generally be used any number of
times in a CMS or in a particular cluster. Each local card has a unique identifier used
to specify the type of card and its position in the cluster. This identifier contains the
board type, hardware revision, and the version. The identifier may also be used to test
the compatibility of the local card with the master card.
When a master card requests the identifier, it is placed on the Local Bus by selecting
that card (done by the comparator matching the high address bits along with the slot
number) and at the same time sending an Access Identifier (ACC) to the card.
On the local card, the identifier information is hardwired onto the card by using a pair
of octal bus drivers. The output of the drivers is connected to five lines on the Local
Bus.
3-112 CMS Patient Monitoring System
EPROM
Figure 3-45 Local Card Identifier
EPROM
Introduction
The EPROM card is a local card that connects to the Local Bus. It is used by a master
card such as the Application CPU to store executable code of the application software
and the operating system. It may also be used by a display controller (DSPC or
CDSPC) for language-dependent display characters.
Components
The EPROM card consists of the following functional areas: Data and Address
Buffers, Identifier, EPROM, Address Decoder, and Timing Control.
Data and
Address Buffers
The EPROM has its internal data and address buses buffered at the connection to the
local bus.
Identifier
The identifier contains information that allows the CPU in the cluster to identify that
this is an EPROM card.
EPROM
The EPROM is a memory array of up to 1.28 Mbytes in steps of 256 Kbytes. The
EPROM card holds the data in two chips. One chip holds the higher byte of the 16-bit
word, and the other chip holds the lower byte of the 16-bit word.
CMS Patient Monitoring System 3-113
EPROM
Address
Decoder
Theory of Operation
The address is decoded and sent to the EPROM to allow the data at the specified
address to be accessed.
At start-up, the CPU in the cluster looks at all the slots in its local cluster and
identifies the local cards and their location. If an EPROM card is detected, the CPU
jumps to the code area of this card and begins executing the code.
Any problem with the EPROM card is handled by the master card. This board does
not have any on-board tests or error LEDs.
Programming
There are no removable devices on the card. When the software is updated or
changed, the card is programmed as a whole.
Functional Block
Diagram
Figure 3-46 EPROM Card Block Diagram
3-114 CMS Patient Monitoring System
SRAM
Summary of
EPROM Features
The features of the EPROM Card are as follows.
•
Large memory array (256 Kbytes steps up to 1.28 MB).
•
Contains the complete application software / operating system.
•
Card programming allows easy exchange or upgrade of software.
•
Label for software part number.
•
0 or 1 wait state options.
•
Automatic execution of the software when the system is started.
SRAM
Introduction
The SRAM card is a local card connected to the local bus. It is used by a master card,
such as the Application CPU, to store data both before and after processing. The
SRAM contains a buffered static RAM array with a data retention time of up to three
days.
The type of data stored on the SRAM card is dependent on the software. For example,
data management software may store trends and numeric data as well as other
processed results.
Components
The SRAM card consists of the following functional areas: Data and Address Buffers,
Address Decoder, Address Input Circuit, Timing Control, Identifier, SRAM, and
Back-up Power Supply.
Data and
Address Buffers
Address Decoder
Identifier
Back-Up
Power Supply
Theory of Operation
Data Transfer
The data and address buffers are used to buffer the data between the local bus and the
SRAM card.
The address decoder is used to specify the address of the data in the SRAM that is
either to be written or read.
The identifier is used by the CPU in the cluster during start-up to identify this card.
The back-up power supply is a two-cell Nickel-Cadium battery that provides power to
the SRAM in the event of a power failure.
The following describes the operations of the SRAM card.
Data are is transferred between the master card and the RAM array using the Local
Bus. The data are is placed on a 16-bit data bus, and the address is placed on a 23-bit
address bus, along with some control lines.
CMS Patient Monitoring System 3-115
SRAM
Switch to
Back-Up Power
When a power loss is sensed, the System Reset signal (SYSRES) SYRES) locks the
RAM from further access. This prevents any access to the SRAM and keeps the
contents from being corrupted.
The switch from the DC-to-DC converter to the battery is made when both the
supplies deliver the same voltage.
Data
Retention Time
Back-Up
Power Supply
The ratio of the data retention battery charging time to the battery charging to the data
retention time is a minimum of 2.5. For example, if the battery is charged for three
hours, the data would be retained 7.5 hours.
The back-up power supply is a two-cell Nickel-Cadmium battery with some switch
logic to switch from the DC-to-DC converter power to the back-up supply.
There are two test points for measuring the battery voltages. They are TP1= Battery
Voltage and TP2= Supply Voltage of the RAM array.
Over-Discharge
Protection
The back-up supply has a circuit to protect the battery from being over-discharged.
This prolongs the useful life of the battery.
3-116 CMS Patient Monitoring System
SRAM
Functional Block
Diagram
Figure 3-47 SRAM Card Block Diagram
Summary of SRAM
Features
The features of the SRAM card are as follows:
•
320K word capacity.
•
Loadable in steps of 32Kwords.
•
Buffered RAM, using 2-cell Nickel-Cadmium battery.
•
Back-up Retention Time is minimally 2.5 times the charging time. A fullycharged battery retains the data for at least three days.
•
Battery over-discharge protection for improved long-term reliability.
•
No-wait-state operation allows use of a 10 MHz or 15 MHz Application CPU.
CMS Patient Monitoring System 3-117
Color Display Video Card
Color Display Video Card
Introduction
The Color Display Controller (CDSPC) cards are a set of two cards used by the
system to output display data to a color monitor. The CDSPC_VIDEO card is a local
card that supports the CDSPC_CTRL card. The video card contains the Video RAM
and output circuits to the Display Module. The video card is connected to its master
card by the Local Bus.
Connections
Both cards must be placed in the same cluster in the Computer Module. The
CDSPC_VIDEO card must be inserted into the rear of the Computer Module so that it
can be connected to the display. It is connected with a cable between the 9-pin D-type
connector on the card edge and a similar connector on the rear of the display. The
video output on the rear of the display may be used to connect a remote display.
If Kanji characters are to be supported, the DSPC_KANJI card must also be inserted
into the same cluster as the two CDSPC cards.
Each pair of CDSPC cards supports either one master display and three remote
displays or four remote displays. If the system is required to produce two different
color displays, a second pair of CDSPC cards must be used in a separate cluster.
For details on the components and operations of the CSDPC_CTRL card, refer to the
Master Functional Cards section of this chapter, “Master Card Overview” on page 364.
CDSPC_VIDEO
Components
Color
Register
Video System
Controller
The CDSPC-Video card consists of the following functional areas: Color Register,
Buffer, Horizontal Wave Scroll Logic, Video System Controller, Attributes,
Oscillator, Video Buffers, Color Mapping Circuit, Protection Network, and the Color
Planes.
The color register chooses the color.
The three color banks of the Video RAM are controlled by the Video Controller chip.
3-118 CMS Patient Monitoring System
Color Display Video Card
Video RAM
The video RAM has four parts as shown in the following table.
Table 3-29 Video RAM Components
Pane/Map
Description
Alphanumerics /
Graphics plane 1
(1024 x 512 pixels x 3 color banks) The two alphanumeric
/ graphics planes are used to display text, figures, and
basic graphics (lines, boxes etc.).
Alphanumerics /
Graphics plane 2
Theory of Operation
Wave Plane
(2048 x 512 pixels x 3 color banks) The higher resolution
wave plane is used for displaying the parameter waves,
such as ECG.
Attribute Map
(256 x 256 bytes) The attribute map is used to enable parts
of the screen and select between full-brightness, halfbrightness, and blinking.
The CDSPC controller card acts as an interface between the system and the video
card. The video card connects the Computer Module to the display.
The CDSPC cards only control the mechanism of actually displaying information on
the screen. All display data, including local language characters and color
information, are produced by the Application CPUs or CPCs. More than one CPU
may produce data for the display.
Wave Plane
The wave plane displays up to eight overlapping parameter waves. This plane is
implemented in a different way than for the other planes, because the wave plane
must display waves that scroll horizontally on the screen. The scrolling logic moves a
pointer, indicating the left of the screen, through the Video RAM, and new data are
written directly behind it. This has the result of adding new data onto the right of the
screen as old data are displaced on the left.
Data Transfer
The CDSPC controller card receives display data, waves, lines, numerics, display
attribute data, and control messages from the CPU over the MPB. The microprocessor
on the controller card sends the data over the Local Bus to the video card. The Video
System Controller on the video card places the data into the dual-ported Video RAM.
Display attributes, such as half-brightness, are also placed in the Video RAM.
The pixel data are clocked out of the Video RAM by the on-chip shift registers. These
data then pass through the SLIP Chip, which contains all the video and addressing
logic, before passing it to the video buffers. The data then pass through the protection
network for output to the display. An oscillator is used to synchronize the picture
sweep.
Color
Equalization
The seven colors produced by the color display have their intensities equalized, so
that they appear similar in intensity to the human eye. This is done by using a resistor
network in combination with some transistors; red and green are added to lighten the
CMS Patient Monitoring System 3-119
Color Display Video Card
output of the blue output on the display. The red output has a slightly higher full
intensity voltage to get brighter alarms.
Character
Sets
The Japanese, Taiwanese, and Chinese character sets are too large to be stored on the
standard EPROM cards. These characters are therefore stored on a dedicated EPROM
card, the DSPC Language card, which is placed in the same cluster as the display
controller cards.
3-120 CMS Patient Monitoring System
Color Display Video Card
CDSPC_VIDEO
Functional Block
Diagram
Figure 3-48 CDSPC-Video Card Block Diagram
CMS Patient Monitoring System 3-121
Serial Distribution Network Interface
Summary of CDSPC
Cards Features
A summary of the features of the CDSPC cards follows.
•
Displays up to 8 overlapping waves in 7 colors, with horizontal scrolling.
•
Two alphanumeric/graphic planes (1024 x 512 pixels x 3 color banks) for display
text, figures, and simple graphics.
•
One wave plane with extended resolution (2048 x 512 pixels x 3 color banks) that
can display up to 8 overlapping waves with horizontal scrolling.
•
Three character sizes: large = 32 x 40 pixels, normal = 16 x 20 pixels, dense = 12
x 16 pixels.
•
Attributes resolution 256 x 256 bytes.
•
Can drive a master and up to 3 remote displays.
•
Color luminance equalization.
•
60 Hz operation.
Serial Distribution Network Interface
Introduction
The Serial Distribution Network Interface (SDN_IF) card is used to interface the
CMS to the SDN. The interface path is through the Utility CPU.
This card transmits data to the SDN and receives data from the SDN. Only one SDN
Interface card may be used with each CMS.
Connections
Serial
Distribution
Network
(SDN)
The SDN interface card must be connected to a free branch of the SDN. In the event
of an SDN failure or the branch becoming disconnected from the SDN, the
instruments on the same branch can still communicate with each other using the
autopoll circuitry in the SIC Chip, along with the priority wire. The last-box-detection
circuitry checks for a downstream connection. If there is no downstream connection,
the line is terminated using a relay.
The SDN is a serial digital network for communications between bedside monitors
and central stations, such as arrhythmia computers. The data are passed over a twowire bus. Each data type has its own associated signature, similar to the way that the
MPB messages have a header that identifies the information. This allows the data to
be available to any device that requires it. In addition, devices do not need to know
which other devices require the data. Any devices that require the information from
the SDN, including the CMS, can choose the data it requires using the data signature.
All communications within the SDN are controlled by the System Communications
Controller (SCC). This card is located at the center of the SDN star configuration. The
SCC uses a 32 millisecond poll cycle to send instructions to the monitors on the SDN
branches it controls. The poll cycle is divided into 4 milliseconds of dead time and 28
milliseconds for transferring data.
3-122 CMS Patient Monitoring System
Serial Distribution Network Interface
Components
The SDN card consists of the following functional areas: Address and Data Buffer,
Comparator, Identifier, MUX, SIC RAM, SIGN RAM, SIC Chip, Data Sync, LastBox Detection, Oscillator, and SDN Transceiver.
Theory of Operation
The operations of the SDN Interface card are defined in the following.
SDN
Synchronization
System timing is governed by the 32 millisecond frame interrupt (Frame_Int). When
an SDN Interface card is installed, the Frame_Int signal must be synchronized to the
SDN_Sync signal on the Utility CPU. The SDN_Sync signal indicates the start of a
32 millisecond poll cycle for data transfer. Data can only be written to or read from
the SIC RAM when both the Frame_SYNC and SDN_SYNC signals are low, during
the 4 millisecond dead time.
If there is no SDN Interface card installed, then the 32 millisecond clock in the system
is free-running.
Data Transfer
All data for transmission on the SDN are placed into the SIC RAM by the Utility CPU
in the 4 millisecond dead time. The SIC Chip then automatically sends the data over
the SDN during the 28 millisecond period. Wait cycle logic guarantees the timing
between the Utility CPU and the SIC Chip.
The Utility CPU can select SDN data by placing a signature for selected data in the
SIGN_RAM. Received data are placed in the other half of the SIC RAM and can be
read by the Utility CPU in the 4 millisecond part of the poll cycle. A clock, using a
28.8 MHz oscillator, is generated by the DATA_SYNC gate array, and is used to
synchronize incoming data. This gate array is then used to guarantee that the sample
clock is in the middle of the data clock when the data are stable.
DTCK is used to acknowledge a RAM_ACCESS command from the Utility CPU, so
the Utility CPU does not have to wait. Wait states are not necessary for access to the
SIC_RAM, Identifier, and the 4-bit Latch.
The Utility CPU uses a 4-bit latch to perform certain operations, which are defined in
the following table.
Table 3-30 4-Bit Latch
Bit
Definition
bit 0 (databit8)
Switches the control signals between the Utility CPU and
the SIC Chip.
bit 1 (databit9)
Used to reset the SIC Chip. Sometimes it is necessary to
reset the SIC Chip and not the whole system.
CMS Patient Monitoring System 3-123
Serial Distribution Network Interface
Table 3-30 4-Bit Latch
Summary of SDN
Features
Bit
Definition
bit 2 (databit10)
Used to disable the Multiplexer before control of the SIC
RAM is passed between the Utility CPU and the SIC
Chip, and then to enable it after the switch. This
suppresses spikes and protects the contents of the SIC
RAM.
bit 3 (databit11)
Used to switch on the error LED while tests are performed
on the SDN interface card. When all tests are successfully
completed, the error LED is switched off.
The features of the SDN Interface are as follows.
•
Translates the MPB parallel data that were broadcast on an 8-bit bus to serial SDN
data broadcast on a two-wire bus.
•
Receives all SDN messages, alarms, and data (parameters and waves).
•
Transmits wave and parameter data acquired by the CMS over the SDN. For
example, an ECG wave acquired by the CMS may be sent to an arrhythmia
computer which adds annotated notes to the wave. Then the output from the
computer can be relayed back to the CMS for display under application software
control.
•
Synchronizes the system frame interrupt with the SDN poll cycle (performed by
the Utility CPU card).
•
Detects primary bedside unit mode, either SDN or Auto-poll, and terminates the
line as necessary.
•
Controls transmit data from the primary bed unit and another instrument; for
example, a local recorder using a priority wire.
•
Data can be selectively acquired, with no CPU intervention, by placing tune
headers in the SIGN RAM of the SIC Chip.
•
Incoming data synchronized using 28.8 MHz oscillator.
•
SIC RAM consists of two 2 Kbyte buffers (1 transmit, 1 receive).
•
Latch controls, error LED, SIC Chip reset, multiplexer switch, and multiplexer
disable/enable.
3-124 CMS Patient Monitoring System
Serial Distribution Network Interface
Functional Block
Diagram
Figure 3-49 SDN Interface Card Block Diagram
CMS Patient Monitoring System 3-125
Rack Interface
Rack Interface
Introduction
The Rack Interface (RACK_IF) card supports the Front-End Link protocol (front end
mode) for communications between the system and the Module Racks, which house
up to 32 Plug-In Parameter Modules. Communication is through the Utility CPU.
The function of the card is to acquire data and status from the plug-in modules in the
racks and send back control signals. It does this using the Front End high-speed serial
link (FE-LINK). One FE-LINK can support 32 plug-in modules, which can be located
in the internal rack and up to three remote or satellite racks.
The Rack Interface card also does the following: (1) routes an ECG sync signal to a
phone jack on the internal rack, (2) routes the power from the DC-to-DC converter to
all the racks, and (3) provides a special tool protocol (tool mode) for communication
with external RS232 devices.
The RS232 protocol is NOT provided by this card. Any communication with RS232
devices is routed through a level converter.
FE-LINK
The FE-LINK is a high-speed (500 kilobaud) serial link for passing digital data,
status, and control between the parameter modules and the Rack Interface card.
Connections
The Rack Interface card must be placed in slot 18 on the front of the Computer
Module. This ensures that when the rack is mounted on the front of the Computer
Module, the 20-pin connector on the back of the internal rack aligns with the
connector on the edge of the interface card.
Components
The Rack Interface card consists of the following areas: Comparator, Identifier,
Buffer, Multiplexer Control, Switched RAM, Address Latch, Processor, Line Driver,
and LineDriver/Receiver.
Theory of Operation
The operations of the Rack Interface card are detailed in the following.
Polling
The plug-in modules place their data onto the FE-LINK in response to a poll from the
Rack Interface card. The module IDs are placed into a Scan Table when the system is
first switched on. This scan table is used to decide when to poll each module. A scan
table entry consists of a complete description of the module to be polled, including
ID, rack address, and number of bytes to receive and transmit. The modules are polled
at different rates; for example, the ECG is polled every two milliseconds, while others
such as TEMP or PRESS are polled every eight milliseconds.
Defibrillator
Sync-Out
One of the three ECG waves, which are sampled every two milliseconds, is selected
for input to a digital-to-analog converter. The analog output from the converter is sent
with a delay of less than 20 milliseconds to the phone jack on the front of the internal
rack. This analog signal is used to synchronize the firing of a defibrillator.
3-126 CMS Patient Monitoring System
Rack Interface
Marker Input
The marker input is an analog signal applied to the same phone jack for the duration
of the defibrillator firing. This signal is sensed by the on-board microcontroller, and
merged with the upper part of the ECG wave sample. This allows the defibrillator
firing to be displayed on the screen.
DC-to-DC
Power
The 60V supply from the DC-to-DC converter is placed on all the rack connectors to
supply power to all the racks via the FE-LINK cables.
Data
Transfer
The method for data transfer used by the Rack Interface is called RAM Multiplexing.
Two RAMs are used alternately by the on-board 8051 Microprocessor and the 68000
on the Utility CPU. Every 32 milliseconds the RAMs are switched, using the 32
millisecond frame-interrupt from the Utility CPU, so the RAMs can be accessed by
the other processor. This allows the faster 68000 processor to exchange data with the
RAM and then run-on before the RAMs are switched.
The on-board 8051 Microprocessor then converts the data into serial data for passing
to the racks over the FE-LINK, with no further intervention by the Utility CPU.
Serial data received from the plug-in modules through the FE-LINK is converted to
parallel data and placed into the RAM by the on-board 8051. The RAMs are then
switched, allowing the Utility CPU to exchange data again.
System
Turn On
Summary of Rack
Interface Features
When the system is first switched on, the interface card polls the racks to identify the
parameter modules that are plugged into the racks.
The features of the Rack Interface card are as follows:
•
Translates serial parameter data from the FE-LINK to parallel data for
transmission to the Utility CPU over the 8-bit local bus.
•
Translates parallel data from the 8-bit local bus to serial data for transmission over
the FE-LINK.
•
RAM multiplexing eliminates intervention of the Utility CPU during data transfer.
•
Routes the power from the DC-to-DC converter to the internal and satellite racks.
•
Digital-to-analog converter produces a sync output for defibrillator firing and
senses a marker pulse.
CMS Patient Monitoring System 3-127
Rack Interface
Functional Block
Diagram
Figure 3-50 Rack Interface Card Block Diagram
3-128 CMS Patient Monitoring System
Aux Connector Card
Aux Connector Card
Introduction
The Aux Connector card provides access to the connector on the Rack Interface card
behind the sheet metal cover of the M1046B Computer Module.
Connections
The Aux Connector card is placed in slot 24 of the M1046B Computer Module. The
Aux Connector card has two circuit boards connected by a flex board. The larger
board is placed in slot 24 of the M1046B Computer Module and the smaller board has
a connector that plugs into the Rack Interface card in slot 18.
The larger of the two boards has two connectors, an ECG connector for defibrillator
synchronization and an FE-Link connector to attach satellite module racks. The FELink connector has the cable to the satellite rack attached behind the Computer
Module’s plastic cover and the cable is routed under the Computer Module to the
back. The ECG connector has an ECG adaptor so that it can be accessed through a
hole in the plastic cover.
Remote Switch Card
Introduction
The Remote Switch card provides connection and the remote switching of the DC
power to the computer module, the module racks and the flatscreen display.
Connections
The Remote Switch card is placed in slot 8 of the M1046B Computer Module. A
cable from the M1046B Computer Module’s integral power supply is connected to
the Remote Switch card connector.
CMS Patient Monitoring System 3-129
Remote Switch Card
Integral Power Supply
Metal Cover
ECG Adaptor
FE-Link Cable
Remote Switch
Connector
ECG Connector
Flex Board
FE-Link
Connector
Rack Interface
Card
Aux Connector
Card
Figure 3-51 Remote Switch and Aux Connector Function Cards
3-130 CMS Patient Monitoring System
Chapter 4 V24 and V26 Patient Monitors
Introduction
This chapter provides an overview on the operations, functions and
components of the Philips M1205A V24 and V26 Patient Monitors
(hereafter referred to as V24/V26 or the monitor).
Goals
Objectives
After successfully completing this chapter, you should be able to:
•
Describe the system’s operations.
•
Describe the system’s functions.
•
Identify the system’s components.
In order to meet the chapter’s goals, you should be able to:
•
Describe the purpose of the V24/V26 and the clinical settings in which
it is typically used.
•
Describe the major features and functions of the V24/V24C/V24CT.
•
Describe the V24/V26’ system processes and interfaces.
•
Identify the standard and optional Plug-in modules used by V24/V26.
•
Identify the user controls and connectors on the V24/V24C/V24CT.
•
Identify the V24/V26’ possible software configurations.
•
Identify the V24/V26’ major hardware configurations.
V24 and V26 Patient Monitors 4-1
Introduction
Topics
This chapter contains the following topics:
Chapter Topics
Topic
Page
V24 and V26 Patient Monitors Description and Features
3-3
V24 and V26 Patient Monitors Interfaces
3-11
V24 and V26 Patient Monitors User Controls and Connectors
3-14
V24 and V26 Patient Monitors Software Configurations
3-20
V24 and V26 Patient Monitors Theory of Operation
3-23
4-2 V24 and V26 Patient Monitors
V24 and V26 Patient Monitors Description and Features
V24 and V26 Patient Monitors Description and Features
Introduction
The V24 and V26 are highly flexible patient monitoring systems, which are based on
a variety of components that enable easy customization to a hospital’s requirements.
It utilizes a subset of the same parameter modules as the CMS, with similar operator
controls and waveform display.
Objectives
After completing this section, you should be able to:
•
Describe the purpose of the V24/V26
•
Identify the clinical settings in which the V24/V26 is used.
•
Identify the V24/V26’ general features.
Concepts
The V24/V26 is a flexible, bedside monitor for critical and acute care units, and for
patient transport between units (V24CT). It contains a user interface similar to the
Standard Control Panel of CMS/ACMS, and supports a subset of the functionality of
the CMS/ACMS.
Clinical Uses
The V24/V26 is designed to monitor patients in most critical and acute patient care
areas of the hospital as well as in transport situations (V24CT). As a bedside monitor,
the V24/V26 is most commonly seen mounted to a wall channel with a six- or eightslot Plug-in Satellite Rack mounted below it. It can also be mounted on a table mount
and a roll stand. As a transport monitor (V24CT) a six-slot rack can be docked
directly to the mainframe. The V24/V26 supports a network connection to the Philips
monitoring network (SDN). The V24, V24C, V26C’s source of power is a local AC
power connection. The V24CT is powered by either internal rechargeable batteries or
from an AC power connection.
Product Releases
The V24/V26 is in its fifth release and currently supports a subset of the functionality
of the CMS at C.0.
V24 and V26 Patient
Monitors Standard
Package
The V24/V26 bedside monitor standard package includes:
Features
•
Mainframe with 9.5” passive matrix monochrome flat panel display (V24);
mainframe with 10.4” color flat panel display (V24C/V24CT) capable of
displaying four, or in the case of the V26C/V26CT,six waveforms simultaneously.
•
Eight-slot Plug-in Satellite Rack with front-end link cable
•
Parameter Modules: predefined combinations of ECG/Resp, NBP, SPO2,
InvPRESS, CO2, VueLink, and Recorder
•
Patient Monitoring supplies
The V24/V26 has the following general features:
•
Mainframe with monochrome display (V24); mainframe with color display
(V24C/V24CT and V26C/V26CT) for display of up to six waveforms.
•
Eight-slot or optional six-slot Plug-in Satellite Rack to hold plug-in modules.
V24 and V26 Patient Monitors 4-3
V24 and V26 Patient Monitors Description and Features
•
Optional battery operation (V24CT/V26CT).
•
All parameter modules supported by CMS except FiO2, SvO2 and EEG.
•
Network Compatible through the Philips patient care system interface.
•
Patient Data Management software which provides 24 hour storage of patient
related parameter information.
•
ST Segment analysis software.
•
OxyCRG display software.
•
Neonatal Event Review software
•
Extended arrhythmia detection when networked to one of Philips’ Arrhythmia
Systems.
•
Allows transfer of patient related settings and transfer of patient cables and lines
without recabling or recalibration.
Figure 4-1 Philips V24 and V26 Patient Monitors Standard Package
4-4 V24 and V26 Patient Monitors
V24 and V26 Patient Monitors Description and Features
Mainframe
The mainframe contains the display unit and the processing capabilities for the V24/
V26. A computer subsystem is responsible for parameter processing, display control,
and interfacing. The display section consists of a 9.5” (diagonally measured)
monochrome display (V24); mainframe with 10.4” color display (V26C/V26CT and
V24C/V24CT).
Rack Features
There are two rack options for the V24/V26; either the eight-slot or six-slot rack can
be used. The standard eight-slot rack attaches to the monitor by a front end cable. It
houses up to eight standard single-width CMS modules. The six-slot rack comes
equipped with a standard front-end link connector for attachment to the V24/V26 or
to other CMS models. The V24CT/V26CT supports docking the six-slot rack directly
to the monitor mainframe.
V24 and V26 Patient Monitors 4-5
V24 and V26 Patient Monitors Description and Features
Parameter Modules
The V24/V26 provides 6 or 8 slots to support the following parameter modules:
Table 4-1 Compatible Philips Plug-In Modules
Model
Number
Parameter Module
Number Supported
M1001A/B
ECG
Maximum of one M1001A or M1002A per monitor.
M1002A/B
ECG/RESP
M1006A/B
Pressure
Maximum of three per monitor (bundle specific)
M1006A/B
Option #C01
Pressure Module with
Analog Pressure Output
Maximum of one per monitor (total of two invasive
pressure modules possible)
M1008A
NBP Adult
Maximum of one per monitor
M1008B
NBP Adult//Pediatric/Neonatal
M1012A
Cardiac Output
Maximum of one per monitor (bundle specific)
M1015A
Side Stream CO2
Maximum of one per monitor (bundle specific)
M1016A
CO2
Maximum of one per monitor (bundle specific)
M1018A
tcpO2/tcpCO2
Maximum of one per monitor - only with Neonatal
options
M1020A
SpO2 /PLETH
Maximum of one per monitor
M1022A
Blood Analysis Module
Maximum of one per monitor (bundle specific)
M1029A
Temperature
Maximum of two per monitor (bundle specific)
M1032A
VueLink
Maximum of one VueLink A and VueLink B per
monitor - except Anesthesia option H03 (VueLink B
only)
M1116A or
M1116B
Thermal Array Recorder
Maximum of one per monitor
M1026A
Anesthetic Gas Module
Maximum or one per monitor - only with Anesthesia
options
4-6 V24 and V26 Patient Monitors
V24 and V26 Patient Monitors Description and Features
Philips Patient Care
System
A single upstream Philips monitoring network (SDN) connector allows connectivity
to a Philips patient care system. This allows the V24/V26 to access waveforms,
numbers, and alarms from other networked patient monitoring bedsides. It also allows
connection to a Component Central Station, Philips Information Center, and extended
Philips Arrhythmia Monitoring Systems. The V24/V26 supports the CMS Rev. EBeta Inter-SDN Gateway functionality which includes:
•
•
•
•
•
•
•
Data Management
Overview
VCP (Virtual Circuit Protocol)
VTP (Virtual Terminal Protocol)
DBQ (Database Query)
Central recorder(s)
Centralized arrhythmia
Inter-SDN Gateway compatibility (>24 beds)
The V24/V26 features Patient Data Management. This consists of continuous 24-hour
storage of patient related parameter information. This allows you to:
• manage patient information
• view patient data in graphs or tables
• print patient information reports to a local printer or via a Philips central station.
•
transfer data between V24/V26 and CMS monitors via the Data Transfer Module
Vital Signs
Recording
This standard feature allows you to print out all active parameter labels, numerics,
physiological and technical alarms on the M1116A/B Recorder Module. Vital signs
are sequentially printed each time an NBP measurement has been taken, or automatically at user-defined time intervals.
Split Screen
Capability
The Split Screen capability can display up to 30 minutes of trend data (1 minute
resolution) next to configured waves on the display.
In addition, related alarm limits are shown graphically and numerically, providing an
early indication of upcoming problems.
Clinical Calculation
Set
Stored and manually entered data can be used to perform hemodynamic, ventilation,
and oxygenation calculations. Calculated data is displayed in both indexed and nonindexed format.
Drug Calculator
The Drug Calculator allows you to calculate various drug infusion variables for a
selected drug at the bedside. The Drug Calculator contains 16 pre-configured drugs
and 8 “any dose” formats
A titration table can be displayed and printed.
V24 and V26 Patient Monitors 4-7
V24 and V26 Patient Monitors Description and Features
Arrhythmia
Detection
The V24/V26 will present all arrhythmia status messages, delayed annotated
waveforms and all arrhythmia data management functions when networked to a
Philips arrhythmia monitoring system listed below:
•
Philips 78504/508 with Philips 78720
•
Philips 78560A with arrhythmia option
•
Philips M2340A
•
Philips M2350A
•
Philips M2360A
•
Philips M3150A/M3153A
Anesthetic Gas
Monitoring
The (optional) M1026A Anesthetic Gas Module (AGM) provides a non-dispersive
infrared measurement of respiratory and anesthesia gases. It is intended for
measurement of airway gases of ventilated patients within the anesthesia workplace
during induction, maintenance of, and emergence from anesthesia.
Alarms
When an alarm limit is exceeded it is presented in 3 ways:
•
•
•
Alarm tone (graded according to severity)
Alarm Message (color coded according to severity)
Alarming parameter value flashes.
All alarms are transmitted on the Philips patient care system
Graded Alarms
Red Alarms
Yellow alarms
Alarms are graded and prioritized according to severity.
Identifies asystole, ventricular fibrillation, apnea, bradycardia (in neonates and pediatrics), and pressure disconnect conditions.
Alert clinicians when alarm limits are exceeded.
Technical Alarms
(INOPS)
Are triggered by signal quality problems, equipment malfunction, a measurement that
is not set up, or an ongoing calibration.
Resetting and
Suspending Alarms
The Silence/Reset key on the display control panel allows you to silence alarm tones,
while retaining visual alarm messages (depending on the monitor’s configuration).
Alarms can be indefinitely suspended or suspended for 1, 2, or 3 minutes, after which
alarms will automatically reactivate.
Alarm Recording
To prevent unwanted alarm strip recordings, it is possible to configure which
parameters will trigger an alarm strip.
4-8 V24 and V26 Patient Monitors
V24 and V26 Patient Monitors Description and Features
ST Segment Analysis
ST Segment Analysis software allows you to measure the elevation or depression of
the ST Segment on up to three leads of a patient’s ECG. The ST measurements are
shown as numerics on the flat panel and are available in table and graphic trend
displays in Patient Data Management. The V24/V26 uses the CMS Rev. E-Beta
version of the ST application.
oxyCRG
The Oxygen CardioRespiroGram (oxyCRG) display provides a simultaneous
presentation of 3 waves:
•
beat to beat heart rate (btbHR)
•
compressed respiration rate
•
an oxygenation parameter trend (SpO2 or tcpO2)
Each waveform shows a 6 minute interval, allowing you to compare patterns related
to physiological or pathophysiological processes and detect respiratory conditions
typical of neonates.
Neonatal Event
Review
Neonatal Event Review provides automatic documentation and review of up to 24
events from the last 24 hours. At one glance you can see and review the number of
events and categories, such as bradycardia, apnea with associated bradycardia or
isolated desaturation event.
Settings Transfer
Plug-in modules which are labeled on the front with a “T” can be transported from
one rack to another (or from one Philips system to another) and still keep their
parameter settings. The settings (such as alarm limits) are stored inside the module.
You could even unplug a satellite rack full of these modules from one monitor, and
plug it into another monitor without losing the parameter settings. This behavior
permits fast and easy transport, and is called “Parameter Settings Transfer”. For
Parameter Settings Transfer to work on your monitor, it must be set ON in a special
Service Mode, either by the biomedical engineering department or the Philips service
engineer.
V24 and V26 Patient Monitors 4-9
V24 and V26 Patient Monitors Description and Features
V24 and V26 Patient
Monitors Features
Exercises
1. What is the V24/V26?
a. an eight-channel color monitoring system with the capability of processing up
to eight single-width parameter modules.
b. a four-channel monochrome or a six- or four-channel color monitoring system
with the capability of processing up to eight single-width parameter modules.
c. a six-channel monochrome monitoring system with the capability of processing
up to six double-width parameter modules.
2. The V24/V26 has the following general features:
a. Allows transfer of patient related settings
b. Philips monitoring network (SDN) compatible
c. both a and b
3. The rack options for the V24/V26 are:
a. six- or eight-slot
b. two- or four-slot
c. four- or six-slot
4. Patient Data Management is the:
a. 18 hour tracking of patient information
b. 12 hour tracking of patient information
c. 24 hour tracking of patient information
5. What rack is standard with the V24/V26?
a. four-slot rack
b. six-slot rack
c. eight-slot rack
6. The current release of V24/V26 supports a subset of the functionality of which
monitor?
a. CMS Release C.0
b. CMS Rev C+
Answers
1. b
2. c
3. a
4. c
5. c
6. a
4-10 V24 and V26 Patient Monitors
V24 and V26 Patient Monitors Interfaces
V24 and V26 Patient Monitors Interfaces
Introduction
The following section describes the V24/V26 and the interfaces it uses.
Objectives
After completing this section, you should be able to describe the interfaces used with
the V24/V26.
Concepts
Concepts important to the V24/V26 interfaces:
Overview
Philips Monitoring
Network (SDN) Interface
•
Alert information- Information that signals an alarm.
•
Parametric information - Information that is presented as numerics.
•
Philips monitoring network (SDN) - Serial Distribution Network
•
Upstream - Accepts information from another source.
•
Waveform - Information that is presented as waves.
Connectors are provided for various functionality. These functions are further
explained below:
•
Philips monitoring network (SDN) interface
•
RS232 Interface
•
Front-End Link Protocol for Racks (FELP)
•
Service Ports
•
AC Power Connector
•
Defib Sync/ECG Output Connector
A single Philips monitoring network (SDN) connector (upstream only, no
downstream connector) is available to allow connection to a Philips monitoring
network (SDN). This allows the V24/V26 to show waveforms and alarms of interest
from other networked bedsides. It also allows connection to a Central Station as well
as centralized arrhythmia systems. V24/V26’s single Philips monitoring network
(SDN) connector means it must be the last instrument on a Philips monitoring
network (SDN) branch.
The Philips monitoring network (SDN) interface subsystem consists of the physical
interface to the Philips monitoring network (SDN) and controlling firmware. The
interface communicates with the Philips monitoring network (SDN) interface module
and physical network.
Digitized patient information displayed over the Philips monitoring network (SDN)
may be either waveforms (for ECG, pressure, respiration), parametric information (for
V24 and V26 Patient Monitors 4-11
V24 and V26 Patient Monitors Interfaces
heart rate/pulse, pressure values, and respiration rate) or alert information (for alarms
and assorted status information). The Philips monitoring network (SDN) data
transmission rate of 3.6 Mbits/sec can provide 7700 usable 12-bit data words per 32
millisecond poll cycle. The Philips monitoring network (SDN) is a half-duplex
network using shielded twisted pair cables. All data is transmitted differentially and
serially using block code modulation.
Within the connected instruments, the Philips monitoring network (SDN) interface
circuitry provides the link between the serial digital network and the rest of the
instrument. Each instrument connected to the Philips monitoring network (SDN),
except Philips care hub (SCC), has basically the same interface circuitry, most of
which is contained on a custom integrated circuit called the SDN Interface Circuit
Chip (SIC Chip). This chip has been redesigned for the V24/V26, for more
integration of circuitry within the SIC chip.
RS232 Interface
The (optional) RS232 interface has 1 port that permits connection to the M1026A
AGM, connection to a personal computer via MECIF (MEdical Computer InterFace),
or local printing capability.
The RS232 interface subsystem consists of the physical interface to the RS232
network and controlling firmware. The connector type used is a 9 pin D-sub female
and is located at the rear of the V24/V26 mainframe.
Front-End Link
Service Port
AC Power Connector
Defib Sync/ECG Output
Connector
The parameter rack, generally located near the patient, is connected to the mainframe
by a serial front-end link. a Philips proprietary front-end link connector is on the left
side of the V24/V26 for attachment to a rack by a cable. This front-end link operates
identically to the front-end link used in the CMS. There is a four meter maximum
length for the cable length (rack to mainframe).
Both the application and utility processors have dedicated service ports. Both are
upgradeable by the CPC service tool. (The front end rack software is not externally
upgradeable.)
A standard CEE connector (IED Type 320) is located at the rear of the V24/V26
Mainframe. A detachable country-specific line cord is supplied.
The connector has the same form, fit, and functionality as in CMS. This three circuit
phono jack connector is located on the upper left side of the V24/V26 Mainframe.
4-12 V24 and V26 Patient Monitors
V24 and V26 Patient Monitors Interfaces
V24 and V26 Patient
Monitors Interfaces
Exercises
1. The Philips monitoring network (SDN) connector used with the V24/V26 is:
a. both an upstream and downstream connector
b. a downstream connector
c. an upstream connector only
2. Digitized patient information transmitted over the Philips monitoring network
(SDN) may be either:
a. waveforms
b. parametric information
c. both a and b
3. The standard CEE connector is located at:
a. the front of the V24/V26 mainframe
b. the rear of the V24/V26 mainframe
c. on the left side of the V24/V26 mainframe
Answers
1. c
2. c
3. b
V24 and V26 Patient Monitors 4-13
V24 and V26 Patient Monitors User Controls and Connectors
V24 and V26 Patient Monitors User Controls and Connectors
Introduction
The following section describes the V24/V26 and its User Controls and Connectors.
Objectives
After completing this section, you should be able to:
Concepts
•
Identify the User Controls on the V24/V26.
•
Identify the Connectors used with the V24/V26.
Concepts important to the V24/V26 user controls and connectors:
•
Front Panel - The panel where the User Controls are located.
•
Hardkey - A key on the front panel which has a permanent function and label.
•
Softkey - A key on the front panel that has a dynamically changing function and
label, which corresponds to a label displayed on the screen.
User Controls
Overview
The V24/V26 display and control structure looks very similar to the CMS. The main
functional distinctions from CMS are the number of waveforms (4 versus 4/6/8) and
the size of the display and keys.
Display
In addition to the obvious dimensional differences between the CMS and V24/V26
displays, the number of pixels in both the horizontal and vertical axis differ as well.
The attributes in CMS cover a 4x2 pixel area. The blinking rate may appear to differ
between CMS and the V24/V26 due to the slower response times of the flat panel
displays.
4-14 V24 and V26 Patient Monitors
User Controls
Front Panel Controls
The V24/V26 front panel is a scaled-down version of CMS’ Revision E front panel
with a similar key layout. The V24/V26 key layout maintains consistency, for the
most part, with the CMS user interface.
Shown below is the front bezel keypad for the V24 and V24C.
Red
Yellow
Alarm Alarm
Confirm
Silence/
Reset
Alarms
Other
Patients
Realtime
Record
Main
Screen
Suspend
ON
1
OFF
0
Monitor
Setup
Procedures
Trends/
Calcs
Module
Setup
Delayed
Record
Figure 4-2 Philips V24 and V24C POC Front Keypanel Layout
Shown below is the front bezel keypad for the V24CT. The V24CT front panel
contains additional battery and power indicators.
Red
Yellow
Alarm Alarm
Confirm
Silence/
Reset
Alarms
Main
Screen
Suspend
ON
1
OFF
0
Other
Patients
Monitor
Setup
Realtime
Record
Procedures
Trends/
Calcs
Module
Setup
Battery
Charging
Battery
Charged
Delayed
Record
AC
Power
Figure 4-3 Philips V24CT POC Front Keypanel Layout
The V24/V26 Front
Panel Keys
Suspend Key
Silence/Reset Key
Alarm Key
The function of front panel hardkeys and softkeys, as they pertain to V24/V26, are
presented here. Differences between these keys as they operate within V24/V26
compared with CMS are discussed where appropriate.
Pressing this key reverses the Alarms Suspend state. This key is functionally identical
to CMS’.
Pressing this key silences an alarm. If the cause of the alarm has been eliminated,
pressing this key resets the alarm. This key is functionally identical to CMS’.
The <Volume Control> softkey has been eliminated from V24/V26’s Alarm Array of
Choices due to the availability of standard display volume controls. All other Alarm
Control options are unchanged.
V24 and V26 Patient Monitors 4-15
User Controls
Other Patients Key
This key (formerly called Overview in CMS) is functionally identical to CMS’.
Monitor Setup Key
This key, (formerly Instrument Config in CMS) is functionally similar to CMS’ with
the following differences:
•
There are three display modes for the V24/V26 display and up to six waves (nonoverlapped and overlapped).
There is a background selection for the monochrome LCD: black text on a white
background (for older versions), or white text on a black background. Background is
not selectable on the color flat panel display.
Procedures Key
Trends/
Calcs
Module Setup Key
Main Screen Key
Realtime Record Key
This key (formerly Monitoring Procedures in CMS) is functionally identical to CMS’.
A softkey for the Ht/Wt entry for Cardiac index calculation is in the Array of Choices
for this key.
This key (formerly Patient Data in CMS and Trends in V24) provides access to the
Data Management functionality. The title on the Array of Choices is changed to
Trend/Calcs to reflect the new key label.
This key (formerly Parameters in CMS) is functionally identical to CMS’. It enables
you to change or adjust parameter settings, switch parameters on or off, or set up
parameters.
This key (formerly Standard Display in CMS) is functionally identical to CMS’.
Pressing this key displays a Selection Window that gives choices for real time
recording, which is a recording of the waveforms from the time of the request.
Delayed Record Key
Pressing this key generates a delayed recording, which is a recording of waveforms
that are no longer on the monitor screen.
Blank or Minus Key
The function of these programmable softkeys varies with the application currently
being used by the user.
Confirm Key
This key is functionally identical to CMS’. It only functions when it is illuminated. A
prompt message “...press CONFIRM..” appears on the screen when you need to use
it.
4-16 V24 and V26 Patient Monitors
User Controls
V24/V26 User
Controls Exercises
1. The main distinctions of the V24/V26 from CMS are:
a. number of waveforms and the size of the display and keys
b. the size of the monitor
c. the number of user keys on the front panel
2. The V24/V26 front panel is a scaled down version of
a. CMS’ Rev E front panel
b. CMS’ Rev C+ front panel
3. Which key provides access to the Data Management functionality?
a. Procedures key
b. Module Setup key
c. Trends/Calcs key
Answers
1. a
2. a
3. c
V24 and V26 Patient Monitors 4-17
Connectors
Connectors
Overview
The V24/V26 supports either a six-slot or eight-slot parameter rack.
Eight-slot Rack
The eight-slot rack is shipped with each standard V24/V26. This rack is the same
M1041A Satellite rack used with the CMS. It accommodates up to 8 single width
modules and is attached to the mainframe by a standard Front End Link cable to the
V24/V26 Mainframe.
The V24/V26 does not support the connection of more than one rack and displays an
error prompt if another rack (with a parameter module inserted) is attached.
Six-slot Rack
This rack accommodates up to six single width modules and is attached to the
mainframe by a standard front end cable. The six-slot rack is dockable to the V24CT
Mainframe.
The six module rack provides an optimized rack solution for monitoring. This rack
matches the user’s need for up to six single width CMS compatible modules.
4-18 V24 and V26 Patient Monitors
Connectors
Connectors
Exercises
1. Which rack is shipped with the V24/V26?
a. eight-slot rack
b. six-slot rack
c. four-slot rack
2. The 6 module rack matches the user’s need for:
a. a smaller piece of hardware
b. up to 6 CMS compatible modules
c. 8 CMS compatible modules
Answers
1. a
2. b
V24 and V26 Patient Monitors 4-19
V24 and V26 Patient Monitors Software Configurations
V24 and V26 Patient Monitors Software Configurations
Introduction
The following section describes the V24/V26 software and hardware configurations.
Objectives
After completing this section, you should be able to:
Concepts
Overview
•
Identify the V24/V26’s software configurations.
•
Identify the V24/V26’s hardware configurations.
•
Describe the major components of the Theory of Operation.
Concepts important to the V24/V26 description:
•
ASW - Application SoftWare modules
•
Operating System - The software that performs data management and
communications functions.
The software is divided into 4 major conceptual layers:
4.
The first layer consists of the operating system that performs management
functions and accomplishes intermodule communications. The operating system
passes messages between the various manager modules. The operating system
also performs system initialization, background error checking, and run-time
checking.
5.
The second layer consists of the monitoring manager modules. This layer
includes the alarm, record, trend database, and heart rate selector.
6.
The third layer consists of the interface manager modules and interface
controllers. This layer consists of the display/operator, date/time, recorder and
Philips monitoring network (SDN) managers.
7.
The last layer consists of the monitoring algorithms and related CMS plug-in
modules acquiring the physiological signals. This layer includes the standard
CMS plug-in modules and monitoring algorithms.
4-20 V24 and V26 Patient Monitors
V24 and V26 Patient Monitors Software Configurations
Modules
Partitioning
The V24/V26 software is modular and divided among 3 CPUs: Application CPU,
Utility CPU, and the Front End microcontroller. The Application CPU contains the
interface managers, monitoring managers and monitoring algorithms. The Utility
CPU contains the low level interface controllers. The Front End microcontroller
serves as a high-speed intelligent UART to the CMS front end modules.
Application CPU
Architecture
The software architecture of the V24/V26 application CPU is the same as in the
application CPUs in the other monitors. The software consists of the application
software and the Operating System. The application software consists of Application
SoftWare modules (ASWs). Each module implements a certain function, i.e., the
pressure ASW implements the pressure function and the alarm handler ASW
implements the alarm functions. The modules communicate over the message passing
bus (MPB). The Operating System manages the hardware resources and schedules the
routines of the application modules based on times routines and on MPB messages
received.
Utility CPU
Architecture
The Utility CPU functions as the display controller, FE interface controller, Philips
monitoring network (SDN) controller, human interface controller, real time clock
controller, and EEPROM controller. All of the software runs under the control of OS/
i operating system. Communication with the Application processor is through the
MPB (Message Passing Bus). Communication with the Front End CPU is through a
shared memory buffer.
Front End
Microcontroller
Architecture
The FE microcontroller is a CMOS 87C51 and is primarily responsible for
communication with the Front End Rack. The FE microcontroller communicates with
the Utility CPU through shared RAM. In addition to Front End Link communication,
the FE microcontroller is responsible for generating analog ECG output by an 8 bit
D/A converter. Analog ECG output is accessed through a phono jack on the V24/V26.
V24 and V26 Patient Monitors 4-21
V24 and V26 Patient Monitors Software Configurations
V24/V26 Software
Configurations
Exercises
1. The monitoring manager modules include:
a. alarm
b. trend database
c. both a and b
2. The FE microcontroller is primarily responsible for:
a. data management
b. communication with the Front End rack
c. trend setting
Answers
1. c
2. b
4-22 V24 and V26 Patient Monitors
V24 and V26 Patient Monitors Theory of Operation
V24 and V26 Patient Monitors Theory of Operation
Overview
The V24/V26 consists of the following:
•
an internal power supply which supplies all of the voltages required for V24/V26
operation
•
a System Board which performs all of the processing functions
•
a LCD Adaptor Board (V24)
•
a 3 board assembly, consisting of LCD Adapter Board, DSPC Board, and CDCI
Board (V24C/V24CT and V26C/V26CT only)
•
a front panel keypad
•
a flat panel display
•
Service Port Connector
•
six-slot or eight-slot racks
Philips V24
MAINFRAME
PHYSIOLOGICAL
DATA
Module Rack
Six or eight
Parameter Modules
MONOCHROME
SYSTEM
Board
App
CPU
60 VDC,
LCD
Adaptor
Assy
78 KHz
(Depending upon rack used)
LIQUID
CRYSTAL
DISPLAY
FE
Util
CPU
CPU
5Vdc
12Vdc
60Vdc
CONTROL
AC INPUT (nominal)
POWER
PANEL
90 TO 250 VAC,
SUPPLY
48 TO 66 Hz
V24 and V26 Patient Monitors 4-23
V24 and V26 Patient Monitors Theory of Operation
Philips V26C/V24C
PHYSIOLOGICAL
MAINFRAME
LCD
Adapter
Board
DSPC
Board
DATA
Module Rack
SYSTEM
Board
Six or eight
Parameter Modules
App
CPU
60 VDC,
CDCI
Board
78 KHz
(Depending upon rack used)
COLOR
LIQUID
FLAT PANEL
DISPLAY
FE
Util
CPU
CPU
5Vdc
12Vdc
60Vdc
CONTROL
AC INPUT (nominal)
POWER
90 TO 250 VAC,
SUPPLY
48 TO 66 Hz
4-24 V24 and V26 Patient Monitors
PANEL
V24 and V26 Patient Monitors Theory of Operation
Philips V26CT/V24CT
PHYSIOLOGICAL
MAINFRAME
LCD
Adapter
Board
DSPC
Board
DATA
Module Rack
SYSTEM
Board
Six or eight
App
CPU
60 VDC,
Parameter Modules
CDCI
Board
78 KHz
COLOR
LIQUID
FLAT PANEL
DISPLAY
(Depending upon rack used)
FE
Util
CPU
CPU
5Vdc
12Vdc
60Vdc
CONTROL
AC INPUT (nominal)
POWER
PANEL
90 TO 250 VAC,
SUPPLY
48 TO 66 Hz
V24, V24C, V26C
Power Supply
2 LEAD
ACID
BATTERIES
The V24, V24C, V26C power supply provides the following power outputs:
V24
V24CT/V26CT
Power Supply
V24C/V26C
+5 Volts @ 2.0 Amps, max
+5 Volts @ 2.5 Amps, max
+12 Volts @ 2.0 Amps, max
+12 Volts @ 0.75 Amps, max
+60 Volts @ 0.35 Amps, max
+60 Volts @ 0.35 Amps, max
The V24CT operates from an internal battery power supply, or from an external AC
source. The internal power is provided by one or two lead-acid batteries. The V24CT
can operate on 90 to 250 VAC, 48 to 66 Hz, depending on local power sources. The
Power Supply converts input power into three DC voltages for use in the transport
mainframe, and for the plug-in modules in the transport rack. The power board
communicates its status and the status of the internal batteries to the processors on the
System Board.The V24CT power supply provides the following power outputs:
V24CT/V26CT Power Outputs
+5 Volts @ 2.8 Amps, max
+12 Volts @ 0.65 Amps, max
+60 Volts @ 0.3 Amps, max
V24 and V26 Patient Monitors 4-25
V24 and V26 Patient Monitors Theory of Operation
Subcircuits
The Power Supply consists of four subcircuits:
•
AC to DC converter
•
Battery charger
•
DC to DC converter
•
Power Logic/CPU Interface
4-26 V24 and V26 Patient Monitors
V24 and V26 Patient Monitors Theory of Operation
AC to DC Converter
The AC to DC converter subcircuit converts the AC line (90 to 250 VAC, 47 to 66
HZ) into a safety isolated DC output.
The input AC voltage is directly rectified to create a high voltage DC rail (100 to 350
VDC). The voltage rail feeds a high frequency (100 khg) switching connector. This
generates a safety isolated 18 VDC (Vch at pin 30 of connector J3B) used to power
the battery charger and DC to DC converter.
AC INPUT
FORWARD
18VDC
CONVERTER
RECTIFIER
TO
DC-TO-DC
CONVERTER
TO BATTERY CHARGER
Battery Charging Circuit
The battery charging circuit contains two identical battery charger circuits which
control the charge of the two sealed lead-acid batteries through four distinct states.
These states are:
State
Description
1
On power-on reset or if the battery voltage is less than
12.33 V at 25ºC, a constant current is sourced to the
battery. The current has a value of 0.83 amps if the
monitor is switched off or 0.19 amps if the power switch
is on.
2
When the battery voltage reaches 14.7V at 25ºC, the
voltage is regulated to this value and charge current
tapers off. When charge current tapers off to 42mA, the
charging circuit switches to the next state.
3
A four to five hour time is started and battery voltage is
regulated to 13.7V at 25ºC. A signal indicating the
battery is more than 90% charged is given.
4
After a time-out, the charger is disabled. The charger is
re-enabled into state 1 if the battery voltage drops below
12.33V at 25ºC or if power is cycled.
V24 and V26 Patient Monitors 4-27
V24 and V26 Patient Monitors Theory of Operation
The following figure shows a graphical representation of the battery charging circuit
states.
Figure 4-4 Battery Charging States
4-28 V24 and V26 Patient Monitors
V24 and V26 Patient Monitors Theory of Operation
Charger Operation - State 1
The charger circuit receives input from the non-switchable 18 Vdc output of the AC/
DC power supply. The charging circuit contains two identical battery charger circuits.
The following description applies to either battery charger circuit.
The Sealed lead-acid battery charging circuit regulates the charge to the battery. The
circuit contains a temperature sensitive voltage reference tuned for optimum
regulation of charge voltage to lead-acid batteries.
When the battery is inserted, a mechanical sense contact pulls the input to a debounce
circuit low. This allows the charger circuit to proceed with the first state.
Charger Operation - State 2
The charging circuit enters the second state when the battery voltage reaches 14.7V.
At this point, a voltage amplifier regulates the battery at that value. The battery
voltage is sensed and divided and applied to a current sense comparator which senses
when the voltage reaches 25 mV and trips internal state latches to state three. The
battery charge current falling to 42mA marks the end of state 2.
Charger Operation States 3 and 4
In the third state, the battery voltage is regulated to 13.7V for 4 to 5 hours. Also, in the
third state, a state level control line is pulled high. This lowers the voltage regulation
point. It also causes the FLT1 (FLT2) signal to go low. When both FLT1 and FLT2 are
low, the LEDCRGD line is pulled low turning on the front panel BATTERY
CHARGED LED. The low state of FLT1 (FLT2) also enables the timer for the third
state. The timer circuit disables the third state after approximately 5 hours.
The fourth state is entered when the third state is disabled. The charger would be reenabled into the first state if the battery voltage drops below 12.33V at 25ºC, or if the
AC line cord is disconnected then reconnected.
During the charging cycle, the Battery Charging and Battery Charged LEDs are
controlled by a PAL in the charging circuit. When at least one battery is present and
greater than 9.0 Vdc (open circuit), the Battery Charging LED flashes at a slow rate
and the Battery Charged LED is off. If two batteries are present and the both chargers
enter state 2, the Battery Charging LED remains illuminated. It is important to note
that if only one battery is present, the Battery Charging LED continues to flash when
the charger for that battery enters state 2; the Battery Charging LED can only be
illuminated constantly when two batteries are present and both have entered state 2.
When both batteries are present and both chargers enter state 3, both the Battery
Charging and Battery Charged LEDs remain illuminated. When the chargers enter
state 4, the Battery Charging LED extinguishes, and the Battery Charged LED
remains illuminated. The Battery Charged LED remains illuminated until the AC
power cord is disconnected.
V24 and V26 Patient Monitors 4-29
V24 and V26 Patient Monitors Theory of Operation
DC to DC Circuit
The DC to DC converter receives input from the lead-acid batteries, or from the
output of the AC to DC power supply, depending on the operating mode. The
converter provides three DC outputs:
•
+60 VDC, power supply connection to front-end rack and parameter modules
•
+12 VDC, the general purpose analog supply
•
VDD, the general logic supply, +5V nominal
AC to DC
+60 VDC
+12 VDC
VDD (+5 VDC)
LEAD-ACID BATTERY
#1
LEAD-ACID BATTERY
#2
4-30 V24 and V26 Patient Monitors
DC-TO-DC CIRCUIT
V24 and V26 Patient Monitors Theory of Operation
Power Logic/CPU
Interface
The power logic/CPU interface circuit consists of three circuits which communicate
the state of the DC-to-DC converter and the batteries to the System PCB. The three
circuits are: power-fail/reset, battery detection, and battery voltage analog-to-digital
converter.
The power fail/reset circuit alerts the System PCB that DC-to-DC conversion will halt
in 2ms during power down via the PSRESET signal.
The battery detection circuit determines whether either battery is inserted. If a battery
is present, the circuit routes a low BAT1PRES or BAT2PRES2 signal to the System
PCB. If a battery is not present, BAT1PRES or BAT2PRES is set high. A logic high
on either of these lines also goes to the battery charger to disable the charger for the
appropriate battery.
The battery voltage analog-to-digital converter converts each battery voltage
sequentially into a seven-bit word. The System PCB selects which battery to sample
using the BAT1CONV and BAT2CONV lines. The seven-bit words, BATSTAT (0-6)
go to the System PCB for state-of-charge determination and low battery detection.
V24 and V26 Patient Monitors 4-31
V24 and V26 Patient Monitors Theory of Operation
System Board
The System Board contains the microprocessors and circuitry to acquire and process
physiological data from the plug-in modules. It consists of four subsystems:
•
Application subsystem
•
Utility subsystem
•
Front End Interface subsystem
•
Common subsystem
Application
Subsystem
The Application subsystem uses the Application CPU to work with parameter
modules to process the physiological signals. It also processes the system core
applications. The Application subsystem has its own dedicated memory and an MPB
interface chip.
Utility Subsystem
The Utility subsystem uses the Utility CPU to perform all non-application-based tasks
such as display communication, interface to the parameter modules and front panel,
control of the EEPROM, and reading and writing to real-time clock. The EEPROM is
used for system configuration storage.
Front End Interface
Subsystem
The Front End Interface subsystem contains a front end interface CPU which allows
the Utility subsystem to communicate to the front end rack-mounted parameter
modules. The Utility subsystem accomplishes this by sharing RAM space between
the Application CPU and the Front End Interface CPU. Two physical RAMs are
multiplexed between the two CPUs. The Front End CPU communicates over a serial
link to a selected module using a polling scheme. The Front End CPU then places the
appropriately formatted data in the shared RAM so it can be accessed by the Utility
CPU.
RAM selection can be generated by either the Utility CPU or the Front End CPU.
The parameter module interface subcircuit also has an analog section that allows an
external defibrillator to be synchronized to an ECG signal. The ECG signal goes from
the Front End CPU to a digital-to-analog converter and its filtering circuitry. The
conditioned ECG signal goes to the defibrillator which responds by sending a marker
pulse to the Front End CPU, which processes it along with the ECG signal.
Common Subsystem
This subsystem provides both the application and utility subsystem with reset signals,
power fail interrupts, master clock, and other miscellaneous clocks.
Front Panel
Keyboard
The V24/V26 keypad provides the operational interface. The front panel interface
circuit on the System Board scans the front panel keypad, controls the LEDs, and
produces the analog waveforms to drive the speaker. The Front Panel CPU performs
the processing for the circuit.
4-32 V24 and V26 Patient Monitors
V24 and V26 Patient Monitors Theory of Operation
Flat Panel Display
V24
The V24 liquid crystal display (LCD) subassembly is a 640 pixel x 480 pixel full dot
monochrome graphic display unit consisting of the LCD panel, a fluorescent tube for
backlighting, and LCD driver row and column circuits.
V24C/V24CT and V26C/V26CT
The V24C/V24CT and V26C/V26CT flat panel display subassembly is a 640 pixel x
480 pixel color graphic display unit consisting of the flat panel display, a fluorescent
tube for backlighting, and driver row and column circuits.
Display Adapter
Board
3 Board Assembly
The V24 LCD Adapter Board provides
•
a location for the backlight inverter assembly.
•
an interface to the LCD.
•
a location for LCD bias and contrast/brightness circuitry.
•
encoded data about panel type and dot pitch.
The V24C/V24CT and V26C/V26CT 3-board assembly provides
•
an LCD Adapter Board for interfacing to the flat panel display.
•
a DSPC board for display control.
•
a CDCI board for interfacing to the System Board.
NOTE
The backlight inverter circuitry for the V24C/V24CT and
V26C/V26CT is integral to the flat panel. This note does not
apply to the new flat panel assembly, which was introduced
with Rel. A.0. Here, the inverter is a separate assembly.
The latest hardware provides only one driver board
instead of a 3 board assembly.
Service Port
Connectors
The Service Port Connectors on the System Board align with the cover on the right
side of the mainframe to provide access for programming the Utility and Application
software.
Six-slot Rack Eightslot Rack
The six-slot rack holds up to six single width parameter modules. The eight-slot rack
holds up to eight single-width parameter modules. Parameter modules can be either
single-width or double-width. There are two connectors for external connections: a
downstream connection for multiple rack configurations, and an upstream connector.
The V24/V26 does not support the connection of more than one rack.
V24/V26 Theory of
Operation Exercises
1. What is the purpose of the LCD Adapter Board?
V24 and V26 Patient Monitors 4-33
V24 and V26 Patient Monitors Theory of Operation
a. provides an interface to the LCD
b. eliminates the shock mounting feature
Answers
1. a
4-34 V24 and V26 Patient Monitors
V24 and V26 Patient Monitors Theory of Operation
V24 and V26 Patient Monitors 4-35
V24 and V26 Patient Monitors Theory of Operation
4-36 V24 and V26 Patient Monitors
Chapter 5 Philips Monitoring Network (SDN)
Introduction
This chapter describes the Philips monitoring network (SDN) and the Inter-SDN
Gateway. Philips monitoring network (SDN) provides network connectivity for the
Philips patient monitoring system. The Inter-SDN Gateway expands the number of
bedside monitors that can be accessed by connecting SDNs together.
This chapter assumes that you have completed the first four chapters of this manual
and that you are familiar with the concepts and workings of the CMS and V24/V26
bedside monitors.
Goals
Objectives
After successfully completing this chapter, you should be able to:
•
Describe the Philips monitoring network (SDN) system’s features.
•
Describe the Philips monitoring network (SDN) system’s functions.
•
Describe the Philips monitoring network (SDN) system’s components.
In order to meet the chapter’s goals, you should be able to:
•
Describe the Philips monitoring network (SDN).
•
Identify the Philips monitoring network (SDN) components.
•
Describe how the Philips monitoring network (SDN) works.
•
Describe the Inter-SDN Gateway.
Philips Monitoring Network (SDN)
5-1
Defining the Philips Monitoring Network (SDN)
Topics
This chapter contains the following topics:
Chapter Topics
Topic
Page
Defining the Philips Monitoring Network (SDN)
5-2
Philips Monitoring Network (SDN) Components
5-3
How the Philips Monitoring Network (SDN) Works
5-4
Defining the Inter-SDN Gateway
5-8
Defining the Philips Monitoring Network (SDN)
The Philips monitoring network (SDN) is a local area communications network for
sharing patient physiological parameters and other data between CMS and V24/V26
bedside monitors, central stations, recorders, and computer systems. The Philips
monitoring network (SDN) is a digital communications network that transfers patient
data between connected instruments and systems.
The Philips monitoring network (SDN) uses a proprietary network protocol that
digitizes patient information collected at each monitor. The Philips monitoring
network (SDN) collects patient information from each individual monitor and
rebroadcasts that information out to the other monitors and systems connected to the
Philips monitoring network (SDN).
The Philips monitoring network (SDN) performs the collection and rebroadcast of
patient information without any user intervention. From the rebroadcast patient
information, nursing staff can display information or receive automatic alarms for any
patient being monitored by a CMS or a V24/V26 connected to the Philips monitoring
network (SDN).
Any type of patient information can be transmitted, including waveforms, such as
ECG, pressure, and respiration, and parametric information, such as heart rate/pulse,
pressure values, and respiration rate. The Philips monitoring network (SDN)
transmits this information at a rate of 3.6 Mbits.
5-2
Philips Monitoring Network (SDN)
Philips Monitoring Network (SDN) Components
Philips Monitoring Network (SDN) Components
The Philips monitoring network (SDN) components include:
•
Philips care hub (SCC)
•
Philips monitoring network (SDN) interface circuitry
•
branch cables
•
local distribution cables (LDC)
•
wall boxes and face plates
Figure 5-1 illustrates some of the Philips monitoring network (SDN) components.
SCC
WALL BOX
BRANCH
CABLES
FACE
PLATE
LDC
Figure 5-1 Philips monitoring network (SDN) System Components
Philips Monitoring Network (SDN)
5-3
How the Philips Monitoring Network (SDN) Works
Philips Care Hub
(SCC)
The Philips care hub (SCC) is the central component of the serial distribution
network. The Philips care hub (SCC) provides the physical system communications
link to the instruments and systems connected to the Philips monitoring network
(SDN). The Philips care hub (SCC) establishes the Philips monitoring network (SDN)
data polling cycles and controls the flow, timing, synchronization, and distribution of
data throughout the network.
The Philips care hub (SCC) also performs some basic fault detection routines to
maintain the reliability of the Philips monitoring network (SDN) communications.
The Philips care hub (SCC) includes self-diagnostic routines for fault detection,
troubleshooting, and servicing.
The Philips care hub (SCC) is a metal chassis with cover and cable clamps, a power
supply, and two PC boards.
Philips Monitoring
Network (SDN)
Interface Circuitry
The Philips monitoring network (SDN) interface circuitry is the intelligent interface
between the Philips monitoring network (SDN) and the host microprocessor located
in the CMS and the V24/V26. This interface circuitry sends and receives messages to
and from other systems over the Philips monitoring network (SDN).
Wall Boxes and Face
Plates
Wall boxes are of standard size, NEMA, 1- or 2-gang switch wall boxes with conduit
knockouts (KOs). The face plates are prepunched, NEMA, 1- or 2-gang faceplates for
Philips monitoring network (SDN) connectors.
Branch Cables
Branch cables are permanently installed cables that provide the long distance
connection between the Philips care hub (SCC) and the wall box.
Local Distribution
Cables (LDC)
The local distribution cables (LDC) are used for local serial connections from the wall
box to CMS or V24/V26 systems. The LDCs can also be used to connect up to four
separate instruments to one wall box. The LDCs provide the ability to move systems
to different bedsides by connecting the systems to the wall boxes at the new locations.
How the Philips Monitoring Network (SDN) Works
The Philips monitoring network (SDN) uses a network configuration called a star
topology. The Philips care hub (SCC) is the center of the star with up to 32 individual
branches extending from the center. These branches can accommodate up to 24
bedside monitors, such as CMSs and V24/V26 monitors, with one patient per branch,
up to six central stations, and two computer monitoring systems. Figure 5-2 illustrates
a sample Philips monitoring network (SDN) configuration
5-4
Philips Monitoring Network (SDN)
How the Philips Monitoring Network (SDN) Works
SICU
78574
SDN
Bedside
M/T
SDN
Bedside
M/T
SDN
Bedside
M/T
78574
SDN
Bedside
M/T
SDN
Bedside
M/T
SDN
Bedside
M/T
Branch
Cables
SDC & XSDC
Wall Box
Face Plate
CCU
ICU
Display
Patient
Information
Center
78504/8
Recorder
78571B/2B
Recorder
78571B/2B
Display
LDC
Patient
Information
Center
78504/8
Local
Distribution
Cables (LDC)
SCC
78581
Display
Patient
Information
Center
78504/8
SDN
Bedside
M/T
SDN
Bedside
M/T
Recorder
78571B/2B
SDN
Bedside
M/T
SDN
Bedside
M/T
SDN
Bedside
M/T
78574
SDN
Bedside
M/T
780
780
780
780
SDN
Bedside
M/T
SDN
Bedside
M/T
78574
Figure 5-2 Sample Philips Monitoring Network (SDN) Configuration
Philips Monitoring Network (SDN)
5-5
How the Philips Monitoring Network (SDN) Works
The Philips monitoring network (SDN) transmits patient information serially at
regular intervals called polling cycles to the Philips care hub (SCC). The Philips care
hub (SCC) sequentially synchronizes and rebroadcasts the received patient
information to all instruments connected to the Philips monitoring network (SDN).
The Philips care hub (SCC) works in conjunction with the Philips monitoring network
(SDN) interface circuitry located within each CMS and V24/V26 monitor connected
to the Philips monitoring network (SDN).
The Philips monitoring network (SDN) interface circuitry sends and receives Philips
monitoring network (SDN) data over the branch cables for Philips care hub (SCC)
instrument-to-system communications. The Philips monitoring network (SDN)
interface circuitry also sends and receives Philips monitoring network (SDN) data
over the LDCs for instrument-to-instrument communications.
Only one CMS or V24/V26 monitor can broadcast patient information at any one
time. The Philips care hub (SCC) rebroadcasts that information to the other branches
on the Philips monitoring network (SDN). The Philips care hub (SCC) functions as a
rotary switch, allowing each branch to transmit information to the other branches.
The Philips care hub (SCC) polls each branch 32 times per second. Figure 5-3
illustrates the poll cycle when the Philips care hub (SCC) polls a branch. The system
on branch 0 sends all of its available information until the system is done. As branch 0
transmits its information, the Philips care hub (SCC) simultaneously rebroadcasts the
information to the other 31 branches.
When the Philips care hub (SCC) senses the end of transmission from branch 0, the
Philips care hub (SCC) turns off the branch 0 receiver. The Philips care hub (SCC)
polls branch 1 and repeats the polling activity for each branch until all 32 branches
have been polled.
If a branch has more than one monitor, the monitor connected closest to the Philips
care hub (SCC) sends information first. When that monitor is finished, it signals
permission to the next monitor so that it can send information. This process continues
for each monitoring system on the branch. Each system gets the opportunity to send
information, but no two monitors can send information at the same time. Also, any
monitor can listen to the information being sent by the other systems.
A complete detailed description of the Philips monitoring network (SDN)
communications cycle can be found in the SDN/SCC Service Manual supplied with
your Philips monitoring network (SDN) Network.
5-6
Philips Monitoring Network (SDN)
How the Philips Monitoring Network (SDN) Works
SYSTEM CYCLE
SYSTEM CYCLE
POLL CYCLE
TALK TIME
TALK TIME, FIRST FEW CYCLES
DATA FROM ONE BRANCH
TALK TAP
ONE MESSAGE
SYNCH TAP
Figure 5-3 SCC Polling
Philips Monitoring Network (SDN)
5-7
Defining the Inter-SDN Gateway
Defining the Inter-SDN Gateway
The Inter-SDN Gateway provides data exchange between two Philips care hubs
(SCC) using the virtual terminal protocol (VTP), a proprietary protocol of the Philips
monitoring network (SDN). With the Inter-SDN Gateway, nursing staff can monitor
patients, whose CMS or V24/V26 monitor is connected to one Philips monitoring
network (SDN), from any CMS or V24/V26 monitor connected to the other Philips
monitoring network (SDN). The CMS provides automatic alarm overview across two
Philips care hubs (SCCs) and manual alarm overview across three Philips care hubs
(SCCs).
You can only connect two Philips care hubs (SCCs) to an Inter-SDN Gateway, but
you can connect a Philips care hub (SCC) to more than one Inter-SDN Gateway.
Connecting a Philips care hub (SCC) to more than one Inter-SDN Gateway expands
the number of bedsides that can be monitored at one CMS or V24/V26 monitor from
24 to 72.
Figure 5-4 illustrates a sample Inter-SDN Gateway configuration.
CMS
CMS
ANY LOGICAL SDN BED VIEWED AT CMS REV 3.5 OR HIGHER
GATEWAY
BROADCAST DATA
TERMINAL DATA
VECTRA
SCC-1
SCC-2
CMS PROTOCOL
VTP PROTOCOL
78360B
BOARDS
CMS
Figure 5-4 Inter-SDN Gateway Configuration
The Inter-SDN Gateway receives bedside broadcast data from one Philips monitoring
network (SDN), formats the data into virtual terminal data, and sends those data to a
specific CMS on the other Philips monitoring network (SDN). This extended
overview has the following features:
5-8
Philips Monitoring Network (SDN)
Defining the Inter-SDN Gateway
•
support for 24 bedsides on the local Philips monitoring network (SDN) and access
to as many as 48 remote bedsides
•
user-configurable access key at each local Philips monitoring network (SDN)
bedside
•
one wave, cascaded in two, four-second segments
•
softkey to select specific waves for display
•
up to seven parameter numerics
•
alert text messages
•
support for up to eight simultaneous remote access sessions in each direction,
depending on availability of each Philips monitoring network (SDN) bandwidth
The Philips monitoring network (SDN) bandwidth is shared equally among six
sending devices, such as Careport, 78360A, and 78360B, thus limiting the number of
active sending devices on a Philips monitoring network (SDN) to six. If the
Inter-SDN Gateway identifies less than six devices, the gateway takes all available
bandwidth. This can limit the number of simultaneous overview sessions; that is, the
more sending devices on the Philips monitoring network (SDN), the fewer the
simultaneous overview sessions permitted. Furthermore, the type of overview session
– manual or automatic alert – affects the number of simultaneous overview sessions
permitted.
For manual overview, Table 5-1 lists the number of simultaneous overview sessions
the Inter-SDN Gateway permits based on the number of sending devices installed on
a Philips monitoring network (SDN).
Table 5-1 Number of Overview Sessions Using Manual Overview
Number of sending devices
Number of sessions
Four to six
Four simultaneous overview sessions in each direction
for a total of eight overall sessions.
Two or three
Six simultaneous overview sessions in each direction for
a total of 12 overall sessions.
One
Eight simultaneous overview sessions in each direction
for a total of 16 overall sessions.
Philips Monitoring Network (SDN)
5-9
Defining the Inter-SDN Gateway
For automatic alert overview, Table 5-2 lists the number of simultaneous overview
sessions the Inter-SDN Gateway permits based on the number of sending devices
installed on a Philips monitoring network (SDN).
Table 5-2 Number of Overview Session Using Automatic Alert Overview
Number of sending
devices
Number of sessions
Three or fewer
Four simultaneous overview sessions in each direction
for a total of eight overall sessions.
Four to six
Two simultaneous overview sessions in each direction
for a total of four overall sessions.
With four to six sending devices, the Inter-SDN Gateway can permit two
simultaneous sessions if less than nine alerts are generated. If the number of alerts
increases above eight, no overviews are permitted. If overview sessions are in
progress, they are automatically dropped off.
The Inter-SDN Gateway is an HP Vectra personal computer with Philips monitoring
network (SDN) interface circuitry. Figure 5-5 illustrates the front and rear view of the
Inter-SDN Gateway, model M1272A.
Figure 5-5 Front and Rear View of the Inter-SDN Gateway
5-10
Philips Monitoring Network (SDN)
Defining the Inter-SDN Gateway Exercises
Defining the Inter-SDN Gateway Exercises
1. The Philips monitoring network (SDN) is a:
a. system to which parameter modules are connected for translating patient
physiological parameters and other data.
b. non-local area communication network for sharing patient physiological
parameters and other data.
c. local area communication network for sharing patient physiological parameters and
other data.
2. The Philips care hub (SCC) is the:
a. intelligent interface between Philips monitoring network (SDN) and the host
microprocessor
b. central component of the Philips monitoring network (SDN)
c. local serial connections from the wall boxes
3. Philips monitoring network (SDN) uses a network configuration called:
a. star topology
b. planet topology
c. branch topology
4. How many Philips care hubs (SCCs) can you connect to an Inter-SDN Gateway?
a. two
b. four
c. six
Answers
1. c
2. b
3. a
4. a
Philips Monitoring Network (SDN)
5-11
Defining the Inter-SDN Gateway Exercises
5-12
Philips Monitoring Network (SDN)
A
Arterial Oxygen Saturation and Plethysmography (SpO2/PLETH) Module
Block Diagram, 60
Components, 60
Description, 60
Exercises, 65
Features, 63
Connectors, 63
PLETH Waveform, 64
Safety, 63
User Controls, 63
Measurements, 60
Theory of Operation, 62
Arterial Oxygen Saturation via Pulse Oximetry (SpO2) Measurement
Concepts, 56
Criteria for Proper Measurement, 57
Description, 56
Measurement Acquisition, 57
Measurement Principle, 57
Output, 57
Plug-In Modules, 58
References, 58
Arterial Oxygen Saturation via Pulse Oximetry (SpO2) MeasurementExercises, 59
C
Cardiac Output (C.O.) Measurement
Concepts, 40, 49
Criteria for Proper Measurement, 42
Description, 40
Exercises, 43
Measurement Acquisition, 40, 49
Measurement Principle, 40, 49
Output, 42
Plug-In Modules, 42
References, 42
Cardiac Output (C.O.) Module
Block Diagram, 44, 52
C.O. Module Features, 47, 55
Components, 44
Description, 44, 52
Exercises, 48
Features
Connectors, 47, 55
Safety, 47, 55
User Controls, 47, 55
Measurements, 44, 52
Theory of Operation, 46, 54
CO2 Respiratory Gas Measurement
Concepts, 20
Criteria for Proper Measurement, 21
Description, 20
Measurement Acquisition, 20
Measurement Output, 20
Measurement Principle, 20
Plug-In Modules, 21
CO2 Respiratory Gas Module (M1016A)
Block Diagram, 23
Components, 23
Description, 23
Exercises, 27
Features, 25
Connectors, 26
Safety, 26
User Controls, 26
Measurements, 23
Theory of Operation, 25
D
Data Transfer Module
Block Diagram, 86
Components, 86
Description, 86
Exercises, 90
Features, 89
Capabilities, 89
Safety, 89
User Controls, 89
Theory of Operation, 88
E
ECG Measurements Exercises, 12
Electrocardiogram (ECG) Measurement
Concepts, 3
Criteria for Proper Measurement, 11
Description, 3
Measurement Acquisition, 3
Chest Leads, 6
Five-Electrode Placements, 8
Limb Leads, 4
Modified Chest Lead (MCL1), 7
Measurement Principle, 3
Output, 9
ECG Waveforms, 10
ST Segment, 10
Plug-In Modules, 11
Electrocardiogram (ECG) Module
Block Diagram, 13
Components, 13
Description, 13
Exercises, 18
Features, 16
Connectors, 16
Paced vs. Non-Paced Mode, 17
QRS Detection, 17
Safety, 17
ST Segment Analysis, 17
User Controls, 16
Waveforms, 16
Measurements, 13
Theory of Operation, 15
Electrocardiogram/Respiration (ECG/RESP) Module
Block Diagram, 24
Components, 23
Description, 23
Exercises, 28
Features, 26
Connectors, 26
ECG Modes, 26
RESP Modes, 27
Safety, 27
ST Segment Analysis, 27
User Controls, 26
Measurements, 23
Theory of Operation, 25
F
FIO2 Module (M1017A)
Block Diagram, 35
Components, 35
Description, 35
Exercises, 39
Features, 37
Connectors, 37
Safety, 38
User Controls, 37
Measurements, 35
Theory of Operation, 37
FIO2 Respiratory Measurement
Concepts, 33
Criteria for Proper Measurement, 34
Description, 33
Exercises, 34
Measurement Acquisition, 33
Measurement Output, 33
Measurement Principle, 33
Plug-In Modules, 34
I
Invasive Blood Pressure Measurement
Concepts, 3
Criteria for Proper Measurement, 4
Description, 3
Exercises, 5
Measurement Acquisition, 3
Measurement Output, 4
Measurement Principle, 3
Plug-In Modules, 4
Invasive Blood Pressure Module (M1006A)
Block Diagram, 6
Components, 6
Description, 6
Exercises, 10
Features, 8
Connectors, 9, 85, 95
Safety, 9, 85, 95
User Controls, 9
Measurements, 6
Theory of Operation, 8
Invasive Blood Pressure Module (M1006A/Option #C01)
Block Diagram, 11
Components, 11
Description, 11
Exercises, 15
Features, 14
Connectors, 14
User Controls, 14
Measurements, 11
Theory of Operation, 13
Invasive Blood Pressure Module (M1006B)
Block Diagram, 16
Components, 16
Description, 16
Exercises, 19
Features, 18
Measurements, 16
Theory of Operation, 18
N
Non-invasive Blood Pressure (NBP) Measurement
Concepts, 30
Criteria for Proper Measurement, 31
Description, 30
Exercises, 32
Measurement Acquisition, 31
Measurement Principle, 30
Output, 31
Plug-In Modules, 31
Non-invasive Blood Pressure (NBP) Modules
Block Diagram, 34
Components, 34
Description, 34
Exercises, 39
Features, 36
Connectors, 37
NPB Modes, 37
Safety, 38
User Controls, 37
Measurements, 34
Theory of Operation, 36
R
Recorder Module (M1116A)
Block Diagram, 73
Description, 73
Exercises, 79
Features, 77
Recordings, 77
User Controls, 77
Theory of Operation, 75
Recorder Module (M1116B)
Block Diagram, 80
Description, 80
Exercises, 85
Features, 83
Recordings, 84
User Controls, 83
Theory of Operation, 82
Respirogram (RESP) Measurement
Concepts, 19
Criteria for Proper Measurement, 21
Description, 19
Exercises, 22
Measurement Acquisition, 20
Measurement Principle, 19
Output, 21
Plug-In Modules, 21
References, 21
S
Sidestream CO2 Module (M1015A)
Block Diagram, 28
Components, 28
Description, 28
Exercises, 32
Features, 31
Connectors, 31
Safety, 31
Measurements, 28
Theory of Operation, 30
SvO2 Blood Measurement
Concepts, 50
Criteria for Proper Measurement, 50
Description, 50
Exercises, 51
Measurement Acquisition, 50
Measurement Output, 50
Measurement Principle, 50
Plug-In Modules, 50
SvO2 Module (M1021A)
Block Diagram, 52
Components, 52
Description, 52
Exercises, 57
Features, 55
Connectors, 56
Safety, 56
User Controls, 55
Measurements, 52
Theory of Operation, 54
T
Temperature (TEMP) Measurement
Concepts, 66
Criteria for Proper Measurement, 66
Description, 66
Exercises, 68
Measurement Acquisition, 66
Measurement Principle, 66
Output, 66
Plug-In Modules, 67
References, 67
Temperature (TEMP) Module
Block Diagram, 69
Components, 69
Description, 69
Exercises, 72
Features, 71
Connectors, 71
Safety, 71
User Controls, 71
Measurements, 69
Theory of Operation, 71
Transcutaneous Gas Measurement
Concepts, 40
Criteria for Proper Measurement, 41
Description, 40
Exercises, 42
Measurement Acquisition, 41
Measurement Output, 41
Measurement Principle, 40
Plug-In Modules, 41
Transcutaneous Gas Module (M1018A)
Block Diagram, 45
Calibration Algorithm, 43
Components, 45
Description, 43
Features, 48
Measurements, 43
Theory of Operation, 47
V
VueLink Module
Block Diagram, 69, 81
Components, 69
Description, 68
Exercises, 73
Features, 71
Connectors, 72
Safety, 72
User Controls, 72
Measurements, 68
Theory of Operation, 71