1
CLDC HotSpot™ Implementation
Porting Guide
CLDC HotSpot Implementation, Version 1.1.3
Java™ ME Platform
Sun Microsystems, Inc.
www.sun.com
July 2006
Copyright © 2006 Sun Microsystems, Inc., 4150 Network Circle, Santa Clara, California 95054, U.S.A. All rights reserved.
Sun Microsystems, Inc. has intellectual property rights relating to technology embodied in the product that is described in this document. In
particular, and without limitation, these intellectual property rights may include one or more of the U.S. patents listed at
http://www.sun.com/patents and one or more additional patents or pending patent applications in the U.S. and in other countries.
Unpublished - rights reserved under the Copyright Laws of the United States.
THIS PRODUCT CONTAINS CONFIDENTIAL INFORMATION AND TRADE SECRETS OF SUN MICROSYSTEMS, INC. USE,
DISCLOSURE OR REPRODUCTION IS PROHIBITED WITHOUT THE PRIOR EXPRESS WRITTEN PERMISSION OF SUN MICROSYSTEMS,
INC.
U.S. Government Rights - Commercial software. Government users are subject to the Sun Microsystems, Inc. standard license agreement and
applicable provisions of the FAR and its supplements. This distribution may include materials developed by third parties.
Sun, Sun Microsystems, the Sun logo, Java, HotSpot, and the Java Coffee Cup logo are trademarks or registered trademarks of Sun
Microsystems, Inc. in the U.S. and other countries.
Products covered by and information contained in this service manual are controlled by U.S. Export Control laws and may be subject to the
export or import laws in other countries. Nuclear, missile, chemical biological weapons or nuclear maritime end uses or end users, whether
direct or indirect, are strictly prohibited. Export or reexport to countries subject to U.S. embargo or to entities identified on U.S. export exclusion
lists, including, but not limited to, the denied persons and specially designated nationals lists is strictly prohibited.
Copyright © 2006 Sun Microsystems, Inc., 4150 Network Circle, Santa Clara, California 95054, Etats-Unis. Tous droits réservés.
Sun Microsystems, Inc. a les droits de propriété intellectuels relatants à la technologie incorporée dans le produit qui est décrit dans ce
document. En particulier, et sans la limitation, ces droits de propriété intellectuels peuvent inclure un ou plus des brevets américains énumérés
à http://www.sun.com/patents et un ou les brevets plus supplémentaires ou les applications de brevet en attente dans les Etats - Unis et
dans les autres pays.
Non publie - droits réservés selon la législation des Etats-Unis sur le droit d’auteur.
CE PRODUIT CONTIENT DES INFORMATIONS CONFIDENTIELLES ET DES SECRETS COMMERCIAUX DE SUN MICROSYSTEMS, INC.
SON UTILISATION, SA DIVULGATION ET SA REPRODUCTION SONT INTERDITES SANS L AUTORISATION EXPRESSE, ECRITE ET
PREALABLE DE SUN MICROSYSTEMS, INC. Cette distribution peut comprendre des composants développés par des tierces parties.
Sun, Sun Microsystems, le logo Sun, Java, HotSpot, et le logo Java Coffee Cup sont des marques de fabrique ou des marques déposées de Sun
Microsystems, Inc. aux Etats-Unis et dans d’autres pays.
Les produits qui font l'objet de ce manuel d'entretien et les informations qu'il contient sont regis par la législation américaine en matière de
contrôle des exportations et peut être soumis à la règlementation en vigueur dans d'autres pays dans le domaine des exportations et
importations. Les utilisations finales, ou utilisateurs finaux, pour des armes nucléaires,des missiles, des armes biologiques et chimiques ou du
nucléaire maritime, directement ou indirectement, sont strictement interdites. Les exportations ou réexportations vers les pays sous embargo
américain, ou vers des entités figurant sur les listes d'exclusion d'exportation américaines, y compris, mais de manière non exhaustive, la liste
de personnes qui font objet d'un ordre de ne pas participer, d'une façon directe ou indirecte, aux exportations des produits ou des services qui
sont régis par la législation américaine en matière de contrôle des exportations et la liste de ressortissants spécifiquement désignés, sont
rigoureusement interdites.
Contents
Preface
1.
2.
xiii
Introduction
1.1
CLDC HotSpot Implementation Virtual Machine
1.2
Information About This Release
Porting Overview
2–1
Difference Between an OS Port
and CPU Port 2–1
2.2
Prerequisites and Helpful Information
2–2
includeDB Configuration Database
Starting an Operating System Port
3.1
Overview
1–1
1–2
2.1
2.2.1
3.
1–1
2–2
3–1
3–1
3.1.1
Location of the Operating System
Porting Interface 3–1
3.1.2
Location of Operating System-Specific Code
3–2
3.1.2.1
Creating New Copies of the Operating System-Specific
Files 3–2
3.1.2.2
Location of the Compiler-Specific Porting Interface
3.2
Functionality That Needs to be Ported
3.3
Porting API Details
3–3
3–3
3–4
iii
3.3.1
3.3.0.1
Implement Initialization
3.3.0.2
Real-Time-Tick Management
3.3.0.3
Implement Handle to Terminal
Porting the File System Interface
3.3.1.1
3.4
4.
3–5
3.3.3
Miscellaneous Interfaces to be Implemented
Interfaces in /src/vm/os/os_family
4–1
4.2
Non-Blocking Scheduling Coding Style
4.3
Hybrid Threading Coding Style
Starting a CPU Port
6.
Tuning a Port
4–5
5–1
6–1
Tuning Parameters
6–1
Notes About Parameters
6–1
6.2
Turning Thumb Mode On or Off
6–2
6.3
Choose which Methods to
Compile AOT 6–3
6.4
Tuning the Compiler
6.5
Tuning the Memory Subsystem
Using Java Profilers
7.2
Concepts
3–7
3–7
Coding Styles for Long-Running Native Methods
6.1.1
iv
3–5
4.1
7.1
3–5
Memory Management Interfaces
to be Implemented 3–6
Porting the Threading System
6.1
3–4
3.3.2
5.
7.
File I/O Interfaces
3–4
6–3
6–4
7–1
7–1
7.1.1
Sampling Profiler
7–1
7.1.2
Exact Call Graph Profiler
Viewing Exact Profiler Results
CLDC HotSpot™ Implementation Porting Guide • July 2006
7–2
7–2
4–3
4–1
8.
9.
7.3
Analyzing Exact Profiler Logs
7–3
7.4
Profiler Porting Requirements
7–4
Using the Memory Profiler
8–1
8.1
Feature List
8–1
8.2
Design
8.3
Building with Memory Profiler Support
8.4
Starting the Server
8.5
Using the Client Tool
8–1
8–3
8–3
Implementing Java ME Profiles
9.1
9.2
9.3
Overview
9.5
9–1
9–1
9.1.1
KNI Interface
9.1.2
Main Program Loop
9.1.3
Event Model
9.1.4
Combining Different Models
Build process
9–2
9–2
9–2
9–3
9–3
9.2.1
Building the Virtual Machine Binary Bundle
9.2.2
Linking CLDC HotSpot Implementation
API for Interacting with the Virtual Machine
9.3.1
9.4
8–2
Internal Header Files
9–5
Invoking the Virtual Machine
9–6
9–4
9–5
9.4.1
Initializing the Virtual Machine
9.4.2
Configuring the Virtual Machine
9.4.3
Command-Line Argument Parsing
9.4.4
Starting and Stopping the Virtual Machine
Slave Mode
9–3
9–6
9–6
9–7
9–7
9–8
9.5.1
Slave Mode Application Structure
9.5.2
APIs Used in Slave Mode
9–8
9–9
Contents
v
9.5.3
9.6
Long-Running Native Methods in Slave Mode
Miscellaneous Virtual Machine APIs
9–11
9.6.1
Functions Implemented Inside the
Virtual Machine 9–11
9.6.2
Functions Implemented by Your Software
A. Error Codes
A–1
B. Floating Point on the ARM Platform
B–1
B.1
Low-Level Floating Point Routines
B–1
B.2
Meaning of ENABLE_SOFT_FLOAT
B–2
B.2.1
B.3
Choosing Value for ENABLE_SOFT_FLOAT
Integrating With Platform Software
C. In-Place Execution Porting Notes
C.1
Disabled Class Loading
D.1
C–1
C–1
HiddenPackage and Class.forName
Storing In-Place Execution Binary Images
E. Binary Distribution Model
Memory Profiler Command Set (18)
Get Global Pointers Command (1)
Get All Objects Command (2)
F–2
Get All Classes Command (3)
F–3
Get All Roots Command (4)
F–1
F–3
G. Data Interface for the Memory Profiler
CLDC HotSpot™ Implementation Porting Guide • July 2006
F–1
F–1
Suspend (5) and Resume (6) Commands
vi
D–3
E–1
F. KDWP Extension for Memory Profiler Protocol
F.1
B–3
B–3
D. Preventing MIDlets From Accessing Internal Classes
D.0.1
9–11
G–1
F–4
D–1
D–2
9–10
H. XScale Porting Notes
H.1
Build Procedure
Target Platform
H.1.2
Build Environment
H.1.3
Index
H–1
H.1.1
H.1.2.1
H.2
H–1
H–1
H–1
Required Tools
Preprocessor Symbols
PXA 27x Optimizations
H–2
H–2
H–3
H.2.1
WMMX Instruction Enabling
H–3
H.2.2
Timer Tick Check Optimization
H.2.3
Array Copying by WMMX Instructions
H.2.4
Array Length Reload Elimination
H.2.5
Loop Optimization
H.2.6
Null Pointer Check Elimination for Linux
H–4
H–5
H–5
H–5
H–6
Index–1
Contents
vii
viii
CLDC HotSpot™ Implementation Porting Guide • July 2006
Tables
TABLE 6-1
Typical Values for Tunable Parameters
6–2
TABLE 6-2
Compiler Tuning Options
TABLE 6-3
Memory Subsystem Tuning Options
TABLE A-1
Error Codes
TABLE F-1
Structure of Reply Data for Get Global Pointers Command
TABLE F-2
Structure of Reply Data for Get All Objects Command
F–3
TABLE F-3
Structure of Reply Data for Get All Classes Command
F–3
TABLE F-4
Structure of Reply Data for Get All Roots Command
TABLE H-1
Makefile (jvm.make) Variables
TABLE H-2
C Preprocessor Symbols In Source Code
TABLE H-3
Files Affected by WMMX Instruction Enabling
H–4
TABLE H-4
Files Affected by the Timer Tick Optimization
H–4
6–3
6–4
A–1
F–2
F–4
H–2
H–3
ix
x
CLDC HotSpot™ Implementation Porting Guide • July 2006
Code Samples
CODE EXAMPLE 3-1
Example main Function in Main_os_family.cpp
CODE EXAMPLE 4-1
Coding with the Non-Blocking Scheduling Style
CODE EXAMPLE 4-2
Coding a Potentially Blocking Native Function
3-7
4-3
4-5
xi
xii
CLDC HotSpot™ Implementation Porting Guide • July 2006
Preface
This document provides information for porting the Connected Limited Device
Configuration HotSpot™ implementation virtual machine and libraries to a new
platform. CLDC HotSpot Implementation is a high-performance virtual machine
that can be used as an execution engine for the Connected Limited Device
Configuration platform of Java™ Micro Edition (Java ME platform).
Who Should Use This Document
This document is intended primarily for individuals and companies who want to
port the CLDC HotSpot Implementation virtual machine to a new platform. It is also
invaluable for implementation engineers who wish to implement an entire Java ME
technology-based stack on top of the CLDC HotSpot Implementation virtual
machine. The document is useful also to anyone who wants to learn more about the
internal details of the CLDC HotSpot Implementation virtual machine.
How This Book Is Organized
This book has the following chapters:
Chapter 1 describes the key design goals and the history of CLDC HotSpot
Implementation.
Chapter 2 describes general information for starting a CLDC HotSpot
Implementation port, including the difference between an OS port and a CPU port.
Chapter 4 provides an overview and detailed advice on porting the CLDC HotSpot
Implementation threading system.
xiii
Chapter 3 describes the steps to perform an operating system port of CLDC HotSpot
Implementation.
Chapter 5 outlines the steps and the challenges of undertaking a CPU port of CLDC
HotSpot Implementation.
Chapter 6 outlines the steps of tuning a port of CLDC HotSpot Implementation for
optimal performance.
Chapter 7 covers advanced strategies for tuning a port of CLDC HotSpot
Implementation for performance or footprint.
Chapter 7 provides information on using Java platform profilers with CLDC
HotSpot Implementation.
Chapter 8 provides information on using the memory profiling feature of CLDC
HotSpot Implementation.
Chapter 9 describes how to implement Java ME software profiles (such as MIDP) on
top of the CLDC HotSpot Implementation virtual machine.
Appendix A lists the error codes that might be returned by the CLDC HotSpot
Implementation virtual machine.
Appendix B provides information on implementing floating point support in CLDC
HotSpot Implementation.
Appendix C provides important notes for porting the in-place execution feature of
CLDC HotSpot Implementation.
Appendix D describes measures to prevent user MIDlets from calling certain
internal classes (usually contained in a package called com.yourcompany ).
Appendix E provides information on how to distribute binaries to third parties so
they can add additional functionality to your implementation.
Appendix F describes the extensions to the KDWP Specification needed to support
the memory profiling feature of CLDC HotSpot Implementation.
Appendix G documents the Java programming language data interface for the
memory profiler of CLDC HotSpot Implementation.
Appendix H provides a detailed commentary on the XScale port of CLDC HotSpot
Implementation.
Terminology
These terms related to the Java platform and Java technology are used throughout
this manual.
Java technologybased application
xiv
(Java application)
CLDC HotSpot™ Implementation Porting Guide • July 2006
Java programming
language code
(Java code)
Java programming
language debugger
(Java debugger)
Java programming
language object heap
Java ME platform
profiles
Java technology
object
Java code profiler
Java technology-based
program
(Java heap)
(Java ME profiles)
(Java object)
(Java profiler)
(Java program)
Java programming
language source files
(Java sources files)
stack containing Java
objects
(Java stack)
thread in a Java virtual
machine representing a
Java programming
language thread
stack used by a Java
thread
(Java thread)
(Java thread stack)
Related Documentation
The CLDC HotSpot Implementation Virtual Machine, A Technical White Paper, Sun
Microsystems, Inc. (2003), which can be downloaded from
http://java.sun.com/javame/reference/whitepapers/.
Connected, Limited Device Configuration Specification, Version 1.0, Java Community
Process, Sun Microsystems, Inc.), which can be downloaded from
http://www.jcp.org/en/jsr/detail?id=030.
Connected, Limited Device Configuration Specification, Version 1.1, Java Community
Process, Sun Microsystems, Inc.), which can be downloaded from
http://www.jcp.org/en/jsr/detail?id=139.
Preface
xv
The Java™ Language Specification (Java Series), Second Edition by James Gosling, Bill
Joy, Guy Steele, and Gilad Bracha (Addison-Wesley, 2000)
The Java™ Virtual Machine Specification (Java Series), Second Edition by Tim Lindholm
and Frank Yellin (Addison-Wesley, 1999)
Mobile Information Device Profile Specification, version 1.0, Java Community Process,
Sun Microsystems, Inc.), which can be downloaded from
http://www.jcp.org/en/jsr/detail?id=037.
Mobile Information Device Profile Specification, version 2.0, Java Community Process,
Sun Microsystems, Inc.), which can be downloaded from
http://www.jcp.org/en/jsr/detail?id=118.
The Java Hotspot™ Performance Engine Architecture, A White Paper (Sun Microsystems,
Inc., 1999), which can be downloaded from
http://java.sun.com/products/hotspot/whitepaper.html.
K Native Interface (KNI) Specification, (Sun Microsystems, Inc., 2002)
Programming Wireless Devices with the Java™ 2 Platform, Micro Edition by Roger Riggs,
Antero Taivalsaari and Mark VandenBrink (Addison-Wesley 2001)
Programming Wireless Devices with the Java™ 2 Platform, Micro Edition, Second Edition,
by Roger Riggs, Antero Taivalsaari, Jim Van Peursem, Jyri Huopaniemi, Mark Patel,
and Aleksi Uotila (Addison-Wesley 2003)
Java™ 2 Platform, Micro Edition, A White Paper (Sun Microsystems, Inc., 1999), which
can be downloaded from
http://java.sun.com/products/cldc/wp/KVMwp.pdf.
KVM Debug Wire Protocol (KDWP) Specification, (Sun Microsystems, Inc., 2002)
xvi CLDC HotSpot™ Implementation Porting Guide • July 2006
CHAPTER
1
Introduction
This chapter describes the key design goals and the history of CLDC HotSpot
Implementation, and provides some general information about this release.
1.1
CLDC HotSpot Implementation Virtual
Machine
The CLDC HotSpot Implementation is a high-performance virtual machine for small,
resource-constrained devices such as cellular phones, pagers, wireless email devices,
and smart home appliances. It implements Java ME in resource-constrained devices
with only a few hundred kilobytes of available memory.
Just as the Java HotSpot performance engine removed the gap between native
applications and Java applications on desktop and server platforms, the CLDC
HotSpot Implementation delivers maximum performance on memory-constrained
small devices.
This 1.1.3 version of CLDC HotSpot Implementation features significant
improvements, including the following:
■
■
■
■
■
■
Support for either CLDC 1.0 or CLDC 1.1
Improved startup time of applications
Improved execution speed of applications
Ahead-of-time (AOT) compilation (optional)
In-place execution (optional)
Multitasking support (optional)
1-1
CLDC HotSpot Implementation is a replacement for the K Virtual Machine (KVM) in
most application domains, but not for those requiring a very small footprint and
limited computing resources. Compared to the K Virtual Machine, CLDC HotSpot
Implementation delivers nearly an order of magnitude better performance and very
fast application startup, while maintaining a moderate memory footprint.
Following are the main design features of CLDC HotSpot Implementation virtual
machine:
■
■
■
■
■
Still moderately sized in static memory footprint
Clean and portable
Tunable, modular, and customizable
Moderate battery consumption
As fast and scalable as possible without sacrificing the other design goals
CLDC HotSpot Implementation is written in the C++ programming language, so it
can be ported to various platforms for which a C++ compiler is available. The most
performance-critical parts are written in assembly language.
Following are the application domains for CLDC HotSpot Implementation:
■
■
■
■
Mobile business productivity applications
Games
Multimedia applications
System software written in the Java programming language
CLDC HotSpot Implementation is part of a larger effort to provide a modular,
scalable architecture for the development and deployment of portable, dynamically
downloadable and secure applications in consumer and embedded devices. This
larger effort is called the Java ME platform standard.
The CLDC HotSpot Implementation virtual machine is typically used as the
implementation-level foundation for the following Java ME technology standards:
Connected Limited Device Configuration (CLDC) and Mobile Information Device
Profile (MIDP). Further information on CLDC, MIDP, and the Java ME platform is
available in separate documents listed in the Preface under “Related
Documentation” on page xv.
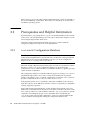
1.2
Information About This Release
The CLDC HotSpot Implementation 1.1.3 release provides equipment manufacturers
the opportunity to port it to their own target devices.
CLDC HotSpot Implementation is functionally complete and it passes all the
applicable TCKs and test suites.
1-2
CLDC HotSpot™ Implementation Porting Guide • July 2006
The CLDC HotSpot Implementation release targets two CPU architectures: x86 and
ARM. Both 32-bit and Thumb mode in the ARM architecture are supported.
For each CPU architecture, several target operating systems are supported by this
release:
■
■
■
■
■
x86 under the Linux OS
x86 under a win32 OS (Windows 2000)
ARM processor under MontaVista Linux
ARM processor building and compiling with ADS tools
ARM processor running Symbian OS
The x86-win32 and x86-Linux ports are provided to study the CLDC HotSpot
Implementation before porting to their actual target platform. These ports also add
convenience for building CLDC HotSpot Implementation on relatively resourcerestricted target platforms. For instance, it might be convenient to use an x86 host
system with cross-compilation to generate the interpreter and the ROM image for an
ARM target implementation.
CLDC HotSpot Implementation is portable to other CPUs and operating systems.
Information on starting customer-specific operating system and CPU ports is
provided in Chapter 3 and Chapter 5.
For the most up-to-date release information, refer to the release notes that
accompany this release.
Chapter 1
Introduction
1-3
1-4
CLDC HotSpot™ Implementation Porting Guide • July 2006
CHAPTER
2
Porting Overview
This chapter provides general information for starting a CLDC HotSpot
Implementation port. The difference between an operating system (OS) and CPU
port is explained and a high-level description of some general issues related to
porting is provided.
2.1
Difference Between an OS Port
and CPU Port
The majority of the source code in the CLDC HotSpot Implementation code base is
fully portable and independent of any specific target platform. However, as
explained in Chapter 3 of the CLDC HotSpot Implementation Build Guide, a number of
files in the CLDC HotSpot Implementation code base are tied closely with the
targeted operating system or CPU. These files typically need to be rewritten for each
port. Also, the CLDC HotSpot Implementation code base contains a significant
amount of CPU-specific assembly code that requires special porting efforts.
When starting a new porting effort, it is important to recognize the two kinds of
ports:
■
■
OS port - A port of the CLDC HotSpot Implementation system in which the
system is ported to a new operating system
CPU port - A port that targets a new CPU architecture
The magnitude of the porting effort depends considerably on the nature of the port.
An operating system port is fairly straightforward, as long as the porting efforts
focus only on the virtual machine itself and on the core CLDC libraries. The porting
of graphics libraries is significantly more time consuming, and is beyond the scope
of this document. In contrast, a CPU port of the CLDC HotSpot Implementation
requires a lot of time because the assembly interpreter and adaptive compiler are
closely dependent upon the target CPU architecture.
2-1
In this release, ports for the CLDC HotSpot Implementation system are included for
the x86 and ARM CPU architectures. The release also includes ports for the Linux
and Win32 operating systems.
2.2
Prerequisites and Helpful Information
A prerequisite for any porting effort is a good overall understanding of the structure
of the source code and the build process. This topic is discussed in Chapter 3 of the
CLDC HotSpot Implementation Build Guide.
The CLDC HotSpot Implementation build system uses a feature called the
configuration database to keep track of file dependencies.
2.2.1
includeDB Configuration Database
Note – To initiate any porting effort, you need to know how to add new files to the
CLDC HotSpot Implementation system and how to modify the existing include file
dependencies in the system. Understanding how the includeDB configuration
database works is very important for this reason.
The CLDC HotSpot Implementation build system is based on a modular file scheme
that uses a special includeDB configuration database to allow the proper
combination of source and header files to be linked in a build for a specific operating
system and CPU architecture.
This configuration database avoids the traditional approach of using #ifdef macros
sprinkled throughout the source code to selectively include blocks of platformspecific code and files. It also avoids the complications of nested #ifdef constructs,
in which conditional blocks of code can contain more #ifdefs.
Such platform-specific #ifdef statements reduce the readability of the code base,
make the code base more difficult to maintain, and are not generally recommended
software engineering practices.
In the CLDC HotSpot Implementation system, modular, fine-grained source and
header files are maintained, one file per class. The name of the file is the name of the
class, with a possible OS or CPU modifier, and with a cpp or hpp extension. All the
complexity of matching the proper source and header files is handled by the
includeDB system. The allowed combinations of files for particular build modes
can be examined and changed by editing the configuration database file
2-2
CLDC HotSpot™ Implementation Porting Guide • July 2006
src/vm/includeDB. This file shows the use of the macros arch and os_family in
constructing file names for a configuration. For example, consider the following lines
in includeDB:
Timer.hpp
Top.hpp
Timer.cpp
Timer.hpp
Timer.cpp
OS_os-family.hpp
This indicates that the timer interface (as defined in Timer.hpp) has no platformspecific dependencies, while the implementation (in Timer.cpp) relies on OSspecific code.
Note – Refer to the descriptions in Chapter 3 of the CLDC HotSpot Implementation
Build Guide for details about the purpose and function of individual files.
Thus, examining the includeDB file gives immediate clues as to which files
probably need attention for an OS port or CPU port.
In addition to helping control the relationships between the platform-independent
and platform-specific files in a more portable and manageable fashion, the
includeDB approach also provides for more efficient use of precompiled header
files, speeding up system builds considerably.
Chapter 2
Porting Overview
2-3
2-4
CLDC HotSpot™ Implementation Porting Guide • July 2006
CHAPTER
3
Starting an Operating System Port
This chapter describes the steps of undertaking an operating system port of the
CLDC HotSpot Implementation system. By default, CLDC HotSpot Implementation
is available only for a limited number of operating systems, as summarized in the
release notes. Porting the system to any other operating system requires additional
porting effort.
3.1
Overview
The CLDC HotSpot Implementation system is factored for operating system ports.
The majority of the code in the system is completely independent of operating
system issues and only a small number of files require special treatment during an
operating system port. Everything else works virtually out of the box.
3.1.1
Location of the Operating System
Porting Interface
The operating system porting interface is divided between the part that is common
regardless of target operating system (see /src/vm/share/runtime) and the part
that is specific to the target operating system. Your target operating system might be
different than ones directly implemented in this release. For an example of the part
of the operating system porting interface specific to one OS directly implemented in
this release, see /src/vm/os/linux.
Part of the operating system specific porting interface of the CLDC HotSpot
Implementation system is defined in the files /src/vm/share/runtime/OS.hpp
and OS.cpp. However, these two files only implement the class Os to provide
functions required exclusively by the virtual machine.
3-1
The rest of the operating system porting interface is factored so that separate files
exist for the file system, threading, event handling, and memory management. These
are the files with the porting interface for these kinds of functionality:
■
■
■
OsFile.hpp
OsMemory.hpp, .cpp
OsMisc.hpp
Note – These files have the extension .hpp and .cpp, but they are written using no
features of the C++ programming language, so they can be used with code written in
the C language.
3.1.2
Location of Operating System-Specific Code
The CLDC HotSpot Implementation workspace has a subdirectory /src/vm/os that
is intended to contain any operating system-specific code. Generally, when starting a
new operating system port, it is expected that you create a new subdirectory
/src/vm/os/os-family, where os-family reflects the name of the target operating
system. For example, if you are doing a Linux port, the name of the subdirectory is
/src/vm/os/linux.
3.1.2.1
Creating New Copies of the Operating System-Specific Files
When starting an operating system port, create new copies of the files that are
located in the /src/vm/os/win32 directory that is provided with the release. Place
the copies of these files in the new OS-specific subdirectory and name the files
appropriately using the name of the target operating system in the file names.
These are the files that typically need to be ported when doing an operating system
port:
■
■
■
■
■
JVM_os-family.hpp, .cpp
OS_os-family.hpp, .cpp
OsFile_os-family.hpp, .cpp
OsMemory_os-family.hpp, .cpp
OsMisc_os-family.hpp, .cpp
The expected content of these files is explained later.
3-2
CLDC HotSpot™ Implementation Porting Guide • July 2006
Note – The .hpp (header) files in the previous list are intended to include OS-specific
declarations related to the CLDC HotSpot Implementation and OS classes. Such
declarations are optional. However, these files must exist for the build process to
complete. If you don’t need to include CLDC HotSpot Implementation and OS class
declarations, you must create these files in the target os/ directory and leave them
empty.
When creating new copies of these files in the /src/vm/os/os-family directory, use
the name of the target operating system to name these files. For example, if you are
doing a Linux port, the names of these files are as follows:
■
■
■
■
3.1.2.2
JVM_linux.hpp
JVM_linux.cpp
OS_linux.hpp
OS_linux.cpp
Location of the Compiler-Specific Porting Interface
Generally, the compiler-specific porting interface of the CLDC HotSpot
Implementation system is defined in the file
/src/vm/share/utilities/GlobalDefinitions_compiler.hpp. For example,
the interface specific to the Embedded Visual C++ compiler is contained in the file
/src/vm/share/utilities/GlobalDefinitions_evc.hpp.
3.2
Functionality That Needs to be Ported
The majority of the work in operating system ports is related to getting the thread
system up and running on the target platform.
Lightweight threads, which were introduced in CLDC HotSpot Implementation
1.0.1, present much simpler porting challenges compared to native threads. For
specific porting information about lightweight threads, refer to Chapter 4.
Additionally, the CLDC HotSpot Implementation system has a small file interface
that enables the virtual machine to be coupled with the operating system-specific file
or storage system. For more details, see Section 3.3.1, “Porting the File System
Interface” on page 3-5.
Porting issues also exist with memory management, event handling, file system, and
other parts of the system, as detailed in the following sections.
Chapter 3
Starting an Operating System Port
3-3
3.3
Porting API Details
This section contains advice on coding specific aspects of an operating system port.
Most of the expected functionality in the porting interface is fairly obvious. If you
port to an operating system that is not directly supported, you will need to
implement these methods for your target environment.
3.3.0.1
Implement Initialization
initialize is used to initialize the OS structure. This is where timers and threads
get started for the first real_time_tick event and where signal handlers and other
I/O initialization occur.
dispose is used to undo all the work that initialize does. It cleans up threads
and other OS activities to allow for a clean system restart.
static void initialize();
static void dispose();
3.3.0.2
Real-Time-Tick Management
To support the real-time tick functionality required by the system, implement the
following interfaces:
static void start_ticks();
This interface enables periodic calls to the method real_time_tick. It is called at
virtual machine startup.
static void stop_ticks();
This interface is called at virtual machine shut-down. It permanently disables calls to
real_time_tick().
static void sleep(jlong ms);
This interface is called cause the current process to sleep for a specified number of
miliseconds..
3-4
CLDC HotSpot™ Implementation Porting Guide • July 2006
static void suspend_ticks();
This interface is called when the virtual machine is about to sleep (that is, when
there are no lightweight threads to execute). It temporarily turns off calls to
real_time_tick.
static void resume_ticks();
This interface reverses the effect of suspend_ticks. It is called when the virtual
machine wakes up and resumes executing LWTs.
3.3.0.3
Implement Handle to Terminal
get_tty() returns a handle to the terminal for this OS.
static class Stream * get_tty();
3.3.1
Porting the File System Interface
CLDC HotSpot Implementation uses a file I/O API similar to the FILE API in the
standard C (POSIX) library. If the target operating system does not support the
POSIX library, you need to map methods such as OsFile_read() to the
appropriate features in the target operating system. Please refer to
src/vm/share/runtime/OsFile.hpp for the declarations of the methods that
you need to implement to complete your port. For example, refer to the win32
implementation of the classes to see what the required behavior is (see
OsFile_win32.hpp).
3.3.1.1
File I/O Interfaces
If your target operating system does not directly support POSIX-style file I/O, you
must re-implement the following interface definitions. See the file
src/vm/share/runtime/OsFile.hpp:
int OsFile_remove(const JvmPathChar *filename);
bool OsFile_rename(const JvmPathChar *from, const JvmPathChar *to);
OsFile_Handle OsFile_open(const JvmPathChar *filename,
const char *mode);
int
OsFile_close(OsFile_Handle handle);
int
OsFile_flush(OsFile_Handle handle);
Chapter 3
Starting an Operating System Port
3-5
size_t
OsFile_read(OsFile_Handle handle,
void *buffer, size_t size, size_t count);
size_t
OsFile_write(OsFile_Handle handle,
const void *buffer, size_t size, size_t count);
3.3.2
long
OsFile_length(OsFile_Handle handle);
bool
OsFile_exists(const PathChar *filename);
long
OsFile_seek(OsFile_Handle handle, long offset, int origin);
int
OsFile_error(OsFile_Handle handle);
int
OsFile_eof(OsFile_Handle handle);
Memory Management Interfaces
to be Implemented
The following interfaces are defined in OsMemory.hpp.
address OsMemory_allocate_chunk(size_t initial_size,
size_t max_size, size_t alignment);
Allocate a memory chunk that can be shrunk, or expanded (up to max_size).
size_t OsMemory_adjust_chunk(address chunk_ptr, size_t new_size);
Expand or shrink a chunk returned by allocate_chunk().
Following are other memory management interfaces to be implemented:
void
void
void
OsMemory_free_chunk(address chunk_ptr);
*OsMemory_allocate(size_t size);
OsMemory_free(void *p);
size_t OsMemory_heap_initial_size(size_t min_size, size_t max_size);
size_t OsMemory_heap_expansion_target(size_t current_size,
size_t OsMemory_heap_reduction_target(size_t current_size,
size_t used_size,
size_t min_size);
3-6
CLDC HotSpot™ Implementation Porting Guide • July 2006
3.3.3
Miscellaneous Interfaces to be Implemented
The flush_icache interface is defined in OsMisc.hpp. This interface is used, for
example, to flush any caches used by a code segment that is deoptimized or moved
during a garbage collection.
void OsMisc_flush_icache(address start, int size);
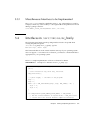
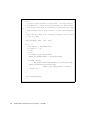
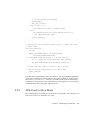
3.4
Interfaces in /src/vm/os/os_family
The following main function in the porting interface needs to be ported when
creating the platform-specific
/src/vm/os/os_family/Main_os_family.cpp file.
main(int argc, char** argv)
This function defines how the virtual machine starts up. If your operating system
does not support a conventional main function, you must use a mechanism that is
appropriate for your operating system.
.
Below is a sample implementation of the main function for Win32.
CODE EXAMPLE 3-1
Example main Function in Main_os_family.cpp
int main(int argc, char **argv) {
int n;
// Call this before any other Jvm_ functions.
JVM_Initialize();
// Ignore
argc --;
argv ++;
while ((n
argc -=
argv +=
}
arg[0] -- the name of the program.
= JVM_ParseOneArg(argc, argv, KNI_TRUE)) > 0) {
n;
n;
if (JVM_GetConfig(JVM_CONFIG_SLAVE_MODE) == KNI_FALSE) {
// Run the virtual machine in regular mode -- JVM_Start won't
// return until the virtual machine completes execution.
Chapter 3
Starting an Operating System Port
3-7
return JVM_Start(NULL, NULL, argc, argv);
} else {
// Run the virtual machine in slave mode -- we keep calling
// JVM_TimeSlice(), which executes bytecodes for a small amount
// and returns. This mode is necessary for platforms that need
to
// keep the main control loop outside of of the virtual machine.
//
// Note that this mode is not necessary on Win32. We do it here
// just as a demo.
JVM_Start(NULL, NULL, argc, argv);
for (;;) {
jlong timeout = JVM_TimeSlice();
if (timeout <= -2) {
break;
} else {
int number_of_blocked_threads;
JVMSPI_BlockedThreadInfo * blocked_threads;
blocked_threads =
SNI_GetBlockedThreads(&number_of_blocked_threads);
JVMSPI_CheckEvents(blocked_threads,
number_of_blocked_threads, timeout);
//printf("&");
}
}
return JVM_CleanUp();
}
}
3-8
CLDC HotSpot™ Implementation Porting Guide • July 2006
CHAPTER
4
Porting the Threading System
This chapter provides detailed advice on porting the threading system.
For a discussion of the architecture of the threading system, refer to the CLDC
HotSpot Implementation Architecture Guide.
A decision on coding style must be made: either code for non-blocking scheduling or
for hybrid threading. See the following sections for details.
4.1
Coding Styles for Long-Running Native
Methods
CLDC HotSpot Implementation offers two alternative coding styles for writing the
equivalent of a blocking native method:
■
Non-blocking scheduling - The native method de-schedules its lightweight
thread (LWT) until another part of the virtual machine determines that the native
method can be executed without blocking. Then the native method is reentered to
proceed with the given problematic call that is now guaranteed to be of
sufficiently short duration.
■
Hybrid threading - The native method de-schedules its LWT after delegating the
task to an OS thread to execute the given blocking call. When this OS thread,
which is truly concurrent to the rest of the virtual machine, completes the call, it
causes the LWT to resume. The LWT then reenters the native method to fetch the
results of the blocking call.
Note – Support for hybrid threading is implemented with the anilib library (see
src/anilib.) In CLDC HotSpot Implementation 1.1.3, this library is created when
you build for either the Linux or win32 target OS.
4-1
If you port to another platform, it might be the case that only one of the styles can be
implemented. Non-blocking scheduling depends on the existence of functions that
can determine whether a subsequent call would block. Take for example the
select() function for BSD sockets that can be used to determine whether a socket
is ready for a non-blocking data transmission call. Hybrid threading requires that
several OS threads are available and that all the blocking OS calls that you want to
employ are reentrant.
There is no targeted platform where neither of the required set of functionalities
exist.
If available, both styles can be used together in the same configuration and profile,
but not mixed within the same native method. Each style has a separate interface
that acts as an extension of KNI.
If for a given native method you happen to have a choice between the two styles,
non-blocking scheduling is usually preferable for these reasons:
■
■
■
You can allocate parameter space without fixed predetermined space limit.
You can avoid copying into and out of extra buffers by accessing the contents of
heap objects directly.
You can avoid memory fragmentation.
Hybrid threading has these advantages:
■
■
It presents less risk that the whole virtual machine block in the native method due
to a programming mistake by you or by the implementers of the blocking call.
If the operation in question might take a relatively long time in any event, then
the OS’s preemptive scheduling can be employed to prevent unwanted
application pauses. Thus, hybrid threading is an option for long-running routines
that do not actually block and that for some reason are not broken into parts (for
example, because you do not have source code access).
Both styles have a useful shortcut when there is a non-blocking variant of a blocking
operation. Call the non-blocking variant first, and in case it already achieves a final
result, immediately complete the native method.
In the non-blocking scheduling style, this approach can even be carried further so
that all operations in a given native method are non-blocking. The native method’s
rescheduling can occur multiple times to come to the final desired result. You can
even cascade intermediate results from several non-blocking calls. You can exploit
many more variations of this kind.
4-2
CLDC HotSpot™ Implementation Porting Guide • July 2006
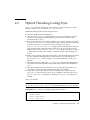
4.2
Non-Blocking Scheduling Coding Style
See sni.h for detailed descriptions of the functions in the Synchronous Native
Interface (SNI). sni.h is located in src/vm/share/natives.
Non-blocking scheduling requires the following measures:
■
■
■
■
All native methods return immediately.
If a native method cannot finish its operation (for example, no data are available
from a socket), it suspends the operation by calling SNI_BlockThread() and
returning immediately. In this case, the thread is placed on the blocked threads
list, and any return code from this method is ignored.
You must implement the function JVMSPI_CheckEvents(). This function is
called periodically by the virtual machine. It checks if any of the blocked threads
are ready for execution and it calls SNI_UnblockThread() on those threads that
are ready.
When a blocked thread becomes ready, the suspended native method is executed
again to finish its intended operation.
Here is an example:
CODE EXAMPLE 4-1
Coding with the Non-Blocking Scheduling Style
struct EventInfo {
/* Some information that we need pass from an aborted
* event reading operation to JVMSPI_CheckEvents() */
};
KNIEXPORT KNI_RETURNTYPE_INT
Java_com_sun_midp_lcdui_Events_readInt(void) {
if (events_are_ready()) {
KNI_ReturnInt(read_event());
} else {
EventInfo *myinfo = \
SNI_AllocateReentryData(sizeof(EventInfo));
init(myinfo);
SNI_BlockThread();
KNI_ReturnInt(0); /* return value ignored */
}
}
void JVMSPI_CheckEvents(JVMSPI_BlockedThreadInfo *
blocked_threads,
Chapter 4
Porting the Threading System
4-3
int num_threads, jlong timeout64) {
/* gather information about all the blocked threads
* from blocked_threads */
wait_for_event_or_timeout(timeout64);
if ((a blocked thread was trying to read events) &&
(events are ready)) {
int i = (index for the blocked event thread);
SNI_UnblockThread(blocked_threads[i].thread_id);
}
}
The signatures of the functions discussed above are:
jboolean SNI_BlockThread();
void SNI_UnblockThread(JVMSPI_ThreadID thread_id);
void JVMSPI_CheckEvents(JVMSPI_BlockedThreadInfo *
blocked_threads,
int n, jlong timeout);
void *SNI_AllocateReentryData(size_t reentry_data_size);
typedef struct {
JVMSPI_ThreadID thread_id;
void *reentry_data;
size_t reentry_data_size;
} JVMSPI_BlockedThreadInfo;
Usually you can have multiple threads that are blocked at the same time for different
reasons. For example, two threads are blocked on socket operations and another
thread is blocked on user input. You can use the SNI_AllocateReentryData()
function to store information about the resources for which a blocked thread is
waiting.
When JVMSPI_CheckEvents() is called, it can find the information saved by each
blocked thread in the blocked_threads array. JVMSPI_CheckEvents() tries to
do a concurrent wait on all the resources specified by the blocked threads. You can
achieve much better battery efficiency by avoiding polling.
4-4
CLDC HotSpot™ Implementation Porting Guide • July 2006
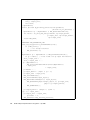
4.3
Hybrid Threading Coding Style
See ani.h for detailed descriptions of the functions in the Asynchronous Native
Interface (ANI). ani.h is located in src/anilib/share.
Hybrid threading requires the following measures:
■
■
■
■
■
■
■
All native methods return immediately.
Always call ANI_Start() at the beginning of your native method to acquire
resources for the Hybrid Threading style, in particular an OS thread and
parameter memory space.
Look up the shared, location-fixed parameter space for this operation by calling
ANI_GetParameterBlock(). If the return value is NULL, the native method is
in its first activation. You can then allocate parameter space using
ANI_AllocateParameterBlock() and populate the returned space with your
input parameter data. When the native method is in its second activation, the
return value of ANI_GetParameterBlock() is a pointer to the space allocated
as indicated previously and it is time to collect the results of the blocking call
from it.
Write a static C function that takes the pointer to the allocated shared parameter
space as argument and implements your blocking call. Pass this function to
ANI_UseFunction(). This sets up the associated OS thread to execute your
function.
Suspend the LWT by calling ANI_BlockThread() and returning immediately.
Any return code from this method is ignored and the LWT is de-scheduled for
now.
Once the OS thread executes the function you set up with the parameter you
allocated, it awakens the LWT, which reenters the native method.
At the end of your native function, before returning with a final result, call
ANI_End() to release these resources upon completion, and only then, in case
ANI_BlockThread() is called before reaching to ANI_End(), the latter does
nothing.
Here is an example:
Note – For now, please ignore the is_non_blocking parameter in
my_blocking_function(). See ani.h for a detailed discussion of each function.
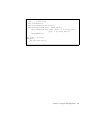
CODE EXAMPLE 4-2
Coding a Potentially Blocking Native Function
typedef struct {
Handle handle;
Input *input_buffer;
size_t input_size;
Chapter 4
Porting the Threading System
4-5
Output *output_buffer;
size_t output_size;
int result;
} MyParameter;
static jboolean my_blocking_function(void *parameter,
jboolean is_non_blocking) {
MyParameter *p = (MyParameter *) ANI_GetParameterBlock();
int result = do_this_and_that(p->handle, &p->input_buffer,
p->input_size, &p->output_buffer,
&p->output_size)
return KNI_TRUE;
}
KNIEXPORT KNI_RETURNTYPE_INT
Java_com_sun_myProfile_doThisAndThat(void) {
if (!ANI_Start()) {
... // not enough resources
KNI_ReturnInt(-1);
}
MyParameter *p = (MyParameter *) ANI_GetParameterBlock();
if (p == NULL) { // first round: set up input and function
size_t input_size = ...
size_t output_size = ...
p = (MyParameter *)
ANI_AllocateParameterBlock(sizeof(MyParameter)
+ input_size
+ output_size);
p->handle = ...
p->input_buffer = (Input *) (p + 1);
p->input_size = input_size;
KNI_StartHandles(1);
KNI_DeclareHandle(input_object);
KNI_GetParameterAsObject(1, input_object);
KNI_GetRawArrayRegion(input_object, 0, p->input_size,
(jbyte *) p->input_buffer);
KNI_EndHandles();
p->output_buffer = (Output *) ((char *)
(p + 1) + input_size);
p->output_size = output_size;
p->result = -1;
ANI_UseFunction(my_blocking_function);
4-6
CLDC HotSpot™ Implementation Porting Guide • July 2006
ANI_BlockThread();
} else { // second round
KNI_StartHandles(1);
KNI_DeclareHandle(output_object);
KNI_GetParameterAsObject(2, output_object);
KNI_SetRawArrayRegion(output_object, 0, p->output_size,
(jbyte *) p->output_buffer);
KNI_EndHandles();
}
int result = p->result;
ANI_End();
KNI_ReturnInt(result);
}
Chapter 4
Porting the Threading System
4-7
4-8
CLDC HotSpot™ Implementation Porting Guide • July 2006
CHAPTER
5
Starting a CPU Port
A CPU port refers to porting the CLDC HotSpot Implementation to a CPU other
than the x86 or ARM processors that are currently supported by this release.
A CPU port is significantly more challenging than an OS port. Expect a robust CPU
port takes several person-months to complete.
These are the general steps in undertaking a CPU port:
1. Port the interpreter and interpreter generator.
2. Port the adaptive compiler.
Plenty of time needs to be reserved for tuning and optimizing the compiler.
As part of a CPU port, you often have to do an OS port as well. To complete an OS
port, follow the instructions in Chapter 3.
5-1
5-2
CLDC HotSpot™ Implementation Porting Guide • July 2006
CHAPTER
6
Tuning a Port
This chapter describes the strategy and tactics of tuning a port of CLDC HotSpot
Implementation for performance and efficiency on your target platform. CLDC
HotSpot Implementation has numerous tunable parameters, all controllable with
compilation or build flags.
6.1
Tuning Parameters
Here are some areas to consider:
■
Number of wait states for memory access
■
Amount of memory available
■
Suggested values per processor classes (for example, suggested values for the
ARM7 processor versus ARM9.)
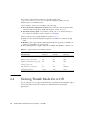
See TABLE 6-1 for typical values for tunable parameters.
Note – Prior to the advent of the segregated heap architecture, the tuning of these
parameters was mandatory to avoid noticeable execution pauses. Now, tuning is
useful to achieve optimal performance, but execution pauses are generally no longer
a problem.
6.1.1
Notes About Parameters
Compilation frequency is controlled by the interval of timer ticks and the run time
flag CompilationAbstinenceTicks. These parameters are typically controlled in
src/vm/os/os-family/OS_port.cpp. See OS_linux.cpp for an example.
6-1
For example, if the timer tick interval is 10 milliseconds, and
CompilationAbstinenceTicks is 3, then the compilation interval is (10
milliseconds * 4) = 40 milliseconds.
Choose ENABLE_THUMB_VM according to the following:
■
■
The code density requirement of the device - If smaller static footprint of the
virtual machine is important, build with ENABLE_THUMB_VM=true.
The main memory speed - Use ENABLE_THUMB_VM=true if main memory is
slow and your instruction cache is small or non-existent.
These are the processor speed definitions used in TABLE 6-1.
■
Slow - Devices under 50 megahertz, typically an ARM7 core without on-chip
cache
■
Medium - 50 to approximately 200 megahertz devices, typically an ARM9 core
with 16 to 32 kilobytes of on-chip cache.
Fast - 200 megahertz or higher, typically an ARM9, StrongARM, or XScale core.
■
TABLE 6-1
6.2
Typical Values for Tunable Parameters
Build Time Flags
Slow
Processor
Medium
Processor
Fast
Processor
ENABLE_THUMB_VM
YES
maybe**
maybe**
ENABLE_CODE_OPTIMIZER
NO
NO
YES
ENABLE_INTERPRETATION_LOG
NO
YES
YES
INTERP_LOG_SIZE
0
5
17
MAX_METHOD_TO_COMPILE
500
2000
unlimited
compilation interval*
>30ms
10ms
10ms
Turning Thumb Mode On or Off
If your target processor supports thumb mode, experiment with setting this flag on
and off and run performance comparisons with benchmarks and typical
applications.
6-2
CLDC HotSpot™ Implementation Porting Guide • July 2006
6.3
Choose which Methods to
Compile AOT
There is a trade-off when using the AOT feature (described in the CLDC HotSpot
Implementation Architecture Guide.) Only Java methods in ROMized system classes
can be AOT compiled. Every method compiled ahead-of-time results in increased
memory usage. Thus, use care in choosing appropriate candidates. A useful
technique is to run the Java profiler included in this release, and observe which
methods are hotspots and thus are candidates to be AOT compiled.
For more information about the Java profiler, see Appendix 7.
6.4
Tuning the Compiler
The following table shows the set of flags to manipulate as a group when tuning the
compiler for optimal performance or footprint.
Note – These flags are available in the product build only if
ENABLE_PERFORMANCE_COUNTERS=true.
TABLE 6-2
Compiler Tuning Options
Option
Description
Default
UseCompiler
Should the compiler be used?
(false means interpreted
mode.)
true
MaxCompilationTime
Suspend compilation if a
method takes more than this
time to compile (in
milliseconds.)
MaxCompilationTime can be
checked by re-implementing
Os::check_compiler_timer
in OS_operatingsystem.cpp.
30
MaxMethodToCompile
Don’t compile method with
more than this number of
bytecodes (in bytes)
6000
Product Mode Options
Chapter 6
Tuning a Port
6-3
TABLE 6-2
Compiler Tuning Options
Option
Description
Default
InterpretationLogSize
How many elements of
interpretation_log to
examine during timer tick. Set to
0 to disable interpretation log.
INTERP_LOG_SIZE
OptimizeLoops
Make the compiler optimize
loop code (enables loop peeling).
true
LoopPeelingSizeLimit
Do not peel the loop if generated
code for first run exceeds this
limit (in bytes).
100
OptimizeForwardBranches
Optimize simple forward
branches.
USE_OPT_FORWARD_BRANCH
Conditional Mode Options*
* Refer to Section 4.2, “Build Modes” in the CLDC HotSpot Implementation Build Guide.)
6.5
Tuning the Memory Subsystem
The following table shows the set of flags to manipulate as a group when tuning
memory heap usage for optimal performance or footprint.
TABLE 6-3
Memory Subsystem Tuning Options
Option
Description
Default
HeapCapacity
Capacity of object heap in bytes.
1*M
HeapMin
Initial object heap capacity in bytes. 0
indicates that HeapCapacity will be
used.
0
RecommendedFreeHeapPercentage
Recommended percentage of heap to
keep free
10
CompilerAreaPercentage
Maximum percentage of heap to use
by JIT compiler.
20
MinimumCompilerAreaPercentage
Minimum percentage of heap to use
by JIT compiler.
0
Product Mode options
6-4
CLDC HotSpot™ Implementation Porting Guide • July 2006
CHAPTER
7
Using Java Profilers
This chapter describes how to use Java code profilers with CLDC HotSpot
Implementation to identify bottlenecks in Java applications. It also explains some
profiler porting issues.
7.1
Concepts
CLDC HotSpot Implementation supports two ways of Java profiling: lightweight
sampling profiler and exact call graph profiler. Depending on your needs you can
select one or use both.
7.1.1
Sampling Profiler
Some form of sampling profiler is used internally by CLDC HotSpot Implementation
to detect hot spots in Java code and compile methods containing them. It works by
determining which Java method is currently being executed at the moment of a
timer tick. A dynamic compiler could also use a log of recently executed methods. To
run the CLDC HotSpot Implementation virtual machine using the sampling profiler,
specify the -profile command line switch. At the end of execution, the virtual
machine prints statistical profiler information to the file flat.prf. In multitasking
mode, the profiler output contains information for all isolates, each separated by a
dashed line, where the percentage is counted in relation to this isolate only.
The sampling profiler has these advantages:
■
■
Minimal profiler impact (total program execution time is almost the same)
Verbose per-method information about dynamic compilation statistics
The sampling profiler has these disadvantages:
■
Very basic profiler data
7-1
■
7.1.2
Granularity is bound to timer tick frequency (10 to 100 ms)
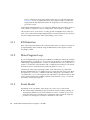
Exact Call Graph Profiler
CLDC HotSpot Implementation also supports an exact profiler with a call graph. This
gives you precise information about the way your Java program is executed and also
precise timings of method execution. The exact profiler handles multiple threads,
recursion, and native methods. To use it you need to rebuild CLDC HotSpot
Implementation with ENABLE_WTK_PROFILER=true and run the virtual machine
with the +UseExactProfiler switch. (WTK refers to the Sun Java Wireless Toolkit,
which uses a profiler similar to that of KVM) Profiling results are dumped into the
file graph.prf and can later be analyzed with the Java Wireless Toolkit or
ProfView tools.
The exact profiler has these advantages:
■
Complete call graph profile
■
Very exact timings, given high resolution timer support on the platform
(provided, for example, with the RDTSC instruction on x86 architecture, or with
ARM’s 14th coprocessor read instruction)
■
A powerful analyzer tool for profiling results
The exact profiler has these disadvantages:
7.2
■
Heavyweight, meaning execution times can dramatically increase even though
profiler activity is discounted from results
■
Virtual machine recompilation requirement (most profilers offer separate binaries
for profiling)
Viewing Exact Profiler Results
This section provides instructions on how to use the Sun Java Wireless Toolkit to
view the exact profiler results.
1. Download and install the Sun Java Wireless Toolkit.
It is available from
http://java.sun.com/products/sjwtoolkit/index.html.
2. Locate your installation of the Wireless Toolkit and run the its Utility program.
3. In the Profiler section of the Utility program, select Open Session.
Find the graph.prf file created by your run of CLDC HotSpot Implementation.
7-2
CLDC HotSpot™ Implementation Porting Guide • July 2006
4. Select Open to view your profile.
7.3
Analyzing Exact Profiler Logs
A Swing Java application (the ProfView Tool) is available for profiler log analysis.
Sources are in the src/tools/profview directory. Run gnumake inside this
directory and to create ProfView.jar.
Use the following command (with graph.prf from virtual machine run with
+UseExactProfiler):
java -jar Profview.jar graph.prf
A call graph of your application appears and you can see both how much of absolute
time, or high-resolution timer ticks, or percentage of execution time is spent in each
method and in the calling method. <RECURSIVE> appears after the method names of
recursive methods, which means all recursive calls are counted in the same node.
You can also order the output by column by clicking on the column name.
Keep the following points in mind:
■
If you run a ROMized virtual machine (this is usually the case), note that some
system methods’ names are called <unknown> or they belong to an unknown
class. The reason is that the ROMizer is renaming methods that could not be
accessed by name to save space. To solve this, you have three options:
■
Change the ROMizer flags.
■
Run a non-ROMized virtual machine by using the -UseROM command line
switch.
■
Let the names remain unknown. Most frequently, developers profile their own
code, which gets loaded in the normal way and is not affected by ROMizer
optimizations.
■
Due to CLDC HotSpot Implementation optimizations, it's not possible to show
class names for <clinit> static class initializers, but usually it is obvious from
the context whose <clinit> was called.
■
For some root methods (most noticeably internalExit and main), invocation
count is 0 but 1 is correct.
Chapter 7
Using Java Profilers
7-3
7.4
Profiler Porting Requirements
Porting of the profiler to a new platform or CPU is not too complicated. Pay special
attention to the following points.
■
High-resolution timer - Because no standard method exists for accessing the
high-resolution timer, almost every platform uses its own way. Best practice is to
use an ASM instruction that returns a clock count like RDTSC on x86. Check if
your platform has one, and if not, you are limited to the call graph without
precise timings.
■
Method and threads transition recording - Thread and exception transition
recording is implemented in shared code, so this is not a concern. To see how
method transition is logged, look at the ARM or x86 implementation and search
for ENABLE_WTK_PROFILER. In brief, you need to call
jprof_record_method_transition right after method transition occurs so
that the profiler analyzes stack and record timings properly.
The profiler has some consistency checks and several unit tests were written for the
profiler, so to test your implementation you can use (after make tests)
profiler.ProfilerTest1, profiler.ProfilerTest2, and
profiler.ProfilerTest3, which cover several corner cases in the profiler. You
have to manually check graph.prf with ProfView and see whether the profile is
meaningful. Some hints what to expect are given by tests. Also look at test sources.
7-4
CLDC HotSpot™ Implementation Porting Guide • July 2006
CHAPTER
8
Using the Memory Profiler
The memory profiler of CLDC HotSpot Implementation is a tool for getting detailed
information about the Java heap contents during virtual machine execution. It
enables you to find memory leaks and optimize memory usage.
8.1
Feature List
The memory profiler provides the following features:
■
Provides an overview of heap, old generation, new generation, and unused heap
space sizes and layouts.
■
Enables you to view the following items:
■
■
■
■
■
■
8.2
Loaded classes.
Locations of all objects of a given class (including array classes)
A path from a root to a given object (to help detect memory leaks)
Heap usage statistics (percentage of heap used by objects of a given class)
Heap utilization (percentage of live objects in a given heap block)
Provides the ability to pause and resume the virtual machine.
Design
The design of the memory profiler support is the same as the design of the Java
debugger support provided in CLDC HotSpot Implementation. Moreover, these two
tools use the same transport layer, so the memory profiler and the Java debugger
cannot be used at the same time.
8-1
The memory profiler allows you to take a snapshot of the heap at any point during
virtual machine execution. The virtual machine is suspended while the profiler
collects the snapshot information.
The implementation of the memory profiler consists of the following items.
■
■
The code in the virtual machine to provide data about the heap
The proxy that transmits information to the client
Memory profiler support in CLDC HotSpot Implementation provides pertinent
information about object addresses, classes, sizes, and references. The proxy
propagates this information to an arbitrary client. For example, the client could be
implemented with a Java Swing user interface, presenting gathered data to the user.
The client could also perform analysis of the data, such as looking for live objects,
calculating statistics, and so on. Thus, the memory profiler support in this release
allows writing plugins for existing IDEs, which makes it possible to use the Java
debugger and the memory profiler interactively.
The memory profiler support contains functions for the following actions:
■
■
■
■
8.3
get
get
get
get
global pointers (bounds of heap, old generation, used heap)
data for all objects (classes, sizes, addresses, references)
addresses of all roots
names of all classes
Building with Memory Profiler Support
To build CLDC HotSpot Implementation binary with memory profiler support, set
the following options to true:
ENABLE_MEMORY_PROFILER
ENABLE_JAVA_DEBUGGER
ENABLE_ROM_JAVA_DEBUGGER
Then execute this command:
make clean cldc-hi build
8-2
CLDC HotSpot™ Implementation Porting Guide • July 2006
8.4
Starting the Server
1. Start the virtual machine.
Use the following command:
cldc_hi -memory_profiler -port port-number class
The flag -memory_profiler is used to enable memory profiler support. The
virtual machine would be suspended awaiting connection from a client. port-number
is the port on which the virtual machine awaits connection from a client.
2. Start the debug agent
Use the following command:
java -classpath path kdp.KVMDebugProxy -l localport -p -r
host port
path indicates the directory that contains the Java virtual machine library classes and
the application classes for the application being debugged.
localport is the port to which a client will connect, -p indicates to run as a debug
proxy, host is the host where the CLDC HotSpot Implementation binary runs, and
port is the port on which the binary awaits connection.
Now you can connect to the CLDC HotSpot Implementation binary. The next section
describes the process of using the standard Client tool.
8.5
Using the Client Tool
Use following command to run the Client tool:
java view.Client -host hostname -port portname
hostname and portname match the parameters of the running debug agent. The
default values for these parameters are localhost and 5000.
The main screen contains the following elements:
Chapter 8
Using the Memory Profiler
8-3
■
A memory panel. It displays the heap, the bounds of the old generation, the used
heap, and so forth. This panel displays heap utilization (that is, the percentage of
space used by live objects in the heap block) and displays the locations of objects.
Clicking on a block shows all the objects contained in that block.
■
A list of all loaded classes. It is located in the lower-left corner. Choosing a single
class here shows the location of all objects of that class in two places: in the
memory panel and in the panel to the right of the list (see the next item).
A panel for working with the objects of a single class. Located in the main
screen, it contains a list with the addresses of the objects of the selected class. Any
single object, when selected, is shown in detail. Displayed are the address of the
object, its type, all objects which have references to it, and all objects to which this
object refers. Also, if this is a live object, the Show Path from the Root button is
■
8-4
CLDC HotSpot™ Implementation Porting Guide • July 2006
enabled. Clicking this button opens the “Show path from the root” dialog, shown
in the next figure. This dialog shows what dependencies prevent this object from
being garbage collected (as described further in the next item).
Chapter 8
Using the Memory Profiler
8-5
■
The ability to show the path from the root. Any single object, when selected (and
when still a live object) shows the dialog “Show Path from the Root.” The dialog
displays the path to the object from its root. It has a interface similar to the panel
in the previous item. The list contains all objects that exist on the path. The
topmost object is the root object.
■
The ability to observe objects in a single block. Clicking on a block on the
memory panel opens the dialog similar to the one from the previous item, but
which contains all objects from the block.
The ability to control virtual machine execution. The lower-right corner of the
main screen has a “Pause/Resume” button.
The ability to monitor statistics. The Statistics button on the main screen opens
the Statistics dialog. This dialog contains a table that shows the following
information for each class (including objects internal to the virtual machine):
■
■
■
■
■
■
■
8-6
Number of objects in heap
Size of all objects in heap
Average size of object
Percentage of heap used by objects of the class
Percentage of objects still live in a given class
CLDC HotSpot™ Implementation Porting Guide • July 2006
■
Percentage of objects in a given class that are in the old generation
Chapter 8
Using the Memory Profiler
8-7
8-8
CLDC HotSpot™ Implementation Porting Guide • July 2006
CHAPTER
9
Implementing Java ME Profiles
Apart from the fundamental porting exercise in which the porting engineer must
implement the CLDC HotSpot Implementation virtual machine on a target platform,
other engineers might need implement a profile of Java ME platform (such as MIDP)
on top of the virtual machine. This release provides APIs to assist in implementing
profiles.
This chapter describes how to implement a Java ME profile on top of the CLDC
HotSpot Implementation virtual machine. It cover the following topics:
9.1
■
The build process that incorporates the CLDC HotSpot Implementation virtual
machine into your software.
■
The API that provides interaction between the virtual machine and your software.
■
The API for you to implement long running native methods.
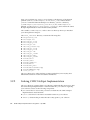
Overview
With the build system in place since CLDC HotSpot Implementation 1.0.1, CLDC
HotSpot Implementation 1.1.3 is built as a library. This makes it easier for higher
levels of the Java stack, such as the MIDP profile, to control the virtual machine.
Although different APIs are offered for target devices with different requirements,
the most straightforward implementation is for the MIDP level to implement the
main program loop, calling the virtual machine through the API provided, and
having the virtual machine able to call back into the main loop.
At the highest level, the porting and profile implementation engineers must evaluate
the target platform and make two sets of choices:
■
Can they control the main loop or does the target OS control the loop?
This is of interest to the profile implementation engineer.
■
Which of the native method coding styles should engineers adapt?
9-1
This is of interest to the porting engineer. This choice is explored in detail in
Chapter 4. As part of making this choice, the engineer needs to examine the
target platform and determine whether he target OS has one central place to
get all user events.
CLDC HotSpot Implementation 1.1.3 offers two different APIs and coding styles for
each of these two questions. Various combinations of these APIs are possible.
This chapter focuses on the means of coding profiles and higher levels of the Java
stack on top of the CLDC HotSpot Implementation virtual machine. It also discusses
the relationship between these APIs and handling of user events.
9.1.1
KNI Interface
Most of the interaction between the virtual machine and your software can be done
by implementing native methods using the KNI interface. This chapter assumes
knowledge of KNI.
9.1.2
Main Program Loop
If you are implementing a profile such as MIDP in combination with CLDC HotSpot
Implementation 1.1.3, ideally you are in control of the main loop at the MIDP level.
CLDC HotSpot Implementation 1.1.3 offers an API (declared in jvm.h)that allows a
profile to call into the virtual machine and a related SPI has facilities for the virtual
machine in turn to call back into the profile (declared in jvmspi.h).
Alternatively, other target operating systems control the main loop, and CLDC
HotSpot Implementation 1.1.3 and the whole Java stack must run in slave mode. Here,
the target OS is event driven. A different API and coding style is provided for this
case (declared in jvm.h). The target OS must call functions provided in special APIs
in the virtual machine and in MIDP. Callbacks (as declared in jvmspi.h) must be
provided as well by the target OS.
9.1.3
Event Model
Depending on the capabilities of the target OS, you have two event models:
■
9-2
The non-blocking scheduling model, in which the virtual machine, running on a
single primordial thread, can check whether an event is available. If not, it can
sleep until it becomes available. This is preferable, and is used if the target OS
provides one central place to listen for all kinds of user events.
CLDC HotSpot™ Implementation Porting Guide • July 2006
■
9.1.4
The hybrid threading model, which makes use of multiple asynchronous native
threads to access events. A separate native thread must be created to watch for
each different kind of user event. This model must be used if the target OS does
not provide one central place to listen for events.
Combining Different Models
Each native method that you port requires that you choose a particular model for
handling a potentially blocking function. However, your overall port can use
different models for different functions if this seems appropriate.
It is most likely that the target OS can both allow your process to control the main
loop and can permit the Non-Blocking Scheduling model. This is the case in the
majority of target devices being contemplated.
Among other possible combinations is a target OS that won’t allow your process to
control the main loop and forces you to use a separate native thread to watch for
each different kind of user event.
9.2
Build process
To build your Java ME software profiles on top of the CLDC HotSpot
Implementation virtual machine, we recommend a two-step build process:
1. Build the CLDC HotSpot Implementation virtual machine by itself into a binary
bundle.
2. Link the CLDC HotSpot Implementation virtual machine binary bundle into your
software.
This two-step process has been implemented on the standard platforms of the CLDC
HotSpot Implementation virtual machine: Linux/i386, Linux/ARM, Win32, and
WinCE. If you are porting the CLDC HotSpot Implementation virtual machine to a
new platform, you should consider designing a similar build process.
9.2.1
Building the Virtual Machine Binary Bundle
You can build the CLDC HotSpot Implementation virtual machine binary bundle
from the CLDC HotSpot Implementation source distribution. For more information,
see the CLDC HotSpot Implementation Build Guide.
Chapter 9
Implementing Java ME Profiles
9-3
Once your workstation is set up, you can change to the directory of the desired
platform (such as ${JVMWorkSpace}/build/win32_i386) and execute the
gnumake command. When the build process finishes, you have a directory
${JVMWorkSpace}/build/win32_i386/dist (or, if ${JVMWorkSpace} is
defined, ${JVMWorkSpace}/build/win32_i386/dist), that contains the CLDC
HotSpot Implementation virtual machine binary bundle.
The variable ${JVMWorkSpace} refers to the root directory where you installed
your development workspace.
The win32_i386/dist directory contains the following files:
■
■
■
■
■
■
■
■
■
■
■
■
■
■
■
■
■
■
■
■
bin/preverify.exe
bin/romgen.exe
bin/cldc_hi_g.exe
bin/cldc_hi_r.exe
bin/cldc_hi.exe
lib/cldc_classes.zip
lib/cldc_hi_g.lib
lib/cldc_hi_r.lib
lib/cldc_hi.lib
lib/cldc_hi_r.make
lib/cldc_hi.make
lib/cldc_hi_g.make
include/ani.h
include/jvm.h
include/jvmspi.h
include/kni.h
include/kni_md.h
include/NativesTable.hpp
include/ROMImage.hpp
tools/jcc.jar
The dist directory for other platforms contains similar files, however, they have
different file extensions for the executables and libraries.
9.2.2
Linking CLDC HotSpot Implementation
The dist directory contains all the tools, libraries, and header files necessary to link
the CLDC HotSpot Implementation virtual machine into your software. Typically,
your software consists of the following components:
9-4
■
Java source files for classes that you wish to include into the CLDC HotSpot
Implementation virtual machine
■
C/C++ source files for the native executable routines in your software
■
A main() function that provides the native entry point to your software
CLDC HotSpot™ Implementation Porting Guide • July 2006
■
Other native libraries upon which your software depends
Your build process involves the following steps:
1. Compile and preverify your Java source files into .class files.
2. Merge your .class files with lib/cldc_classes.zip into a combined
classes.zip file.
3. Use bin/romgen.exe to produce a ROMImage.cpp file for your classes.zip
file.
Note that in case of a Product build, you need to specify -DPRODUCT when compiling
this file.
4. Use tools/jcc.jar to produce a NativesTable.cpp file for your classes.zip
file.
5. Compile all of your source files and link your program with lib/cldc_hi.lib,
as well as other native libraries that your program needs.
9.3
API for Interacting with the Virtual
Machine
All the header files that you normally need for interacting with the virtual machine
are located in the dist directory, as follows:
■
■
■
■
■
■
■
■
include/jvm.h
include/jvmspi.h
include/kni.h
include/kni_md.h
include/ani.h
include/sni.h
include/NativesTable.hpp
include/ROMImage.hpp
Most of the API functions described in this chapter are declared in jvm.h,
jvmspi.h, ani.h, and sni.h.
9.3.1
Internal Header Files
Although the CLDC HotSpot Implementation sources contain a large number of C++
header files, they are considered part of the virtual machine internals. Do no use
them directly in your source code.
Chapter 9
Implementing Java ME Profiles
9-5
9.4
Invoking the Virtual Machine
The names of all the functions exported by the virtual machine begin with JVM_.
You can call these functions to initialize, configure, start, and stop the virtual
machine.
The virtual machine is capable of being launched and stopped multiple times. The
outer loop of your software might look like this:
JVM_Initialize();
JVM_SetConfig(...);
JVM_SetConfig(...);
loop {
JVM_Start(...);
}
Note – This pseudo code fragment assumes that you control the main loop of your
application. If that is not the case, see Section 9.5, “Slave Mode” on page 9-8.
All the JVM_ functions are declared to be extern “C” so that they can be called
easily by C code. However, because the CLDC HotSpot Implementation virtual
machine is written in the C++ programming language, your main() function must
be written in C++ code. This ensures that all the C++ classes in the virtual machine
are initialized properly.
9.4.1
Initializing the Virtual Machine
Before calling any other JVM_ API functions, you must call this function first:
void JVM_Initialize();
Call JVM_Initialize() exactly once during the lifetime of your software
application.
9.4.2
Configuring the Virtual Machine
The following functions can be used to query and configure the runtime behavior of
the virtual machine:
■
■
9-6
int JVM_GetConfig(int name);
void JVM_SetConfig(int name, int value);
CLDC HotSpot™ Implementation Porting Guide • July 2006
The name parameter can be one of the following:
■
■
■
■
■
JVM_CONFIG_USE_NATIVE_THREADS
JVM_CONFIG_HEAP_CAPACITY
JVM_CONFIG_HEAP_MINIMIN
JVM_CONFIG_SLAVE_MODE
JVM_CONFIG_USE_ROM
See jvm.h for full documentation of the configuration parameter names and
possible values.
9.4.3
Command-Line Argument Parsing
On a real device, command-line arguments are rarely used. Hence, the
JVM_Start() API provides no option for passing virtual machine command-line
arguments (such as =HeapCapacity4M, -classpath, and so forth) Also, most
virtual machine runtime configuration can be done using the JVM_SetConfig()
API.
However, in an emulation environment, a developer might want to pass virtual
machine arguments in the command line for convenience reasons. For this, you can
use the following API:
int JVM_ParseOneArg(int argc, char *argv[]);
9.4.4
Starting and Stopping the Virtual Machine
Two API functions start and stop the virtual machine:
■
int JVM_Start(char *classpath, char *main_class, int argc,
char *argv[]);
■
void JVM_Stop(int exit_code);
These are the parameters for JVM_Start():
■
classpath - Defines the location of the application classes.
■
main_class - The name of the main class. When the virtual machine starts, it
executes the method main_class.main().
■
argc, argv[] - Arguments to be passed to main_class.main().
When JVM_Start() is called, it executes until one of the following conditions is
true:
■
No more Java code remains to execute.
main_class.main() returned and no more threads exist. In this case,
JVM_Start() returns with the value 0.
Chapter 9
Implementing Java ME Profiles
9-7
■
9.5
JVM_Stop() is called. JVM_Start() returns with the value of the exit_code
parameter.
Slave Mode
The APIs described in Section 9.4, “Invoking the Virtual Machine” on page 9-6 and
Section 4.1, “Coding Styles for Long-Running Native Methods” on page 4-1 assume
that your platform allows your software to control its main loop. This means your
software can call JVM_Start(), which won’t return until the Java application is
finished. All event processing is handled inside the main scheduler loop of the
CLDC HotSpot Implementation virtual machine.
Some platforms do not allow this type of execution. This is true for some GUI
toolkits. For example, the non-reentrant Qt GUI toolkit requires that it must control
the main loop of an application. These platforms usually require that all function
calls be completed within in a short amount of time or else the entire GUI toolkit
stops responding.
The CLDC HotSpot Implementation virtual machine provides specific support for
these kinds of platforms: you can configure the CLDC HotSpot Implementation
virtual machine to execute in slave mode. In this mode, the virtual machine executes
in small steps so that it can co-exist with the underlying GUI toolkit. New APIs
enable the GUI toolkit and the virtual machine to interact with each other in a
battery-efficient manner.
9.5.1
Slave Mode Application Structure
An application that uses the CLDC HotSpot Implementation virtual machine in slave
mode is typically structured like the following pseudo code:
void init() {
JVM_SetConfig(JVM_CONFIG_SLAVE_MODE, KNI_TRUE)
JVM_Start(classpath, main_class, argc, argv);
create_timer(0); // schedule a timer to expire ASAP
exec_gui_toolkit_main_loop();
}
// This function is called by the GUI toolkit to handle a timer event
timer_event_handler() {
jlong ms = JVM_TimeSlice();
if (ms == -2) {
9-8
CLDC HotSpot™ Implementation Porting Guide • July 2006
// virtual machine has finished.
JVM_CleanUp();
exit_gui_toolkit();
} else if (ms == -1) {
// All LWTs are blocked or waiting forever
} else {
// ms indicates when the virtual machine wants us to
// call JVM_TimeSlice() again
create_timer(ms);
}
}
// This function is called by the GUI toolkit to handle some user
// input events
user_event_handler() {
int num;
JVMSPI_BlockedThreadInfo * blocked_threads
= SNI_GetBlockedThreads(&num);
if ((a blocked thread was trying to read user events)) {
int i = (index for the blocked user event thread);
SNI_UnblockThread(blocked_threads[i].thread_id);
}
// We have some LWT ready for execution. The following
// call would cause JVM_TimeSlice to be called ASAP.
create_timer(0);
}
Note that the event handling code is very similar to the regular lightweight thread
model. The only difference in Slave Mode is the virtual machine no longer actively
calls JVMSPI_CheckEvents(). Instead, you handle events using the mechanism
provided by your particular GUI toolkit. When an event happens, you search the list
of blocked LWTs and wake up the appropriate one.
9.5.2
APIs Used in Slave Mode
The following APIs are used in slave mode (refer to the pseudo code in the previous
section for scenarios in which they are used):
Chapter 9
Implementing Java ME Profiles
9-9
■
int JVM_Start(char *classpath, char *main_class, int argc,
char *argv[]);
In slave mode, JVM_Start() initializes the internal structure of the virtual
machine according to the parameters (such as loading the main_class).
The return code might be 0, which indicates that the virtual machine was
initialized successfully, or non-zero, which indicates failure. In case of failure, call
JVM_CleanUp() immediately to clean up the virtual machine.
■
jlong JVM_TimeSlice(void);
This function executes Java code for a short period of time (typically in the range
of 10 to 100 milliseconds) and then returns control to the caller. The return code
indicates when, if ever, JVM_TimeSlice() needs to be called again. The return
code can be one of the following values:
■
■
-2 - Java execution is complete. Either all threads exited, or JVM_Stop() was
called by a native method.
■
-1 - All LWTs are waiting forever (for events or for locks from the Java runtime
environment).
■
0 or above - Some LWTs are ready for execution after the specified time has
elapsed.
JVMSPI_BlockedThreadInfo * SNI_GetBlockedThreads(int
*num_blocked_threads);
This function returns a list of all the threads that are blocked using a call to
JVM_BlockThread(). The returned value remains valid until the next invocation
of JVM_TimeSlice().
■
int JVM_CleanUp(void);
This function frees all resources allocated by the virtual machine. It returns the value
passed to JVM_Stop() or 0 if JVM_Stop() was not called.
9.5.3
Long-Running Native Methods in Slave Mode
Because slave mode operates under the lightweight thread threading model, write
your long-running native methods as described in Section 4.1, “Coding Styles for
Long-Running Native Methods” on page 4-1.
9-10
CLDC HotSpot™ Implementation Porting Guide • July 2006
9.6
Miscellaneous Virtual Machine APIs
This section describes other API functions to pass control between the virtual
machine and your software.
9.6.1
Functions Implemented Inside the
Virtual Machine
The following functions expose functionalities in the virtual machine. Please note
that some functions can only be called within a certain context (such as only from
within a native method).
■
jlong JVM_JavaMilliSeconds();
Returns the current time, in the same format as
System.currentTimeMillis().
■
typedef unsigned int (*JVM_GetByteProc)(void *);
■
jboolean Jvm_inflate(void *data, JVM_GetByteProc getByteProc,
int compLen, unsigned char** outFileH, int decompLen);
Performs the inflate algorithm.
9.6.2
Functions Implemented by Your Software
You must implement a set of Service Provider Interface (SPI) functions that the
virtual machine requires to support its operation. All of these functions begin their
names with JVMSPI_. One example, JVMSPI_CheckEvents(), was described
previously. Following are the others:
■
jboolean JVMSPI_CheckExit();
The virtual machine calls this function whenever the Java method
System.exit() is called. It returns KNI_TRUE if exiting the virtual machine is
allowed at this point of time or KNI_FALSE otherwise.
■
jboolean JVMSPI_PrintRaw(const char *s);
The virtual machine calls this function whenever it needs to print some text to the
console. You can display the text in a way that’s suitable for your device.
■
char * JVMSPI_GetSystemProperty(char *prop_name);
The virtual machine calls this function to implement the Java method
System.getProperty().
Chapter 9
Implementing Java ME Profiles
9-11
The virtual machine calls this function before checking its own list of properties.
This means your software can override property values defined inside the virtual
machine.
■
char * JVMSPI_FreeSystemProperty(char *prop_value);
The virtual machine calls this function to free any values returned by
JVMSPI_GetSystemProperty().
9-12
CLDC HotSpot™ Implementation Porting Guide • July 2006
APPENDIX
A
Error Codes
When the CLDC HotSpot Implementation virtual machine, while running in product
mode, encounters an error (such as “no main() method in class,”) it prints a
numerical error code, not the textual message. The following table describes the
meaning of each numerical error code.
TABLE A-1
Code
Error Codes
Message
0
1
Stack Overflow
2
Stack Underflow
3
Unexpected Long or Double on stack
4
Bad type on stack
5
Too many locals
6
Bad type in local
7
Locals underflow
8
Inconsistent or missing stackmap at target
9
Backwards branch with uninitialized object
10
Inconsistent stackmap at next instruction
11
Expect constant pool entry of type class
12
Expect subclass of java.lang.Throwable
13
Items in lookupswitch not sorted
14
Bad constant pool for ldc
15
baload requires byte[] or boolean[]
16
aaload requires subtype of Object[]
A-1
TABLE A-1
A-2
Error Codes
Code
Message
17
bastore requires byte[] or boolean[]
18
Bad array or element type for aastore
19
VE_FIELD_BAD_TYPE
20
Bad constant pool type for invoker
21
Insufficient args on stack for method call
22
Bad arguments on stack for method call
23
Bad invocation of initialization method
24
Bad stackmap reference to uninitialized object
25
Initializer called on already initialized object
26
Illegal byte code (possibly an optimized or fast bytecode)
27
Arraylength on non-array
28
Bad dimension of constant pool for multianewarray
29
Value returned from void method
30
Wrong value returned from method
31
Value not returned from method
32
Initializer not initializing this
33
Illegal offset for stackmap
34
Code can fall off the bottom
35
Last byte of invokeinterface must be zero
36
Bad nargs field for invokeinterface
37
Bad call to invokespecial
38
Bad call to <init> method
39
Constant pool entry must be a field reference
40
Override of final method
41
Code ends in middle of byte code
42
ITEM_NewObject stackmap type has illegal offset
43
Constant pool index is out of bounds
44
Truncated class file
45
Invalid UTF8 string in .class file
46
invalid constant tag
CLDC HotSpot™ Implementation Porting Guide • July 2006
TABLE A-1
Error Codes
Code
Message
47
Constant pool overflow in .class file
48
Unknown constant tag in .class file
49
Bad type reference in .class file
50
Invalid method name in .class file
51
Invalid method signature in .class file
52
Invalid field name in .class file
53
Invalid field signature in .class file
54
Invalid signature in .class file
55
Invalid class name in .class file
56
Invalid version in .class file
57
Class must not implement array class
58
Invalid attribute in .class file
59
Invalid synthetic attribute in .class file
60
Multiple InnerClasses attributes
61
Duplicate field in .class file
62
Invalid field access flags in .class file
63
Invalid field type in .class file
64
Bad stack map - unexpected size
65
Bad stack map - unexpected stack type
66
Bad constant pool index in class file
67
Corrupted exception handler in .class file
68
Invalid method access flags in .class file
69
Superfluous code attribute in .class file
70
Excessive code length in .class file
71
Duplicate StackMap attribute
72
Bad Stackmap attribute size
73
Duplicate exception table in .class file
74
Corrupted attribute in .class file
75
Missing code attribute in .class file
76
More than 255 method parameters in .class file
Appendix A
Error Codes
A-3
TABLE A-1
A-4
Error Codes
Code
Message
77
Invalid frame size in .class file
78
Invalid .class file
79
Class implements itself
80
Class implements non-interface
81
Circular interfaces
82
Recursive class structure
83
Incompatible magic value in .class file
84
Bad class flags in .class file
85
Wrong class name
86
Invalid superclass
87
Interfaces must have java.lang.Object as superclass
88
Cannot inherit from final class
89
Must not extend an interface
90
Inconsistent .class file size
91
Circular super classes
92
java.lang.ClassFormatError — Invalid constant in .class file
93
Constant pool index out of bounds
94
NoClassDefFoundError
95
IllegalAccessError
96
InstantiationError
97
java.lang.NoSuchFieldError
98
Field changed
99
Method changed
100
Class changed
101
Overriding a final method
102
ldiv error
103
lrem error
104
idiv error
105
Illegal code
106
Illegal wide code
CLDC HotSpot™ Implementation Porting Guide • July 2006
TABLE A-1
Error Codes
Code
Message
107
AbstractMethodError
108
Null pointer in array copy
109
Array types not equal in array copy
110
Already started
111
Subtype check failed
112
Bad ref index (out of range)
113
Bad ref index (unallocated)
114
Thread does not own lock when calling wait
115
Thread does not own lock when calling notify
116
Thread does not own lock when calling notifyAll
117
main() method not found
118
System.exit() not allowed
119
May not load classes in restricted package
120
Error tag count
121
Static offset exceeded max value of ushort
122
Must be a power of 2
123
Fatal error
124
Cannot represent imm_32 as rotated imm_8
125
Must have temporary register
126
Flat profiler buffer overflow
127
CreateEvent() failed
128
DuplicateHandle() failed
129
System resource unavailable
130
Couldn’t load root class, please check classpath
131
Heap too small to bootstrap virtual machine
132
Couldn’t load java.lang.Object, please check classpath
133
Couldn’t load specified class during bootstrapping, please check classpath
134
run() method not found
135
Error in native method
136
Couldn’t load JAR File
Appendix A
Error Codes
A-5
TABLE A-1
A-6
Error Codes
Code
Message
137
java.lang.NoSuchMethodError
138
java.lang.IllegalAccessException
139
java.lang.InstantiationException
140
java.lang.Object cannot implement interfaces
141
Internal class loaded from classfile has incorrect size
142
Internal class must have fixed size
143
Internal field must be valid
144
Internal field must be non static
145
Internal field must be static
146
Internal field offset mismatch
147
Allocation cannot fail during bootstrap
148
Class cannot be resolved during compilation (without violating JLS)
149
Allocation failed while GC disabled
150
Cannot nest isolate context switch
151
Too many running isolates
152
ROMized string 64k limit overflow
153
Isolate not started
154
Verification error
155
BinaryFileStream output error
156
Romizer not supported in this VM build
157
Failed to load shared library. Make sure dynamic loading is enabled, and
library exists
158
One one instance of the Romizer can be executed at any time
159
Romization must be done in a fresh VM (or fresh Task in MVM mode
160
Isolate already started
161
No more free slots
162
Invalid method name
163
Trap already set
CLDC HotSpot™ Implementation Porting Guide • July 2006
TABLE A-1
Error Codes
Code
Message
164
Invalid trap handle
165
Parameter types mismatch
166
com.sun.cldchi.jvm must be marked as a HiddenPackage in your ROM
configuration file
Appendix A
Error Codes
A-7
A-8
CLDC HotSpot™ Implementation Porting Guide • July 2006
APPENDIX
B
Floating Point on the ARM Platform
The build-time option ENABLE_SOFT_FLOAT specifies how low-level floating point
arithmetic is implemented on the ARM platform. This appendix describes what this
option does and how you should specify it according to the capabilities of your
platform.
Note – ENABLE_SOFT_FLOAT has no meaning for the x86 processor.
B.1
Low-Level Floating Point Routines
The set of low-level floating point routines in the CLDC HotSpot Implementation
virtual machine consists of the following functions:
■
■
■
■
■
■
■
■
■
■
■
■
■
■
■
jvm_fadd()
jvm_fsub()
jvm_fmul()
jvm_fdiv()
jvm_frem()
jvm_dcmp()
jvm_fcmp()
jvm_dadd()
jvm_dsub()
jvm_dmul()
jvm_ddiv()
jvm_drem()
jvm_i2d()
jvm_i2f()
jvm_l2f()
B-1
■
■
■
■
■
■
■
jvm_l2d()
jvm_f2i()
jvm_f2l()
jvm_f2d()
jvm_d2i()
jvm_d2l()
jvm_d2f()
Note – The meaning of each function can be inferred from their names. For
example, jvm_fadd() addes two float numbers.
All other floating point routines in the virtual machine, such as ieee754_sqrt(),
are based on this list of low-level floating point routines. Thus, CLDC HotSpot
Implementation itself handles all floating point operations required by the Java™
Language Specification. This is done for two reasons:
B.2
■
To ensure compatibility with the Java™ Language Specification, which might not be
guaranteed by some third-party compilers and floating point libraries.
■
To reduce the effort to port CLDC HotSpot Implementation without requiring
third-party floating point libraries.
Meaning of ENABLE_SOFT_FLOAT
The way in which your implementation handles floating point will depend on how
you set this option, as follows:
■
ENABLE_SOFT_FLOAT=true
In this mode, all low-level floating point routines are implemented by handwritten C and Assembler code inside the virtual machine, using pure integer
math.
■
ENABLE_SOFT_FLOAT=false
In this mode, most low-level floating point routines are implemented using
floating point operations provided by the C language. An example can be found
in FloatSupport_arm.cpp:
jfloat jvm_fadd_internal(jfloat x, jfloat y)
}
B-2
CLDC HotSpot™ Implementation Porting Guide • July 2006
{ return x + y;
B.2.1
Choosing Value for ENABLE_SOFT_FLOAT
If your ARM platform does not include floating point hardware, always set
ENABLE_SOFT_FLOAT=true. Some platforms, such as Linux, might provide floating
point emulation inside the operating system, so you could build the virtual machine
with ENABLE_SOFT_FLOAT=false, in which case all ARM floating point
instructions would generate an trap into emulation code inside the operating system
kernel. However, this causes performance degradation and the results might not be
compliant with the Java Language Specification.
If your ARM platform does include floating point hardware, begin the virtual
machine porting effort setting ENABLE_SOFT_FLOAT=true. This ensures stability
and compliance during the initial porting effort. Switch to ENABLE_SOFT_FLOAT=
false only at a later tuning phase if you feel it’s necessary to improve floating
point performance. After switching the flag, always retest with the CLDC TCK to
ensure Java Language Specification compilance.
B.3
Integrating With Platform Software
All the low-level floating point routines listed above are directly invoked by the
ARM Assembler interpreter loop (Interpreter_arm.s) using a “soft FP” calling
convention, that is, all parameters are passed in integer registers (r0 ~ r3). You must
build the virtual machine with the appropriate compiler options to ensure the
correct calling convention is used.
If your platform does not have floating point hardware, this is usually not an issue
because all floating point parameters are passed in integer registers (for example, if
you use the -fpu softvfp option for the ADS C++ compiler).
If your platform uses floating point hardware, you might need to ensure that the
“soft FP” calling convention is used for the virtual machine’s low-level floating point
routines.
If you use ADS version 1.2, this is done out of the box. The virtual machine’s header
files uses the keyword ADS __softfp to indicate if a function must use the “soft
FP” calling convention, for example:
#define JVM_SOFTFP __softfp
JVM_SOFTFP jfloat jvm_fadd(jfloat x, jfloat y);
If you use other compilers, change the definition of the JVM_SOFTFP macro to suit
your compiler.
Appendix B
Floating Point on the ARM Platform
B-3
If your compiler does not support a keyword similar to __softfp in ADS, you
might need to compile the whole virtual machine module with “soft FP” calling
convention. For example, with GCC 2.9x you can use the -msoft-float compiler
option.
B-4
CLDC HotSpot™ Implementation Porting Guide • July 2006
APPENDIX
C
In-Place Execution Porting Notes
This appendix contains technical notes about porting an implementation that
supports in-place execution.
C.1
Disabled Class Loading
When an application image file for in-place execution has been loaded from the
classpath, you can only load resources from the JAR files (and directories) specified
in the classpath. All class files in the classpath are ignored. For example, if your
classpath is: -classpath foo.bun:bar.jar and if the class XYZ is included in
bar.jar but not in foo.bun, an attempt to access the XYZ class from your
application results in a ClassNoDefFoundException.
This restriction is necessary to implement many optimizations in the binary image
file. This restriction does not affect typical MIDP applications, which consist of a
single JAR file. During application image conversion, all class files contained in this
JAR file are converted and stored into the image file. You do not need to load classes
from alternate JAR files.
C-1
C-2
CLDC HotSpot™ Implementation Porting Guide • July 2006
APPENDIX
D
Preventing MIDlets From Accessing
Internal Classes
The set of system classes contain many internal classes (usually contained in a
com.yourcompany package). In some cases, it might be necessary to disallow
MIDlets from accessing an internal class. Things can be complicated if the internal
class contains public API methods. To give a hypothetical example, you might have
an internal class that extends the public Graphics API:
package com.mycompany.internal;
public class QuickGraphics extends
javax.microedition.lcdui.Graphics {
public void drawLine(int x1, int y1, int x2, int y2);
....
}
In this case, for performance reasons, the method QuickGraphics.drawLine does
not perform clipping, because it’s intended to be used only by internal classes, which
always draw lines within bounds. However, if a MIDlet can somehow call
QuickGraphics.drawLine, it can potentially corrupt the screen, or worse,
overwrite arbitrary memory contents.
This is a contrived example, but it’s quite possible that some of your internal classes
might contain such sensitive APIs that must not be accessible from MIDlets.
You can prevent MIDlets from accessing internal APIs in two ways:
■
Declare the package containing the internal API a HiddenPackage in your ROM
configuration file (see Chapter 10 in the CLDC HotSpot Implementation Architecture
Guide). In this case, the QuickGraphics class cannot be instantiated by the
MIDlet at all, so the MIDlet has no way to access the sensitive drawLine method.
■
Modify constructors of the QuickGraphics class so that they require a “security
token” object, which is not available to the MIDlet, for example:
D-1
public class QuickGraphics extends Graphics {
static Object requiredToken;
public QuickGraphics(Object securityToken) {
if (!requredToken.equals(securityToken)) {
throw new SecurityException(“...”);
}
}
}
As long as the MIDlet does not have a copy of the requiredToken object, it cannot
instantiate QuickGraphics, and thus cannot call the drawLine method.
Use a combination of both methods to ensure security of your system code.
Refer to the Sun Java Wireless Client Porting Guide for an in-depth discussion of
security tokens.
D.0.1
HiddenPackage and Class.forName
In some cases, an internal class might belong to a HiddenPackage, but the system
code needs to access it using Class.forName(). Building upon the previous
example given above, suppose that your system code uses a String name to choose
which Graphics class to instantiate:
public class GraphicsFactory {
Graphics getGraphics(String name) {
String clsName = “com.mycompany.internal.” + name
+ “Graphics”;
Class clz = Class.forName(clsName);
return (Graphics)clz.instantiate();
}
}
To make the getGraphics method work, you need to prevent the QuickGraphics
class from being renamed by the ROMizer, so need these lines in your ROM
configuration file:
HiddenPackage = com.mycompany.internal
DontRenameClass = com.mycompany.internal.QuickGraphics
D-2
CLDC HotSpot™ Implementation Porting Guide • July 2006
Checks in Class.forName()are included in CLDC HotSpot Implementation 1.1.3
so that it fails if it is called directly from application code to access a class that is in a
hidden package, even if the class was not renamed. That is, if a MIDlet tries to do the
following, the attempt fails:
class DownloadedMidlet {
// the following line won’t work
static Class clz =
Class.forName(“com.mycompany.internal.QuickGraphics”;
}
However, you still need to ensure the system code does not accidently return a
QuickGraphics object to the MIDlet. For example, use the methods described in
this appendix to call GraphicsFactory.getGraphics() to prevent MIDlets from
getting a QuickGraphics object.
D.1
Storing In-Place Execution Binary
Images
Many low-end platforms do not support dynamic memory allocation. Even though
some platforms support a limited malloc() functionality, it might not be possible
or efficient to use malloc() to allocate memory buffers that are large enough to
hold in-place execution application images.
On such low-end platforms, the space of the object heap is usually statically
allocated as follows:
static char space_for_object_heap[HeapCapacity];
When running in SVM mode, use the low end of this space to load the in-place
execution binary image, and use the remaining area for the object heap. This makes
it easy to port in-place execution to low-end platforms. See FIGURE D-1.
Appendix D
Preventing MIDlets From Accessing Internal Classes
D-3
Binary Image
Object Heap
Heap Capacity
FIGURE D-1
Memory Allocation for Application Images in SVM Mode
This arrangement works only if you have a single binary image. It does not work in
multitasking mode, where you need to load multiple binary images. Thus, in
multitasking mode, to use in-place execution, the platform needs to implement the
OsMemory_allocate_binary_image() method for efficiently allocating memory
buffers for binary images, which are usually large in size (in tens or hundreds of
kilobytes). Where possible, implement this method by allocating virtual memory
pages outside of the malloc() heap to avoid fragmentation of the malloc() heap.
D-4
CLDC HotSpot™ Implementation Porting Guide • July 2006
APPENDIX
E
Binary Distribution Model
In some cases a third party might need to add extra functionality to your CLDC
HotSpot Implementation-based software stack. For example, a cellular service
provider might need to add custom Java technology packages. In the cases where it
is not possible for the third party to have source code (if they are not a CLDC
HotSpot Implementation source licensee or if you do not wish to reveal your own
source code), you can distribute binaries to the third party (subject to a Sun license),
including the following packages:
■
.obj files (CLDC and Java Technology for the Wireless Industry) built from .c
source files licensed from Sun Microsystems.
■
.class files (CLDC and Java Technology for the Wireless Industry) built from
.java source code licensed from Sun Microsystems.
■
Your .class files, such as a JSR package that you added on top of Sun’s CLDC
and JTWI packages licensed from Sun Microsystems.
■
Your .obj files (such as native code needed by your .class files, as well as
other native libraries)
■
ROMizer tool (romgen.exe) built from CLDC HotSpot Implementation source
code.
Then, the third party can follow these steps to build a final image:
1. Create a JAR file containing the following:
■
■
All .class files that they receive from you
Additional .class files (such as a new JSR that they are adding)
2. Use the romgen.exe tool to create a ROMImage.cpp from this JAR file.
3. Compile ROMImage.cpp into ROMImage.obj, and link it with the following:
■
■
The .obj files they receive from you
Their own .obj files
E-1
E-2
CLDC HotSpot™ Implementation Porting Guide • July 2006
APPENDIX
F
KDWP Extension for Memory
Profiler Protocol
The memory profiler tool requires the following extensions to the KVM Debug Wire
Protocol (KDWP) Specification, Version 1.0.
F.1
Memory Profiler Command Set (18)
The following commands are defined in the CLDC HotSpot Implementation
memory profiler command set:
Get Global Pointers Command (1)
Get All Objects Command (2)
Get All Classes Command (3)
Get All Roots Command (4)
Suspend (5) and Resume (6) Commands
Get Global Pointers Command (1)
Returns the pointers to the start of the heap, to the end of old generation objects, to
the end of all objects in the heap, to the end of the heap.
Out Data
(None)
F-1
Reply Data
TABLE F-1
Structure of Reply Data for Get Global Pointers Command
int
heap_start
Pointer to the start of the heap
int
heap_top
Pointer to the end of the heap
int
old_generation_end
Pointer to the end of the old generation objects
int
inline_allocation_top
Pointer to the end of the objects in the heap
Get All Objects Command (2)
Returns information about all objects in the heap. For each object, this command
returns its location, size, extended class id, and all references contained by this
object.
Out Data
(None)
F-2
CLDC HotSpot™ Implementation Porting Guide • July 2006
Reply Data
Structure of Reply Data for Get All Objects Command
TABLE F-2
Repeated until buffer is full:
int
Address
Object address
int
size
Object size
int
Extended type
Object type ID (*)
int
links
Number of links
Repeated links times:
int
link
Address of an object to which the current object has
reference
int
Return value
Last value that shows if this is the last object(\)
* This value differs when running in SVM or MVM mode. When running in SVM mode, this value is just class_id.
When running in MVM mode, if the class is a ROMized system class, then this value is class_id. Otherwise, it is
(isolate number << 16) | class_id.
\ – 1 means that this is the last object, and the dump is finished.
– 2 means that this is not the last object and the client must repeat queries to get the remaining objects.
Get All Classes Command (3)
Returns all classes with names and extended class_ids (see (*) from the Get all
objects Command).
Out Data
(None)
Reply Data
TABLE F-3
int
Structure of Reply Data for Get All Classes Command
Classes number
Number of classes in system
Repeated Classes number of times:
int
Extended class id
See footnote 1 in the Get All Objects Command
string
Class name
Name of the class
Get All Roots Command (4)
Appendix F
KDWP Extension for Memory Profiler Protocol
F-3
Returns the addresses of all roots objects in the heap.
Out Data
(None)
Reply Data
TABLE F-4
Structure of Reply Data for Get All Roots Command
Repeated until Object address is -1
int
Object address
Address of a root object
Suspend (5) and Resume (6) Commands
Suspends and resumes the virtual machine. When running in MVM mode, this
command suspends and resumes all isolates.
Out Data
(None)
Reply Data
(None)
F-4
CLDC HotSpot™ Implementation Porting Guide • July 2006
APPENDIX
G
Data Interface for the Memory
Profiler
This appendix documents the Java programming language data interface for the
memory profiler of CLDC HotSpot Implementation.
public interface MemoryProfilerDataInterface{
public int get_heap_start();
public int get_heap_top();
public int get_old_gen_end();
public int get_allocation_top();
public void update() throws SocketException;
public Object[] getClassesList() throws SocketException;
public JavaObject[] getObjectsOfClass(int class_id);
public Iterator getObjects();
public void connect(String hostName, int port) throws
java.net.ConnectException;
public String getObjectTypeName(JavaObject obj);
public JavaObject[] pathFromTheRoot(JavaObject obj);
G-1
public JavaObject[] getObjectsFromTheAddresses(int start, int end);
public void pauseVM(boolean pause);
public Object[] calculateStatistics();
public void closeConnections();
}
G-2
CLDC HotSpot™ Implementation Porting Guide • July 2006
APPENDIX
H
XScale Porting Notes
This document describes optimizations to CLDC HotSpot Implementation for the
Intel PXA27x processor family. Several of the optimizations make use of the Intel
Wireless MMX (WMMX) instructions supported by the PXA27x processors.
The development board used for these optimizations is the Intel Bulverde.
H.1
Build Procedure
The following topics detail the build procedure for building CLDC HotSpot
Implementation on the Intel PXA27x (XScale) processor family.
H.1.1
Target Platform
This build of CLDC HotSpot Implementation was developed and tested on the
Mainstone II reference platform for the Intel PXA27x processor under MontaVista
Linux OS. However, it has no known dependencies on the platform (beyond the
processor itself).
H.1.2
Build Environment
Setting up the correct build environment includes obtaining the required tools.
H-1
H.1.2.1
Required Tools
The cross-compilation tools needed to build the CLDC HotSpot Implementation for
the Intel PXA27x processor family can be downloaded from
ftp://ftp.arm.linux.org.uk/pub/linux/arm/people/xscale/
mainstone/04-28-2004/.
The file name is arm-linux-toolchain-bin-03-10-04.tar.bz2.
Before starting the CLDC HotSpot Implementation build procedure, the shell
environment variable GNU_TOOLS_DIR must be set to indicate the directory in
which the cross compiler is installed, for example:
export GNU_TOOLS_DIR=/usr/local/arm-linux/arm-linux/
H.1.3
Preprocessor Symbols
The make files for the PXA27x build of CLDC HotSpot Implementation distributed
with this release use the make file variable XSCALE_ENABLE_WMMX_ALL to control
inclusion of the PXA27x optimizations. By default, this variable is set to FALSE,
which excludes all the PXA27x optimizations. This results in a build that is identical
to the ARM build. To include the optimizations, set XSCALE_ENABLE_WMMX_ALL to
TRUE, either in the make file or in a shell environment variable.
TABLE H-1
Makefile (jvm.make) Variables
Flag
Description
XSCALE_ENABLE_WMMX_ALL
Enable all Intel XScale (with WMMX) optimizations
Within the source code, individual preprocessor symbols control the inclusion of the
code for individual optimizations. To include code for an optimization, the
corresponding preprocessor symbol must have the value 1. Setting the make file
variable XSCALE_ENABLE_WMMX_ALL to TRUE causes all the symbols in TABLE H-2 to
be defined as 1.
H-2
CLDC HotSpot™ Implementation Porting Guide • July 2006
Note – The code for the timer tick optimization and the code for the array copy
optimization depend on the WMMX Instructions, so if the timer tick or array copy
optimizations are included, the WMMX Instructions must also be included. The code
for internal code optimizer depends on the back-end code scheduler, so if the
internal code optimizer is included, the flag ENABLE_CODE_OPTIMIZER must be set
to TRUE.
TABLE H-2
H.2
C Preprocessor Symbols In Source Code
Flag
Description
XSCALE_ENABLE_WMMX_INSTRUCTIONS
Enable assembler and disassembler for
WMMX instructions
XSCALE_ENABLE_WMMX_TIMER_TICK
Enable Timer Tick Check optimization
by using WMMX resource.
XSCALE_ENABLE_WMMX_ARRAYCOPY
Enable array copying optimization by
using WMMX instruction
XSCALE_REMEMBER_ARRAY_LENGTH
Enable array length reload elimination
optimization
XSCALE_ENABLE_LOOP_OPTIMIZATION
Enable loop optimization
INTEL_ENABLE_NPCE
Enable null pointer check elimination
optimization on Linux
PXA 27x Optimizations
Documented here are useful optimations of the ARM architecture provided by the
XScale processor.
H.2.1
WMMX Instruction Enabling
This code implements assembler instruction routines for the WMMX instructions in
the same style as the CLDC HotSpot Implementation assembler instruction routines
for ARM and other instruction sets. Including this code by itself does not affect the
operation of CLDC HotSpot Implementation. However, the Timer Tick and Array
Copy optimizations depend on these routines.
Appendix H
XScale Porting Notes
H-3
Two files enable WMMX instructions for assembler and disassembler:
assembler_wmmx.hpp and disassembler_wmmx.cpp.
TABLE H-3
H.2.2
Files Affected by WMMX Instruction Enabling
Files
Description
Assembler_wmmx.hpp
Created for WMMX assembler
Assembler_arm.hpp
Slightly modified to enable WMMX assembler
Disassembler_wmmx.cpp
Created for WMMX disassembler
Disassembler_arm.hpp
Slightly modified to enable WMMX disassembler
Disassembler_arm.cpp
Slightly modified to enable WMMX disassembler
Timer Tick Check Optimization
In CLDC HotSpot Implementation, a flag that is set by a system timer interrupt is
checked at each method entry and backward branch. This flag is normally kept in
the low bit of the global variable _current_stack_limit. This optimization
keeps this flag instead in a register in the WMMX execution unit, thereby
eliminating the load operation otherwise involved in the frequent checks.
For this optimization to work correctly, these conditions are necessary.
Optimization conditions are single thread. This means only one thread is used for
virtual machine: ENABLE_TIMER_THREAD = false.
Another opimization can be realized by enabling only WMMX resource for assembly
language source code, not for C or C++ source code.
Control by using preprocessor symbol XSCALE_ENABLE_WMMX_TIMER_TICK.
TABLE H-4
H-4
Files Affected by the Timer Tick Optimization
Files
Description
InterpreterSkeleton.cpp
Modified to add two new functions
InterpreterStubs_arm.cpp
Modified to implement two new assembly
functions
Thread.hpp
Modified two functions (set_timer_tick &
clear_timer_tick)
InterpreterGenerator_arm.cpp
Modified to change set timer tick flag code
CLDC HotSpot™ Implementation Porting Guide • July 2006
TABLE H-4
H.2.3
Files Affected by the Timer Tick Optimization
Files
Description
SharedStubs_arm.cpp
Modified to change set timer tick flag code
CodeGenerator_arm.cpp
Modified to change set timer tick flag code, and
check timer tick flag code
SourceMacros_arm.cpp
Modified to change set timer tick flag code
Array Copying by WMMX Instructions
This optimization uses WMMX data movement instructions to speed array copying
for large arrays (more than 40 bytes).
H.2.4
Array Length Reload Elimination
This optimization incorporates two modifications to CLDC HotSpot Implementation
code generation to reduce the number of loads from memory, because the PXA27x
high clock rates make loads a particular performance liability. The first modification
deals with loading the length of an array for bounds checking. Array bounds checks
happen very frequently in CLDC HotSpot Implementation. Prior to each array
member access, the array bounds must be checked. In the base ARM code generation
done by CLDC HotSpot Implementation, each of such check generates a memory
load instruction. This optimization modifies code generation to suppress the
redundant loads on the second and subsequent accesses.
Another operation for which the generated code might experience delays due to
loads is loading the array type. In the base ARM code generation done by CLDC
HotSpot Implementation, the array type is loaded just before the first access to the
array. This optimization moves the load to the beginning of the method. This often
hides the latency of the load, and, if the first array access is in a loop, this also
eliminates the redundant execution of the load.
H.2.5
Loop Optimization
In the current base CLDC HotSpot Implementation code generation, each iteration of
a loop executes two branch instructions: the loop exit test and an unconditional
branch from the end of the loop body back to the top. This optimization produces
loop code in which only one branch instruction (the loop test) is executed on each
iteration after the first.
Appendix H
XScale Porting Notes
H-5
H.2.6
Null Pointer Check Elimination for Linux
On PXA27x processors (as on many others), attempting to dereference a NULL
pointer causes a hardware exception that can be caught in a Linux signal handler.
Null Pointer Check Elimination (NPCE) uses this fact to eliminate CLDC HotSpot
Implementation’s generation of code to explicitly check that a pointer is non-NULL
before it is dereferenced.
H-6
CLDC HotSpot™ Implementation Porting Guide • July 2006
Index
Symbols
#ifdef statements, avoiding, 2-2
porting prerequisites, 2-2
porting process, overview, 3-1
Porting the file system interface, 3-5
C
CLDC Hotspot Implementation, Introduction to, 11
CLDC Hotspot™ Implementation virtual machine,
defined, 1-1
CLDC Hotspot™ Implementation, implementation
language, 1-2
CPU port, 2-1
E
Error Codes, A-1
I
ifdef statements, avoiding, 2-2
includeDB configuration database, 2-2
M
memory footprint, 1-2
O
operating system (OS) port, 2-1
operating system port, undertaking, 3-1
OS.hpp, 3-1
OS-specific declarations, 3-3
P
porting CLDC Hotspot, overview, 2-1
porting interface, compiler-specific, 3-3
Index-1
Index-2
CLDC HotSpot™ Implementation Porting Guide • July 2006