1
APPENDIX II
MACHINERY INSTITUTE REFERENCE COMBINE CAPACITY RESULTS
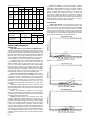
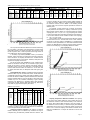
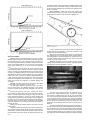
TABLE 7 and FIGURES 24 and 25 present the capacity results for the Machinery
Institute reference combine in wheat and barley crops harvested from 1979 to 1983.
FIGURE 24 shows capacity differences in Neepawa wheat for the ve years. The 1983
Neepawa wheat crop shown in TABLE 7 had about average straw yield, below average
grain yield, and below average grain and straw moisture content.
FIGURE 25 shows capacity differences in six-row Bonanza barley for 1981, 1982, and
1983, two-row Fergus barley for 1979 and two-row Hector barley for 1980. The 1983
Bonanza barley crops shown in TABLE 7 had above average straw yield, grain yield,
grain moisture, and straw moisture.
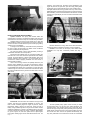
Results show that the reference combine is important in determining the effect of crop
variables and in comparing capacity results of combines evaluated in different growing
seasons.
TABLE 7. Capacity of the Machinery Institute Reference Combine at a Total grain Loss
of 3% Yield
Crop Conditions
Width of Cut
Crop
Capacity Results
Crop Yield
Grain Moisture
MOG Feedrate
Grain Feedrate
Ground Speed
Variety
ft
m
bu/ac
t/ha
Straw %
Grain %
MOG/G
Ratio
lb/min
t/h
bu/h
t/h
mph
km/h
Loss Curve
1
9
8
3
Barley
Barley
Wheat
Wheat
Bonanza
Bonanza
Neepawa
Columbus
28
24
27
41
8.5
7.4
8.2
12.5
71.9
72.5
40.3
36.7
3.3
3.6
2.9
2.7
11.7
6.7
5.1
7.9
13.2
10.7
10.0
11.3
0.86
0.85
1.01
1.36
226
313
340
425
6.2
8.5
9.3
11.6
263
368
337
313
7.2
10.0
9.2
8.5
1.6
2.4
2.6
1.6
2.6
3.8
4.2
2.6
Fig. 25
Fig. 24
1
9
8
2
Barley(A)
Barley(B)
Wheat(C)
Wheat(D)
Wheat(E)
Wheat(F)
Bonanza
Bonanza2
Neepawa1
Neepawa1
Neepawa
Neepawa
28
50
40
40
25
25
8.5
15.2
12.2
12.2
7.6
7.6
75
55
40
41
47
53
4.09
2.99
2.73
2.79
3.21
3.59
22.3
9.3
11.1
10.3
6.0
6.6
10.6
12.4
13.6
14.3
7.9
11.0
0.79
0.68
0.68
0.81
0.89
0.88
205
227
414
356
326
322
5.6
6.2
11.3
9.7
8.9
8.8
325
417
609
440
367
367
7.1
9.1
16.6
12.0
10.0
10.0
1.3
1.3
3.1
2.2
2.6
2.3
2.0
2.0
5.0
3.5
4.1
3.7
1
9
8
1
Barley
Barley
Wheat
Wheat
Wheat
Bonanza
Klages
Manitou
Neepawa
Neepawa
25
25
25
27
24
7.6
7.6
7.6
8.2
7.4
62
53
51
55
49
3.33
2.86
3.46
3.69
3.29
7.2
7.1
6.3
6.4
6.2
12.6
12.0
13.8
11.9
13.7
0.67
0.68
0.96
0.85
0.93
205
220
312
348
337
5.6
6.0
8.5
9.5
9.2
385
403
326
410
363
8.4
8.8
8.9
11.2
9.9
2.2
2.6
2.2
2.3
2.6
3.5
4.2
3.5
3.7
4.1
Fig. 25
1
9
8
0
Barley
Barley
Wheat
Wheat
Wheat
Wheat
Hector
Hector
Neepawa1
Neepawa
Neepawa1
Neepawa
20
20
40
20
40
20
6.1
6.1
12.2
6.1
12.2
6.1
65
59
43
46
46
45
3.48
3.16
2.87
3.12
3.09
3.00
13.8
13.4
7.2
6.0
6.2
4.4
14.5
14.4
13.2
11.4
12.2
10.8
0.69
0.68
0.88
0.98
1.02
0.91
202
213
345
370
374
378
5.5
5.8
9.4
10.1
10.2
10.3
367
390
389
378
367
414
8.0
8.5
10.6
10.3
10.0
11.3
2.4
2.8
1.9
3.4
1.7
3.9
3.8
4.4
3.0
5.4
2.7
6.2
Fig. 25
1
9
7
9
Barley
Wheat
Wheat
Barley
Klages
Neepawa
Neepawa
Fergus
20
24
20
24
6.1
7.3
6.1
7.3
66
41
40
64
3.67
2.77
2.67
3.46
5.5
5.2
5.9
8.1
11.7
14.1
14.3
12.5
0.64
1.21
1.09
0.77
249
348
356
268
6.8
9.5
9.7
7.3
486
286
326
435
10.6
7.6
8.9
9.5
2.9
2.4
3.4
2.3
4.7
3.9
5.4
3.7
1
2
Fig. 25
Fig. 24
Fig. 24
Fig. 24
Fig. 24
Fig. 25
Side-by-Side Double Windrow
Double Windrows Lapped by 1/3
FIGURE 24. Total Grain Loss for the Reference Combine in Neepawa Wheat.
FIGURE 25. Total Grain Loss for the Reference Combine in Bonanza Barley.
Page
13