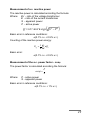
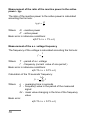
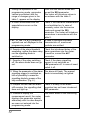
1
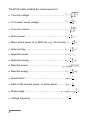
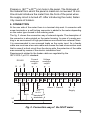
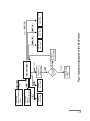
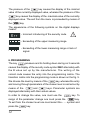
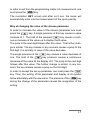
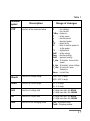
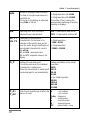
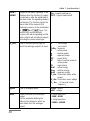
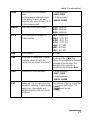
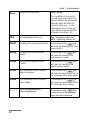
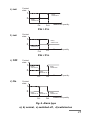
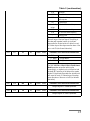
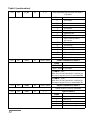
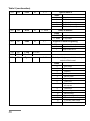
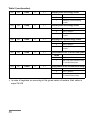
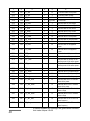
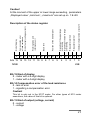
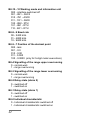
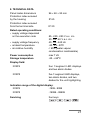
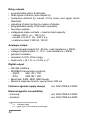
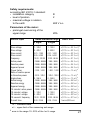
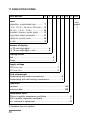
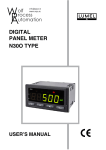
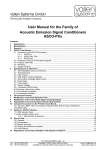
PROGRAMMABLE DIGITAL PANEL METER N12P SERVICE MANUAL PROGRAMMABLE DIGITAL PANEL METER N12P TYPE SERVICE MANUAL CONTENTS 1. APPLICATION ........................................................................ 5 2. BASIC REQUIREMENTS, OPERATIONAL SAFETY ............ 7 3. FITTING .................................................................................. 8 4. CONNECTION ....................................................................... 9 5. OPERATION ......................................................................... 10 6. PROGRAMMING ................................................................. 14 7. RS-485 INTERFACE ............................................................ 26 7.1. Connection way of the serial interface ............................................. 26 7.2. Description of the MODBUS protocol implementation ..................... 27 7.3. Description of used functions ........................................................... 28 7.4. Register map of the N12P meter ..................................................... 30 7.5. Registers for writing and read-out .................................................... 30 7.6. Registers only for read-out ............................................................... 39 8. TECHNICAL DATA ............................................................... 43 9. BEFORE A FAILURE WILL BE DECLARED ....................... 51 10. PROGRAMMING EXAMPLES OF N12P METERS ............. 53 11. EXECUTION CODES ........................................................... 56 12. MAINTENANCE AND guarantee ......................................... 57 ! " 1. APPLICATION N12P programmable digital panel meters are destined to measure a.c. voltages and a.c. currents, active, reactive and apparent power, power factor cosj, ratio of the reactive power to the active power, tgj, phase angle j, frequency, active, reactive and apparent energy, 15 minutes’ active power, 10 minutes’ voltage, 10 seconds’ frequency. Additionally, the meter enables the indication of the current time. A 5 or 4-digit display field (digits of 14 or 20mm high) in red or green colour, ensures a good legibility at a long distance. They realise other additional functions as: · signalling of the set alarm value overrunning, · signalling of the measuring range overrunning, · automatic set-up of the decimal point, · programming of the measurement repetition rate, · programming of the averaging kind: arithmetic mean, stepping window, · programming of the voltage and current ratio, · programming of the alarm and analogue output with the reaction to an optional measured quantity, independently of currently displayed values, · storage of maximal and minimal values of all input quantities, · resetting of counters: active, reactive and apparent energy, · synchronisation of 15 minutes’ power, 10 minutes’ voltage, · monitoring of set parameter values, · monitoring of all measuring quantities, · blocking of the parameter introduction by means of a password, · re-calculation of the measuring quantity into an optional quantity on the base of an individual, linear characteristic, · servicing of the interface with a MODBUS protocol, both ASCII and RTU, · conversion of the measured quantity into a standard programmable current or voltage signal, · highlighting of any optional measuring unit as per the order, · storage of counter states in memory. # The N12P meter enables the measurement of: · True rms voltage .................................................... U sk = 1 n 2 ∑ ui n i =1 · 10 minutes’ mean voltage ...................................... U r = 1 10 ∑ U sk n i =1 i · True rms current ..................................................... I sk = 1 n 2 ∑ ii n i =1 · Active power .......................................................... P = n 1 n ∑u i =1 · Mean active power (0 to 3600 sec, e.g. 15 minutes) Psr = · Active energy ......................................................... E p = i ⋅ ii 1 n ∑ Pi n i =1 1 n ∑ aPi n i =1 · Apparent power ...................................................... S = U sk ⋅ I sk · Apparent energy .................................................... ES = ( 1 n ∑ aSi n i =1 · Reactive power ................................................. Q = sign S 2 − P 2 · Reactive energy ..................................................... EQ = ) n 1 ∑ aQi n i =1 · Power factor ........................................................... cos ϕ = P S · Ratio of the reactive power to active power .......... tg ϕ = Q P P · Phase angle ..................................................... ϕ = sign arc cos S 1 · Voltage frequency .................................................. f = T $ · mean 10 seconds’ frequency ................................. f r = 1 10 ∑ fi n i =1 External ratios of measuring current and voltage transformers are taken into consideration in measurements. The ratio is optionally programmed. With the meter we deliver: - a guarantee card, - 4 holders to fix the meter on a panel, - a service manual, - a plug with screw connections or self-locking connections, - a set of stickers with units. When unpacking the meter, please check whether the type and execution code on the data plate correspond to the order. Symbols located in this service manual mean: - especially important, one must acquaint with this before connecting the meter. The non-observance of notices marked by these symbols can occasion the damage of the meter. ? - one must take note of this when the meter is working inconsistently to the expectations 2. BASIC REQUIREMENTS, OPERATIONAL SAFETY N12P meters are destined to be mounted into panels and cubicles. In the range of operational safety they are in conformity with the IEC 61010-1+A1:1996 standard requirements. • The installation and meter connection should be operated by qualified personnel. • One must take into consideration all accessible protection requirements. % • Before switching the instrument on, one must check the correctness of the network lead connection IEC 61010-1 p. 6.10. and p. 6.11.2. • In case of the protection terminal connection with a separate lead one must remember to connect it before the connection of network leads. • Do not connect the meter to the network through an autotransformer. • Before taking the meter housing out one must turn the supply off. • The removal of the meter housing during the guarantee contract period may cause its cancellation. 3. FITTING max 93 kW Fig. 1. Overall dimensions & Prepare a (92+0.6 x 45+0.6) mm hole in the panel. The thickness of the material from which the panel is made can not exceed 15 mm. One should introduce the meter from the front of the panel when the supply circuit is turned off . After introducing the meter, fasten it by means of holders. 4. CONNECTION At the rear side of the meter there is a terminal strip seat. A connector with screw terminals or a self-locking connector is added to the meter depending on the meter type chosed in the ordering code. The fig. 2. shows the connection way of external signals. The description of the connector is also printed on the meter housing. In case of a meter working in an environment of high perturbances one should use external filters. It is recommended to use screened leads on the meter input. As a feeder cable one must use a two-wire cable and choose the lead cross-section such that in case of a short-circuit from the device side, the protection of the cable was ensured by means of the electric installation fuse. Requirements related to the feeder cable are regulated by the IEC 61010-1 p.6.10. standard. B A GND RS-485 Current analogue output Voltage analogue output + - + - 17 18 19 20 21 22 23 24 25 26 27 28 29 30 31 32 4 5 L1 5A 1A 3 COM 2 lub S1 L1 N S2 a A P1 9 10 11 12 13 14 15 6 L2 lub N 100 V lub 400 V Alarm 1 Alarm 2 L N Supply b B P2 Fig. 2. Connection way of the N12P meter ' 5. OPERATION After switching the meter on, its type and next the program version are displayed. After ca 10 sec., the meter transits automatically into the measuring mode and the input signal value is displayed. The meter blanks automatically insignificant zeros. Values of the binary point and the multiplier in the measurement of voltage, current and power are automatically set up taking into consideration assigned ratios. The exceeding of the alarm threshold is signalled by means of alarm diodes 1 and 2. The basic unit of the measured value is automatically highlighted by the meter 1). a) kW Unit Alarm diodes Cancel key Key to decrease the value Key to increase the value Acceptance key b) Alarm diodes Cancel key Key to decrease the value Key to increase the value Acceptance key Fig. 3. Description of the meter faceplate a) 5-digit execution b) 4-digit execution 1) No exists in the 4-digit (20 mm) execution. Key functions: - acceptance key · entry into the programming mode (hold down during ca 3 seconds), · moving through the menu - choice of the level, · moving through the monitoring menu of measured values - selection of the next value, · entry into the change mode of the parameter value, · acceptance of the changed parameter value. - key to increase the value · displaying of the maximal value, · display of the maximal value - monitoring menu of measured parameters, · entry to the parameter group level, · moving through the chosen level, · change of the chosen parameter value - increase of the value · succeeding parameter in the monitoring mode - key to decrease the value · displaying of the minimal value, · display of the minimal value - monitoring menu of measured parameters, · entry to the parameter group level, · moving through the chosen level, · change of the chosen parameter value - decrease of the value · succeeding parameter in the monitoring mode - cancel key · entry to the menu of parameter monitoring (hold down during ca 3 seconds), · exit from the monitoring menu of meter parameters and measured values,, · cancel of the parameter change, · absolute exit from the programming mode The pressure of the key combination and holding down during ca 3 sec. causes the erasing of alarm signalling. This operation exclusively acts when the support function is switched on. The pressure of the erasing of all minimal value. key combination causes the The pressure of the key combination causes the erasing of all maximal values. key during ca 3 sec. The pressure and holding down of the causes the entry into the programming matrix. The programming matrix is secured by the safeguard code. key during ca 3 sec. The pressure and holding down of the causes the entry into the monitoring menu. one must move through the monitoring menu by means of and keys. In this menu, all programmable meter parameters, except service parameters, are only accessible to the read-out. The exit from the monitoring menu takes place by means of the key. On the monitoring menu, parameter symbols are alternately displayed together with their values. The fig. 4. shows the operation algorithm of the meter. The pressure and holding down of and keys during ca 3 sec. causes the entry in to the monitoring menu of measured value. One must move through the monitoring menu by means of , and keys. The pressure of the key causes the display of the successive symbol of the measured value alternately with the value and the multiplier of this value in one of the shape 10E0, 10E3, 10E6, 10E9. ! Display of max. value Monitoring menu of meter parameters Monitoring menu of measured values 3 sec. Incorrect Programming matrix Correct Password checking Password introduction 3 sec. MEASUREMENT Display of Err inscription Erasing of all min. value Erasing of all max. value 3 sec. Fig. 4. Operation algorythm of the N12P meter Display of min. value 3 sec. Erasing of alarm signalling The pressure of the key causes the display of the minimal value of the currently displayed value, whereas the pressure of the key causes the display of the maximal value of the currently displayed value. The exit from the menu is proceeded by means of the key. The appearance of the following symbols on the digital displays means: - Incorrect introducing of the security code. ? - Exceeding of the upper measuring range. - Exceeding of the lower measuring range or lack of signal. 6. PROGRAMMING The key pressure and its holding down during ca 3 seconds causes the display of the security code symbol SEC alternately with the 0 value set up by the manufacturer. The writing of the correct code causes the entry into the programming matrix. The transition matrix into the programming mode is shown on the fig. 5. We choose the level by means of the key, whereas the entry and moving through parameters of the chosen level is carried out by means of the and keys. Parameter symbols are displayed alternately with their actual values. In order to change the value, one must use the key. To resign of the parameter change one must press the key. To exit from the chosen level one must select the - - - symbol and press the " key. In order to exit from the programming matrix into measurement, one must press the key. The inscription HEY occurs and after ca 5 sec. the meter will automatically enter into the measurement of the input quantity. Way of changing the value of the chosen parameter In order to increase the value of the chosen parameter one must press the key. A single pressure of this key causes a value increase of 1. The hold of the pressed key causes a continuous increase of the value up to display the 0 value. The jump to the next digit follows after this value . The further change is similar. The key release in any moment causes a jump to the first digit. It is similarly in case of the value decrease. The single pressure of the key causes a value decrease of one. The hold of the key pressure causes a continuous decrease of the value till the display of 0. The jump to the next digit follows after this value. The further change is similar. In any moment, the key release causes a jump on the first digit. In order to accept the set up parameter one must press the key. Then, the writing of the parameter and display of its symbol follow alternately with the new value. The pressure of the key during the change of the parameter causes the resignation of the writing. # $ trYb Adr JEd Unit highlight CEnP resetting of active energy counter CEnq resetting of reactive energy counter bAud Hour Hour setting AnH SEr SEt SEC tSt Service Writing of Password Display standard introd. test parameters AnL Device address tYPA --- --- Upper Transmision kind of output baud transm. threshold rate P_An Signal support LEd2 Signal support LEd1 Lower Output Kind of input Kind of output for analogue output output (Volt/curr) Out dLY2 Alarm delay dLY1 tYP2 Alarm type tYP1 PrL2 PrH2 ALr2 P_A2 Upper Alarm 2 Kind of input Lower threshold threshold quantity for alarm 2 PrH1 Alarm delay PrL1 Alarm type P_A1 UAL RAnU RAnI trU Aur trI Voltage Current Voltage Number Current Kind of input transformer transformer averaging of meainput range surem. range ratio ratio Upper Alarm 1 Kind of input Lower threshold threshold quantity for alarm 1 ALr1 tYP Type of displayed quantity CEnS resetting of appar. energy counter --- Ind Linear charact. CPau synchr. of 15 min power (1) H1 (1) Y1 (1) (1) H2 Y2 Cuau synchr. of --10 min voltage Fig. 5. Transition matrix into the programming mode (1) - exists only, when the individual characteristic is included (Ind = On) (2) - exists only in executions with 5 displayed digits 5 4 3 2 Pos. InP no. Input param. 1 d_P (1) Decimal - - point Table 1 Parameter symbol Description Range of changes tYP Selection of the measured value U I FrEq P q S PF tF - rms voltage - rms current - frequency - active power - reactive power - apparent power - power factor - ratio of reactive power to active power FI - angle phase EnP - active energy Enq - reactive energy EnS - apparent energy P_Au - 15 minutes’ mean active power U_Au - 10 minutes’ mean voltage F_ Au- 10 seconds’ mean frequency Hour - current time RanU Selection of voltage range. 100U - 100 V range 400U - 400 V range RanI Selection of current range 1A - 1 A range 5A - 5 A range trU Selection of voltage ratio In 4-digit execution: 0...9999 In 5-digit execution: 0...99999 trI Selection of current ratio In 4-digit execution: 0...9999 In 5-digit execution: 0...99999 Aur Selection of the averaging mode Cnt - Arythmetic mean CntS - Stepping window % table 1 (continuation) UAL Number of averaged measurements. The time of a single measurement is equal 500 ms. The result on the display is refreshed every UAL x 500 ms. Ind Switching off or on of the user’s individual linear characteristic H1, Y1 H2, Y2 Parameters of the individual characteristic. On the base of coordinates of two points given by the user, the meter assigns coefficients of the individual characteristic a and b Y= aH+b. H1 and H2 - measured value Y1 and Y2 - expected value on the display D_P Setting of the decimal point. This setting acts when the individual characteristic is switched on. When the characteristic is switched off the decimal point is set automatically. In 4-digit execution: 0...9999 In 5-digit execution: 0...99999 The writing of the 0 causes the measurement switching off and the blanking of displays. ON - Characteristic switched on OFF - Characteristic switched off In 4-digit execution: -1999...9999 In 5-digit execution: -19999...99999 Setting possibilities in the 4-digit execution: 0000 000.0 00.00 0.000 In the 5-digit execution: 00000 0000.0 000.00 0.0000 P_A1 P_A2 & Kind of input quantity type at which the U alarm is to react I FrEq P q S PF - rms voltage - rms current - frequency - active power - reactive power - apparent power - power factor, cosj table 1 (continuation) - ratio of reactive power to active power, tgj FI - angle phase, j EnP - active energy Enq - reactive energy EnS - apparent energy P_Au - 15 minutes’ mean active power U_Au - 10 minutes’ mean voltage F_ Au - 10 seconds’ mean Frequency tF PrL1 PrL2 Alarm lower threshold In 4-digit execution: -1999...9999 In 5-digit execution: -19999...99999 tYP1 tYP2 Alarm type The fig. 6. shows the graphical illustration of alarm types nor-normal On - switched on OFF - switched off H_On - manually switched on, till the time of the alarm type change, the alarm output is switched on for good. H_OF - manually switched off, till the time of the alarm type change, the alarm output is switched off for good. dLY1 dLY2 Delay of the alarm operation. The parameter is defined in number of measurements, i. e. that one should give after how many measurement will be to operate the alarm. The alarm switching off follows without delay. The parameter takes in account the number of averaged measurements UAL, i.e. the whole averaging cycle is treated as a single measurement. In 4-digit execution: 0...9999 In 5-digit execution: 0...99999 The introduction of 0 causes the operation at the moment of alarm appearance. ' table 1 (continuation) LEd1 LEd2 Support of the alarm signalling. In the On - support switched on situation when the function of support OFF - support switched off is switched on after the withdrawal of the alarm state, the signalling diode is not blanked. The function signals the alarm state till the moment of its blanking by means of the combination of and keys. This function only and exclusively concerns the alarm signalling and the relay contacts will act without support, according the chosen alarm type. P_An Kind of the input quantity type on which the analogue output is to react. U I FrEq P q S PF tF tyPA Type of analogue output PrAd - current nAP - voltage AnL Lower threshold of the analogue output. It is the parameter defining the value on the display for which we want obtain 0 on the analogue output. In 4-digit execution: -1999...9999 - rms voltage - rms current - frequency - active power - reactive power - apparent power - power factor - ratio of reactive power to active power FI - angle phase EnP - active energy Enq - reactive energy EnS - apparent energy P_Au - 15 minutes’ mean active power U_Au- 10 minutes’ mean voltage F_ Au - 10 seconds’ mean frequency In 5-digit execution: -19999...99999 table 1 (continuation) Upper threshold of the analogue output. It is the parameter defining the value on the display for which we want obtain the max. value (20 mA or 10 V ) on the analogue output. In 4-digit execution: -1999...9999 bAud Baud rate of the RS-485 interface 2400 - 2400 bit/s 4800 - 4800 bit/s 9600 - 9600 bit/s trYb Kind of transmission through the RS-485 interface. OFF - interface off A8n1 - ASCII 8N1 A7E1 - ASCII 7E1 A7o1 - ASCII 7O1 r8n2 - RTU 8N2 r8E1 - RTU 8E1 r8o1 - RTU 8O1 Adr Device address 0... 247 SEt Writing down of manufacturer´s settings. A pressure of the key Parameter values set up by the causes the writing down of standard manufacturer are shown in the table 2. parameters into the meter. The execution of this operation is signalled by the inscription End. SEC Introduction of a new password tSt Display test. The test consists on the The pressure of the key causes the consecutive switching of digital display test switching on. The segments on. Alarm diodes and ends the test. highlighted diodes of the unit, should be lightend. AnH In 5-digit execution: -19999...99999 In 4-digit execution: -1999...9999 In 5-digit execution: -19999...99999 table 1 (continuation) Hour Setup of the current time 0.00...23.59 The introduction of an incorrect hour will cause its writing into the memory, but after the exit from the matrix the meter will make the correction of the error, i.e. the introduction of the 0.70 hour will cause that the meter will treat that as minutes and set up 1.10. JEd Unit highlighting switching on. On - highlighting switched on OFF - highlighting switched off CEnP Resetting of the active power counter. The pressure of the key will cause the resetting of the active power counter. CEnq Resetting of the reactive power counter. The pressure of the key will cause the resetting of the reactive power counter. CEnS Resetting of the apparent power counter. The pressure of the key will cause the resetting of the apparent power counter. CPAu Synchronisation of the 15 minutes’ mean active power. The pressure of the key will cause the measurement start of the 15 minutes’ mean active power. CUAu Synchronisation of the 10 minutes’ mean voltage. The pressure of the key will cause the measurement start of the 10 minutes’ mean voltage. ____ Exit of the parameter group from the chosen level. key The pressure of the causes the exit of the parameter group from the chosen level. a) nor Contact state 1 0 Relay switched on Relay switched off PrL PrH Measured quantity PrH > PrL b) nor Contact state 1 0 Relay switched off Relay switched on PrH PrL Measured quantity PrH < PrL c) OFF Contact state 1 Relay switched on 0 Relay switched on Relay switched off PrL d) On PrH Measured quantity Contact state 1 0 Relay switched off Relay switched on PrL PrH Relay switched off Measured quantity Fig. 6. Alarm type a), b) normal, c) switched off , d) switched on ! CAUTION ! ? · In case of On and OFF alarm types, the writing down of PrL>PrH will cause an automatic transcription of the value from the threshold PrL into PrH and from threshold PrH into PrL. The alarm type will not change. · In case of a measuring range exceeding the relay reaction is concordant with written down PrL, PrH and tYP parameters. In spite of displaying the exceeding, the meter will carry out the measurement as before. · In case of an individual characteristic switching on (Ind=On) the measurement result is transformed linearly in accordance with introduced H1, Y1, H2, Y2 parameters. The linear characteristic does not operate in case of selection as an input type of the current time. · The meter currently checks up the value of the actually introduced parameter. In case when the introduced value overruns the upper range of changes given in the table 1, the meter will automatically carry out the change into the minimal value. Similarly, in case when the introduced value overruns the lower range of changes given in the table 1, the meter will automatically carry out the change into the maximal value. " Table 2 Standard parameters of the meter Parameter symbol Level in the matrix Standard value tYP RAnU RAnI trU trI Aur UAL Ind H1,Y1,H2,Y2 d_P P_A1 P_A2 PrL1 PrH1 PrL2 PrH2 tYP1,tYP2 dLY1,dLY2 LEd1,LEd2 P_An tYPA AnL AnH bAud trYb Adr SEC Hour JEd 1 1 1 1 1 1 1 1 1 1 2 3 2 2 3 3 2,3 2,3 2,3 4 4 4 4 4 4 4 5 5 5 P 400U 5A 1 1 Cnt 2 OFF 0 1 U I 0 400.0 0.000 5.000 OFF 0 OFF I PrAd 0 5.000 9600 r8n2 1 0 0.00 On # 7. RS-485 INTERFACE N12 programmable digital meter series have their serial link in the RS-485 standard to communicate in computer systems and with other devices fulfilling the Master function. The MODBUS asynchronous character communication protocol has been implemented on the serial link. The transmission protocol describes the ways of information exchange between devices through the serial link. 7.1. Connection way of the serial interface The RS-485 standard enables the direct connection to 32 devices on a single serial link of 1200 m long. For the connection of a greater quantity of devices it is necessary to apply additional intermediate-separating systems. The lead out of the interface line is given in the meter service manual. To obtain a correct transmission it is necessary to connect lines A and B in parallel with their equivalents in other devices. A (TX) Computer PC B (RX) Maximum 1200 m A B A B B A N12 Meter N12 Meter N12 Meter Fig. 7. Way of the RS-485 interface connection $ The connection must be carried out with a screened lead. The screen must be connected to the protective grounding in a single point. The GND line serves to an additional protection of the interface line for long connections. One must connect it to the protective grounding (this is not necessary for the interface correct work). In order to obtain the connection with an IBM PC computer, an RS-485 interface card or a RS-232/RS-485 converter is indispensable. On the Fig. 7. the device connection is shown. The marking of the transmission line for the card in the PC computer depends on the card producer. 7.2. Description of the MODBUS protocol implementation The implemented protocol is compatible with the PI-MBUS-300 Rev G Modicon Company. Setting-up of meter serial link parameters in the MODBUS protocol: • • • • meter address baud rate working modes information unit • maximal response time 1...247 2400, 4800, 9600 bps ASCII, RTU ASCII: 8N1, 7E1, 7O1 RTU: 8N2, 8E1, 8O1 300 ms The parameter configuration of the serial link is described in the further parts of this service manual. It consists on the settlement of the baud rates (bAud parameter), device address (Adr parameter) and the information unit type (trYb parameter). Notice: Each meter connected to the communication network must have: • a unique address, different from addresses of other devices connected in the network, • an identical baud rate and information type. % 7.3. Description of used functions Following functions of the MODBUS protocol have been implemented in meters of N12 series: Description of functions Code Table 3 Meaning 03 Reading of n-registers 06 Writing of a single register 16 Writing of n-registers 17 Identification of the slave device Notice: In meters of N12 series the response frame to the function 17 looks as follows: Device address Function X 11 Number of bytes 08 Device identifier X Device state Field depending Control on the device type total FF XXXXXX Device address Function Number of bytes - depending on the set value - function No: 0x11; - 0x08; Device identifier - 0x60 - N12S - 0x61 - N12H - 0x62 - N12T - 0x63 - N12O - 0x64 - N12P - 0x65 - N12B Device state - 0xFF; Field depending on the device type - XXXXXX & Device name - transmitted as ASCII characters and defines the meter type S - 0x53, 53 X X X X X H - 0x48, 48 X X X X X T - 0x54, 54 X X X X X O - 0x4F, 4F X X X X X P - 0x50, 50 X X X X X B - 0x42, 42 X X X X X Number of displays - Field depending on the number of meter displays - 0x04 - 4-digit meters, X 04 X X X X - 0x05 - 5-digit meters, X 05 X X X X Nr of the programming version - programming version implemented in the meter X X _ _ _ _ - 4-byte variable of float type Control total - 2 bytes in the case of work in the RTU mode 1 byte in the case of work in the ASCII code - 1 byte in case of work in the ASCII code Example: Work in the RTU mode, e.g.: trYb=r8n2 (value 0x02 in the case of reading/writing through the interface). N12P meter Execution with a 4- digit display, Nr of the programming version 1.00, Device address set on Adr=0x01, For this type of meter the frame will have the following shape: Device address Function Number of bytes Device identifier Device state Field depending on the device type Control total (CRC) X 11 08 64 FF 50 04 3F 80 00 00 CD 30 ' 7.4. Register map of N12 meter Register map of the N12 series meter Table 4. Address range Value type 7000-7200 float (32 bits) The value is placed in two succesive 16 bit registers. Registers include the same data as 32-bit registers from the 7500 area. Registers are only for read-out. Description 7200-7400 float (32 bits) The value is placed in two succesive 16 bit registers. Registers include the same data as 32-bit registers from the 7600 area. Registers can be read out and written in. 7500-7600 float (32 bits) The value is placed in a 32-bit register. Registers are only for read out. 7600-7700 float (32 bits) The value is placed in a 32-bit register. Registers can be read-out and written in. 7.5. REGISTERS FOR WRITING AND READ-OUT The value is placed in two successive 16-bit registers. Registers include the same data as 32-bit register from the 7600 area. The value is placed in 32-bit registers N12P meters 7200 7600 Table 5. Symbol Identifier writing(w)/ read-out(r) r Range Description Device identifier _ Value 60 xx xx 04 xx 05 ! Identifier 4-digits execution 5-digits execution Table 5 (continuation) 7202 7601 tYP w/r 0... 15 Input type Value 0 1 2 3 4 5 6 7 Rms voltage Rms current Frequency Active power Reactive power Apparent power Power factor Ratio of reactive power to active power Phase angle Active energy Reactive energy Apparent energy 15 minutes mean active power 10 minutes mean voltage 10 seconds mean frequency current time 8 9 10 11 12 13 14 15 7204 7602 RanU w/r 0...1 Voltage input range Value 0 1 7206 7603 RanI w/r 0...1 100 V range 400 V range Current input range Value 0 1 7208 7604 trU w/r 0...99999 Voltage ratio Value 0...9999 0...99999 7210 7605 trI w/r 1 A range 5 A range 0...99999 4-digit meters 5-digit meters Current ratio Value 0...9999 0...99999 4-digit meters 5-digit meters ! Table 5 (continuation) 7212 7606 Aur w/r 0... 1 Kind of averaging Value 0 1 7214 7607 UAL w/r 0... 99999 Number of measurements Value 0... 9999 0... 99999 7216 7218 7220 7222 7224 7608 7609 7610 7611 7612 Con SCAL ConS E_In Auto 7226 7613 d_P 7228 7614 Cnt 7615 Ind w/r 0... 4 Decimal point 7616 H1 4-digit meters 5-digit meters No occurs1) w/r 0... 1 Indivigual characteristic Value 0 1 7232 4-digit meters 5-digit meters No occurs1) No occurs1) No occurs1) No occurs1) No occurs1) Value 0... 3 0... 4 7230 Arithmetical mean Stepping window w/r -1999... 19999 Characteristic switched off Characteristic switched on Parameter of the individual characteristic Value -1999...9999 4-digit meters -19999...99999 5-digit meters Number of Kind of input decimal places automatically set up Rms voltage automatically set up Rms current 0.00 automatically set up ! Frequency Powers Table 5 (continuation) 0.00 0.000 Energies Power factor 0.0 Ratio of reaktive power to active power 0.0 Phase angle automatically set up 0.0 0.00 - 15 minutesmean active power 10 minutesmean voltage 10 secondsmean frequency Current time The range of H1 and H2 parameters depends on the max. range of the input signal. The writing of the value with a greater number of significant places after the decimal point will cause its roundoff. Values beyond the range cause the return of the error code 03 (not allowed data value). 7234 7617 Y1 w/r -19999... 99999 Parameter of the individual characteristic Value 0... 9999 0... 99999 4-digit meters 5-digit meters The Y1, Y2, PrL1, PrH1, PrL2, PrH2, AnL, AnH parameter range after switching the characteristic on, depends only on the set decimal point d_P. The writing of the value with a greater number of significant places after the decimal point will cause its round-off. Values beyond the range cause the return of the error code 03 (not allowed data value). 7236 7618 H2 w/r -19999... 99999 Parameter of the individual characteristic Change range as for the H1 parameter 7238 7619 Y2 w/r -19999... 99999 Parameter of the individual characteristic Change range as for the Y1 parameter !! Table 5 (continuation) 7240 7620 P_A1 w/r 0...14 Kind of quantity type on which the alarm 1 is to react Value 0 1 2 3 4 5 6 7 8 9 10 11 12 13 14 7242 7621 PrL1 w/r -19999...99999 Rms voltage Rms current Frequency Active power Reactive power Apparent power Power factor Ratio of reactive power to active power Phase angle Active energy Reactive energy Apparent energy 15 minutes mean active power 10 minutes mean voltage 10 seconds mean frequency Lower threshold of alarm 1 Value -1999... 9999 4-digit meters -19999... 99999 5-digit meters For Ind=0 -OFF When the individual characteristic is switched out the range change will be as for the parameter H1 For Ind=0 - ON When the individual characteristic is switched on the range change will be as for the parameter Y1 7244 7622 PrH1 w/r -19999...99999 Upper threshold of alarm 1 Change range as for the PrL1 parameter 7246 7623 tYP1 w/r 0... 4 Type of alarm 1 Value 0 1 2 1 1 !" Normal Switched on Switched off Switched on manually Switched off manually Table 5 (continuation) 7248 7624 dLY1 w/r 0... 99999 Delay of alarm 1 Value 0... 9999 0... 99999 7250 7625 LEd1 w/r 0... 1 Support of alarm1 signalling Value 0 1 7252 7626 P_A2 w/r 0...14 4-digit meters 5-digit meters support switched off support switched on Kind of quantity type on which the alarm 1 is to react Value 0 1 2 3 4 5 6 7 8 9 10 11 12 13 14 7254 7627 PrL2 w/r -19999...99999 Rms voltage Rms current Frequency Active power Reactive power Apparent power Power factor Ratio of reactive power to active power Phase angle Active energy Reactive energy Apparent energy 15 minutes mean active power 10 minutes mean voltage 10 seconds mean frequency Lover threshold of the alarm 2 Change range as for the PrL1 parameter 7256 7628 PrH2 w/r -19999...99999 Lover threshold of the alarm 2 Change range as for the PrL1 parameter !# Table 5 (continuation) 7258 7629 tYP2 w/r 0... 4 Type of alarm 2 Value 0 1 2 3 4 7260 7630 dLY2 w/r 0... 99999 Delay of alarm 2 Value 0... 9999 0... 99999 7262 7631 LEd2 w/r 0... 1 7632 7633 TYPO ConO 7268 7634 P_an 4-digit meters 5-digit meters Support of alarm2 signalling Value 0 1 7264 7266 Normal Switched on Switched off Switched on manually Switched off manually support switched off support switched on No occurs1) No occurs1) w/r 0...14 Kind of quantity type on which the analogue output will be to react Value 0 1 2 3 4 5 6 7 8 9 10 11 12 13 14 !$ Rms voltage Rms current Frequency Active power Reactive power Apparent power Power factor Ratio of reactive power to active power Phase angle Active energy Reactive energy Apparent energy 15 minutes mean active power 10 minutes mean voltage 10 seconds mean frequency Table 5 (continuation) 7270 7635 TYPA w/r 0... 1 Type of analogue output Value 0 1 7272 7636 AnL w/r -19999...99999 current voltage Lover threshold of the analogue output Change range as for the PrL1 parameter 7274 7637 AnH w/r -19999...99999 7276 7638 Hour w/r 0...99999 Upper threshold of the analogue output Change range as for the PrL1 parameter Current time This parameter occurs with two places after the decimal point in the gg.mm format, where: gg - means hours mm - means minutes In case of the minute introduction with a value greater than 0.59 (e.g. 0.70), the meter will carry out the correction and write the value 1.10. In case of the hour introduction with a value greater than 23 (e.g. 27), the meter will carry out the correction of the error and write the value 3.00 7278 7639 JEd w/r 0... 1 Switching on of switching off of the unit highlighting Value 0 1 Highlighting switched off Highlighting switched on occurs only in 5-digit meters 7280 7640 Del_min w/r 0... 1 Erasing of the minimal value Value 0 1 7282 7641 Del_maks w/r 0... 1 Erasing of the maximal value Value 0 1 7284 7642 lack of operation Erasing of the minimal value lack of operation Erasing of the maximal value Start/stop/ No occurs1) resetting !% Table 5 (continuation) 7286 7643 CEnP w 0... 1 Resetting of the active energy counter Value 0 1 7288 7644 CEnq w 0... 1 Resetting of the active energy counter Value 0 1 7290 7645 CEnS w 0... 1 7646 CPAu w 0... 1 7647 CUAu w 0... 1 lack of operation start of the synchronization of the 15 minutesmean power Synchronization of the 10 minutes’mean voltage Value 0 1 1) lack of operation Resetting of the apparent energy counter Synchronization of the 15 minutes’mean power Value 0 1 7294 lack of operation Resetting of the reactive energy counter Resetting of the apparent energy counter Value 0 1 7292 lack of operation Resetting of the active energy counter lack of operation start of the synchronization of the 10 minutesmean voltage In case of registers no occurring in the given series of meters, their value is equal 1E+20 !& The value is placed in 32-bit registers The value is placed in two successive 16-bit registers. Registers include the same data as 32-bit register from the 7500 area. 7.6. Registers only to read-out Name 3 Writing (w) Read-out (r) Unit Name of the quantity 1 2 4 5 7000 7500 Identifier r - Constant identifying the device. 0 x 64 - N12P 6 7002 7501 Status r - Status is the register describing the current state of the meter. 7004 7502 Steering r % It is the register describing the steering of the analogue output. 7006 7503 Minimum r - Minimal value of the currently displayed value. 7008 7504 Maximum r - Maximal value of the currently displayed value. 7010 7505 Displayed value r - Currently displayed value 7012 7506 No occurs1) 7014 7507 No occurs1) 7016 7508 No occurs1) 7018 7509 U r V Rms voltage 7020 7510 I r A Rms current 7022 7511 P r W Active power 7024 7512 Q r VAr Reactive power 7026 7513 S r VA 7028 7514 PF r - Power factor 7030 7515 tF r - Rato of reactive power to active power 7032 7516 Fi r ° Angle phase 7034 7517 Freq r Hz Frequency 7036 7518 E_nP r Wh Active energy 7038 7519 E_nQ r VArh Reactive energy 7040 7520 E_nS r VAh Apparent energy Apparent power !' 1 2 7042 7521 P_Au 3 7044 7522 U_Au 7046 7523 F_Au 7048 7524 Hour r gg.mmss 7050 7525 U_min r V Minimal value of rms voltage 7052 7526 U_max r V Maximal value of rms voltage 7054 7527 I_min r A Minimal value of rms current 7056 7528 I_max r A Maximal value of rms current 7058 7529 P_min r W Minimal value of active power 7060 7530 P_max r W Maximal value of active power 7062 7531 Q_min r VAr Minimal value of reactive power 7064 7532 Q_max r VAr Maximal value of reactive power 7066 7533 S_min r VA Minimal value of the apparent power 7068 7534 S_max r VA Maximal value of the apparent power 7070 7535 PF_min r - 7072 7536 PF_max r - Maximal value of the power factor 7074 7537 t F_min r - Minimal value of the ratio of the reactive power to the active power 7076 7538 t F_max r - Maximal value of the ratio of the reactive power to the active power 7078 7539 Fi_min r ° Minimal value of the phase angle 7080 7540 Fi_max r ° Maximal value of the phase angle 7082 7541 Freq_min r Hz Minimal value of the frequency 7084 7542 Freq_max r Hz Maximal value of the frequency 7086 7543 P_An_min r W Minimal value of the 15 minutes mean active power 7088 7544 P_An_max r W Maximal value of the 15 minutes mean active power 7090 7545 U_An_min r W Minimal value of the 10 minutes mean voltage 7092 7546 U_An_max r W Maximal value of the 10 minutes mean voltage 7094 7547 F_An_min r Hz Minimal value of the 10 seconds mean frequency 7096 7548 F_An_max r Hz Maximal value of the 10 seconds mean frequency 1) " 4 5 r W 15 minutesmean active power 6 r V 10 minutesmean voltage r Hz 10 secondsmean frequency Current time Minimal value of the power factor In case of registers no occuring in the given series of meters, their value is equal 1E+20 Caution! At the moment of the upper or lower range exceeding, parameters „Displayed value’ „minimum’, „maximum” are set up on 1 E+20. Relay state (alarm) 1 Individual characteristic or lack of it X Relay state (alarm) 2 X X X X X X bits 15 14 13 12 11 10 9 X X X X X X 5 4 3 2 1 0 Signalling of the upper range overrunning Signalling of the lower range overrunning X Position of the decimal piont X Baud rate Kind of output (voltage, current) X Working mode and information unit Kind of display Compensation error of lead resistance Description of the status register 8 7 6 MSB LSB Bit-15 Kind of display 0 - meter with a 4-digit display 1 - meter with a 5-digit display Bit-14 Compensation error of the lead resistance 0 - lack of error 1 - signalling a compensation error Caution! This bit is only set in the N12T meter. For other types of N12 meter executions, the value of this bit is optional. Bit-13 Kind of output (voltage, current) 0 - current 1 - voltage " Bit-12...10 Working mode and information unit 000 - interface switched off 001 - 8N1 - ASCII 010 - 7E1 - ASCII 011 - 7O1 - ASCII 100 - 8N2 - RTU 101 - 8E1 - RTU 110 - 8O1 - RTU Bit-8...9 Baud rate 00 - 2400 bit/s 01 - 4800 bit/s 10 - 9600 bit/s Bit-5...7 Position of the decimal point 000 - lack 001 - 0.0 010 - 0.00 011 - 0.000 100 - 0.0000 (only for 5-digit meter executions) Bit-4 Signalling of the range upper overrunning 0 - normal work 1 - range overrunning Bit-3 Signalling of the range lower overrunning 0 - normal work 1 - range overrunning Bit-2 Relay state (alarm 2) 0 - switched off 1 - switched on Bit-1 Relay state (alarm 1) 0 - switched off 1 - switched on Bit-0 Individual charakteristic 0 - Individual charakteristic switched off 1 - Individual charakteristic switched on " 8. TECHNICAL DATA Panel meter dimensions 96 ´ 48 ´ 93 mm Protection index ensured by the housing IP 65 Protection index ensured from the terminal side IP 20 Rated operating conditions: • supply voltage depended on the execution code • supply voltage frequency • ambient temperature • air relative humidity 85...230...253 V a.c. d.c. 20...24...40 V a.c. d.c. 40...50...440 Hz -20...23...500C < 95% (water vapour condensation inadmissible) Power consumption max 7 VA Storage temperature -20...+850C Display field: N12P4 four 7-segment LED displays and two alarm diodes N12P5 five 7-segment LED displays, two alarm diodes, and two diodes for the unit highlighting Indication range of the digital display: N12P4 -1999...9999 N12P5 Servicing -19999...99999 four keys "! Relay outputs • programmable alarm thresholds, • three types of alarms (see chapter 6), • hysteresis defined by means of the lower and upper alarm threshold, • signalling of alarm action by means of diodes, • programmable delay of the alarm operation, • two relay outputs, • voltageless make contacts - maximal load capacity: - voltage: 250 V a.c., 150 V d.c. - current: 5 A 30 V d.c., 250 V a.c. - resistance load: 1250 VA, 150 W Analogue output • • • • • current programmable 0/4...20 mA - load resistance £ 500 W, voltage programmable 0...10 V - load resistance ³ 500 W, galvanic insulation, resolution 0.01% of the range, basic error ± (0.1 % i.v.+ 0.2% u.l.)2. Digital output • RS-485 interface , • MODBUS transmission protocol: - ASCII: 8N1, 7E1, 7O1 - RTU: 8N2, 8E1, 8O1, • Baud rate: 2400, 4800, 9600 bauds, • Maximal response time for query frame: 300 ms Fastness against supply decays acc. EN 61000-6-2:2002 Electromagnetic compatibility: • immunity • emission 2 "" i.v. - indicated value u.l.- upper limit of the measuring subrange acc. EN 61000-6-2:2002 acc. EN 61000-6-4:2002 Safety requirements: according IEC 61010-1 standard: • installation category • level of polution • maximal voltage in relation to the earth Parameters of the meter: • prolonget overrunning of the upper range Kind of input III 2 600 V a.c. 20% Rated indication range 5 digits Basic error 4 digits Rms voltage 1...100.0 1...100.0 ±(0.1% i.v. + 0.2 % u.l.)2 Rms voltage Rms current Rms current Frequency 4...400.0 0.01...1.000 0.05...5.000 10.00...100.00 4...400.0 0.01...1.000 0.05...5.000 10.00...99.99 ±(0.1% i.v. + 0.2 % u.l.) ±(0.1% i.v. + 0.2 % u.l.) ±(0.1% i.v. + 0.2 % u.l.) ±(0.1% i.v. + 0.1 % u.l.) Active power Reactive power Apparent power Power factor Ratio of reactive power to the active power Angle phase Active energy Reactive energy Apparent energy 15 minutes active power 10 minutes voltage 10 minutes voltage 10 seconds frequency Current time -19999...99999 -19999...99999 -19999...99999 -1.000...1.000 -1999...9999 -1999...9999 -1999...9999 -1.000...1.000 ±(0.1% i.v. + 0.5 % u.l.) ±(0.1% i.v. + 0.5 % u.l.) ±(0.1% i.v. + 0.5 % u.l.) ±(0.1% i.v. + 1% u.l.) 3 -100.0...100.0 0...359.9 -19999...99999 -19999...99999 -19999...99999 -19999...99999 1...100.0 4...400.0 10.00...100.00 0.00...23.59 -100.0...100.0 0...359.9 -1999...9999 -1999...9999 -1999...9999 -1999...9999 1...100.0 4...400.0 10.00...99.99 0.00...23.59 ±(0.1% i.v. + 1% u.l.) 3 ±(0.1% i.v. + 1% u.l.) 3 ±(0.1% i.v. + 0.5% u.l.) ±(0.1% i.v. + 0.5% u.l.) ±(0.1% i.v. + 0.5% u.l.) ±(0.1% i.v. + 0.5% u.l.) ±(0.1% i.v. + 0.2% u.l.) ±(0.1% i.v. + 0.2% u.l.) ±(0.1% i.v. + 0.1% u.l.) 1 second/24 hours 2 i.v. - indicated value u.l. - upper limit of the measuring sub range 3 error in the range 10...20% of the I or U range "# Measurement of the rms a.c. voltage The voltage value is calculated according the formula: U sk = trU • 1 n 2 ∑ ui n i =1 Basic error in reference conditions: ±(0.1% i.v. + 0.2% u.l.) Calculation of the mean value in the walking period of time: U srsk = 1 n ∑ U SK1 n i =1 Where: n - averaging time in seconds Usk - real rms value in the voltage period Usrsk - mean value changing in the time of the rms voltage value Basic error: ±(0.1% i.v. + 0.2% u.l.) Calculation of the 10 minutes’ voltage U r = 1 10 ∑ U ski n i =1 Basic error: ±(0.1% i.v. + 0.2% u.l.) Measurement of the real rms a.c. current The value of the current is calculated according the formula I sk = trI • "$ 1 n 2 ∑ ii n i =1 trI - ratio of the current transformer n - number of samples in the period or in the multiple of the measured current period i - actual value of the current Where: Basic error in reference conditions: ±(0.1% i.v. + 0.2% u.l.) Calculation of the mean value in the walking period of time: I srsk = Where: 1 n ∑ I SK n i =1 1 n - averaging time in seconds Isk - real rms value in the voltage period Isrsk - mean value changing in the time of the rms current value Basic error: ±(0.1% i.v. + 0.2% u.l.) Measurement of the a.c. active power The active power of the distorted current is calculated according the formula: P = trU • trI • Where: 1 n ∑ ui ⋅ ii n i =1 trU - ratio of the voltage transformer trI - ratio of the current transformer n - number of samples in the period or in the multiple of the measured current period u - actual value of voltage i - actual value of current Basic error in reference conditions: ±(0.1% i.v. + 0.5% u.l.) "% Calculation of the mean value in the walking period of time Psr = Where: 1 n ∑ Pi n i =1 n - averaging time in seconds Pi - value of the active power in the period of the measured signal Psr - mean value changing in the time of the active power value Basic error: ±(0.1% i.v. + 0.5% u.l.) Calculation of the active power energy Ep = 1 n ∑ aPi n i =1 Basic error: ±(0.1% i.v. + 0.5% u.l.) Measurement of the a.c. apparent power The apparent power is calculated according the formula: S = trU • trI • U SK • I SK Where: trU trI Usk Isk - ratio of the voltage transformer - ratio of the current transformer - real rms value of the voltage - real rms value of the current Basic error in reference conditions: ±(0.1% i.v. + 0.5% u.l.) Counting of the apparent power energy: ES = 1 n ∑ aSi n i =1 Basic error: ±(0.1% i.v. + 0.5% u.l.) "& Measurement of a.c. reactive power The reactive power is calculated according the formula: Where: trU - ratio of the voltage transformer trI - ratio of the current transformer S - apparent power P - active power ( Q = trU • trI • sign S 2 − P 2 ) Basic error in reference conditions: ±(0.1% i.v. + 0.5% u.l.) Counting of the reactive power energy: EQ = 1 n ∑ aQi n i =1 Basic error: ±(0.1% i.v. + 0.5% u.l.) Measurement of the a.c. power factor - cosj The power factor is calculated according the formula: cos ϕ = Where: P S P - active power S - apparent power Basic error in reference conditions: ±(0.1% i.v. + 1% u.l.) "' Measurement of the ratio of the reactive power to the active power - tgj The ratio of the reactive power to the active power is calculated according the formula: Q tg ϕ = P Where: Q - reactive power P - active power Basic error in reference conditions: ±(0.1% i.v. + 1% u.l.) Measurement of the a.c. voltage frequency The frequency of the voltage is calculated according the formula: f = Where: 1 T T - period of a.c. voltage f - frequency (current value of one period ) Basic error in reference conditions: ±(0.1% i.v. + 0.1% u.l.) Calculation of the 10 seconds’ frequency: 1 n ∑ fi n i =1 Where: n - averaging time in seconds fi - frequency value in the period of the measured signal fsr - mean value changing in the time of the frequency value Basic error: ±(0.1% i.v. + 0.1% u.l.) f r = # Preheating time 15 minutes Weight 200 g Repetition time of the measurement programmable, min. 500 ms 9. BEFORE A FAILURE WILL BE DECLARED ? SYMPTOMS PROCEDURE 1. The meter does not operate Check the connection of the feeder cable 2. Only the diodes are lighting Number of measurements = 0 has been introduced. The meter operates in the SLEEP mode - the display is blanked. 3. Only the horizontal dashes are displayed Check the correctness of the input signal connection. See in the service manual. 4. Only the inscription noC is displayed The meter is discalibrated, Contact the nearest authorized service workshop. 5. Lack of possibility to enter into the programming mode. The inscription ErrC is displayed. The programming mode is protected by the password. If the user forgets which password has been introduced one must contact the nearest authorized service workshop. 6. Lack of certainty if all display segments are efficient Enter into the service mode and switch on the display test. Simultaneously the same segments should be lighted on all displays. The state with blanked displays does never occur. Otherwise, submit the defect to the nearest authorized service workshop. # 7. During the operation in the programming mode, parameter values inconsistent with the range of changes given in the table 1, appear on the display Enter into the service mode and accept the SEt parameter. The meter will introduce values in accordance with the table 2. 8. A result inconsistent with our expectations occurs on the display. Check if the individual characteristic is not switched on. In case of necessity, enter into the service mode and accept the SEt parameter. The meter will introduce parameters in accordance with the table 2. 9. H1, Y1, H2, Y2, d_P parameter symbols are not displayed in the programming mode. In case of switched individual characteristic off, mentioned symbols are omitted. 10. Despite of the alarm threshold exceeding, neither the alarm relay nor the signalling diode is switched on. Check the introduced delay of the alarm operations into the meter. If need be, correct the dLY parameter. 11. Despite of the relay switching off, the alarm diode does not go out. Check if the alarm signalling support is not switched on. LEd parameter off. In case of need, switch it off. 12. When the parameter of the alarm The alarm still lasts. The erased signalling support is switched on, diode is immediately re-lighted. lack of possibility to erase the signalling diode by means of the key combination. (Fig. 4.). 13. Despite the fact that the alarm still remains, the signalling diod does not light up. Check if a delay of the alarm operation has not been introduced. dLY parameter 14. Instead to display the measurement result, the meter displays the parameter symbol alternately with its value despite we were not entered into the programming mode. The meter works in the monitoring mode. # 15. A delay of the alarm operation has been introduced, e.g. 30 measurements, however after this time the alarm has not operate. The lasting alarm state was shorter than the programmed, e.g. during the lasting time of the alarm the state of alarm withdrawal occurs. In that case the meter begins counting the measurements from the beginning. 16. The meter does not establish a communication with the computer. Check whether leads of interface (A, B, GND) were correctly connected. Then, check the setting of the interface (trYb, bAud, Adr) in the programming matrix. These parameters must be the same as in the used software. 10. PROGRAMMING EXAMPLES OF N12 METERS Example 1 - Programming of an individual characteristic. If we want to programme so that to the value 0.0 V will correspond the value 0 on the display, whereas to the value 400.0 V will correspond the value 10000, one must: l choose as the type of the input quantity, the measurement of the voltage U, l chose the Ind parameter, and switch the individual characteristic on, l chose the parameter H1 and introduce the value 0.0, l pass on the Y1 parameter and introduce the value 0, l pass on the H2 parameter and introduce the value 400.0, l pass on the Y2 parameter and introduce the value 10000, l pass on the d_P parameter and set the point on 00000. #! Example 2 - Programming of an inverse individual characteristic. If we want to programme so that to the value 5.000 A will correspond the value 0.00 on the display, whereas to the value 0.000 A will correspond the value 100.00, one must: l choose as the type of the input quantity the measurement of the current I, l choose the Ind parameter and switch the individual characteristic on, l choose the H1 parameter and introduce the value 0.000, l pass on the Y1 parameter and introduce the value 100.00, l pass on the H2 parameter and introduce the value 5.000, l pass on the Y2 parameter and introduce the value 0.00, l pass on the d_P parameter and set the decimal point on the position 000.00. Example 3 - Programming of the alarm with hysteresis If we want to programme the alarm 1 operation so that the alarm will be switched on at the value 400.0 V, whereas switched off at the value 100.0 V, and the alarm 2 so that at the value 5.000 A the alarm will be switched off and switched on at the value 1.000 A, one must: l enter into the programming mode and choose the level with the ALr1 symbol, l pass on the P_A1 parameter and set U, l pass on the PrL1 parameter and introduce the value 100.0, l pass on the PrH1 parameter and introduce the value 400.0 l pass on the tYP1 parameter and choose the function designed as nor, l exit from the ALr1 level and pass on the ALr2 level, l pass on the P_A2 parameter and introduce I, l choose the PrL2 parameter and introduce the value 5.000, l pass on the PrH2 parameter and introduce the value 1.000, l pass on the tYP2 parameter and choose the function nor. #" Example 4 - Programming of an alarm operating in the given interval with delay. If we want that the alarm 1 will be switched on in the interval from 100.0 V up to 300.0 V and operated only after 10 sec, one must: l enter into the programming mode and choose the ALr1 level, l pass on the P_A1 parameter and set U, l pass on the PrL1 parameter and introduce the value 100.0, l pass on the PrH1 parameter and introduce the value 300.0, l pass on the tYP1 parameter and choose the On function, l pass on the dLY1 parameter and set 10 if UAL=2 , in the contrary dLY = 10/(UAL x 0.5s), l exit from the programming mode. In case of the alarm state duration for a time longer than 10 sec., the meter will switch the alarm relay on and the alarm diode will be lighted. Example 5 - Programming of the analogue output If we want to program so that to the 0.000 A value will correspond the 4 mA value on the current analogue output, whereas to the 5.000 A value will correspond the 20 mA value, one must: l enter into the programming mode. Pass on the P_An parameter and choose the current I as the type of the input quantity, l pass on the tYPA parameter responsible for the analogue output type. Choose the PrAd current output. l under the AnL parameter, one must write down the value of the input signal for which we want 0 mA on the analogue output. For this reason one must calculate the AnL parameter: (5.000-0.000)/(20.00-4.00) = 0.3125 => 0.000 - (4.00 x 0.3125) = -1.250 l choose the AnL parameter and introduce the value - 1.250 l choose the AnH parameter and introduce the value 5.000 ## 11. EXECUTION CODES N12 METER X X X X X XX X Input temperature, programmable input ................. T 1 V d.c., 10 V d.c., 20 mA d.c, 200 mA d.c. ... S 600 V d.c. , 1 A d.c. , 5 A d.c. ....................... H revolutions, frequency, period, pulses ........... O single-phase network parameters .................. P indicator for synoptic panels .......................... B on order .......................................................... X Number of display 4 x 20 mm high digits ............................... 4 5 x 14 mm high digits + unit ..................... 5 Display colour Red .................................................................. 0 Green ............................................................... 1 Supply voltage 230 V a.c. d.c. ........................................................ 1 24 V a.c. d.c. .......................................................... 2 Kind of terminals Socked-plug with screw connections ............................. 0 Socked-plug with self-locking connections ..................... 1 Execution standard ............................................................................... 00 custom-made ....................................................................... XX Acceptance tests Without a quality acceptance certificate ....................................... 0 With a quality inspection certificate .............................................. 1 acc. customer’s agreement .......................................................... X *) Introduce the unit symbol #$ XXX unit symbol *) Order example: N12P-5-0-1-0-00-0-kW means: a N12P digital meter of single-phase network parameters , with 5 displays in red colour, voltage supply: 230 V a.c., d.c., kind of terminal: socket-plug with screw connection, standard execution, without a quality acceptance certificate, with the highlighted kW unit. In case of a custom-made execution or need of more detailed technical information please contact our Export Department. In case of any meter failure one must contact the nearest authorized service workshop. 12. MAINTENANCE AND GUARANTEE The N12P meter does not require any periodical maintenance. In case of some incorrect unit operations: 1. In the period of 12 months from the date of purchase: One should take the meter down from the installation and return to the Manufacturer’s Quality Control Dept. If the unit has been used in compliance with the instructions, the manufacturer guarantees to repair it free of charge. 2. After the guarantee period: One should turn over the meter to repair in a certified service workshop. The disassembling of the housing causes the cancellation of the granted guarantee. Spare parts are available for the period of ten years from the date of purchase. We reserves the right to make changes in design and specifications of any products as engineering advances or necessity requires. #% SALES PROGRAMME MEASUREMENT § DIGITAL PANEL METERS CONTROL § BARGRAPH INDICATORS RECORDING § MEASURING TRANSDUCERS § ANALOGUE PANEL METERS (DIN INSTRUMENTS) § DIGITAL CLAMP-ON METERS § PROCESS and HOUSEHOLD CONTROLLERS § CHART and SCREEN RECORDERS § POWER CONTROL UNITS and FREQUENCY INVERTERS § AUTOMOTIVE DASHBOARD INDICATORS § STATIONARY and PORTABLE CALIBRATORS § MEASUREMENT ACCESSORIES (SHUNTS, SENSORS, TRANSFORMERS) § MEASURING SYSTEMS (ENERGY, HEAT, CONTROL, MEASUREMENT) § CUSTOM-MADE PRODUCTS WE ALSO OFFER OUR SERVICES IN THE PRODUCTION OF: § ALUMINIUM ALLOY PRESSURE CASTINGS § PRESSURE CASTING DIES AND INJECTION MOULDS § PRECISION ENGINEERING AND THERMOPLASTICS PARTS QUALITY PROCEDURES: According ISO 9001 international requirements. Tel.: (48-68) 3295 100 (exchange) Fax: (48-68) 3295 101 e-mail:[email protected] http://www.lumel.com.pl Export Department: Tel.: (48-68) 3295 302 or 304 Fax: (48-68) 3254 091 e-mail: [email protected] #& March 2002 Lubuskie Zak³ady Aparatów Elektrycznych LUMEL S.A. ul. Sulechowska 1, 65-022 Zielona Góra, Poland