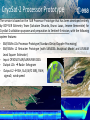
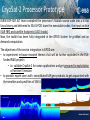
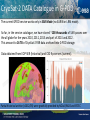
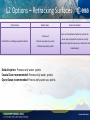
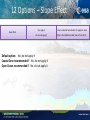
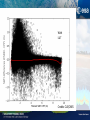
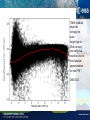
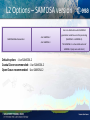
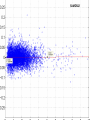
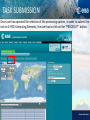
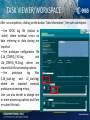
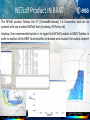
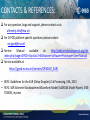
1
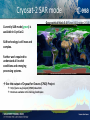
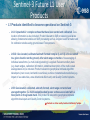
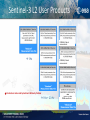
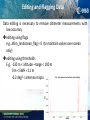
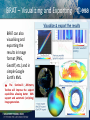
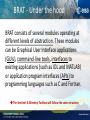
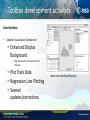
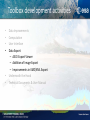
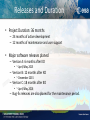
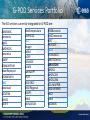
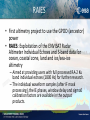
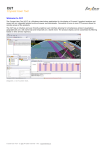
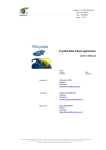
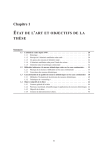
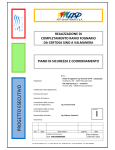
Presentation Outline • SEOM – What is SEOM • Sentinel-3 – Quick view and data products • BRAT – Current toolbox capabilities • Sentinel-3 Altimetry Toolbox – Next generation toolbox • Other tools • SARvatore – ESA G-POD System Introduction – CryoSat-2 SAR Processing Service walkthrough and options SEOM • SEOM element objectives : • Federate, support and expand the research community • Strengthen the leadership of European EO research community • Enable the science community to address new scientific research ACTION LINES Research and Development Studies Scientific Toolboxes development Science Users Consultations Training Next Generation of Earth Observation Scientists Promoting Science Data use and Results Launching state-of-the-art R&D studies for scientific exploitation of operational missions Developing, validating and maintaining open-source, multimission, scientific software toolboxes Organising a series of regular international thematic workshops for science users consultation and gathering science users feedback Offering a multi-year programme of advanced international training courses, summer schools and educational materials Promoting scientific use of data and ensuring a responsive ESA channel for regular, timely, high-quality scientific publications ACTION LINES Research and Development Studies Scientific Toolboxes development Science Users Consultations Training Next Generation of Earth Observation Scientists Promoting Science Data use and Results Workshops/Symposia Science User Consultations • Living Planet Symposium 2013: the 2013 Living Planet Symposium organised with UKSA, Edinburgh, United Kingdom 9 -13 September www.esa.int/LivingPlanet2013 (with 1700 participants from 60 countries) • COASTALWorkshop : 8TH Coastal Altimetry workshop focused on the future Sentinel-3 Topography Mission 2324 October 2014 http://www.coastalaltimetry.org Ref. ESA/PB-EO(2013)5, EOEP-4 D&E component Draft workplan 2013 Workshops/Symposia User Training • TRAINING COURSE on OCEAN REMOTE SENSING, Cork Ireland , 23-27 Sept.2013 • ~ 60 students • SAR Altimetry Training • Lake Constance (DE) • 21 and 22 October 2014 Ref. ESA/PB-EO(2013)5, EOEP-4 D&E component Draft workplan 2013 The Sentinel-3 Satellite Main satellite characteristics • 1250 kg maximal mass • Volume in 3.89 m x 2.202 m x 2.207 m • Average power consumption of 1100 W • 7.5 years lifetime (fuel for 5 add. years) • Large cold face for optical instruments thermal control • Modular accommodation for a simplified management of industrial interfaces • Launch S3A expected 2015 Microwave Radiomete r Ocean and Land Colour Instrument Sea and Land Surface Temperature Radiometer TBC X-band Antenna Solar Panel Observation Data Management Laser Retro• 170 Gbit of observation data per orbit Reflector • Space to ground data rate 2 x 280 Mbps X-Band • 1 contact per orbit • 3h delivery timeliness (from satellite sensing) DORIS Antenna SAR Radar Altimeter S-band Antenna Sentinel-3 Orbit and Coverage Topography Mission: ground track repeatability, dense spatial sampling SRAL (>2 km) and MWR (20 km) nadir track 1400 km SLSTR (nadir) 740 km SLSTR (oblique) 1270 km OLCI Altimetry mission Configuration Constellation 1 Satellite 2 Satellites Main 27-day cycle intertrack separation at equator 104 km 52 km 4-day sub-cycle intertrack separation at the equator Min = 104 km Min = 57 km Max = 728 km Max = 671 km Orbit type Repeat cycle LTDN Average altitude Inclination Repeating frozen SSO 27 days (14 + 7/27 orbits/day) 10:00 hr 815 km 98.65 deg Cryosat-2 SAR mode Currently SAR mode (green) is available in CryoSat-2. Geographical Mask 3.6 (Since 06 October 2014) SAR technology is still new and complex . Further work required to understand all in-orbit conditions and emerging processing systems. See the output of Cryosat for Oceans (CP4O) Project http://satoc.eu/projects/CP4O/index.html Brochure available in the training/conference Sentinel-3 Acquisition mode Original operational baseline: split between LRM and SAR mode Autumn 2013: Request by the Copernicus user community to extend usage of SAR mode for the S-3 SRAL instrument up to 100% of Earth coverage -> ESA/EUMETSAT assessment approved by EC now for implementation, subject to a detailed cost/schedule assessment and final go ahead by EU Note: it is assumed that the LRM shall be kept as a back-up to reduce operational risks and to allow a possible switch to the LRM scenario if necessary 100% SAR mode SAR mode over land, sea ice and coastal areas Low Resolution Mode (LRM) over open ocean Sentinel-3 and SAR mode • Previously on L2 products were to be made available, but it was decided to release also L1 products. • Expected advantages by ESA: – Foster a new generation of SAR altimetry specialists maintaining Europe at the competitive edge – Enhance current and develop of new products over the Earth surface (ocean, ice and land) within GMES – Enhance uptake, application, and quality control (e.g. transponder calibration) of SRAL SAR data products by the GMES user community – Possibly reduce large-scale reprocessing efforts (because starting from intermediate L1 products rather than from L0) Sentinel-3 Future L1 User Products • L1 Products identified to become operational on Sentinel-3: – L1A: Unpacked L0 complex echoes that have been sorted and calibrated. Geolocation information is also included. Product relevant to SAR processing specialists allowing fundamental studies on SAR processing such as Doppler beam formation and for calibration studies using ground-based Transponders. – L1B-S: Geo-located, calibrated azimuth formed complex (I and Q) echoes related to a given location on the ground, after slant range correction. No averaging of individual waveforms (i.e.multi-looking/stacking) is applied. Relevant ancillary data (e.g. beam angles, calibration information, statistical description of the multi-looked average/stack etc) is included. Product relevant to geophysical retrieval algorithm developers (over ocean, land and ice surfaces), surface characterisations studies (e.g. impact of sea state bias, wave directional effects etc) and Quality Control systems. – L1B: Geo-located, calibrated, azimuth formed, slant range corrected and averaged together (i.e multi-looked/stacked) power echoes associated with a fixed point on the ground-track. This product is relevant to geophysical retrieval algorithm developers and Quality Control systems. Products are to be read by Sentinel-3 Altimetry Toolbox Sentinel-3 L2 User Products PLRM Ku/C band measurement 1Hz PLRM Ku/C band measurement Products are to be read by Sentinel-3 Altimetry Toolbox 1Hz + 20 Hz PLRM waveforms 1Hz + 20 Hz + WF BRAT - Introduction • The Basic Radar Altimetry Toolbox (BRAT) was launched in 2005 as a joint project funded by ESA (European Space Agency) and CNES (Centre National d'Etudes Spatiales). • Last version 3.10 was launched in March 2012 and had around 1200 unique downloads (that about 12 new users per week!). Tool available for free download at • earth.esa.int/brat • altimetry.info BRAT Main Functions: • Data Import and Quick Look: basic tools for extracting data from standard formats and generating quick-look images • Data Export: output of data to NetCDF (ASCII dump provided). Raster images (png, jpeg, bmp, tiff, pnm) can be saved. KML + tiff output also possible. • Statistics: calculation of statistical parameters ( e.g. rms, average, variance) • Combinations: computation of combinations of data fields • Resampling: over and under sampling of data, data binning, filtering, smoothing • Data editing: data selection using simple criteria or a combination of criteria • Exchanges: data editing and combinations can be exchanged between users • Data visualisation: Display of results, with user-defined preferences. BRAT – Data Reading Capabilities • BRAT is used to read and display all the past and present Radar Altimetry missions’ products. Sentinel-3 Products are to be read by Sentinel-3 Altimetry Toolbox Cannot be handled by BRAT BRAT – Processing Capabilities New/Updated formulas for Sentinel-3 Altimetry Toolbox BRAT provides support for ingesting, processing (computation of formulas involving combinations of data fields; resampling of data; data selection using one/several criteria), generating statistics. Editing and Flagging Data Data editing is necessary to remove altimeter measurements with low accuracy editing using flags e.g. altim_landocean_flag = 0 (to maintain values over ocean only) editing using thresholds E.g. -130 m < altitude –range < 100 m 0 m < SWH < 11 m -0.2 deg² < antenna mispointing < 0.11 deg² Resampling and Filtering Data Data Binning enables users to fill up the gap between the satellite tracks by extrapolation, filtering and smoothing BRAT – Visualizing and Exporting BRAT can also visualising and exporting the results in Image format (PNG, Geotiff, etc.) and in simple Google Earth’s KML. The Sentinel-3 Altimetry Toolbox will improve the export capabilities allowing better KML support and automatic (scripting) image generation. BRAT - Under the hood BRAT consists of several modules operating at different levels of abstraction. These modules can be Graphical User Interface applications (GUIs), command-line tools, interfaces to existing applications (such as IDL and MATLAB) or application program interfaces (APIs) to programming languages such as C and Fortran. The Sentinel-3 Altimetry Toolbox will follow the same structure. Radar Altimetry Tutorial The Radar Altimetry Tutorial (RAT) is also part of the BRAT suite and gives general information about altimetry, the techniques involved and their applications, as well as an overview of the missions. It also presents a series of data use cases, covering all uses of altimetry over ocean, cryosphere and land, showing the basic methods for some of the most frequent manners of using altimetry data. The Sentinel-3 Altimetry Toolbox will have more tutorial material Sentinel-3 Altimetry Toolbox • In order to correct some of the shortcomings of BRAT and update the Altimetry Tolbox to handle Sentinel-3 data ESA has issued an ITT (Invitation to Tender) for the Sentinel-3 Altimetry Toolbox (now closed). • Expected KO late 2014/early 2015. Project Organization Sentinel-3 Altimetry Toolbox Project Management Tutorial Activities Outreach and Promotion Support and Maintenance and Packaging Toolbox Development Activities Toolbox development activities • • • • • • Data Improvements Computation User Interface Data Export Underneath the Hood Technical Documents & User Manual Toolbox development activities • Data Improvements – Netcdf 4 read/write – Sentinel-3 Data • L1A, L1BS, L1B, L2 (in the different flavours) – Cryosat-2 Ocean Products and Baseline C – ERS Reaper Products – Geosat GDR data – Update of River and Lake Products Handling Toolbox development activities • Data Improvements • Computation – Update Built-in Formulas – Coastal and Inland Waters Altimetry Formulas – User-Defined Algorithm Module & Python API – Interpolation Algorithm Module • User Interface • Data Export • Underneath the Hood • Technical Documents & User Manual Toolbox development activities User Interface • Update Visualization Component • Enhanced Display Background • High Resolution for Coastal zone for instance • Plot Track Data • Regression Line Plotting • Several updates/corrections New user interface (Mockup) Toolbox development activities Data Improvements Computation User Interface Data Export – ASCII Export Viewer – Addition of Image Export – Improvements in KMZ/KML Export • Underneath the Hood • Technical Documents & User Manual • • • • Toolbox development activities Windows / Linux / Mac OS X • Underneath the Hood – Support 64 bits system – External Code Contributions • Reading of Hydroweb Products • Reading 3D Data • HY-2A Products • Computation of Alternative SSB • Statistics Computation • Unit Aware Inequality Operators Open-Source Software. To be done via source code repository. Releases and Duration • Project Duration: 36 months – 24 months of active development – 12 months of maintenance and user support • Major software releases planed – Version A: 6 months after KO • ~ April/May 2015 – Version B: 12 months after KO • ~ December 2015 – Version C: 18 months after KO • ~ April/May 2016 – Bug-fix releases are also planed for the maintenance period. Other Tools • Cryosat Matalab routines – Allows reading of L1b and L2 files from Cryosat. – https://earth.esa.int/web/guest/software-tools/-/article/cryosat-matlab-routines • CryoSat User Tool (CUT) – The CryoSat User Tool (CUT) is a Windows stand-alone application for displaying and downloading CryoSat products from remote FTP servers – https://earth.esa.int/web/guest/software-tools/content/-/article/cryosat-user-tool-cut-7805 • CryoView – CryoView is a tool capable of opening and decoding CryoSat data. It then displays the contents as tables, graphs or as images as appropriate. – https://earth.esa.int/web/guest/software-tools/content/-/article/cryoview-6972 Other Tools • Cryosat Ground Tracks – Cryosat orbit files are provided to Cryosat users to support data analysis, and planning and airborne campaign execution – The Reference Orbit, The Reference Ground Track, FOS Predicted Orbit – https://earth.esa.int/web/guest/-/ground-tracks-7209 SAR Versatile Altimetric Toolkit for Ocean Research & Exploitation SAR mode Versatile Altimetric Toolkit For Ocean Research & Exploitation SARvatore G-POD Distributed Environment The ESA Grid Processing on Demand system is a generic GRID-based operational computating environment where specific data-handling Earth-Observation services can be seamlessly plugged into system. One of the goal of G-POD is to provide users with a fast computational facility without the need to handle bulky data. The G-POD system hosts high-speed connectivity, distributed processing resources and large volumes of data to provide scientific and industrial partners with a shared data processing platform fostering the development, validation and operations of new Earth Observation applications. In particular, the G-POD environment consists of: • • • • • • • Over 350 CPU in about 70 Working Nodes Over 330 TB of local on-line Storage plus 180 TB of EO data accessed directly from the PACs. Access to Cloud processing and data resources on demand (from Interoute and other providers) Internal dedicated 1 Gbit LAN at ESRIN and at UK-PAC archives 1 Gbps external connection Software Resources on-line: IDL, Matlab, BEAT, BEAM, BEST, CQFD, NEST, BRAT, Gamma System: GRID Globus on Linux Actually, G-POD has more than 300TB of EO data locally stored. EO Data available to G-POD services come either from ESA and from not-ESA mission. G-POD Web Portal The G-POD web portal is a flexible, secure, generic and distributed web platform where the user can easily manage all own tasks. From the creation of a new task to the output publication, passing by the data selection and the job monitoring, the user goes trough a friendly and intuitive user interface accessible from everywhere. More info on the G-POD Web Portal are available here: http://wiki.services.eoportal.org/tiki-index.php?page=GPOD+User+Manual#Annex G-POD Services Portfolio The EO services currently integrated in G-POD are: AARDVARC aeromeris algal1 AMORGOS Antarctica ASARP BEAMARITHM BeamReproject BIOMASAR-II BRAT download ESCATSM FAIRE2 GEOFIT GlobTemperature GMESCQC GUT Imager INSAR JLOEP JURASSIC KLIMA LandsatIPF MCFS MGVIJRC2 MGVIRegional MIOPS MKL3 MOSAICOM MSGBaroncini MSGTimeseries NEST PHAVEOS RAIES RIVERLAKE2 SAROTECnFLO SARVATORE SMOSL1 SMOSL2OS SMOSL2SM SOIL MAPPER SSEGridFAPAR VASD vomit WACMOS RAIES • First altimetry project to use the GPOD (ancestor) power • RAIES: Exploitation of the ENVISAT Radar Altimeter Individual Echoes and S-band data for ocean, coastal zone, land and ice/sea-ice altimetry – Aimed at providing users with full processed RA-2 Ku band individual echoes (1800 Hz) for further research. – The individual waveform samples (after IF mask processing), the IE phases, window delay and sigma0 calibration factors are available in the output products. GPOD CryoSat SAR Processing Service The ESA G-POD Service, SARvatore (SAR Versatile Altimetric Toolkit for Ocean Research & Exploitation) for CryoSat-2 is an Earth-Observation application that provides the capability to process remotely and on demand CryoSat-2 SAR data, from L1a (FBR) data products until SAR Level-2 geophysical data products. The service works over any kind of surfaces but it has been so far optimized for ocean studies. It will be “soon” enhanced for inland waters and land domains. CryoSat-2 Processor Prototype The service is based on the SAR Processor Prototype that has been developed entirely by EOP-SER Altimetry Team (Salvatore Dinardo, Bruno Lucas, Jerome Benveniste) for CryoSat-2 validation purposes and preparation to Sentinel-3 mission, with the following system features: - SAR/SARin L1b Processor Prototype (Standard Delay-Doppler Processing) - SAR/SARin L2 Retracker Prototype (with SAMOSA Analytical Model and LEVMAR Least Square Estimator) - Input: CRYOSAT SAR/SARIN FBR DATA - Output L1b Radar Echogram - Output L2 SSH, SLA (W/O SSB), SWH, sigma0, wind speed CryoSat-2 Processor Prototype ESRIN EOP-SER ALT team compiled the processor’s Matlab source code into a 64-bit Linux binary and delivered to ESA G-POD team the executable codes, the input archive (SAR FBR) and satellite footprints (ASCII tracks). Now, the toolkit has been fully integrated in the GPOD System for gridded and on demand computation. The objectives of the service integration in GPOD are: • to experiment in-house research themes that will be further exploited in the ESAfunded R&D projects • to validate CryoSat-2 for ocean applications and get prepared to exploitation of Sentinel-3 mission • to provide expert users with consolidated SAR geo-products to get acquainted with the novelties and specifities of SAR Altimetry Service Registration and Access The service is open, free of charge and accessible on line from everywhere. In order to be granted the access to the service, you need to have an EO-SSO (Earth Observation Single Sign-On) credentials (for EO-SSO registration, go at https://earth.esa.int/web/guest/general-registration) and afterwards, you need to submit an e-mail to GPOD team (write to [email protected]), requesting the activation of the SARvatore service for your EO-SSO user account After a registration to EO SSO, user can freely access at the on line service at: https://gpod.eo.esa.int/services/CRYOSAT_SAR/ The service is listed under the Marine Theme or you can find through the search bar as well. CryoSat-2 DATA Catalogue in G-POD The current GPOD service works only in SAR Mode (no SARIN or LRM mode). So far, in the service catalogue, we have stored ~100 thousands of SAR passes over the all globe for the years 2010, 2011, 2013 and part of 2014 and 2012. This amount to 16 TB of CryoSat-2 FBR data archived into G-POD storage. Data obtained from EOP-SER (historical) and CS2 ftp servers (current). Partial historical archive (<2012/05) were gratefully provided by NOAA/RADS and ESTEC The Service Graphical User Interface Once get to the service page, the first action to operate is to select the zone of interest and the time of interest for the required run. Regarding the selection of the area of interest, the user can simply draw a rectangle in the world map, after clicking on the rectangle icon on the tool bar. Instead, for more precise geo-selection, the user can type directly the geo-coordinates of the area of interest using the geographical boxes. Regarding the time of interest, the user may set the start date and the stop date in the calendar bar. By default, the start date is the time of CryoSat-2 launch time and the stop date is set at 2 months prior to the current date. The GUI embeds all the standard buttons for image browsing as panning, zoom-in zoom-out, centering, undo, redo, reset, etc. DATA SELECTION Once operated the time and geo selection, clicking on the “QUERY” button, the service lists all the CryoSat-2 passes matching the time and space requirements. The CryoSat-2 SAR tracks, crossing the area of interest, are then shown on the world map in overlay. The graphical interface lists at maximum 100 passes for page and informs users of the total number of found passes. The user can decide which passes to select clicking on the passes, select all, or delete some specific passes from the list. SESSION PREFERENCE PANEL On the top right, user finds a preference panel wherein user can set: — — — — — Name of the current task Ftp Server where to publish the results (portal or personal) Data compression (tgz, none) Grid Computing Resources Task Priority LIST OF PROCESSING OPTIONS The last step, before to submit the task, is to set the list of processing options. • Indeed, the processor prototype is versatile in the sense that the users can customize and adapt the processing, according their specific requirements, setting a list of configurable options. • In the G-POD interface, user can enter easily this list of processing options via a series of drop-down menu. The configurable options are divided according to the processing level they refer to (L1b and L2). L1B Option – Hamming Window Option Name Option Value Option Description - Apply only in coastal zone Hamming weighting Window - Yes, apply it - No. do not apply it Default option: Apply only in coastal zone Coastal Zone recommended: Apply only in coastal zone Open Ocean recommended: No. do not apply it User can decide here whether to apply a Hamming weighting window on the SAR burst data, do not apply it, or to apply it only for surface location in coastal area (more info at REF1) Weighting Function in coastal zone To suppress parabolic artifacts on the radargram to the quasi- specular coastal waters, => application of Weighting Function (Hamming) in Doppler Domain to Delay-Doppler Spectrum before the Beam Forming Effect of the application of Weighting Function to eliminate parabolic artifacts on radargram (echo stack) L1B Option – Exact Beam-Forming - Approximated Exact Beam-Forming - Exact User can decide here whether to operate an exact Beam-Forming or an approximated Beam-Forming (more info at REF1) * In the approximate beam steering, all the Doppler Beams will be steered by the same angle. This approximation can be considered acceptable on gentle undulating surfaces. * For effect of the application of the Beam Formation, the Doppler Beams are angularly Equispaced. The exact beam forming needs to be applied in case of highly variable topographic surfaces (land). REF1, section 4.4 Default option: Approximated Coastal Zone recommended: Approximated Open Ocean recommended: Approximated FFT Zero-Padding FFT Zero-Padding - Yes, apply Zero-Padding - No, don't apply ZeroPadding User can decide here whether to operate the Zero-Padding prior to the range FFT (section 4.8 in REF1). Zero-Padding is indicated for coastal zone and sea-ice analysis Default option: Yes, apply Zero-Padding Coastal Zone recommended: Yes, apply Zero-Padding Open Ocean recommended: User pref ZERO-PADDING =>DOUBLE SAMPLING L1B Options – Window Size Radar Receiving Window Size - 128 Range Bins - 256 Range Bins Default option: 128 Range Bins Coastal Zone recommended:256 Range Bins Open Ocean recommended: 128 Range Bins User can select here the size of the radar receiving window: 128 range bins (standard) or 256 range bins (extended). Extended window is indicated for coastal zone analysis L2 Options – Retracking Surfaces Option Name Option Value - Process all Restrict the re-tracking on specific surfaces - Process only open sea points - Process only water points Default option: Process only water points Coastal Zone recommended: Process only water points Open Ocean recommended: Process only open sea points Option Description User can decide here whether to process the whole pass, only points in open sea or only water points (points in open sea, costal zone and inland water) L2 Options – Slope Effect Slope Effect - Yes, apply it - No. do not apply it Default option: - No. do not apply it Coastal Zone recommended:? - No. do not apply it Open Ocean recommended:? - No. do not apply it User can decide here whether to apply the slope effect in the SAMOSA model (more info at REF2) L2 Options – PTR width User can decide here whether to use a LUT PTR width alphap parameter Default option: LUT Coastal Zone recommended: LUT Open Ocean recommended: LUT - LUT (Look-Up Table) or a constant for PTR (Point - Constant Target Response) alphap parameter With LUT Credits CLS/CNES July 2012 + Jan 2013 “SWH residual depends strongly on wave height (up to 25cm at very low swh) that could be due to the Gaussian approximation for the PTR ” CNES/CLS L2 Options – SAMOSA version User can decide here which SAMOSA SAMOSA Model Generation - Use SAMOSA 2 - Use SAMOSA 3 generation model to use in the processing (SAMOSA 2 or SAMOSA 3). The SAMOSA 3 is a truncated version of SAMOSA 2 (only zero-order term) Default option: - Use SAMOSA 2 Coastal Zone recommended: - Use SAMOSA 2 Open Ocean recommended: - Use SAMOSA 2 SAMOSA3 SAMOSA2 TASK SUBMISSION Once user has operated the selection of the processing options, in order to submit the task to G-POD Computing Elements, the user has to click on the “PROCESS IT” button. TASK VIEWER/WORKSPACE After submission of job, users will be directed to the workspace page where they can check in real time the status of the run and can be notified on the run status. The color code is: Orange run under processing Green run completed Red run failed Further, clicking on the task, the user can have more info on the processing task as: — Task Id — Processing Id — Grid Working Node Id — Task Progress (data retrieving, data processing, data publishing) — Task Creation Time TASK VIEWER/WORKSPACE After run completion, clicking on the button “Jobs Information”, the user can inspect: — the GPOD log file (.stdout or .stderr) where eventual errors on data retrieving or data storing are reported — the prototype configuration file (L1b_CONFIG_FILE.log and L1b_CONFIG_FILE.log) where are reported all the processing options — the prototype log files (L1b_start.log and L2_start.log) where are reported eventual prototype processing errors. User can also decide to change one or more processing options and then re-submit the task. Config and Log File (L1b) Example Execution Log Configuration File Examples (L1B) Config and Log File (L2) Example You don’t need to care about it (if everything goes ok) Configuration File Examples (L2) Execution Log Output Package Publishing In case of successful run completion (green status), the portal will provide user a http link from where to download the output package on own local drive. The user can order to post the package directly on own personal ftp server once that he communicated to the web platform his ftp server credentials (through my “publish servers” sub-menu). This is the recommended option in case of processing of large amount of data. Output Package Content The output package consists of : — Pass Ground-Track in KML format — Radar Echogram Picture in PNG format — L2 data product in NETcdf format with all the scientific results. The netCDF format is self-explanatory with all the data field significance described in the attributes Adopted Conventions — The Reference Time for the TAI Datation is 01/01/2000 00:00:00 — The Vertical Datum for altitude reference is the WGS84 Ellipsoid — The Curve Best-Fitting Scheme, used in the re-tracking stage, is a bounded LevenbergMarquardt Least-Squares Estimation Algorithm (LEVMAR-LSE). — The mispointing angles are treated as input into retracking algorithm — The SAR Power Return Waveform Model, used in the re-tracking stage, is the SAMOSA Model (REF2) — Static bias has been applied to the range, sigma nought and antenna mispointing measurements. The values of the static biases are reported in the output NetCDF data products. — The orbital altitude has been corrected for a Time Tag Bias. The value of the applied time tag bias is reported in the output NetCDF data products. — The measurements are posted both at rate of 20 Hz and of 1 Hz. — The sea state bias has not been applied to the sea level anomaly measurements. — No a priori data editing has been applied to the 20 Hz measurements. — The misfit between SAR Waveform Model and SAR Waveform Data has been computed as: sqrt( 1/128*(residuals).^2 )*100 where residuals are the differences between model's waveform power and data's waveform power, normalized for the waveform power's maximum value. NETcdf Product IN BRAT The NETcdf product follows the CF (Climate&Forecast) 1.6 Convention and can be opened with any standard NETcdf tools (ncdump, HDFview, etc) Anyhow, the recommended option is to ingest the NETcdf product in BRAT Toolbox in order to exploit all the BRAT functionalities to browse and visualize the output content CONTACTS & REFERENCES: For any question, bugs and support, please contact us at: [email protected] For G-POD platform specific questions please contact: [email protected] Service Manual available at: http://wiki.services.eoportal.org/tikiindex.php?page=GPOD+CryoSat-2+SARvatore+Software+Prototype+User+Manual Service available at: https://gpod.eo.esa.int/services/CRYOSAT_SAR/ — REF1: Guidelines for the SAR (Delay-Doppler) L1b Processing, ESA, 2013 — REF2: SAR Altimeter Backscattered Waveform Model (SAMOSA Model Paper), IEEETGARSS, in press THANK YOU ! Further inquiries @: [email protected]