1
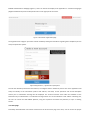
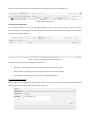
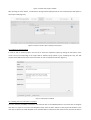
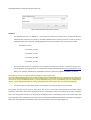
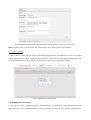
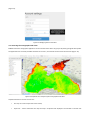
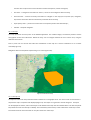
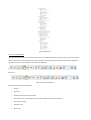
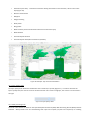
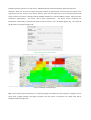
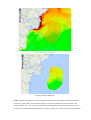
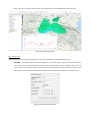
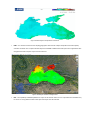
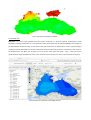
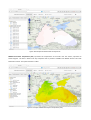
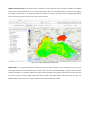
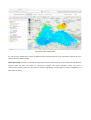
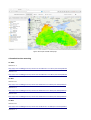
ESPOSS Users Manual Content 1. About the document ........................................................................................................................ 3 2. Introduction ..................................................................................................................................... 3 3. Web platform utilization .................................................................................................................. 3 3.1.Creating an account ............................................................................................................. 3 3.2. Start page ............................................................................................................................ 4 3.3. Projects management ......................................................................................................... 5 3.3.1. Creating a new project ............................................................................................5 3.3.2. Editing an existing project .......................................................................................6 3.3.3. Adding the user’s own data to a project .................................................................6 3.3.4. Deleting a project ....................................................................................................8 3.4. Modifying the account data ................................................................................................ 8 3.5. Accessing the cartographic web client ................................................................................ 9 3.5.1. The map .................................................................................................................10 3.5.2. The layer list...........................................................................................................10 3.5.3. The instrument bar ................................................................................................11 3.5.4. Layer opacity slider ................................................................................................12 3.5.5. Web processing tools ............................................................................................12 4. Standard services accessing ........................................................................................................... 21 4.1 WMS ................................................................................................................................... 21 4.2 WFS ..................................................................................................................................... 21 4.3 WCS .................................................................................................................................... 21 4.4 WPS .................................................................................................................................... 22 4.5 TMS ..................................................................................................................................... 22 4.5 WMS-‐C ................................................................................................................................ 22 4.5 WMTS ................................................................................................................................. 22 1. About the document The present Users Manual is a preliminary document, presenting the latest capabilities of the ESPOSS system. While new functionalities will be added, updated versions of the document will be published to reflect the respective modifications. 2. Introduction ESPOSS is an online system (server + client) for Black Sea region geospatial data accessing and processing. The data accessing and processing operations are based on open standards, developed by Open Geospatial Consortium (OGC), such as: Web Map Service (WMS), Web Feature Service (WFS), Web Coverage Service (WCS), Catalogue Service (CSW) or Web Processing Service (WPS). These services are compatible with the following network servicies defined by the European INSPIRE initiative: search (allow the geospatial data sets and services identification, based on the content of the corresponding metadata, and metadata content vizualisation), vizualization (allow the displaying, navigation, zooming, panoramic rotation, visual overlaping of spatial data sets and displaying of explanatory information and of any pertinent content of the metadata) download (allow complete or partial download of spatial data sets and direct access to these) and processing (allow the proccessing of the spatial data sets). The system can be accessed by the users via internet, using a web navigator (browser) at: http://blacksea.asrc.ro. The system’s compatibility has been succesfully tested on Windows (XP, Vista, 7, 8), Linux (Ubuntu 12.x, 14.x) and MacOS X (Snow Leopard, Lion, Mountain Lion, Mavericks, Yosemite) platforms, using Mozilla Firefox, Chrome, Safari and Opera. Internet Explorer users can also use the application but some errors might occure. Minimum required resolution for system use is 1024x768. The browsers should apriori be set to allow the pop-‐up windows, JavaScript scripts running and cascade style display (CSS). ESPOSS includes (and will further include) spatial data (direct or through standard interfaces) from the following sources: • Online satellite data archives (e.g. GMES Space Component Data Access, NASA REVERB); • Basic Copernicus (former GMES) services, both operational (Emergency Management Service) and under development (Marine Environment Monitoring Service – implemented through FP7 MyOcean project; Atmosphere Monitoring Service – implemented through FP7 MACC project); • Relevant data geoportals (e.g: SeaDataNet, NOAA World Ocean Database, IODE Ocean Data Portal, Published Ocean Data); • Global cartographic services (ex: Google Maps, OpenStreetMap); • Reference and in situ data provided by European, national and local authorities. 3. Web platform utilization 3.1.Creating an account The ESPOSS web platform can only be accessed by registered users. Registration requirement can be done by filling in a short form on the ESPOSS website. The form can be accessed using the dedicated link (Create a new account) on the ESPOSS authentification webpage (Figure 1). Users can choose the display of the application in 2 different languages (English and Romanian) from the drop-‐down menu in the right part of the screen. Figure 1 Link to the registration page The registration form (Figure 2) contains several mandatory fields (plus indications regarding their completion) and an anti-‐spam protection system. Figure 2 Registration / registration request form Once all the mandatory fields have been filled in, the ’Register’ button should be pressed. The server application will verify the validity of the information (valid e-‐mail address, username, correct password and correct ReCaptcha answer) and a confirmation message will be displayed. The account becomes active after the validation of the information by an administrator. A notification message will be sent to the indicated e-‐mail address. Following this, the user can access the web ESPOSS platform, using the respective username and password, to open a working session. 3.2. Start page Succesfully authentificated users will be redirected to the account start page. Once here, one can access the project session, the account information can be modified or the working session can be closed (Figure 3). Figure 3 Start page options 3.3. Projects management The interaction between the users and the ESPOSS platform services is done through projects. These are working sessions defined and customized by the users. By default, for the first authentification in the system, no pre-‐defined project will be included. (Figure 4). Figure 4 ’Projects’ session at the first authentification Functional zones of the projects management interface are: • Main table – containing the list with the projects created by the respective user; • Upper task bar – containing projects management instruments (add, edit, delete); • Lower taskbar – containing useful instruments for projects organization. 3.3.1. Creating a new project A new project can be created by pressing the ’Add project’ button on the upper bar. The opened dialog window will require a name for the project and a short description (Figure 5). Figure 5 ’Create new project’ window After pressing the ’Save’ button, a confirmation message will be displayed and the new created project will appear in the projects table (Figure 6). Figure 6 ’Projects’ section after creating a new project 3.3.2. Editing an existing project In order to edit an existent project, the user has to select the respective project by clicking the left button of the mouse. The line corresponding to the project will be marked, being colored in grey. Following this step, the ’Edit project’ button will become active. Press this button in order to display the edit form (Figure 7). Figure 7 ’Edit project’ window 3.3.3. Adding the user’s own data to a project The users have the possibility to load their own vectorial data on the ESPOSS platform. The easiest way to integrate own data in a project is to use the ’Load Shapefile’ button from the lower task bar of the project edit window. In the new opened window, the ESRI Shapefile to be uploaded will be selected and the name used to stock the file data in the ESPOSS platform should be indicated. (Figure 8). Figure 8 ESRI Shapefile data loading window Attention! • The shapefile files must be loaded as a .zip archive. The name of the archive must corresponde with the individuale file names that are specific to the ESRI Shapefile format. The base structure of such an archive is illustrated below, presuming that an ESRI Shapefile file named vulnerable_area is needed to be loaded. vulnerable_area.zip > vulnerable_area.shp > vulnerable_area.shx > vulnerable_area.dbf > vulnerable_area.prj • The .prj file will contain the descriprion of the projection used by the data set in OGC WKT format. For a correct definition of the projections, we reccomend consulting the following site: http://spatialreference.org. Below, as an example, the definition of OGC WKT format for UTM zone 35 (EPSG code32635 ) is offered. PROJCS["WGS 84 / UTM zone 35N",GEOGCS["WGS 84",DATUM["WGS_1984",SPHEROID["WGS 84",6378137,298.257223563,AUTHORITY["EPSG","7030"]],AUTHORITY["EPSG","6326"]],PRIMEM["Greenwich",0,AUTHORITY["EPSG","8901"]],UNIT[ "degree",0.01745329251994328,AUTHORITY["EPSG","9122"]],AUTHORITY["EPSG","4326"]],UNIT["metre",1,AUTHORITY["EPSG","9001"]],PROJECTI ON["Transverse_Mercator"],PARAMETER["latitude_of_origin",0],PARAMETER["central_meridian",27],PARAMETER["scale_factor",0.9996],PARAME TER["false_easting",500000],PARAMETER["false_northing",0],AUTHORITY["EPSG","32635"],AXIS["Easting",EAST],AXIS["Northing",NORTH]] • The name of the new layer will be written in small letters and using the spaces is to be avoided. Once added, the layer can be found in ’Own layers’ box. If two or more layers with geospatial information will be attached to the project, these will be displayed in the box, separated by comma. The inclusion of the layer loaded this way in the cartographic web client can be done by including the layer’s name (copy / paste) in the ’Active layers’ box and, eventually, in the ’Visible layers’ box (if the layer is needed to be visible by default when opening the cartographic web client). The separation of the multiple layers in the two boxes is done by a comma (Figure 9). Figure 9 Including personal layers in the cartographic web client layer list within the current project Note: the loaded layers are to be found in the ’Personal layers’ list in all the projects of the same user. 3.3.4. Deleting a project In order to delete a project, the user has first to select the respective project. The ’Delete project’ option in the upper task bar will become active. After pressing the respective button, a confirmation window will be displayed (Figure 10). The project will be deleted from the ESPOSS data base after the confirmation of the deleting request. Figure 10 Deleting an existing project 3.4. Modifying the account data In any moment, the users can modify the account contact data (name, e-‐mail affiliation), change the password or even delete the account from the ESPOSS platform, using the form that can be found in the ’Account settings’ section. (Figure 11). Figure 11 Modifying the account data 3.5. Accessing the cartographic web client ESSPOS interactive cartographic application can be accessed from within any project by clicking the globe-‐like symbol. The application has an easilly accesible interface for the users, and includes numerous functional zones (Figure 12). Figure 12 Graphical user interface of the cartographic web client Graphical Interface’s functional zones are: • The map –the main component of this modul; • Layers list – used to determine the way the map is composed and displayed. The window on the left side contains other 3 options that can be selected: Products description, Credits and Legend; • Pan-‐zoom – a navigation instrument for zoom in / zoom out and navigation within the map; • Instrument bar – contains necessary instruments to navigate on the map (zoom in/zoom oput, navigation, etc) and the interaction with the information presented within the map; • Layer opacity slider – permits the control of the transparency level of the selected layer; • Calendar -‐ temporal navigation. 3.5.1. The map The map represents the focal point of the ESPOSS application. The satellite images, the derived products and the cartographic content are loaded here. Within the map, one can navigate towards the user’s interst zone, using the dedicated instruments. Zom in /zoom out are controls that allow the modification of the map for a clearer visualization or for a better overview (Figure 13). Navigation within the map allow repozitioning or re-‐centering the map. Figure 13 Interactive map 3.5.2. The layer list The layer list contains all the spatial information loaded in the cartographic client. It is used in order to determine the way how the map is composed and displayed (Figure 14). The layers are organized in several categories. The layers can be displayed or hidden, and an active layer can be defined. Each layer has two attached boxes. The first box (check box) allows the control of the layer’s visibility. The second box (radio button) is used to define the active layer. Some instruments from the instrument bar can only be used for the active layer. Figure 14 Layer list 3.5.3. The instrument bar The instrument bar contains the instruments necessary to navigate within the map (zoom, pan, etc) and to interact with the information contained within the map. When the mouse is positioned over these intruments, indications regarding the role of the respective instruments are displayed ( Figure 15). Figure 15 The instrument bar The instruments are presented below: • Zoom in • Zoom out • Display the map at maximum extent • Interactive zoom – click and drag a square that defines the zone for the zoom in • Pan (click and drag) • Previous zoom • Next zoom • Information ( Get Info) -‐ interactive instrument offering information on the atributes / values in the active layer (Figure 16) • Distance measurement • Map print • Polygon drawing • Draw profile • Drag profile • Buffer creation (around the elements selected from the active layer) • Buffer deletion • Vectorial objects selection • Vectorial objects delete/discard selection (deselect) Figure 16 Exemple: ’info’ instrument utilization 3.5.4. Layer opacity slider The layer opacity slider allows the modification of the active layer’s opacity (Figure 17). In order to decrease the layer’s opacity level, the coursor has to be moved to the left and in order to magnify it, the coursor is to be moved to the right. Figure 17 Layer opacity slider. 3.5.5. Web processing tools The tools in this section are based on the Open Geospatial Consortium (OGC) Web Processing Service (WPS) Interface Standard. WPS provides rules for standardizing how inputs and outputs (requests and responses) for invoking geospatial processing services as a web service. ESPOSS GeoPortal include the following web processing tools: Resample -‐ allows user to resize or change tha spatial resolution of selected layer. In this process every aspect of the original grid (cell size, columns, rows) may be affected. There are some options that can be manually specified like output resolution (in meters), resample method (available methods are: nearest neighbour; bilinear -‐2x2 kernel; cubic convolution approximation -‐ 4x4 kernel; cubic b-‐spline approximation -‐ 4x4 kernel; lanczos windowed sinc interpolation -‐ 6x6 kernel), a check-‐box that allow to save the results in user`s workspace (Figure 18). The output file will be shown in the layer list (Figure 19). Figure 18 Resample dialog window Figure 19 Exemple: Resampled layer Clip – this tool clips (crop) selected layer to a reference polygon that defines the clip boundaries. A polygon must be drawn using „Polygon drawing” tool (Figure 20) before the clip process is performed. The cliped raster will be displayed in layer list (Figure 21). Figure 20 Exemple: clip polygon Figure 21 Exemple: cliped raster • Profile -‐ compute and display cross-‐sectional profiles using the active layer values. The profile line must be drawn using „Draw profile” tool. The labels along the X-‐axis give the distance from the first point in the profile in ground units. The number of sample points along the profile can be controlled from the "Profile resolution" box of the profile window (resolution is given in meters). It is possible to interactively inspect the values in the chart using the mouse pointer. The inspected point is also highlighted on the main map. Figure 21 Exemple: profile tool 3.5.6. Export tools There are three export formats for selected layers. All export capabilities are available in Expor menu. • Animation – It combines several consecutive images to create a GIF image. A layer must be selected and the user should insert animation filename, animation title, the frame delay, and the animation period. Once all those are done the animation will be created by clicking Create animation button. After the animation was created (the user will receive a confirmation message) it can be displayed using Display animation button. Figure 22 Animation dialog window Figure 23 Sea Surface Temperature Animation • KML – is a common format used to display geographic data and also a Open Geospatial Consortium (OGC) standard. It allows user to export selected layer from ESPOSS in KML format and inport file in applications like Google Earth. Before export a layer must be selected. Figure 24 KML file loaded in Google Earth • PDF – the capability of ESPOSS platform to export in this format offers to users a printable and viewable easy to access on every platform. Before the export the layer must be selected. Figure 25 PDF file exported from ESPOSS 3.6 Available data Kassandra is an storm surge operational forecast system consisting in a 3D finite element hydrodynamic model (SHYFEM), including a tidal model, in a third generation finite element spectral wave model (WWMII), fully coupled to the hydrodynamic model and using as input surface data (wind and pressure) obtained from a suite of meteorological models provided by ISAC-‐CNR. The numerical simulation system provides daily forecasts, to maximum 4 days each, for the Mediterranean and Black seas at steps of 3 hours for the total water level (tide + surge + wave set-‐up) and significant wave height (computed in terms of zero moment of the wave spectra, which is the volume of the spectra). Figure 26 Example: Kassandra wave height forecast Figure 26 Example: Kassandra water level forecast MODIS Sea Surface Temperature (SST) represents the temperature of the water near the surface, expressed as Celsius degrees. The data is based on 8 day composite level 3 products available from NASA's Ocean Color Data Distribution Center. The spatial resolution is 4km. Figure 27 Example: MODIS Sea Surface Temperature (SST) MODIS Chlorophyll (CHL) concentration data is based on 8 day composite level 3 products available from NASA's Ocean Color Data Distribution Center. The spatial resolution is 4km. The chlorophyll values are expressed as mg/m3. Chlorophyll concentration is an important parameter because it measures the abundance of algae (phytoplankton) which represents the main food source for other marine species. Figure 28 Example: MODIS Chlorophyll (CHL) MODIS K490 is the diffuse attenuation coefficient at 490 nm which indicates how strongly light intensity at the wavelength of 490 nm is attenuated within the water column. In other words MODIS K490 is a good indicator of water clarity and turbidity. For example a K490 of 0.1/meter means that light intensity will be reduced one natural log within 10 meters of water, therefore higher K490 value means smaller attenuation depth, and lower clarity of water. The MODIS K490 products are level 3 -‐ 8 day composite, with a spatial resolution of 4km. Figure 29 Example: MODIS K490 For the moment, ESPOSS grants access to MODIS products developed based on the information collected by Terra platform between 2000 and 2012. MERIS Chlorophyll products are monthly averaged from the data collected by the sensor onboard Envisat platform between 2003 and 2012. The values are expressed as mg/m3. The spatial resolution is 9km. The Level 3 demonstration products have been generated on G-‐POD using MGVIL3 3.2 (JRC), MKL3 3.0 (Acri) and BEAM-‐L3 3.3 (Brockmann-‐Consult). Figure 30 Example: MERIS Chlorophyll 4. Standard services accessing 4.1 WMS Version 1.1.1 http://apps.asrc.ro:8080/geoserver/ows?service=wms&version=1.1.1&request=GetCapabilities Version 1.3.0 http://apps.asrc.ro:8080/geoserver/ows?service=wms&version=1.3.0&request=GetCapabilities 4.2 WFS Version 1.0.0 http://apps.asrc.ro:8080/geoserver/ows?service=wfs&version=1.0.0&request=GetCapabilities Version 1.1.0 http://apps.asrc.ro:8080/geoserver/ows?service=wfs&version=1.1.0&request=GetCapabilities Version 2.0.0 http://apps.asrc.ro:8080/geoserver/ows?service=wfs&version=2.0.0&request=GetCapabilities 4.3 WCS Version 1.0.0 http://apps.asrc.ro:8080/geoserver/ows?service=wcs&version=1.0.0&request=GetCapabilities Version 1.1.1 http://apps.asrc.ro:8080/geoserver/ows?service=wcs&version=1.1.1&request=GetCapabilities 4.4 WPS Version 1.0.0 http://apps.asrc.ro:8080/geoserver/ows?service=wps&version=1.0.0&request=GetCapabilities 4.5 TMS Version 1.0.0 http://apps.asrc.ro:8080/geoserver/gwc/service/tms/1.0.0 4.5 WMS-‐C Version 1.1.1 http://apps.asrc.ro:8080/geoserver/gwc/service/wms?request=GetCapabilities&version=1.1.1&tiled=true 4.5 WMTS Version 1.0.0 http://apps.asrc.ro:8080/geoserver/gwc/service/wmts?REQUEST=GetCapabilities