1
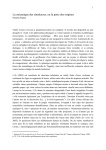
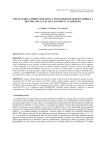
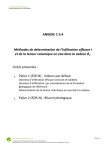
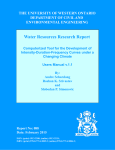
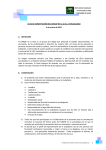
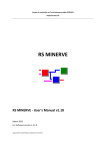
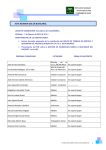
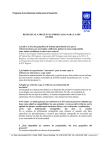
Modelling of last hypothesis of climate change impacts on water
resources in Sierra de las Cabras aquifer (Southern Spain)
P. Jiménez-Fernández & P. Jiménez-Gavilán
Department of Geology. Faculty of Science. University of Malaga. Malaga. Spain
Centre of Hydrogeology of the University of Malaga (CEHIUMA). University of Malaga. Malaga. Spain
ABSTRACT: Having models that reflect the reality of a system operation becomes critical to
the effective management of water resources in a watershed, especially considering the different scenes of climate change predicted for the Mediterranean regions by the Intergovernmental
Panel on Climate Change (IPCC). The fifth Assessment Report of IPCC (AR5) estimates an increase in average temperatures and a precipitation decrease between 10 and 20% for Mediterranean region which could generate drought events in the study area. The present research tries to
determinate the potential impacts that climate change may have on water resources. The Sacramento model has been used to model the water resources of an inertial aquifer, Sierra de las
Cabras. In turn, IPCC forecasts of climate change for the study area (Mediterranean region)
have been simulated taking into account the degree assessing of affection to the water resources
opposite to eventual episodes of drought, and the social and environmental implications that
will result have been also determined.
1 INTRODUCTION AND MAIN CHARACTERISTICS OF THE STUDY AREA
Being able to determine the potential impacts that climate change may have on water resources
is a complicated task, due to the limited data available for the calibration of the models, and the
high exploitation rate of the aquifers in the study area, which makes the modeling almost impossible under conditions of functioning of the system in natural regime.
The Sierra de las Cabras aquifer is located in the central part of the province of Cadiz (Figure
1A). This includes, from West to East, the sierras of del Valle, Dos Hermanas, de la Sal, de las
Cabras and Loma del Tempul. All these reliefs constitute a mountain range of 42 km2, whose
planform is a crescent with concavity open towards the Southwest. Sierra de las Cabras is
crossed by two streams: Bogaz and Bujalance (Figure 1B).
The materials of Sierra de las Cabras belong to the unit of the same name, within the Medium Subbetic domain of the External Zone of the Betic Cordillera (Chauve 1960, 1962, MartínAlgarra 1987, ITGE 1990). The stratigraphic series (Figure 1C) consists of three main
lithologic units (from wall to ceiling): Triassic in German-Andalusian facies (Keuper), Jurassic
of calcareous-dolomitic nature with 300 meters thickness, and Cretaceous-Tertiary of marly nature (Jiménez 2011).
The outcrops of Jurassic limestones and dolomites, with an area of approximately 34 km2,
constitute an aquifer. The aquifer recharge occurs by direct infiltration from rainfall on carbonate outcrops and, sometimes, by infiltration of runoff from Bogaz stream and Bujalance
stream. The different materials in the study area have been grouped into two categories according to their hydrological behavior: carbonate medium permeability and carbonate high permeability (Figure 1B).
The discharge occurs, in a natural way, by the El Tempul spring, at elevation 120 m a.s.l., the
flow varies between 20 L/s and less than 2000 L/s, with an historical average value of 283 L/s
(Jiménez et al 2001). In periods of exceptional recharge the ‘trop plein’ of Fuente Imbro comes
into operation (Figure 1B) at elevation 140 m a.s.l.. There is a preferentially groundwater flow
directed towards the El Tempul spring (Carreras 1996). So, the hydrodynamic study of this
point showed that this aquifer has a predominantly inertial hydrogeological behaviour, which is
indicative of a low degree of functional karstification and, in this case, of significant groundwater reserves (Jiménez 2011).
Figure 1. A) Location of Sierra de las Cabras, B) Sierra de las Cabras, and C) stratigraphic series (modified (modified from Martín-Algarra 1987).
The assessment of water resources is essential for a proper planning and management. There
are basically two methods to assess the water resources: restitution to the natural regime and
rainfall-runoff modeling. Both methodologies are often complementary and necessary.
The first objective of the present research is the modeling of the monthly water resources of
Sierra de las Cabras aquifer by Sacramento model (Burnash et al. 1973), with EvalHid tool
(Paredes-Arquiola et al. 2012), developed by the Water Resources Engineering Area of IIAMAUPV. The second goal is to simulate the IPCC projections of climate change for the study area
(Mediterranean region), which are covered in the fifth Assessment Report (AR5) (IPCC 2013).
Four new emission scenarios have been defined. They are called Representative Concentration
Pathways (RCP). They are identified by their total radiative forcing (RF) in 2100, ranging from
2.6 to 8.5 Wm-2 and can contain the effects of policies to limit climate change in the twenty-
first century. The forecasts made in the RCP4.5 and RCP8.5 scenarios have been simulated for
three time intervals (IPCC 2013): 2016-2035, 2046-2065, and 2081-2100.
2 METHODOLOGY
2.1 Bibliographic compilation
A detailed analysis of all the information on the application of methodologies for characterizing
the hydrodynamic functioning of aquifers has been carried out, but particularly in relation to the
Betics aquifers (Delannoy 1998, Andreo et al. 2002, Jiménez et al. 2001, Jiménez 2011).
Moreover, any information regarding the different climate change scenarios that are envisaged
by the IPCC (IPCC 2013) has been also analyzed.
Forecasts carried out by global circulation models (75th percentile) have been considered for
RCP4.5 and RCP8.5 scenarios in the study area (Table 1).
Table 1. Temperature and precipitation change for the three time intervals simulated (IPCC 2013).
Tempe ra ture cha nge ºC
Pre cipita ti on cha nge %
Period 2016-2035 2046-2065 2081-2100 2016-2035 2046-2065 2081-2100 Period 2016-2035 2046-2065 2081-2100 2016-2035 2046-2065 2081-2100
RCP4.5
RCP4.5
RCP4.5
RCP8.5
RCP8.5
RCP8.5
RCP4.5
RCP4.5
RCP4.5
RCP8.5
RCP8.5
Dec-Fe b
1
2
2
1
3
4
Oct-Ma r
0
-10
-10
0
-10
-20
Ma r-Ma y
1.5
2
3
1.5
3
5
Apr-Sep
-10
-10
-10
0
-20
-30
Jun-Aug
1.5
3
3
2
4
7
Sep-Nov
1.5
2
3
1.5
3
5
RCP8.5
2.2 Hydrometeorological data compilation
SIMPA model (Cabezas et al. 1999, Ruiz 1999, Estrela and Quintas 1996) provides information
for the main components of the hydrological cycle in natural regime. This information is contained in raster layers covering the entire territory of Spain on a monthly basis between 1940
and 2012. A GIS tool has been developed for extracting information on precipitation, temperature, and potential evapotranspiration (PET).
2.3 Modelling and model calibration
Data between 1986-1995 have been used to calibrate the model because this is the period that
has daily flow data drained by El Tempul spring. When the system has been calibrated the value of the parameters used by Sacramento model have been determined (Table 2).
Table 2. Parameters value.
Materials
Parameter Carbonate medium Carbonate high
permeability
permeability
Uztw m
120.000
80.000
Materials
Parameter Carbonate medium Carbonate high
permeability
permeability
Zperc
6.000
10.000
Materials
Parameter Carbonate medium Carbonate high
permeability
permeability
Lzpk
0.004
0.006
Uzfw m
210.000
230.000
Rexp
0.500
0.800
Pfree
0.200
Uzk
0.060
0.080
Lztw m
75.000
65.000
Side
0.150
0.300
0.150
Pctim
0.000
0.000
Lzfsm
245.000
300.000
Rserv
0.800
0.900
Adimp
0.000
0.000
Lzfpm
300.000
300.000
Dt
1.800
1.800
Riva
0.000
0.000
Lzsk
0.150
0.278
2.4 Climate change
The forecasts made in the RCP4.5 and RCP8.5 scenarios have been simulated for time intervals
2016-2035, 2046-2065, and 2081-2100 (Figure 2). The data series have been built with reference to SIMPA data for the period 1986-2005.
A regionalization of data series from general circulation model used in the AR5 has not been
possible because it has been published recently (October 2014), and they are not available yet.
Data series for the different scenarios, based on the forecasts for Mediterranean region, have
been generated using simulated data by Sacramento model for reference period (1986-2005).
However, this study is intended as a preliminary approximation to a future regionalization of
data.
Figure 2. Map of change in temperature and precipitation for the RCP4.5 scenario (IPCC 2013).
3 RESULTS AND DISCUSSION
The comparison of observed data regarding estimated data by Sacramento model, for the period
1986-1995 (Figure 3), has been conducted by the efficiency coefficient of models of NashSutcliffe (Nash and Sutcliffe 1970).
Figure 3. Water resources drained and simulated by El Tempul spring.
According to the value obtained from the Nash-Sutcliffe coefficient, 0.87, for the calibration
period, the monthly series have a very good goodness of fit (Table 3).
Table 3. Criteria for evaluating the goodness of fit of Nash-Sutcliffe (Van Dijk et al. 2008).
Indicator
Excellent Very good
Good
Reasonable Modest
Poor
RN 2
>0.95
0.8-0.95
0.75-0.8
0.6-0.75
0.5-0.6
0.3-0.5
Very poor
<0.30
In Figure 4 the average monthly water resources obtained by Sacramento model has been
represented for RCP4,5 and RCP8,5 scenarios and for the reference period. In Table 4 variations are shown, both in absolute terms and as a percentage for the different simulated scenarios.
The water resources in the aquifer of the Sierra de las Cabras, simulated by the Sacramento
model, show a larger decline than would be expected only by the variation of precipitation in
different scenarios and with respect to the reference period, e.g. RCP4.5 for 2081-2100: a decrease of 10% in precipitation (Table 1) generates a decrease at approximately 25% in water resources simulated by El Tempul spring (Table 4). This is because the real evapotranspiration is
higher due to the increase in potential evapotranspiration values associated with the rise in temperature. This causes a change in the soil moisture conditions. Part of the precipitation that
would be part of this component is subtracted from it, to supply the soil moisture deficit.
Figure 4. Average monthly water resources drained and simulated by El Tempul spring.
This decrease of water resources will produce drought events that will compromise to longterm the implementation of the qualitative and quantitative environmental objectives for surface
water bodies and groundwater bodies that are downstream of the study area. This would affect
the availability of resources to the Bay of Cadiz and Jerez de la Frontera which is an area with a
high demand for supply, and also has significant seasonal variations (higher demand in summer
than in winter), like other coastal areas (Jiménez 2001).
Table 4. Differences between scenarios.
Resource hm
Month
3
Percentage difference respect to the reference period %
1986-2005 2016-2035 2046-2065 2081-2100 2016-2035 2046-2065 2081-2100 2016-2035 2046-2065 2081-2100 2016-2035 2046-2065 2081-2100
Reference RCP4,5 (1) RCP4,5 (2) RCP4,5 (3) RCP8,5 (1) RCP8,5 (2) RCP8,5 (3) RCP4,5 (1) RCP4,5 (2) RCP4,5 (3) RCP8,5 (1) RCP8,5 (2) RCP8,5 (3)
Oct
10
0.25
0.23
0.19
0.19
0.24
0.18
0.14
7.11
22.99
24.57
4.24
26.56
43.01
Nov
11
0.43
0.41
0.32
0.31
0.41
0.30
0.22
6.13
26.92
29.30
4.16
29.88
49.44
Dec
12
1.06
1.01
0.77
0.75
1.03
0.74
0.51
4.47
27.91
29.40
3.35
30.61
52.44
Jan
1
1.55
1.51
1.17
1.17
1.52
1.13
0.85
2.91
24.71
24.85
1.94
27.10
45.28
Feb
2
1.41
1.38
1.13
1.14
1.39
1.09
0.87
2.42
20.27
19.63
1.45
23.03
38.53
Mar
3
1.23
1.19
0.95
0.95
1.20
0.91
0.70
3.71
22.57
22.87
2.55
26.24
43.14
Apr
4
0.97
0.91
0.73
0.72
0.93
0.69
0.51
6.10
24.46
25.93
3.93
29.00
46.91
May
5
0.73
0.66
0.54
0.52
0.69
0.50
0.37
9.82
26.46
28.42
5.36
32.16
49.35
Jun
6
0.54
0.48
0.39
0.38
0.51
0.36
0.27
11.47
27.22
29.15
6.06
32.78
49.20
Jul
7
0.39
0.35
0.29
0.28
0.37
0.27
0.21
10.95
25.98
27.85
6.04
31.20
47.07
Aug
8
0.30
0.27
0.22
0.22
0.28
0.21
0.16
10.14
24.42
26.20
5.70
29.25
44.48
Sep
9
0.23
0.21
0.18
0.17
0.22
0.17
0.13
9.32
22.68
24.36
5.27
27.25
41.69
9.10
8.60
6.88
6.80
8.79
6.55
4.95
5.54
24.42
25.32
3.39
28.08
45.61
Total
4 CONCLUSIONS
This preliminary research concludes that Sacramento model is quite representative of the system real conditions for carbonate aquifers. Thus, the obtained results might be influenced by
the higher number of parameters used for Sacramento model. The high inertness that this aquifer has cannot mitigate the effects of climate change on monthly values of water resources. The
increase in temperature and decrease in precipitation (Table 1) generate a high impact, with decreases of the resource much higher than foreseeable if only it has taken into account the decrease in rainfall. In this regard, the continuation of the work described in this research has
been proposed on other systems.
The estimated parameters used in this research by Sacramento model can be considered useful for systems that present a similar hydrogeological behavior and without available data series
of hydrometric to perform a calibration thereof.
The hydrological response of the system under the conditions of climate change is affected
by many sources of uncertainties, arising from the selected models. It is also affected by future
changes in land use that may occur in the area.
The results obtained in this research must be considered preliminary until a regionalization
of data from global circulation models is done. However, the results are similar to the predictions for the Mediterranean region that are included in the AR5 which has just been published
recently (October 2014).
Finally, the use of Sacramento model is recommended in hydrological planning whenever a
high prior knowledge of the hydrological and hydrogeological behaviour of the study area.
5 ACKNOWLEDGEMENTS
This work is a contribution to the project Water Accounting in a Multi-Catchment District
(WAMCD-8.06.UE/44.7066) of European Commission, and the Research Group RNM-308 of
the Andalusian Government.
6 REFERENCES
Andreo, B., Carrasco, F., Bakalowicz, M., Mudry, J. and Vadillo, I.. 2002. Use of hydrodynamic and hydrochemistry to characterise carbonate aquifers. Case study of the Blanca–Mijas unit (Málaga, southern
Spain). Environmental Geology, 43 (1-2): 108-119.
Burnash, R.J., Ferral, R.L. and McGuire, R.A., 1973. A Generalized Streamflow Simulation SystemConceptual Modeling for Digital Computers. Joint Federal-State River Forecast Center, Sacramento,
CA. 204 p.
Cabezas, F., Estrada, F. and Estrela, T., 1999. Algunas contribuciones técnicas del Libro Blanco del Agua
en España. Ingeniería Civil, 115, 79-96.
Carreras, A., 1996. Investigación y explotación del acuífero de la Sierra de las Cabras (S. José del Valle,
Cádiz). Jornadas sobre Recursos Hídricos en Regiones Kársticas, Vitoria (España), 9-21.
Chauve, P., 1960-62. Structure Géologique de la Région Centrale de la Province de Cadix (Espagne).
Memories hors de sèrie de la Societe Geologique de France, 1: 257-264.
Delannoy, J.J., 1998. Contribución al conocimiento de los macizos kársticos de las Serranías de Grazalema y de Ronda. En: J.J Durán y J.L. Martínez (Eds.) El Karst en Andalucía, Instituto Tecnológico
Geominero de España; Madrid (España), 93-129.
Estrela, T. and Quintas, L., 1996. El sistema integrado de modelización precipitación-aportación SIMPA.
Ingeniería Civil, 104, 43-52.
IGME, 2013. Mapa de permeabilidades de España a escala 1/200.000.
ITGE, 1990. Mapa geológico de España 1:50.000. Hoja 1063 Algar. Madrid (España).
IPCC, 2013: Climate Change 2013: The Physical Science Basis. Contribution of Working Group I to the
Fifth Assessment Report of the Intergovernmental Panel on Climate Change [Stocker, T.F., D. Qin, G.K. Plattner, M. Tignor, S.K. Allen, J. Boschung, A. Nauels, Y. Xia, V. Bex and P.M. Midgley (eds.)].
Cambridge University Press, Cambridge, United Kingdom and New York, NY, USA.
Jiménez, P.; Andreo, B.; Durán, J.J.; Carrasco, F.; López-Geta, J.A.; Vadillo, I. and Vázquez, M., 2001.
Estudio hidrodinámico del manantial de El Tempul (Sierra de las Cabras, Cádiz, Sur de España). Boletín Geológico y Minero, Vol. 112 (2): 85-102.
Jiménez, P., 2011. Los acuíferos carbonáticos del Sur de España. Caracterización y clasificación a partir
de sus respuestas naturales. Académica Española–Lap Lambert Academic Publising GmbH&Co. 384 p.
Martín Algarra, A., 1987. Evolución geológica Alpina del contacto entre las Zonas Internas y las Zonas
Externas de la Cordillera Bética (Sector Occidental). Tesis Doctoral, Universidad de Granada (España). 1171 páginas.
Nash, J.E. and Sutcliffe, J.V., 1970. River flow forecasting through conceptual models, part I: A discussion of principles. J. Hydrol. 10, 282-290.
Paredes-Arquiola, J., Solera Solera, A., Andreu Álvarez, J. and Lerma Elvira, N., 2012. Manual técnico
de la herramienta EVALHID para la evaluación de recursos hídricos. Grupo de Ingeniería de Recursos
Hídricos. Universitat Politècnica de València.
Ruiz, J. M., 1999. Modelo distribuido para la evaluación de recursos hídricos. Monografías CEDEX M67.
Van Dijk, A., Kirby, J., Paydar, Z., Podger, G., Mainuddin, M., Marvanek, S. and Peña-Arancibia, J.,
2008. Uncertainty in river modeling across the Murray-Darling Basin. A report to the Australian Government from the CSIRO Murray-Darling Basin Sustainable Yields Project CSIRO: Water for a
Healthy Country National Research Flagship.
http://www.clw.csiro.au/publications/waterforahealthycountry/mdbsy/technical/OSurfaceWaterModelUncertainty.pdf