Transcript
Quickcheck Math: user guide
Data Management and Probability
Grade 1
Student Resource Contents
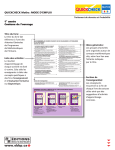
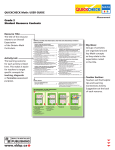
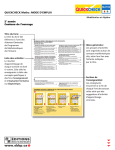
Resource Title:
The title of the resource
relates to an Overall
Expectation
of the Ontario Math
Curriculum.
Activity List:
The learning outcome
for each activity is listed
here. This makes it easier
for teachers to target
specific concepts for
teaching, diagnostic
or formative assessment
purposes.
READ AND DESCRIBE DATA PRESENTED IN GRAPHS AND PICTOGRAPHS
Student Activities
Data can be organized into categories by sorting
objects using one attribute
Match each group of objects to its sorting colour .............1
Match each colour to its group of objects..........................2
Match each group of objects to its sorting shape..............3
Match each shape to its corresponding set of objects.......4
The same group of objects can be sorted
in different ways
Sort each group of objects by colour ..................................5
Sort each group of objects by shape...................................6
Connect each picture to its representation by colour .......7
Connect each numeral to its set of shapes sorted
by number of straight sides .................................................8
Relate each set to its representation on a sorting mat .....9
Relate each tower to its decomposition by colour ..........10
Compare each tower
to the pictograph of its decomposition by colour ...........11
Data can be organized and represented
in pictographs and graphs
Relate each composition
to its pictograph representation .......................................12
Relate each composition
to its representation on a graph .......................................13
Compare each pictograph
to its corresponding graph ................................................14
Relate each group of insects
to its pictograph representation .......................................15
Relate each group of insects
to its representation on a graph .......................................16
Connect each picture to its pictograph ............................17
Read and interpret data in pictographs and graphs
Connect each double five frame representation
to its group of objects........................................................18
Compare each graph
to its representation using numerals ................................19
Using colour, compare each pictograph
to its representation using numerals ................................20
Connect each pictograph
to its group of sea creatures..............................................21
Connect each graph to its group of sea creatures ...........22
Using colour, compare each graph
to its group of objects........................................................23
Compare each graph
to the representation of the difference shown ...............24
1m70.indd couv:2
23/04/09 18:31:15
Teacher Section
How to Use QUICKCHECK Math
and Tips for Success .......................................................25
Learning Connection Activity Suggestions
Mathematical Process Expectations:
Representing, Reasoning and Proving, Connecting.........26
GETTING READY TO USE QUICKCHECK
You need a book and a case with six tiles.
■ Open the book to Activity 1.
■ Put the empty tile case
over the book.
■ The CHECKMARK will cover
the answer key.
■ There are six squares
in the top section.
■ Place each tile on the square
that has the same icon.
1m70.indd int:1
■ Lift each tile to reveal
the image underneath.
■ Transfer each tile to its
corresponding image below.
■ Close the cover
of the tile case.
■ Flip the tile case up.
■ The answer key will appear.
■ The tile pattern should
match the answer key.
23/04/09 18:31:15
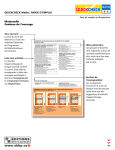
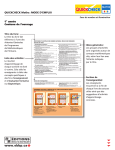
Big Ideas:
Groups of activities
are organized around
key Math concepts
as they relate to the
expectation noted
in the title.
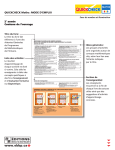
Teacher Section:
Teachers will find helpful
tips and Learning
Connections Activity
Suggestions at the back
of each resource.