Transcript
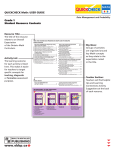
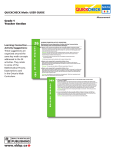
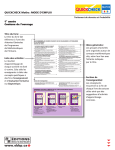
Quickcheck Math: user guide
Data Management and Probability
Grade 1
Teacher Section
Learning Connection
Activity Suggestions:
These suggestions are
organized around the
same key math concepts
addressed in the 24
activities. They relate
to some of the
Mathematical Process
Expectations used
in the Ontario Math
Curriculum.
26
T
E
A
C
H
E
R
S
E
C
T
I
O
N
LEARNING CONNECTION ACTIVITY SUGGESTIONS
Mathematical Process Expectations:
Representing, Reasoning and Proving, Connecting
Data can be organized into categories by sorting objects using one attribute
Look at sorting objects from your class. Use the contents of the class recycling bin. Remove any sharp
or unsafe items first. Then, using gloves, have small groups take turns sorting the contents using one
attribute: colour, shape, size, texture. Or tell students to sort plastic from non-plastic recyclables.
Which group has more? How do you know? Connect the results to your recycling habits as a class.
What conclusions can you make? As a class would you like to change your behaviour? Set a goal.
Sort the bin again in a month? Are you meeting your class goal?
The same group of objects can be sorted in different ways
Divide the class into three groups. Ask each group to choose a sorting rule and physically sort
themselves. For fun, give them a time limit. When done, have them choose a different sorting rule
to sort their group. For example, sort themselves by birthday month. Once each group has finished,
have it present to the class. Can the class guess the sorting rules?
Challenge: Can a group create a sorting rule that uses two attributes?
Data can be organized and represented in pictographs and graphs
Generate a question: Working in small groups / pairs have students think of something they would
like to learn about their classmates. It could be their favourite flavour of ice cream; their favourite
sport; their favourite animal.
Make a chart: Have students select three or four options of favorites for their classmates to chose
from and list them on the top of a chart mounted on a clipboard. Give each group a separate time
to canvas their classmates’ opinions and record them on their chart.
1m70.indd int:51
T
E
A
C
H
E
R
S
E
C
T
I
O
N
1m70.indd int:52
Make a concrete pictograph or graph: Using a grid prepared
by the teacher on a white / blackboard,
23/04/09 18:32:14
Bristol board or chart paper, have each group organize their survey information. Groups can use
sticky notes, construction paper, marker / chalk-shading, magnets or pictures to represent the number
of responses for each choice. Have students put an appropriate title on their graph / pictograph.
Communicate results: Using their graphs, have each group present its findings and conclusions
to the class. Using number sentences and / or visual representations each group must give reasons for
their interpretations.
Read and interpret data in pictographs and graphs
Ask a question: As a class, brainstorm questions you’d like answered that relate to your shared
class experience: How much rain have we had this month? Do we need any new school supplies for
the classroom? What gym equipment do we have? Choose one. Sort the data and record appropriate
quantities of each set of data.
Make a concrete representation: Using Bristol board or construction paper already prepared with
a grid, have small groups make a concrete graph using connecting cubes — a different colour
connecting cube tower for each group of data. Or try using a shower liner and hockey tape to make
a large foldable grid. Students may use beanbags as representations on the grid.
Describe data represented using comparative language: What conclusions can you make from
the data on the graph / pictograph? Have students use comparative language to describe the differences
between the quantities represented; e.g. “There were more bean bags than hoops but more hoops
than hockey sticks.”Have students then quantify the difference; e.g. “We have ten more markers than
pencils.”Students or groups of students then prove their statements in a concrete way using
the connecting cubes / bean bags or other concrete manipulatives.
Challenge: In partners use number sentences to show the difference between two categories.
23/04/09 18:32:14