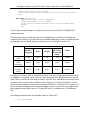
1
Uncatalogued document Aboriginal Peoples Survey 2012: User’s Guide to the Public Use Microdata File (PUMF) by Ron Budinski and Éric Langlet Social and Aboriginal Statistics Division & Social Survey Methods Division Statistics Canada March 2015 Aboriginal Peoples Survey, 2012: User’s Guide to the Public Use Microdata File Contents Introduction .......................................................................................................................... 1 1. Purpose and overview of the User’s Guide ..................................................................... 2 2. Description of the Public Use Microdata File (PUMF) ...................................................... 3 2.1 2.2 2.3 2.4 2.5 2.6 3. Introduction to the variables .......................................................................................... 7 3.1 3.2 3.3 3.4 4. What is an estimate? .................................................................................................. 15 Unweighted counts for subpopulations and cross-tabulations ................................. 15 Dealing with missing values ........................................................................................ 17 Using weighted data ................................................................................................... 18 The reliability of estimates: coefficients of variation (CVs) ............................................ 20 5.1 5.2 5.3 5.4 6. Data dictionary (codebook) and structure of the Public Use Microdata File (PUMF) . 7 Universe statements................................................................................................... 11 Response and non-response categories..................................................................... 12 Key APS variables ........................................................................................................ 13 Estimation ................................................................................................................... 15 4.1 4.2 4.3 4.4 5. General content of the Aboriginal Peoples Survey PUMF ........................................... 3 The bootstrap weight file ............................................................................................. 4 Syntax programs for SAS, SPSS and Stata ..................................................................... 5 Linking files ................................................................................................................... 5 Creating sub-files for faster processing ........................................................................ 6 Access to the Public Use Microdata File and the bootstrap weight file ...................... 6 Sampling error, CVs and the bootstrap method ........................................................ 20 Use of statistical software packages .......................................................................... 21 The Fay adjustment factor .......................................................................................... 22 Confidence intervals ................................................................................................... 23 Guidelines for the dissemination of estimates .............................................................. 24 6.1 6.2 6.3 6.4 Confidentiality guidelines ........................................................................................... 24 Minimum unweighted count guidelines .................................................................... 25 Reliability guidelines ................................................................................................... 26 Rounding guidelines ................................................................................................... 27 i Aboriginal Peoples Survey, 2012: User’s Guide to the Public Use Microdata File 7. Special considerations for analysis and interpretation .................................................. 28 7.1 7.2 8. Age on reference date ................................................................................................ 28 Comparisons with other surveys ................................................................................ 28 Step-by-step summary of guidelines for using the Public Use Microdata File (PUMF) .... 29 Appendix A: Acronyms related to the Aboriginal Peoples Survey.......................................... 30 Appendix B: Example of calculating estimates, coefficients of variation and confidence intervals .............................................................................................................................. 32 Appendix C: SPSS and the use of bootstrap weights ............................................................. 38 Appendix D: An overview of WesVar ................................................................................... 39 References .......................................................................................................................... 40 ii Aboriginal Peoples Survey, 2012: User’s Guide to the Public Use Microdata File Introduction The 2012 Aboriginal Peopes Survey (APS) is a national survey on the social and economic conditions of First Nations people living off reserve, Métis and Inuit, aged 6 years and over. The objectives of the APS are to identify the needs of these Aboriginal groups and to inform policy and programs aimed at improving the well-being of Aboriginal peoples. The APS aims to provide current and relevant data for a variety of stakeholders, including First Nations, Métis and Inuit organizations, communities, service providers, researchers, governments and the general public. The APS has been conducted by Statistics Canada since 1991, providing a range of social and economic indicators about Aboriginal peoples. It is a postcensal survey, designed to follow and complement the Census of Population and the National Household Survey (NHS). The 2012 APS represents the fourth cycle of the survey and the first to take a focused thematic approach. The focus for 2012 is on issues of education, employment and health. The survey will continue to provide core indicators in the areas of language, income, housing and mobility. Funding was provided by three federal departments: Aboriginal Affairs and Northern Development Canada, Health Canada and Employment and Social Development Canada (formerly called Human Resources and Skills Development Canada). This cycle of the APS was conducted from February 6, 2012 to July 30, 2012. Over 50,000 people were selected to participate in the survey and the final response rate was 76%. In the 2012 Aboriginal Peoples Survey, an Aboriginal person is anyone who reported being: A First Nations person (North American Indian), Métis or Inuk (Inuit); a Status Indian (that is, a Registered or Treaty Indian as defined by the Indian Act of Canada); and/or; a member of a First Nation or Indian band. A person may have reported more than one group: for example, a respondent could have selfidentified as both First Nations and Métis. For the 2012 APS Public Use Microdata File (PUMF), persons who reported more than one Aboriginal identity group are aggregated into one group called “Multiple Aboriginal identities”. The APS selects its sample from respondents who reported certain answers to the 2011 National Household Survey (NHS) questionnaire; specifically, respondents who reported having either Aboriginal identity or Aboriginal ancestry. Please refer to the Aboriginal Peoples Survey, 2012: Concepts and Methods Guide, chapter 3, “Survey design”, for more information on the APS sample selection. 1 Aboriginal Peoples Survey, 2012: User’s Guide to the Public Use Microdata File For more information about the Aboriginal Peoples Survey, please visit http://www.statcan.gc.ca/APS or contact Statistics Canada by email at [email protected] or call 1 (800) 263-1136. 1. Purpose and overview of the User’s Guide This User’s Guide is intended to provide detailed instructions to researchers on how to use the Public Use Microdata File (PUMF) for the 2012 Aboriginal Peoples Survey (APS). This reference document includes guidelines for conducting statistical analyses with the data files as well as guidelines for disseminating results. It is very important that this User’s Guide to the Public Use Microdata File (PUMF) be used in conjunction with the Aboriginal Peoples Survey, 2012: Concepts and Methods Guide, which provides an in-depth understanding of the subject matter and definitions used in the survey as well as the technical details of sampling design, field work and data processing for the APS. The Concepts and Methods Guide’s discussion of data quality also allows users to review the strengths and limitations of the survey data for their particular needs. Orientation to the files This chapter of the User’s Guide provides a brief overview of the guide itself. Chapter 2 discusses the structure and content of the APS PUMF and the bootstrap weight file, and provides instructions on linking these two files for data analysis. This chapter also mentions the syntax programs provided with the PUMF to create usable software specific data files, and concludes with a discussion on the means of access to the PUMF for data users. Chapter 3 orients researchers to the APS variables in terms of the different types of variables, standard categories of response and non-response, and universe statements describing target populations for each variable. Chapter 3 also includes a list of key variables most likely to be used by researchers, and presents the data dictionary (codebook) as a key resource for data users. Guidelines for estimation and dissemination Chapter 4 introduces the topic of population estimates. The 2012 APS PUMF domains of estimation are outlined, and how they differ from the APS analytical file domains of estimation is explained. This chapter also discusses how to deal with missing values and the proper use of weighted data for producing population estimates. Chapter 5 focuses on procedures to follow for determining the variance and standard error of estimates using bootstrap weights, and thus establishing the reliability levels of research results. Chapter 6 centres on user guidelines related to the dissemination of findings, from confidentiality and minimum unweighted counts, 2 Aboriginal Peoples Survey, 2012: User’s Guide to the Public Use Microdata File to reliability and publishing standards and the use of rounding procedures. Chapter 7 highlights special issues that may arise in conducting analyses with the APS PUMF, including notes on agerelated data and comparison of the APS with other surveys. Chapter 8 gives a summary of the steps required to follow the Statistics Canada guidelines for estimation and dissemination. Supporting documents A set of appendices to the User’s Guide provides helpful information, including a list of acronyms used in this guide. In addition, specialized instructions and examples of population estimation and coefficient of variation (CV) calculations using bootstrap weights are included to further assist researchers in conducting their analyses. Some special notes are also given for users of SPSS and WesVar. For a full description of the content and methodology of the Aboriginal Peoples Survey, data users are referred to the Aboriginal Peoples Survey, 2012: Concepts and Methods Guide. The Concepts and Methods Guide is designed to assist data users by providing relevant information on survey content and concepts, sampling design, collection methods, data processing, data quality and product availability. Chapter 1 introduces the survey’s background and objectives; Chapter 2 gives important definitions and describes the survey’s themes; Chapters 3 through 5 explain the APS sample design and outline the data collection and processing steps; Chapter 6 describes the weighting method used; Chapters 7 and 8 review data quality and address comparability of the 2012 APS data with data from other sources; Chapter 9 lists survey products including analytical articles, data tables and reference material; Appendices provide additional definitions and links to other relevant documentation. 2. Description of the Public Use Microdata File (PUMF) 2.1 General content of the Aboriginal Peoples Survey PUMF The 2012 Aboriginal Peoples Survey (APS) Public Use Microdata File contains information collected by the APS 2012 questionnaire, for all respondents age 6 years and over. The APS PUMF also includes one variable linked from the 2011 National Household Survey (NHS). The 2012 APS analytical file, which was made available in November 2013 to researchers through Statistics Canada’s Research Data Centres (RDCs) or through the Real Time Remote Access (RTRA) tool at Statistics Canada, contained detailed data collected from the APS questionnaire. However, since the PUMF is a free-of-charge data file provided to a much wider range of users than the analytical file, the level of detail in the PUMF is not as fine as that of the analytical file and actions have been taken to reduce or eliminate the risk of disclosure on the PUMF. These actions include: 3 Aboriginal Peoples Survey, 2012: User’s Guide to the Public Use Microdata File Reducing the number of records for respondents included in other postcensal survey PUMFs; Reducing the risk for respondents included in one of the three National Household Survey (NHS) PUMFs; Selecting only a subsample of APS respondents for inclusion on the PUMF in order to reduce the risk of disclosure for respondents with small weights; Dropping from the PUMF selected variables that were present on the National Household Survey (NHS) PUMF data files; Assessing disclosure risk occurring because of overlap between the APS PUMF and the APS analytical file which is present in the RDCs; Limiting the level of geographic detail available on the PUMF; Limiting the amount of family and household information available on the PUMF; Dropping from the PUMF selected respondent-level variables that were present on the APS analytical data file; Aggregating codes and cap variables selected for inclusion in the PUMF; Controlling for the risk of residual disclosure of variables or categories removed from the PUMF through the questionnaire’s skip patterns; and, Suppressing selected data points for certain respondents in some of the variables selected for inclusion in the PUMF. As a result, the PUMF contains 24,803 respondent records and 326 variables. Please refer to section 3.1 of this document for more information on the structure of the PUMF. 2.2 The bootstrap weight file One other file of importance to users of the APS PUMF is the file containing the bootstrap weights. As explained in more detail in section 5.1, these bootstrap weights allow users to estimate sampling error for estimates produced from the survey data and thus to assess the reliability of these estimates. This file contains a record for each survey respondent. For each record, 1,000 bootstrap weights are provided (variables WRPP0001 through WRPP1000). The bootstrap weight file needs to be linked to the PUMF when the user wants to assess the reliability of their survey results, and thus establish whether their estimates can be disseminated. The linking process is explained in section 2.4 below. Bootstrap weights are not to be confused with the person-weights for the survey. Personweights, one assigned per respondent record, serve to create population estimates of various characteristics of interest based on survey data of a sample of the population. This process is described in chapter 4. Once population estimates are produced, bootstrap weights serve to assess the reliability of those estimates (see chapter 5). For the 2012 APS, the person-weight variable PUMFWGHT is included in both the APS PUMF and the bootstrap weight file. 4 Aboriginal Peoples Survey, 2012: User’s Guide to the Public Use Microdata File 2.3 Syntax programs for SAS, SPSS and Stata The APS PUMF and bootstrap weight file are produced in a flat-file text format for ease of use by different statistical software packages. Also provided are software-specific syntax programs which facilitate the use of the data file and bootstrap weight file by three widely used statistical analysis programs: SAS (Statistical Analysis System), SPSS (Statistical Package for the Social Sciences), and Stata. These programs are provided in both English and French versions, and include commands required to read the text files into the required format, as well as the formats and labels for all the variables on the PUMF. Prior to working with the PUMF and bootstrap weight file, APS data users must first run the syntax programs for each of the two files for the statistical software of their choice. 2.4 Linking files In order to evaluate the reliability of any estimates produced from the PUMF, users will need to link the bootstrap weight file to the microdata file. Data linkage requires a common “linking” variable that exists and is identical on all files to be linked, and that takes a unique value for each respondent record. For the APS PUMF, the linking variable is called PUMFID and is found on both the microdata file and the bootstrap weight file. Once linked, the PUMF will be augmented by the addition of 1,000 bootstrap weight variables covering all PUMF records. It is recommended that the bootstrap file be specified as the second file in the data linkage, so that the bootstrap weight variables will follow all the PUMF variables in the new linked file. For example, using SAS programming, files can be linked using a few simple steps to merge files by PUMFID. These two examples illustrate alternative methods to merge the files, one method using the DATA step and one using the SQL procedure: DATA apspumf_bootstrap_merged; MERGE pumf_aps (in=a) aps_bootstrap (in=b); BY pumfid; IF a and b; RUN; PROC SQL; CREATE TABLE apspumf_bootstrap_merged as SELECT a.*, b.* FROM pumf_aps as a inner join aps_bootstrap as b on a.pumfid = b.pumfid; QUIT; 5 Aboriginal Peoples Survey, 2012: User’s Guide to the Public Use Microdata File Users should be aware that the PUMF and bootstrap weight file are already sorted by PUMFID after being created by running the syntax programs, so there is no need to sort the two files prior to linking them in the first method. 2.5 Creating sub-files for faster processing As a result of working with large combined files for certain analyses, and using the large number of bootstrap weights, processing time for APS data may become time-consuming. To assist in speeding up processing time, researchers are strongly encouraged to create smaller sub-files to work with by selecting only those variables of direct interest to their study. A SAS programming example of sub-file creation for a study of labour market characteristics for single identity First Nations and Métis living in Census Metropolitan Areas (CMAs) or other population centres, by age and sex, is shown below: DATA apspumf_abgroup_labour_subfile SET aps_bootstrap_merged (KEEP=pumfid geo_pc didentg dlfstat dftptg deverwkg djobteng docc11g ageyrsg sex pumfwght wrpp0001-wrpp1000 where=(didentg in (1,2))); RUN; Alternatively, this example shows how the subfile created in the previous example can be combined with the linkage between the PUMF and the bootstrap weight file, in one step: PROC SQL; CREATE TABLE apspumf_abgroup_labour_subfile as SELECT geo_pc didentg dlfstat dftptg deverwkg djobteng docc11g ageyrsg sex, b.* FROM pumf_aps(where=(didentg in (1,2))) as a inner join aps_bootstrap as b on a.pumfid = b.pumfid; QUIT; In this example, all variables in the bootstrap weight file – which includes PUMFID and the person weight variable PUMFWGHT – are retained in the SELECT statement for the merged file, by the use of the asterisk (*). Therefore PUMFID and PUMFWGHT do not need to be specified among the PUMF variables to be retained on the merged file. 2.6 Access to the Public Use Microdata File and the bootstrap weight file The 2012 APS PUMF is distributed to universities across Canada through Statistics Canada’s Data Liberation Initiative (DLI). The data, together with statistical syntax programs and accompanying documentation, are provided in CD format for data users. 6 Aboriginal Peoples Survey, 2012: User’s Guide to the Public Use Microdata File 3. Introduction to the variables 3.1 Data dictionary (codebook) and structure of the Public Use Microdata File (PUMF) The document Aboriginal Peoples Survey 2012: Data Dictionary – Public Use Microdata File provides a comprehensive description of all the variables contained in the Aboriginal Peoples Survey (APS) Public Use Microdata File (PUMF), including variables corresponding to individual questionnaire items from the APS, derived variables which re-group or combine questionnaire items, and one variable linked from the National Household Survey (NHS). The variables are listed in the data dictionary in the same order they appear on the PUMF. A total of 326 variables are available for analysis. The following table lists the order of variables by type on the PUMF: Variables From PUMFID (randomly-generated unique identifier for linking purposes) PUMFWGHT (person-weight variable) Geographic variables Proxy interview indicator and demographic variables APS content variables Questionnaire item variables and derived variables NHS variable: RELIGDRG To Number of variables 1 GEO_PC GEO_INU 1 2 PROXY SEX 3 DIDENTG DWSUBGG 318 1 The type of information provided for each variable in the data dictionary is described below. 7 Aboriginal Peoples Survey, 2012: User’s Guide to the Public Use Microdata File Figure 3.1.1 APS 2012 Public Use Microdata File Data Dictionary descriptions 8 Aboriginal Peoples Survey, 2012: User’s Guide to the Public Use Microdata File Identifying information Variable name (as it appears on the data file) Question name (as it appears on the questionnaire, where applicable) Source This information helps users to identify the variables they need for analyses and provides a concordance between variables and their corresponding APS questionnaire items. The Source field provides information on the origin or derivation of the variable. In the case of variables corresponding to questionnaire items, this field identifies the original survey and survey question from which the question came, if it did not originate on the APS. In the case of derived variables, the Source field lists all input variables used to construct the derived variable, to help users locate component variables. Input variables include variables corresponding to questionnaire items, or other derived variables. Note, however, that some of these input variables are not found on the PUMF. These variables were included on the APS 2012 analytical file but were dropped from the PUMF. Data users are encouraged to refer to the document Aboriginal Peoples Survey 2012: Data Dictionary – Analytical File, provided with the reference documents for the 2012 APS PUMF, for more information on variables included on the analytical file but not included on the PUMF. Record layout information Variable length Position on data file 9 Aboriginal Peoples Survey, 2012: User’s Guide to the Public Use Microdata File This information will help users to locate variables of interest on the data file. Record layout information can be useful to researchers wishing to import and export data files using different software packages. Conceptual and analytical information Question text, in full Variable concept Universe statement Special notes Conceptual and analytical information helps researchers to better understand and select variables for analysis, as well as to better interpret the data output for each variable. Universe statements indicate the target group for each variable, since some questions were skipped for some respondents where questions did not apply to them. Universe statements are explained in more detail in section 3.2. Variable categories or values (response and non-response values) Category codes or values Category descriptions - labels At the heart of the data dictionary are the codes and code descriptions for each answer category for the variable, followed by the frequency distribution for these categories. As shown in the example above, categories include valid responses such as “Yes” and “No”, as well as non-response values such as a valid skip or different types of missing data (“Don’t know”, “Refusal” or “Not stated”). Definitions of these standardized non-response categories are provided in section 3.3 below. Data output Unweighted counts - frequencies Weighted population estimates – counts and percentages For each variable, frequency distributions are provided based on unweighted counts and on weighted counts (or population estimates). Percentages are also provided based on weighted data only. 10 Aboriginal Peoples Survey, 2012: User’s Guide to the Public Use Microdata File 3.2 Universe statements The variable universe refers to the target population for each variable. The universe varies from variable to variable because during data collection respondents were not asked questions which did not apply to them based on their earlier responses in the survey. When the variable represents a single item on the questionnaire, then all those who were asked that question constitute the universe for that question. This would include anyone who was asked the question, regardless of whether or not they provided a valid response. For the 2012 APS PUMF, the universe for several variables is “all respondents”. This is the universe for variables such as the geographic variables, age group, sex, and all survey weights. Some other direct and derived APS variables as well as the linked NHS variable also have this universe. In other cases, universes are more focused. For example, the condition to complete the block of questions on smoking (SMK) was that the respondent must have been more than 11 years of age as of the reference date of the survey (see section 7.1, “Age on reference date”). Therefore the universe for variable SMK_01, which refers to the first question, “At the present time, do you smoke cigarettes daily, occasionally or not at all?”, is AGE > 11. The next question in the block, “At what age did you begin to smoke cigarettes daily?” is only asked of respondents who answered 1 (Yes) to the first question, and so the universe for variable SMK_02G is SMK_Q01 = 1.1 The condition AGE > 11 does not need to be included in the universe for SMK_02G because this would have already been a condition for anyone who answered question SMK_Q01. For the 2012 APS PUMF, universe statements for all variables, with the exception of variables having the universe “all respondents”, are provided in both a technical format and a plainlanguage format. In a technical universe statement format, all the “conditional” requirements for the particular variable are specified with question numbers and numerical or categorical conditions, such as the previous examples for SMK_01 and SMK_02G. The plain-language universe statement provides the data user with a written description of the variable universe, which may be more comprehensible than the technical format, particulary in the case of variables with long and complicated technical universe statements. However, technical statements may be more “compact” and efficient than plain-language statements because they do not have to include conditions that are already implicit with the variables used in the technical statement. Therefore in the previous example, the technical universe statement for SMK_02G did not have to include the condition AGE > 11 (implicit by the variable SMK_01), but 1. The APS data dictionary uses question numbers rather than variable names in the universe statements for direct variables (i.e. for variables which corresponds directly to APS questions). Therefore, the universe statement in the example here is SMK_Q01 = 1 and not SMK_01 = 1. 11 Aboriginal Peoples Survey, 2012: User’s Guide to the Public Use Microdata File the plain-language universe statement, “Respondents aged 12 and over who currently smoke cigarettes daily”, must note that respondents aged 12 years and over are part of the variable universe, as this would not be apparent otherwise. As with the Source field, the technical universe statements may refer to variables that were included on the 2012 APS analytical file but were not included on the PUMF, and data users may consult the document Aboriginal Peoples Survey 2012: Data Dictionary – Analytical File for more information on these variables. 3.3 Response and non-response categories Response categories for APS variables include those which indicate valid responses and nonresponse. Each type of response category used within the APS is described briefly below. Important distinctions are made between different types of non-response, which include valid skips as well as missing data such as “Don’t know”, “Refusal” or “Not stated”. Special codes have been designated to each of these types of non-response to facilitate user recognition and data analysis. Guidelines for working with missing values when conducting statistical analyses are discussed in section 4.3 of this guide. Response An answer directly relevant to the content of the question that can be categorized into pre-existing answer categories, including “Other-specify”.2 Valid skip Indicates that the question was skipped because it did not apply to the respondent’s situation, as determined by valid answers to a previous question, or by a respondent’s characteristics such as age, for example. In such cases, the respondent is not considered to be part of the target population or universe for that question. Where a question was skipped due to an undetermined path (that is, a “Don’t know” or “Refusal” to a previous question caused the skip), the respondent is coded to “Not stated” for that question. Code is set to 6 as the last digit, with any preceding digits set to 9, depending on the variable length (for example, code would be “996” for a 3-digit variable). 2. For some questions that included an “Other – specify” category, one or more new categories were created during data processing when there were sufficient numbers of responses to warrant them. For more information, please refer to section 5.6.1 and Appendix B of the Aboriginal Peoples Survey, 2012: Concepts and Methods Guide. 12 Aboriginal Peoples Survey, 2012: User’s Guide to the Public Use Microdata File Don’t know The respondent was unable to provide a response for one or more reasons - for example, due to difficulty remembering or because they were responding for someone else. Code is set to 7 as the last digit, with any preceding digits set to 9, depending on the variable length (for example, “997” for a 3-digit variable). Refusal The respondent preferred not to respond, perhaps due to the sensitivity of the question. Code value ends in 8, with any preceding digits set to 9, depending on the variable length (for example, “998”). Not stated This indicates that the question response is missing and there is an undetermined path for the respondent, such as when a respondent did not answer the previous filter question or where an inconsistency was found in a series of responses. Code value ends in 9, with any preceding digits set to 9 also, depending on the variable length (for example, “999”). Not applicable 3.4 “Not applicable” is considered a valid response category. Even though a respondent may be asked the question, the situation or context of the question may not be applicable for the respondent. Key APS variables Table 3.4.1 below lists some of the 2012 APS PUMF variables expected to be frequently used by researchers, sorted by theme. For a comprehensive description of all variables, see the Aboriginal Peoples Survey, 2012: Data Dictionary - Public Use Microdata File. In addition, an overview of survey indicators is provided in the Aboriginal Peoples Survey, 2012: Concepts and Methods Guide, Appendix A, and in the on-line document Aboriginal Peoples Survey 2012 - High Level Indicators. 13 Aboriginal Peoples Survey, 2012: User’s Guide to the Public Use Microdata File Table 3.4.1 Key variables on the 2012 Aboriginal Peoples Survey PUMF Survey Theme Variable Description Record identification PUMFID Weights PUMFWGHT WRPP0001 through WRPP1000 GEO_PC Public Use Microdata file - identification number (randomly generated) Public Use Microdata file - Survey weight of a person Bootstrap weights (acronym for Weight, Replicate, Person-level, PUMF, number of replicate from 1 to 1,000 ) NHS - Census Metropolitan Area/Other Population Centre/Other Rural NHS - Residence inside or outside of Inuit Nunangat Age group of respondent on survey reference date Sex of respondent Marital status (respondent) Aboriginal identity population indicator by group Education group Highest level of education attained – Grouped Current school attendance by level Current school attendance status Labour force status Employment status - Full-time/part-time Current job/business - Tenure - Grouped Source of personal income (2011) - Main or only source Total personal income (2011) - Collapsed groups Total employment income (2011) - Collapsed groups Health status – self-perceived Mental health – self-perceived Level of food security in household Primary Aboriginal language – Ability level for speaking Primary Aboriginal language – Ability level for understanding First language learned in childhood - Aboriginal language Household - Number of persons - Grouped Household by family/non-family type Crowding index / Persons per room Geography Demographics Identification Education Labour Income Health Aboriginal language Household GEO_INU AGE_YRSG SEX MS_01G DIDENTG DEDUCG DHLOSGG DATTSCG DATTSCGG DLFSTAT DFTPTG DJOBTENG DSPI DTPIGRPC DEIGRPC GH1_01 MH_01G DFOODSEC DSKILSPK DSKILUND DFLABO DSIZHHGG DHHTYPEG DPERSRM 14 Aboriginal Peoples Survey, 2012: User’s Guide to the Public Use Microdata File 4. Estimation 4.1 What is an estimate? Researchers are typically interested in using survey data to study the characteristics of a population of interest, called the target population. For APS users, researchers are seeking to understand the entire APS target population, not just the experiences of the particular respondents who participated in the survey. The target population of the 2012 APS was comprised of the Aboriginal identity population of Canada, 6 years of age and over as of February 1, 2012, living in private dwellings, excluding people living on Indian reserves and settlements and in certain First Nations communities in Yukon and the Northwest Territories (NWT). (Please refer to the Aboriginal Peoples Survey, 2012: Concepts and Methods Guide, chapter 3 “Survey Design”, for full details on the target population). Estimation is the means by which researchers obtain values (estimates) about the target population so that conclusions can be drawn about that population as a whole based on information gathered from only a sample of the population. In a sample survey, the respondents “represent” the many other members of the surveyed population who were not included in the survey. For example, a 1% sample of individuals would mean that each sampled individual represents 100 individuals in the surveyed population. As explained in detail in the Aboriginal Peoples Survey, 2012: Concepts and Methods Guide (chapter 3 “Survey Design”), APS respondents do not constitute a simple random sample of the surveyed population. Instead, the survey is based on a complex multiple-phase stratified random sampling design. In order for the results of the APS to be representative of the population, a set of survey weights, called person-weights, were created for the survey, with one person-weight associated with each survey respondent. These weights reflect an unequal probability of selection for the sampled units as well as several adjustment factors which were applied to the sampling weights for such things as non-response and post-stratification (weights adjusted to NHS estimates). Please refer to the Aboriginal Peoples Survey, 2012: Concepts and Methods Guide, chapter 6 “Weighting”, for full details. Person weights, when applied to the survey data, enable APS data users to produce estimates for the entire Aboriginal identity population aged 6 years and over living in private dwellings (excluding those living on Indian reserves and settlements and in certain First Nations communities in Yukon and the Northwest Territories) in relation to particular characteristics of interest. 4.2 Unweighted counts for subpopulations and cross-tabulations The APS sample was designed to provide reliable estimates for certain combinations of geographic regions, Aboriginal groups and education groups. These groups of units for which estimates are targeted are called “domains of estimation”. More precisely, these groups are created by cross-tabulating the following variables: 15 Aboriginal Peoples Survey, 2012: User’s Guide to the Public Use Microdata File Geography o Inuit regions o Outside Inuit regions province/territory Atlantic provinces grouped Education group o Current attendees, elementary school (grades 1 to 6) o Current attendees, high school (grades 7 to 12) o Completers: high school diploma or equivalent o Leavers: no high school diploma or equivalent and not currently attending elementary or high school Aboriginal group o Inuit in Inuit regions o Inuit outside Inuit regions (rest of Canada) o Aboriginal groups combined for Atlantic Canada, Quebec (outside Nunavik), Yukon and Northwest Territories (outside Inuvialuit) o For Ontario, Manitoba, Saskatchewan, Alberta and British Columbia Status First Nations people living off reserve Non-Status First Nations people living off reserve Métis Please refer to the Aboriginal Peoples Survey, 2012: Concepts and Methods Guide (section 3.2 “Sampling Design”) for a detailed description of the domains of estimation for the APS. For confidentiality reasons, the domains of estimation used in the sample design had to be modified for the PUMF. In this case, these domains of estimation are created by crosstabulating the following variables: Aboriginal group and geography o Single Inuk identity – Nunangat / Outside Nunangat o Other Aboriginal group – CMA / Other population centre / Other rural Education group o Current attendees, elementary school (grades 1 to 6) o Current attendees, high school (grades 7 to 12) o Completers: high school diploma or equivalent o Leavers: no high school diploma or equivalent and not currently attending elementary or high school 16 Aboriginal Peoples Survey, 2012: User’s Guide to the Public Use Microdata File For more detailed subpopulations that may be of interest, researchers will need to ensure that the estimates produced respect the minimum requirements in terms of reliability. These reliability guidelines are described in section 6.3 below. Similarly, when generating crosstabulations of multiple variables for any population, these minimum requirements in terms of reliability must be applied to every cell in every table. Although researchers will be generating population counts based on weighted data, as described below, unweighted frequencies will also need to be produced for every weighted estimate to ensure that the estimate meets the confidentiality requirements of the Statistics Act. This is described in section 6.1 below. In selecting domains of interest for research, preliminary examinations of unweighted counts will therefore be helpful. It is important to note, however, that unweighted frequencies are for internal use only and are not to be disseminated (see section 6.1 for more details). 4.3 Dealing with missing values The term “missing values” includes responses such as “Don’t know”, “Refusal” or “Not stated”. These types of responses were described earlier in section 3.3 of this document, “Response and non-response categories”. (The category “Valid skip” is generally not considered a missing value since this category indicates that the question was not intended for the respondents in question. The same is true for the “Not applicable” categories for National Household Survey (NHS) variables, which are equivalent to valid skips. The NHS does not use the term “Valid skip” and therefore the NHS variables on the APS PUMF maintain the same category labels as they do on the NHS.) The inclusion or exclusion of each of the aforementioned missing values in any tabulation depends on the objective of the analysis. Users will need to define their estimation domain (total population of interest) for each variable in consideration of the missing values that exist for that variable, determining, for example, whether or not it is relevant to include missing values in the denominator which they use for calculating percentages. In some cases, researchers may decide that missing values are meaningful with respect to their research question. For example, estimates for the response of “Don’t know” could be useful to include when analysing data on a variety of topics such as perceptions of health, contact with school teachers or staff and frequency of and reasons for participating in traditional activities. Whether or not a respondent answered “Don’t know” or “Refused” could in itself be useful information to know. A question with a high proportion of “refused” for instance, may indicate that the question is a very sensitive one. Similarly, a high proportion of “Don’t know” may indicate that the question is difficult to answer. Several options can be considered for analysing a variable with some missing data. Appendix B of this document includes an example of how to calculate a weighted estimate when missing values are included in the denominator, in an examination of general health ratings. 17 Aboriginal Peoples Survey, 2012: User’s Guide to the Public Use Microdata File 4.4 Using weighted data Use of APS person-weights is essential for all population estimates based on APS survey data. Users should not disseminate any unweighted estimates. Whether producing simple statistical tabulations or conducting complex multivariate analyses such as regression analyses, for example, the user must always employ the person-weights. Otherwise, the estimates calculated on the basis of the PUMF cannot be considered representative of the survey target population and they will not correspond to those produced by Statistics Canada. As previously mentioned, this is due to the complexities of survey sampling for the APS and the detailed adjustments made to create final survey weights. The only exception to this rule of using weights for dissemination purposes is when analysts wish to make methodological statements about characteristics of the sample itself, such as overall number of respondents in the sample or response rates for individual questionnaire items or variables, for example. In making such methodological statements, researchers must identify these statistics as sample characteristics and not as population estimates. In some cases, it may be useful for researchers to look at unweighted data during the preliminary data exploration phase (in a preliminary regression analysis, for instance). Small unweighted cell counts can indicate that the unweighted count for a given subpopulation or question of interest may not support detailed analysis for that particular population or topic. Researchers can then determine an alternate course of analysis where the cell counts will support a more in-depth analysis. Nevertheless, in the stages of producing final estimates for a given study, weighted data must ultimately be used to make statements about the population of interest. Each respondent record on the APS PUMF has a unique person-weight attached to it. In order to produce estimates for a particular characteristic, the data user must use the person-weight for each respondent when making calculations about that characteristic. This person-weight appears on the PUMF as a variable called PUMFWGHT, and must be used to derive meaningful population estimates from the survey. There are various software packages available that will use the survey person-weight to produce estimates, including SAS, SPSS and Stata. Section 5.2 describes the software packages that can be used to estimate the reliability of these estimates, including SUDAAN, Stata and more recent versions of SAS. Below are two examples of how weighted estimates can be produced using the APS PUMF. 18 Aboriginal Peoples Survey, 2012: User’s Guide to the Public Use Microdata File Examples from the Public Use Microdata File (PUMF) As an example, suppose someone wants to estimate the number or proportion of people whose state of health was reported as "Excellent" among First Nations people (single identity only) living off reserve aged 6 and over. Note that this question is applicable to all respondents aged 6 and over. In what follows, the term “First Nations people” will be used instead of “First Nations people (single identity only) living off reserve”. GH1_01 – In general, would you say your health is 1 2 3 4 5 Excellent Very good Good Fair Poor Using SAS programming, the weighted estimates of the number and percentage of First Nations people reporting an ‘Excellent’ state of health, are obtained as follows: PROC FREQ data=pumf_aps(where=(DIDENTG=1)); tables GH1_01; weight PUMFWGHT; The population estimate of the number of First Nations people aged 6 and older reporting an ‘Excellent’ state of health is 126,990 (rounded to the nearest 10). The number of First Nations people aged 6 and older is 493,850 (rounded to the nearest 10). Hence, the corresponding proportion of off-reserve First Nations people aged 6 and older reporting an ‘Excellent’ state of health is 25.7% (this percentage includes missing values in the denominator). Note that the proportion of missing values (“Don’t know”, “Refusal” and “Not stated”) for this question is 3.9% among First Nations people aged 6 and over. See section 6.4 for rounding guidelines. Note that, in some cases, the proportion directly obtained by PROC FREQ could be slightly different as a result of applying the rounding guidelines. As another example, suppose one wants to estimate the average number of cigarettes smoked daily SMK_03 among First Nations people aged 15 and over who are daily smokers. Using SAS programming (including only valid responses in this case), the weighted average number of cigarettes smoked daily among First Nations daily smokers aged 15 and over is obtained as follows. PROC MEANS data=pumf_aps(where=(DIDENTG=1 and AGE_YRSG >= 4 and SMK_01=1 and SMK_03 < 996)) SUM SUMWGT; Var SMK_03; Weight PUMFWGHT; 19 Aboriginal Peoples Survey, 2012: User’s Guide to the Public Use Microdata File The weighted sum of the number of cigarettes smoked daily of all First Nations daily smokers aged 15 and over is 1,501,630 (rounded to the nearest 10). The number of First Nations daily smokers aged 15 and over with valid responses to SMK_03 (sum of the weights) is 107,320 (rounded to the nearest 10). Hence, the weighted average number of cigarettes smoked daily among First Nations daily smokers aged 15 and over with valid responses is 1,501,630/107,320 = 14.0 cigarettes per person per day (rounded to one decimal). Note that the average number of cigarettes could have been directly obtained by using the MEAN keyword instead of the SUM and SUMWGT keywords of the PROC MEANS statement. This method could result in a slightly different estimate in some cases due to the rounding guidelines that should be applied to calculate the weighted average (see section 6.4, rule 3). 5. The reliability of estimates: coefficients of variation (CVs) In chapter 4, the focus was on producing population estimates from the APS Public Use Microdata File (PUMF). In this chapter, guidelines are provided for determining the reliability of these estimates. This is done by calculating the coefficient of variation (CV) for an estimate, as described below. 5.1 Sampling error, CVs and the bootstrap method In the process of producing estimates for a population based on survey results, some level of error is inevitable. Somewhat different estimates might have been obtained if a complete census of persons had been conducted using the same questionnaires, interviewers, supervisors, processing methods and so on, as those actually used in the sample survey. The difference between an estimate derived from a sample and an estimate based on a comprehensive enumeration is known as the estimate’s “sampling error”. (For a detailed discussion of sampling error for the APS, please refer to the Aboriginal Peoples Survey, 2012: Concepts and Methods Guide, Chapter 7 “Data quality”, which discusses sampling and nonsampling error in relation to data quality.) The actual sampling error of a given survey is of course unknown, but it is possible to calculate an “average” value, known as the “standard error”. The absolute size of the standard error of an estimate is often less meaningful than its relative size compared to the estimate itself. For this reason, the standard error of an estimate is commonly divided by the estimate itself, with the resulting fraction expressed as a percentage. This measure is called the coefficient of variation (CV) of the estimate. The lower the CV, the greater the reliability of the estimate. The CV is the measure of sampling error used for the APS. Calculation of a precise coefficient of variation, or any other measure of sampling error, presents special challenges for the APS given the complexities of its sample design and of the 20 Aboriginal Peoples Survey, 2012: User’s Guide to the Public Use Microdata File different adjustments made to the initial sampling weights. It is therefore necessary to turn to specialized methods to estimate these measures of sampling error, such as re-sampling methods. Among these, a particular type of bootstrap method was developed for the APS. A complete description of this bootstrap method is provided in the Aboriginal Peoples Survey, 2012: Concepts and Methods Guide, Chapter 7 “Data quality” and in Langlet, E., Beaumont, J.-F. and Lavallée, P. (2008)3. For the APS PUMF data, 1,000 sets of bootstrap weights were generated. These can be used to produce sampling error estimates, and in particular coefficients of variation for any given estimate. In essence, this is done by calculating the value of the desired estimate using each set of bootstrap weights and then measuring the variability between the bootstrap estimates. Due to the particularities of the bootstrap method used, it is critical to apply a multiplicative factor to any sampling error estimate when using this method. This multiplicative factor is often referred as the “Fay adjustment factor” and is described in section 5.3. 5.2 Use of statistical software packages For the 2012 APS PUMF, it is necessary to use bootstrap weights in order to obtain a correct estimate of the variance or coefficient of variation (CV) of the estimate. A number of statistical software programs or packages have been developed over the years that are specifically designed for analyses of data from complex survey designs and that allow for variance estimation using replicated weights such as bootstrap weights. These include for example SUDAAN, WesVar, Stata and new versions of SAS. Other standard and/or older statistical analysis software packages including SPSS, versions of SAS before version 9.24 etc.) do not have an integrated procedure to calculate variance estimates from bootstrap weights when using data based on a complex survey design like the APS. Any software package that does not allow the proper use of bootstrap weights should not be used to evaluate the reliability of an estimate and should not be used to conduct statistical tests (significance tests, regression analysis, et cetera). 3. Langlet, É., Beaumont, J.-F., and Lavallée, P. (2008). Bootstrap Methods for Two Phase Sampling Applicable to Postcensal Surveys. Paper presented at the Statistics Canada's Advisory Committee on Statistical Methods, April 2008, Ottawa. 4. SAS version 9.2 and above can calculate variances from bootstrap weights (or other types of replicate weights such as jackknife and BRR weights). There are also a number of procedures, such as regression, logistic regression for instance, that accommodate replicate weights. Confidence intervals for medians using replicate weights are only available in SAS version 9.3 and above. 21 Aboriginal Peoples Survey, 2012: User’s Guide to the Public Use Microdata File Appendix B provides a detailed example from APS PUMF data for the calculation of estimates using SAS alone or using SAS in conjunction with SUDAAN to produce CVs and confidence intervals for the estimates. Users of SPSS are referred to Appendix C and users of WesVar to Appendix D. It should be noted that most software packages will not include references to bootstrap weights per se. These packages may mention “jackknife” and “Balanced Repeated Replication” (BRR). The BRR method uses the same formula as the bootstrap. The difference is that the replicate weights are calculated using the bootstrap as opposed to the BRR. However, once the BRR or bootstrap weights have been calculated, the formula is the same for both. For more information on the relationship between the bootstrap and the BRR method, please refer to Phillips (2004)5. 5.3 The Fay adjustment factor The specific bootstrap method used for APS can lead to negative bootstrap weights. For this reason, the bootstrap weights provided to the user were transformed. To obtain the correct sampling error estimates, variances have to be multiplied by 16. In addition, the CVs obtained (square root of the variance divided by the estimate itself) and the standard errors have to be multiplied by 4. Most software which produce sampling error estimates from bootstrap weights have an option to specify this adjustment factor such that the correct variance estimate is obtained without the need of an extra multiplication step. It is extremely important to use the appropriate multiplicative factor for any estimate of sampling error such as variance, standard error or CV. Omission of this factor would lead to erroneous results and conclusions. This factor is often specified as the “Fay adjustment factor” in software producing sampling error estimates from bootstrap weights. Note that if C is the variance multiplicative factor, some software packages (SAS in particular) use the parameter k instead where . In our case, since C=16, then k=0.75. Here are some examples on the use of the Fay adjustment factor for frequency tables in SAS 9.2 and above, SUDAAN 11 (same with many earlier versions) and Stata 11 (the specification is different in Stata 10). Suppose that the SAS dataset mydata contains the weight variable PUMFWGHT, the bootstrap weight variables WRPP0001-WRPP1000 and all required analysis variables. 5. Phillips, O. (2004) “Using Bootstrap Weights with WesVar and SUDAAN”. The Research Data Centres Information and Technical Bulletin. (Fall) 1(2):1-10. Statistics Canada Catalogue no. 12-002-XIE. http://www5.statcan.gc.ca/bsolc/olc-cel/olc-cel?catno=12-002-X20040027032&lang=eng 22 Aboriginal Peoples Survey, 2012: User’s Guide to the Public Use Microdata File 1. SUDAAN (PROC CROSSTAB) PROC CROSSTAB DATA=mydata DESIGN=BRR; WEIGHT pumfwght; REPWGT WRPP0001-WRPP1000 / ADJFAY=16; TABLES ...; ... 2. SAS (PROC SURVEYFREQ) PROC SURVEYFREQ DATA=mydata VARMETHOD=BRR (Fay=0.75); WEIGHT pumfwght; REPWEIGHTS WRPP0001-WRPP1000; TABLES ...; ... 3. Stata svyset [pweight=pumfwght], bsrweight(WRPP0001- WRPP1000) bsn(16) vce(bootstrap) mse svy: tab ... 5.4 Confidence intervals A confidence interval (CI) around an estimate indicates the degree of confidence that the interval contains the true population value. The CI places upper and lower bounds around a point estimate. It is affected by sample size and variability of the characteristic studied. The greater the sample and the lower the variability, the more narrow the interval and thus the more precise the estimate. Based on the central limit theorem related to characteristics that are normally distributed in the population, a 95% confidence interval for an estimate is one that is likely to contain the true population value 95% of the time and is defined as the estimate + 2 standard errors of the estimate (+ 1.96 to be more precise). Statistical software packages such as SAS (version 9.2 and above) or SUDAAN will generate a meaningful confidence interval using bootstrap weights for an estimate produced with complex survey designs such as the APS. For example, in making estimates in the form of row percentages and column percentages in tabulations, the output of SAS or SUDAAN contains the actual proportions, the standard error associated with each proportion (the CV can be directly obtained by SAS unlike SUDAAN which requires an extra step), and the lower and upper bounds of the confidence interval for each estimate. See Appendix B for an illustration of CIs. Use of confidence intervals for determining if the observed difference between two estimates is statistically significant 23 Aboriginal Peoples Survey, 2012: User’s Guide to the Public Use Microdata File Once the 95% confidence limits have been identified using software that can use bootstrap weights for variance estimation, the CIs can be used as a method for determining whether the difference between two estimates is statistically significant or not. If the two intervals overlap, it cannot be concluded that the underlying population quantities being estimated are different (for instance, the proportions of smokers for males and females). (Or, in more technical terms, the null hypothesis that there is no difference between the underlying population quantities being estimated, at the 5% significance level, cannot be rejected). See Appendix B for an example (“Determine if the observed difference between two estimates is statistically significant”). On the other hand, if the two intervals do not overlap, it can be concluded that the estimated population quantities being estimated are different (in more technical terms, the null hypothesis that there is no difference between the underlying population quantities being estimated can be rejected, at the 5% significance level). This method is known to be a bit conservative in the sense that significant differences may exist even if the two CIs overlap. On the other hand, if the two CIs do not overlap, a significant difference clearly exists. It is, however, preferable to be a bit more conservative than to be too liberal (rejecting the null hypothesis when there’s in fact no significant difference). A more accurate method is to construct a CI for the difference between the two quantities being estimated. 6. Guidelines for the dissemination of estimates It is important for the user to become familiar with the content of this chapter before publishing or otherwise disseminating any estimate calculated using the APS Public Use Microdata File (PUMF). This chapter reviews the established guidelines that users of the PUMF must follow regarding the release of research results. Dissemination guidelines fall into four major categories: confidentiality, minimum unweighted count, reliability, and rounding. By following the guidelines, users will be able to obtain figures which follow methods consistent with those used by Statistics Canada and which conform to established guidelines on rounding and dissemination. For examples illustrating the content of this section, see Appendix B. 6.1 Confidentiality guidelines Statistics Canada is prohibited by law from releasing any data that would divulge information obtained under the Statistics Act that relates to any identifiable person, business or organization, without the prior knowledge or the consent in writing of that person, business or organization. Confidentiality rules are applied to all data that are released or published to 24 Aboriginal Peoples Survey, 2012: User’s Guide to the Public Use Microdata File prevent the publication or disclosure of any information deemed confidential. If necessary, data are suppressed to prevent direct or residual disclosure of identifiable data. Confidentiality vetting rules are applied to all Statistics Canada survey results before the results are made public, regardless of the mode of data access. These rules are designed to ensure confidentiality for respondents. Table 6.1.1 below summarizes the confidentiality guidelines for the 2012 APS PUMF. All data must be released in aggregate form. In general, the release of unweighted data is prohibited except in very specific situations (see Table 6.1.1). Unweighted frequencies underlying weighted estimates must be at least 10. Rounding is required for all weighted descriptive estimates. For estimates pertaining to detailed geographies that are below the level of province and territory, more restrictive rules apply. Section 6.2 provides more information concerning minimum unweighted counts. Table 6.1.1 Confidentiality guidelines for the 2012 Aboriginal Peoples Survey Criterion 1) What is the minimum required unweighted frequency? 2) Is unweighted descriptive output allowed? 3) May unweighted and weighted descriptives both be released for this survey? 4) May both unweighted and weighted model output be released for this survey? 5) Is rounding required for all weighted descriptives? If yes, what is the rounding base? 6.2 2012 APS Guideline Notes 10 See section 6.2 below for more details NO ‐ prohibited Also see (3) below. NO Permission will usually be given ONLY in the case in which a journal requires both weighted and unweighted frequency tables for publication (letter from editor required). YES YES To the nearest 10 in most cases See section 6.4 below for more details Minimum unweighted count guidelines For the 2012 APS PUMF, a minimum unweighted count must be respected to meet confidentiality requirements of the Statistics Act. Indirectly, this minimum unweighted count is also important for the reliability of estimates. For the APS, the following minimum applies for unweighted frequencies for all descriptive statistics: The minimum unweighted frequency count must be at least 10. Any estimate based on fewer than 10 respondents must be suppressed for reasons of confidentiality. 25 Aboriginal Peoples Survey, 2012: User’s Guide to the Public Use Microdata File 6.3 In any given cross-tabulation, all cells not respecting the minimum criterion must be suppressed for reason of confidentiality. All other types of descriptive statistics must be calculated from at least this minimum number of observations. If the descriptive statistic is bivariate, then both contributing variables must have at least this minimum number of observations to contribute. For example, if a ratio is produced, both the numerator and the denominator must be based on at least the minimum number of observations. Reliability guidelines For APS, reliability is measured in terms of the coefficient of variation (CV) of the estimate, which is the standard error of the estimate divided by the estimate itself. Before disseminating and/or publishing estimates based on the PUMF, the user should consult the Table below and follow the sampling variability guidelines corresponding to the value of the coefficient of variation for the estimate. Table 6.3.1 Sampling variability guidelines Type of estimate Coefficient of variation (CV) in % 1. Acceptable CV ≤ 16.6 2. Marginal 16.6 < CV ≤ 33.3 3. Unacceptable CV > 33.3 Guidelines for dissemination Estimates can be considered for general unrestricted release. Requires no special notation. Estimates can be considered for general unrestricted release but should be accompanied by a warning cautioning subsequent users of the high sampling variability associated with the estimates. Such estimates should be identified by the letter E (or in some other similar fashion). Statistics Canada recommends not to release estimates of unacceptable quality. However, if the user chooses to do so then estimates should be flagged with the letter F (or in some other fashion) and the following warning should accompany the estimates: “The user is advised that . . . (specify the data) . . . do not meet Statistics Canada’s quality standards for this statistical program. Conclusions based on these data will be unreliable and most likely invalid. These data and any consequent findings should not be published. If the user chooses to publish these data or findings, then this disclaimer must be published with the data.” 26 Symbol E – use with caution F – too unreliable to be published Aboriginal Peoples Survey, 2012: User’s Guide to the Public Use Microdata File Publishing symbols Statistics Canada uses the following symbols to indicate the reliability of data and confidentiality suppression: E F X Use with caution Too unreliable to publish Suppressed to meet the confidentiality requirements of the Statistics Act. 6.4 Rounding guidelines To ensure that estimates produced from the APS PUMF will correspond to those produced by Statistics Canada, the user is strongly advised to follow the rounding guidelines provided below. Disseminating unrounded estimates could be misleading, since such estimates might appear to be more precise than they actually are. Moreover, rounding is a confidentiality protective measure that should be used for the APS. 1. Estimates of totals that appear in the body of a statistical table should be rounded to the nearest ten by the traditional rounding method (see description of method below). 2. Partial and grand totals in statistical tables should be calculated from their unrounded components, and then rounded to the nearest ten by the traditional rounding method. 3. Averages, proportions, rates and percentages should be calculated from rounded components, and then rounded (usually) to one decimal by the traditional rounding method. 4. Sums and differences of aggregates or ratios should be calculated from their corresponding unrounded components, and then rounded to the nearest ten or the nearest decimal using the traditional rounding method. 5. Confidence intervals for estimates should be calculated from their unrounded components, and then rounded (usually) to one decimal place by the traditional rounding method. (Since the estimate and the corresponding confidence limits are rounded independently, the estimate will not always appear exactly in the middle of the confidence interval.) 6. In the event of technical or other constraints, a rounding method other than traditional rounding may be used. In such cases, the estimates obtained may differ from the corresponding estimates produced by Statistics Canada. If so, the user is strongly advised to state the reason for these differences in the document disseminated. The traditional rounding method According to the traditional rounding method, if the first or only digit to be suppressed falls between 0 and 4 (e.g. the “3” in “823” when rounding to the nearest 10 or the “2” in when rounding to the nearest 100), the last digit retained does not change (e.g. the “2” in “823” 27 Aboriginal Peoples Survey, 2012: User’s Guide to the Public Use Microdata File remains the same when rounding to the nearest 10, resulting in “820” or the “8” remains the same when rounding to the nearest 100, resulting in “800”). If the first or only digit to be suppressed falls between 5 and 9 (e.g. the “5” in “865” when rounding to the nearest 10 or the “6” when rounding to the nearest 100), the value of the last digit retained is increased by one unit (1) (e.g. the “6” in “865” is increased by one unit when rounding to the nearest 10, resulting in “870” or the “8” is increased by one unit when rounding to the nearest 100, resulting in “900”). 7. Special considerations for analysis and interpretation This chapter describes special analytical issues for the 2012 Aboriginal Peoples Survey (APS) in order to assist users to better interpret survey findings, particularly in relation to reference periods, analyses related to age and comparisons with other surveys. 7.1 Age on reference date February 1, 2012 was used as the APS reference date. This date corresponds approximately to the beginning of data collection for the survey. Age is established based on this reference date and determines the questionnaire flow to be used. The questionnaire flows of some respondents might have been different had respondents’ current age at the time of the interview been used rather than age on the reference date, due to the time difference between the APS reference date and the interview date. These two dates could differ by up to six months. Since age is a core demographic variable of interest in data analysis, users should be aware of this issue when using the variable AGE_YRSG (age group of respondent on survey reference date), any variables derived in part from age of the respondent (for example, DATTSCG, DBMISTDG), or variables where age is a condition in the variable’s universe. 7.2 Comparisons with other surveys Due to a number of differences in methodology between the 2012 APS, previous cycles of the APS and other Statistics Canada surveys, comparisons of data between sources should be done with caution. Please refer to chapter 8 “Differences between the Aboriginal Peoples Survey and other data sources” in Aboriginal Peoples Survey, 2012: Concepts and Methods Guide, for more information. 28 Aboriginal Peoples Survey, 2012: User’s Guide to the Public Use Microdata File 8. Step-by-step summary of guidelines for using the Public Use Microdata File (PUMF) Appendix B provides a full example of how to produce estimates from APS PUMF data, how to measure the reliability of the estimates, and how to apply dissemination guidelines for the estimates. Below is a summary of all the steps required to follow the Statistics Canada guidelines for estimation and dissemination: 1. Create statistical software-readable data files for the PUMF and bootstrap weight file using software-specific syntax programs provided with the PUMF flat file data, for SAS, SPSS or Stata. 2. To estimate reliability of estimates, link the PUMF to bootstrap weight file, by merging files by PUMFID using a MERGE statement in a DATA step or using PROC SQL (both files are already sorted by PUMFID). Note: this step can be combined with the following step, as indicated in the SAS example in section 2.5. Bootstrap weight variables are named WRPP0001 to WRPP1000. 3. Create smaller subfiles if desired (strongly encouraged) for time-efficiency of analyses. 4. Run analyses with software of choice using person-weight variable PUMFWGHT for population estimates. 5. Produce unweighted frequencies underlying all estimates to ensure minimum unweighted counts of 10 for all cell counts. 6. Apply all confidentiality vetting rules. 7. Calculate coefficients of variation (CVs) of the estimates to assess their reliability. 8. Apply rounding rules to estimates. 9. Suppress unreleasable estimates based on unweighted counts for reasons of confidentiality or based on the value of the estimated CVs for reasons of reliability, and add cautionary notes where applicable. 10. Release weighted, aggregate, rounded, reliable data based on minimum required unweighted counts for all estimates together with the appropriate symbol if required (use symbol “E” if 16.6% < c.v. ≤ 33.3%), according to guidelines, indicating “Statistics Canada, 2012 Aboriginal Peoples Survey” as source. 29 Aboriginal Peoples Survey, 2012: User’s Guide to the Public Use Microdata File Appendix A: Acronyms related to the Aboriginal Peoples Survey Survey funders AANDC Aboriginal Affairs and Northern Development Canada ESDC Employment and Social Development Canada (formerly HRSDC - Human Resources and Skills Development Canada) Surveys APS Aboriginal Peoples Survey NHS National Household Survey Data access DLI Data Liberation Initiative RDC Research Data Centre (for analytical file only) RTRA Real Time Remote Access (for analytical file only) Statistical software SAS Statistical Analysis System SPSS Statistical Package for the Social Sciences Stata this is not an acronym SUDAAN SUrvey DAta ANalysis WesVar a registered trademark of Westat Statistical terms CI Confidence interval CV Coefficient of Variation BRR Balanced Repeated Replication Missing data DK Don’t know RF Refusal NS Not Stated Publishing symbols E Use with caution 30 Aboriginal Peoples Survey, 2012: User’s Guide to the Public Use Microdata File F Too unreliable to publish X Suppressed to meet the confidentiality requirements of the Statistics Act. Geography CMA Census Metropolitan Area 31 Aboriginal Peoples Survey, 2012: User’s Guide to the Public Use Microdata File Appendix B: Example of calculating estimates, coefficients of variation and confidence intervals Different sampling error measures, such as the variance or the coefficient of variation, can be used as indicators of the quality of an estimate. If the measure is too high, the estimate is unreliable. To quantify what is considered too high, the APS uses the coefficient of variation (CV), which is a relative measure of sampling variability. The use of the CV rather than that of the variance is very useful in comparing the precision of sample estimates where their sizes or scales are different. This appendix contains an example of calculating point estimates, associated CVs and confidence intervals. Estimation of the percentage of off-reserve First Nations (North American Indian - single identity only) boys 6 to 14 years of age with “Excellent” or “Very good” general health: In what follows, “First Nations” refers to First Nations people living off reserve with single identity only. Suppose that the data set APS_PUMF_BOOT contains all variables from the PUMF as well as the variables from the bootstrap weight file. In order to calculate the required percentage, the desired subpopulation has to be selected, a derived variable that combines the categories of the variable GH1_01 (General Health) has to be created, and a frequency table using the weight PUMFWGHT has to be run, as shown in the following sample SAS code (note that the program produces results for both boys and girls): DATA FN_KIDS; SET APS_PUMF_BOOT(KEEP=PUMFWGHT WRPP: AGE_YRSG SEX GH1_01 DIDENTG); IF DIDENTG =1 AND AGE_YRSG < 4; /* Select FN children 6 to 14 years of age*/ if GH1_01 in (1,2) then DV_HLTH=1; /* Excellent or very good */ else if GH1_01 = 3 then DV_HLTH=2; /* Good */ else if GH1_01 in (4,5) then DV_HLTH=3; /* Fair or poor */ else if GH1_01 in (7,8,9) then DV_HLTH=9; /* Missing (Don't know, Refusal, Not stated) */ run; PROC FORMAT; VALUE SEXFMT 1='BOYS' 2='GIRLS'; VALUE HLTHFMT 1='EXCELLENT/VERY GOOD' 2='GOOD' 3='FAIR/POOR' 9='MISSING'; PROC FREQ DATA=FN_KIDS; TABLES SEX*DV_HLTH / NOCOL NOPERCENT; WEIGHT PUMFWGHT; 32 Aboriginal Peoples Survey, 2012: User’s Guide to the Public Use Microdata File FORMAT SEX SEXFMT. DV_HLTH HLTHFMT.; TITLE 'STATE OF HEALTH REPORTED BY BOYS AND GIRLS–WEIGHTED COUNTS'; RUN; PROC FREQ DATA=FN_KIDS; TABLES SEX*DV_HLTH / NOCOL NOPERCENT; FORMAT SEX SEXFMT. DV_HLTH HLTHFMT.; TITLE 'STATE OF HEALTH REPORTED BY BOYS AND GIRLS–UNWEIGHTED COUNTS'; RUN; Since only the row percentages are required in this example, the NOCOL and NOPERCENT options were used. The following results are obtained (note that the weighted counts have been subsequently rounded to the nearest 10, the total has been rounded independently from its components and percentages were calculated using the rounded counts, as specified in section 6.4): General health (boys) Unweighted count Weighted count (rounded) % based on weighted counts Excellent/ very good Good Fair/poor Missing (Don't know, Refusal, Not stated) 1,314 266 66 22 1,668 38,210 7,260 1,830 1,010 48,320 79.1% 15.0% 3.8% 2.1% 100.0% TOTAL According to this table, 79.1% of First Nations boys 6 to 14 years of age were reported as being in “Excellent or very good” health. Note that the unweighted count (obtained from the second PROC FREQ) on which this percentage is based is equal to 1,314, well above the minimum of 10 for which statistics can be released (please refer to section 6.1 for more information). To find the CV and the confidence interval for this estimate, SUDAAN or SAS (version 9.2 or above) or a similar software allowing the use of bootstrap weights can be run, with the correct adjustment factor applied as described in section 5.3 (specified as the "Fay adjustment" in SUDAAN and SAS). The following example shows the SUDAAN code (run within SAS): /* Run PROC CROSSTAB */ 33 Aboriginal Peoples Survey, 2012: User’s Guide to the Public Use Microdata File PROC CROSSTAB DATA=FN_KIDS DESIGN=BRR NOCOL; /* suppress column percentages */ WEIGHT PUMFWGHT; REPWGT WRPP0001-WRPP1000 / ADJFAY=16; CLASS SEX DV_HLTH ; TABLES SEX*DV_HLTH ; FORMAT SEX SEXFMT. DV_HLTH HLTHFMT.; OUTPUT NSUM WSUM SEWGT ROWPER SEROW LOWROW UPROW / FILENAME=TAB_SUDAAN FILETYPE=SAS REPLACE ; RUN; /* Calculate CVs and confidence intervals for counts and row percentages*/ DATA CV_SUDAAN; SET TAB_SUDAAN; CV_COUNTS = CV_ROWPCT = CNT_LOWER_95 = CNT_UPPER_95 = RUN; 100 * SEWGT / WSUM; /* CV's for counts */ 100 * SEROW / ROWPER; /* CV's for row proportions*/ WSUM-1.96*SEWGT; /* Lower limit of CI for counts */ WSUM+1.96*SEWGT; /* Upper limit of CI for counts */ PROC PRINT DATA=CV_SUDAAN(WHERE=(SEX ^= 0 AND DV_HLTH ^=0)) NOOBS; VAR SEX DV_HLTH NSUM WSUM CV_COUNTS CNT_LOWER_95 CNT_UPPER_95; FORMAT SEX SEXFMT. DV_HLTH HLTHFMT.; run; PROC PRINT DATA=CV_SUDAAN(WHERE=(SEX ^= 0 AND DV_HLTH ^=0)) NOOBS; VAR SEX DV_HLTH ROWPER CV_ROWPCT LOWROW UPROW; FORMAT SEX SEXFMT. DV_HLTH HLTHFMT.; run; The above example results in the output which is shown below and which gives the various combinations of values for the variables SEX and DV_HLTH. The marginals for this table were eliminated using the condition “(where=(sex ^= 0 and DV_HLTH ^=0)” in the PROC PRINT. To determine the CV of the row percentage for Boys in “Excellent or very good health”, the combination “BOYS - EXCELLENT/VERY GOOD” is used in the CV_ROWPCT column. The CV, 1.7854%, is well below the lower limit of 16.6% for which a caution ("E") must be added as a flag in the published analysis. Finally, to determine a 95% confidence interval for the estimate, the entries in the LOWROW and UPROW columns for the same combination must be examined. Here, the lower and upper limits of the interval for the estimate of 79.1% are 76.2% and 81.7% (after rounding to one decimal place).6 Note that the table also shows, for each cell, the unweighted counts, weighted counts together with the CV and confidence intervals for the weighted counts. 6. Note that, since the estimate and the corresponding confidence limits are rounded independently, the estimate will not always appear exactly in the middle of the confidence interval. 34 Aboriginal Peoples Survey, 2012: User’s Guide to the Public Use Microdata File SEX BOYS BOYS BOYS BOYS GIRLS GIRLS GIRLS GIRLS SEX CNT_ LOWER_95 CNT_ UPPER_95 38212.43 7262.64 1831.45 1011.19 35795.28 5603.00 2434.95 764.25 3.9900 7.8862 17.9041 29.5461 4.1108 12.9160 26.8917 38.4006 35224.05 6140.06 1188.76 425.61 32911.21 4184.58 1151.55 189.04 41200.81 8385.23 2474.14 1596.78 38679.35 7021.42 3718.36 1339.47 CV_ROWPCT LOWROW UPROW 76.18 12.92 2.67 1.18 76.52 9.86 3.22 0.81 81.72 17.42 5.35 3.70 83.54 15.88 9.11 3.60 NSUM WSUM EXCELLENT/VERY GOOD GOOD FAIR/POOR MISSING EXCELLENT/VERY GOOD GOOD FAIR/POOR MISSING 1314 266 66 22 1275 180 59 17 DV_HLTH BOYS BOYS BOYS BOYS GIRLS GIRLS GIRLS GIRLS CV_COUNTS DV_HLTH EXCELLENT/VERY GOOD GOOD FAIR/POOR MISSING EXCELLENT/VERY GOOD GOOD FAIR/POOR MISSING ROWPER 79.09 15.03 3.79 2.09 80.26 12.56 5.46 1.71 1.7854 7.6254 17.7260 29.2521 2.2273 12.1463 26.5650 38.1427 Since SAS 9.2 and above can produce sampling error estimates from bootstrap weights, it is possible to do the same exercise using PROC SURVEYFREQ. The following example shows the corresponding SAS code. The code is much shorter in SAS but the SURVEYFREQ procedure requires much more computer time than PROC CROSSTAB with bootstrap weights. Refer to section 5.3 for the specification of the Fay adjustment factor. PROC SURVEYFREQ DATA=FN_KIDS VARMETHOD=BRR (Fay=0.75); WEIGHT PUMFWGHT; REPWEIGHTS WRPP0001-WRPP1000; TABLES SEX*DV_HLTH / NOCELLPERCENT CVWT CLWT ROW CV CL(TYPE=LOGIT) NOSTD; FORMAT SEX SEXFMT. DV_HLTH HLTHFMT.; RUN; The various options after the TABLES statement control the output produced. In particular, the CL(TYPE=LOGIT) requests to use the logit transformation to calculate confidence intervals for proportions. This will insure that confidence intervals for proportions are between 0 and 1. The output, not shown here, is very similar to the output produced from SUDAAN and gives the same results. Determine if the observed difference between two estimates is statistically significant: Once the 95% confidence limits have been identified, the method for determining whether the difference between two estimates is statistically significant is relatively simple. If the two intervals overlap, then it cannot be concluded that the underlying population quantities (for 35 Aboriginal Peoples Survey, 2012: User’s Guide to the Public Use Microdata File instance, some specific proportions in the population for two groups of individuals) being estimated are different (or, in more technical terms, the null hypothesis that there is no difference between the underlying population quantities being estimated, at the 5% significance level, cannot be rejected). If the two intervals do not overlap, however, it can be concluded that the underlying population quantities being estimated are different (in more technical terms, the null hypothesis that there is no difference between the underlying population quantities being estimated, at the 5% level, can be rejected). Continuing with the previous example, suppose a user wants to determine if there is a significant difference in percentage of First Nations girls (aged 6 to 14) reported as being in “Excellent/Very good” general health as compared to the percentage of First Nations boys (aged 6 to 14) reported as being in “Excellent/Very good” general health. The following table presents some numbers and estimates for the girls: General health (girls) Unweighted count Weighted count (rounded) % based on weighted counts Excellent/ very good Good Fair/poor Missing (Don't know, Refusal, Not stated) 1,275 180 59 17 1531 35,800 5,600 2,430 760 44,600 80.3% 12.6% 5.4% 1.7% 100.0% TOTAL Note that certain percentages in the above table are very slightly different from the output of the previous page because of rounding. According to the above table, 80.3% of First Nations girls aged 6 to 14 were reported as being in “Excellent or very good” health. To find the CV and confidence interval for this estimate, refer to the combination “GIRLS - EXCELLENT/VERY GOOD” in the SUDAAN example shown on the previous page. As indicated, the CV for girls is 2.2273% and the 95% confidence interval goes from 76.5% to 83.5% (after rounding to one decimal place). In order to assess if the observed difference between the two estimates is statistically significant, the 2 confidence intervals have to be compared: Boys: 76.2% to 81.7% Girls: 76.5% to 83.5% 36 Aboriginal Peoples Survey, 2012: User’s Guide to the Public Use Microdata File Since the two intervals do overlap, it can be said, at the 5% significance level, that the proportion of First Nations boys aged 6 to 14 years with “Excellent/Very good" general health is not significantly different from the proportion of First Nations girls aged 6 to 14 with “Excellent or very good” general health. 37 Aboriginal Peoples Survey, 2012: User’s Guide to the Public Use Microdata File Appendix C: SPSS and the use of bootstrap weights Excerpt from Gagné, C., Roberts, G., & Keown, L.A. (2014). Weighted estimation and bootstrap variance estimation for analyzing survey data: How to implement in selected software. The Research Data Centres Information and Technical Bulletin. (Winter) 6(1): 4-72. Statistics Canada Catalogue no. 12-002-X. http://www.statcan.gc.ca/pub/12-002-x/12-002-x2014001-eng.htm Although SPSS has an add-on Complex Samples module that offers many survey data analysis tools, one thing that it does not provide is any replication methods for designbased variance estimation. Consequently, SPSS cannot do bootstrap variance estimation using the bootstrap weights provided with many Statistics Canada surveys. For earlier versions of SPSS, there was an SPSS version of BootVar written by Statistics Canada methodologists that would calculate bootstrap variance estimates for a selection of analytical procedures. This program is no longer being supported or updated. People who use SPSS for doing other types of analysis thus need to move to a different software package in order to make use of the bootstrap weights. They can choose that package based on their preferred style of doing analysis and on their particular analytical problem. As an example, if a researcher prefers the use of pull-down menus, s/he could consider WesVar or Stata. Many of the other packages will accept an SPSS datafile as input. 38 Aboriginal Peoples Survey, 2012: User’s Guide to the Public Use Microdata File Appendix D: An overview of WesVar Excerpt from Gagné, C., Roberts, G., & Keown, L.A. (2014). Weighted estimation and bootstrap variance estimation for analyzing survey data: How to implement in selected software. The Research Data Centres Information and Technical Bulletin. (Winter) 6(1): 4-72. Statistics Canada Catalogue no. 12-002-X. http://www.statcan.gc.ca/pub/12-002-x/12-002-x2014001-eng.htm WesVar is a software package produced by the Westat organization. A recent version of the package is free for download at http://www.westat.com/statistical_software/WesVar/index.cfm. WesVar carries out various analyses of survey data using exclusively replication methods for variance estimation. One of the methods offered is BRR with a Fay adjustment, which, as explained in Phillips (2004), can be used to get bootstrap variance estimates if the bootstrap weight variables are provided by the researcher. In WesVar, the variance estimation method is specified when creating a new WesVar data file. The resulting file is then used to define workbooks where table and regression requests are carried out. Clearly-written instructions for using WesVar are provided in the User Guide, which can also be downloaded free of charge from http://www.westat.com/statistical_software/WesVar/index.cfm. WesVar is a standalone program. Since it is capable of importing a wide variety of file formats, it can be readily used by researchers who have data files in such formats as SPSS or SAS data sets. The user can also output the results from the whole workbook or only one section in one or many tab-delimited text files. WesVar has a visual interface. Thus, researchers who prefer drop-down menus for doing analysis should be comfortable with using WesVar. 39 Aboriginal Peoples Survey, 2012: User’s Guide to the Public Use Microdata File References Langlet, É., Beaumont, J.-F., and Lavallée, P. (2008). Bootstrap Methods for Two Phase Sampling Applicable to Postcensal Surveys. Paper presented at the Statistics Canada's Advisory Committee on Statistical Methods, April 2008, Ottawa. Phillips, Owen. (2004) “Using Bootstrap Weights with WesVar and SUDAAN”. The Research Data Centres Information and Technical Bulletin. (Fall) 1(2):1-10. Statistics Canada Catalogue no. 12002-XIE. http://www5.statcan.gc.ca/bsolc/olc-cel/olc-cel?catno=12-002-X20040027032&lang=eng 40