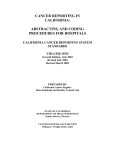
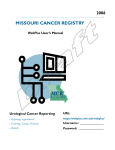
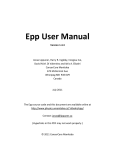
1
User’s Guide to SEER*Stat Cohort Relative Survival Including Conditional Survival Cancer Survival and Prevalence Analytic Network (C-SPAN) Prepared by CancerCare Manitoba for the Canadian Partnership Against Cancer The Cancer Surveillance and Epidemiology Networks have been made possible through a financial contribution from Health Canada, provided by the Canadian Partnership Against Cancer. The views expressed herein do not necessarily represent the views of the Canadian Partnership Against Cancer nor that of Health Canada. Citation: Material appearing in this report may be reproduced or copied without permission; however, the following citation must be used: The Cancer Survival and Prevalence Analytic Network (C-SPAN) is an initiative of the Canadian Partnership Against Cancer, in collaboration with CancerCare Manitoba. Table of Contents Overview.......................................................................................................................................................................3 Data...............................................................................................................................................................................3 Life Tables....................................................................................................................................................................3 Description of the SEER*Stat Steps for Cohort Survival Estimates.......................................................................5 1. Set Data Locations: .............................................................................................................................................5 2a. Create and save a new Survival session: ...........................................................................................................6 2b. Open an existing Survival session: ....................................................................................................................6 3. Data tab:..............................................................................................................................................................6 4. Statistic tab: .........................................................................................................................................................7 5. Selection tab: .......................................................................................................................................................8 6. Create variables in the Dictionary for the Table tab:..........................................................................................9 7. Table tab:...........................................................................................................................................................15 8. Parameters tab: .................................................................................................................................................16 9. Output tab:.........................................................................................................................................................17 10. Execute the Survival session:...........................................................................................................................19 11a. Save the results in SEER*Stat:.......................................................................................................................19 11b. Save the results and session information in Excel: ........................................................................................20 12. Retrieve and print Survival session information:.............................................................................................21 References ..................................................................................................................................................................23 C-SPAN SEER*Stat Cohort RS User’s Guide Page 2 Overview This document describes the SEER*Stat (1) steps used by the Cancer Survival and Prevalence Analytic Network (C-SPAN) to estimate relative survival, using the cohort method. The following example session describes the steps for obtaining one-year cohort relative survival estimates, based on 3-month follow-up intervals, for all cancers, colorectal, lung, breast and prostate cancers and all cancers excluding colorectal, lung, breast and prostate. Estimates are produced for four three-year diagnosis periods: 1994-1996, 1997-1999, 2000-2002, and 2003-2005. However, the selections made in this session can easily be tailored to your specific situation. In addition, instructions are given to show how to compute conditional survival, that is, survival proportion or ratio at a specified interval post-diagnosis, conditional on an initial survival interval, through the parameters tab. Note that the graphics displayed in the document were derived from screen captures of actual SEER*Stat sessions. However, this document has grown over time, and some of the SEER*Stat versions used may not be current. The default options and placement of options within a given SEER*Stat tab may differ between what is displayed here and what can be seen in a more current version. Data The survival analyses employ data extracted from the Manitoba Cancer Registry and include the first primary invasive malignant cancer (excluding basal and squamous cell skin cancers) or in situ bladder cancer diagnosed during the period 1992-2005, with complete follow-up until the end of 2006. C-SPAN cancer site definitions follow the 2009 Canadian Cancer Statistics (CCS) groupings (2), which are in turn based on SEER site groups for primary site, based on ICD-O-3 (3). Life Tables Life tables shared by Larry Ellison at Statistics Canada, which are used in the computation of relative survival estimates for the CCS publication (2), are also used in C-SPAN’s SEER*Stat applications. These life tables provide probabilities of surviving one year by province, sex, attained age and attained calendar period (1991, 1996 and 2001). Cases where attained year is from 1992 to 1993 are associated with probabilities of surviving from the 1991 calendar period [data from the 1990/1992 life tables (4)], cases where attained year is from 1994 to 1998 are associated with probabilities of surviving C-SPAN SEER*Stat Cohort RS User’s Guide Page 3 from the 1996 calendar period [data from 1995/1997 life tables (5)] and because life tables after 2001 are unavailable, all cases where attained year is after 1998 are associated with probabilities of surviving from the 2001 calendar period [data from the 2000/2002 life tables (6)]. C-SPAN SEER*Stat Cohort RS User’s Guide Page 4 Description of the SEER*Stat Steps for Cohort Survival Estimates 1. Set Data Locations: - File – Preferences… - Click Browse to the path where databases are stored (e.g. I:\Epi\SeerStatDatasets) Click The path appears at the bottom of the Data Locations list, selected and highlighted. - With the path selected and highlighted, click until it is at the top of the Data Locations list Click Databases stored in the added data location will now appear in session Data tabs - C-SPAN SEER*Stat Cohort RS User’s Guide Page 5 2a. Create and save a new Survival session: - File – New – Survival Session (or button) Warning may appear (“Not to be quoted outside the registry”). Select “Do not show this message in future.” - Alert may appear (“Could not locate the default expected rate table. Switching to first available table.”). Click . (Optional ) File – Save As… filename.ss *.ss = survival session file Note: It is not necessary to save a session if it will be executed and a results matrix saved before closing the session. When a results matrix is saved, information about the session that created it is also stored and can be retrieved as needed using Retrieve Session from the Matrix menu. or 2b. Open an existing Survival session: - File – Open – Survival File… (or button) path:\filename.ss *.ss = survival session file 3. Data tab: - Select Database Name: CSPAN_Compare Warning may appear (“Not to be quoted outside the registry”). Select “Do not show this message in future.” - Alert may appear (“Could not locate the saved expected rate table. Switching to default.”). Click . (Optional) File – Save (or C-SPAN SEER*Stat Cohort RS User’s Guide button) Page 6 4. Statistic tab: - Accept defaults except: Select Expected Rate Table: CSPAN_Compare_Survival - (Optional) File – Save (or C-SPAN SEER*Stat Cohort RS User’s Guide button) Page 7 5. Selection tab: - Accept defaults except: Deselect: Malignant Behavior - (Optional) File – Save (or C-SPAN SEER*Stat Cohort RS User’s Guide button) Page 8 6. Create variables in the Dictionary for the Table tab: Variable groupings needed: i. Sex Male and female *already exists in the Dictionary; no need to create it Male *already exists in the Dictionary; no need to create it Female *already exists in the Dictionary; no need to create it ii. CCS Disease All (i.e. all cancer types) Colorectal Lung Breast Prostate Others (i.e. all cancer types except colorectal, lung, breast, and prostate) iii. Year of Diagnosis 1994 - 1996 1997 - 1999 2000 - 2002 2003 - 2005 C-SPAN SEER*Stat Cohort RS User’s Guide Page 9 - File – Dictionary… (or button) C-SPAN SEER*Stat Cohort RS User’s Guide Page 10 To view and verify existing Sex variable groupings: - (Expand) Race, Sex, Year Dx, State, County Select Sex - Click - Groupings column: Select Male and female In the Values column, both Male and Female are highlighted to indicate they are included in the Male and female grouping. Groupings column: Select Male In the Values column, Male is highlighted to indicate it is included in the Male grouping. Groupings column: Select Female In the Values column, Female is highlighted to indicate it is included in the Female grouping. Click - - - to open the Edit Variable window C-SPAN SEER*Stat Cohort RS User’s Guide Page 11 To create CCS Disease variable groupings: - (Expand) Site and Morphology Select CCS - Click to open the Edit Variable window Name: change to CCS4 Description: and change to ‘Top 4 CCS (2009) Disease Groups’ Groupings column: Select all 24 groupings (i.e. Oral, Esophagus/Oesp, … Other) Click to clear all the individual cancer type groupings - ***************************** - - Click Select “Added as one grouping (all values combined)” Click “All Values” appears in the Groupings column All 24 cancer types are highlighted in the Values column Groupings column: Rename “All Values” as “All” . ***************************** - Values column: Select ColoRectal. Click . Select Lung. Click . Select Breast. Click . Select Prostate. Click . “ColoRectal”, “Lung”, “Breast”, “Prostate” appear in the Groupings column When each is selected in the Groupings column, the corresponding cancer type is highlighted in the Values column ***************************** C-SPAN SEER*Stat Cohort RS User’s Guide Page 12 - - Values column: Select all cancer types except ColoRectal, Lung, Breast, Prostate. Click . “Oral” appears in the Groupings column (the new grouping takes the name of the first cancer type selected for the grouping from the Values column) 20 cancer types (all except ColoRectal, Lung, Breast, Prostate) are highlighted in the Values column Groupings column: Rename “Oral” as “Others” ***************************** - Ensure “Save to Dictionary” is selected Click Newly created “CCS4” variable appears in the Dictionary window in the User-Defined category * = a user-defined (or merged) variable saved in the database dictionary C-SPAN SEER*Stat Cohort RS User’s Guide Page 13 To create Year of Diagnosis variable groupings: - (Expand) Race, Sex, Year Dx, State, County in Dictionary window Select Year of Diagnosis - Click to open the Edit Variable window Name: change to Year of diagnosis (3-yr windows) Description: and change to NAACCR Item # = 390 (3-yr windows) Groupings column: Select all 16 groupings (i.e. Total, 1992, … 2006) Click to clear all the individual year groupings - - ***************************** Values column: Select 1994, 1995, 1996. Select 1997, 1998, 1999. Select 2000, 2001, 2002. Select 2003, 2004, 2005. Click Click Click Click . . . . “1994”, “1997”, “2000”, “2003” appear in the Groupings column (the new groupings take the name of the first year selected for the grouping from the Values column) - Groupings column: Rename “1994” as “1994-6” Rename “1997” as “1997-9” Rename “2000” as “2000-2” Rename “2003” as “2003-5” When each is selected in the Groupings column, the corresponding years are highlighted in the Values column ***************************** - Ensure “Save to Dictionary” is selected Click Newly created “Year of diagnosis (3-yr windows)” variable appears in the Dictionary window in the User-Defined category * = a user-defined (or merged) variable saved in the database dictionary - In the Dictionary window, Click - (Optional) File – Save (or C-SPAN SEER*Stat Cohort RS User’s Guide button) Page 14 7. Table tab: - In Available Variables, (Expand) Race, Sex, Year Dx, State, County Select Sex Click “Sex” appears under Page in Display Variables - In Available Variables, (Expand) User-Defined Select CCS4 Click “CCS4” appears under Row in Display Variables - In Available Variables, (Expand) User-Defined if necessary Select Year of diagnosis (3-yr windows) Click “Year of diagnosis (3-yr windows)” appears under Column in Display Variables - (Optional) File – Save (or C-SPAN SEER*Stat Cohort RS User’s Guide button) Page 15 8. Parameters tab: - Accept defaults except: Intervals Number: 4 Months Per: 3 Cumulative Summary – Interval: 4 Choosing these will provide one-year cumulative survival estimates based on 3 month intervals. - (Optional) File – Save (or - (Optional) Conditional survival: Below is an example of how to specify two conditional survival estimates. The first, representing surviving to 5 years after diagnosis, conditional on having already survived the first year (expressed in months of C-SPAN SEER*Stat Cohort RS User’s Guide button) Page 16 survival, as 12-60). The second, survival to the 6th year post-diagnosis, conditional on having survived the first year after diagnosis (again, expressed in months as 12-72). - Note the differences from the example above: the largest interval specified must not be greater than the total number of intervals specified (in this case, 72). In order to have the special intervals represented in the output, the checkbox for ‘Include special intervals/conditional survival’ must be checked. 9. Output tab: C-SPAN SEER*Stat Cohort RS User’s Guide Page 17 - Accept defaults except: Deselect: Adjust Relative Rates Over 1.0 Deselect: Adjust Increasing Relative Rates - (Optional) File – Save (or C-SPAN SEER*Stat Cohort RS User’s Guide button) Page 18 10. Execute the Survival session: - Session – Execute (or button) Results are displayed in the Survival matrix Use (Male and female, Male, Female) to view each page 11a. Save the results in SEER*Stat: - Click anywhere inside the Survival Matrix window to ensure it is active File – Save As… filename.ssm *.ssm = survival matrix file and/ or C-SPAN SEER*Stat Cohort RS User’s Guide Page 19 11b. Save the results and session information in Excel: - Click anywhere inside the Survival Matrix window to ensure it is active Edit – Copy – All Pages (for results) In Microsoft Excel: Edit – Paste File – Save As… filename.xls It is good practice to save the session details in the same spreadsheet as the results – in a worksheet tab with a different name. To do so, C-SPAN SEER*Stat Cohort RS User’s Guide Page 20 - Click anywhere inside the Survival Matrix window to ensure it is active Edit – Copy – Session Information In Microsoft Excel, in the same spreadsheet as above, but in a new tab: Edit – Paste File – Save As… filename.xls 12. Retrieve and print Survival session information: If a session is closed without being saved, it can be retrieved if its resulting Survival matrix has been saved. - File – Open – Survival File… (or button) path:\filename.ssm *.ssm = survival matrix file - Matrix – Retrieve Session A Survival session opens with all the settings used to generate the matrix - To ensure it is active, click anywhere inside either: a) the Survival Matrix window to print the matrix and session information or b) the Survival Session window to print session information only - File – Print Preview… A preview of pages to be printed opens Use C-SPAN SEER*Stat Cohort RS User’s Guide to view each page Page 21 - Click to print C-SPAN SEER*Stat Cohort RS User’s Guide Page 22 References 1. National Cancer Institute SEER*Stat software. Version 6.5.2. Bethesda, MD: National Cancer Institute, 2009. 2. Canadian Cancer Society’s Steering Committee: Canadian Cancer Statistics 2009, Toronto: Canadian Cancer Society, 2009. 3. Fritz A, Jack A, Parkin DM, et al (eds.) International Classification of Diseases for Oncology. Third Edition. Geneva World Health Organization, 2000. 4. Millar WJ, David P. Life Tables, Canada and the Provinces, 1990-1992 (Statistics Canada Catalogue 84-537) Ottawa: Minister of Industry, 1995. 5. Duchesne D, Tully P, Thomas B, Bourbeau R. Life Tables, Canada, Provinces and Territories, 1995/1997 (Statistics Canada Catalogue 84-537) Ottawa: Minister of Industry, 2002. 6. Life Tables, Canada, Provinces and Territories, 2000/2002 (Statistics Canada Catalogue 84-537) Ottawa : Minister of Industry, 2006. C-SPAN SEER*Stat Cohort RS User’s Guide Page 23