1
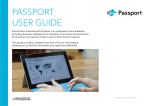
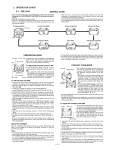
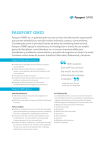
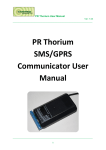
PASSPORT
USER GUIDE
Euromonitor International’s Passport is an integrated online database,
providing business intelligence on industries, economies and consumers.
Its simple-to-use interface makes it easy to find relevant research.
This guide provides a detailed overview of how to use Passport,
allowing you to find the information you need more efficiently.
© E U R O M O N I TO R I N T E R N AT I O N A L
1
The Homepage
1
GLOBAL MENU
»» Search: Create detailed custom searches
Passport Home provides an overview of the latest information for industries, economies,
to access specific information in Passport
»» Industries: Find statistics and analysis for
consumers and more.
each industry we research
1
»» Economies: Access global economic,
demographic and marketing statistics
»» Consumers: Learn about consumer trends,
2
3
demographics and preferences
4
»» Companies: Gain insight into company
performance and competitor analytics
»» Euromonitor Solutions: Find answers for
your custom research needs
»» Help: Access help videos, FAQ, definitions,
methodology information and more
2
5
SEARCH STATISTICS
»» Jump to a high-level statistical view of top
countries by industry or topic
3
FIND ANALYSIS
»» Select a category or topic to quickly go to
a full list of all relevant analysis
4
EXPLORE DASHBOARDS
»» Visually explore an industry and quickly
understand large data sets
5
WHAT’S NEW
»» Read the latest articles written by our
expert analysts
© E U R O M O N I TO R I N T E R N AT I O N A L
2
Searching for Data
1
SEARCH ALL PASSPORT CONTENT
»» Build a search based on industry
Passport’s powerful search capabilities allow you to find information quickly.
categories, city data, companies or
brand names, nutrition or survey topics
2
SEE DATA NOW
»» Access statistics for your search
parameters, including: market sizes,
3
4
brand and company shares, distribution,
pricing and more
1
3
RECENT SEARCHES
»» View your history to quickly replicate
past searches
4
2
SAVED SEARCHES
»» Refer to your saved searches in this tab
© E U R O M O N I TO R I N T E R N AT I O N A L
3
Searching for Data
1
CATEGORIES AND TOPICS
»» Drill down into an industry to
select subcategories
Explore the category search tree and select geographies.
»» Click the blue ‘>’ to expand a category
or subcategory
»» Click the ‘i’ to view the
category’s definition
»» Erase a category by clicking the
corresponding ‘x’ in the Categories and
Topics tab
2
T YPE A SPECIFIC CATEGORY
»» Filter by a specific category or topic
by typing in the search box
2
3
NOW CHOOSE GEOGRAPHIES
»» Click the Geographies tab or blue
Next button to select geographies
1
for your search
3
© E U R O M O N I TO R I N T E R N AT I O N A L
4
Searching for Data
1
GEOGRAPHY TREE
»» Select a single region or drill down
to select countries
»» Click the blue ‘>’ to expand a region
or country
»» Erase a selection by clicking the
corresponding ‘x’ in the
Geographies tab
4
2
T YPE A SPECIFIC GEOGRAPHY
»» Filter by a specific geography
by typing in the search box
3
2
SELECT A PREDEFINED LIST
»» Click to see a drop-down list of
3
predefined regions or countries
1
4
RUN SEARCH
»» Click to see a list of all statistics
and analysis related to your
search parameters
© E U R O M O N I TO R I N T E R N AT I O N A L
5
Understanding the Results Page
1
RESULTS
»» Review your selected Categories
The Results Page contains the data matching your search criteria. View data and analysis
and Topics or Geographies
»» Click Modify Search to navigate back to
or create a personalised results list.
the search tree and modify selections
»» Click Save Search to add the current
search to your saved searches
1
2
VIEW DATA
»» Select popular statistics, such as:
market sizes, company shares, brand
shares or distribution
»» Access data by off-trade vs on-trade
or products by ingredient
2
3
3
VIEW ANALYSIS
»» View global, strategy and industry
4
briefings, datagraphics, opinions
and other relevant articles
4
FILTER RESULTS
»» Filter analysis results by category,
geography, content types or other
information sources
© E U R O M O N I TO R I N T E R N AT I O N A L
6
Using Statistics
1
OUTPUT DATA
»» Export the data to Excel* or PDF, print it
or save it to the Saved Research section
(*includes Export to My Downloads)
2
CONVERT DATA
»» Use these controls to change your data:
»» Change the currency
1
»» Switch current value data (nominal)
to constant value data (real)
2
»» Change unit multipliers or
volume conversion
»» Find growth
3
DATA CONTROLS
»» Use these controls to change the
data type, time period, categories
and geographies
3
4
MORE RESULTS
»» Access related sets of statistics,
such as company shares, brand shares
and distribution
4
© E U R O M O N I TO R I N T E R N AT I O N A L
7
Understanding Analysis
1
OUTPUT OPTIONS
»» Export the report to PDF, print it,
Depending on the type of results you selected, there are a number of ways you can navigate
or save it to the Saved Research section
and output your analysis easily.
2
TABLE OF CONTENTS
»» Easily navigate to different areas
of the report
3
»» Access complete versions of related
1
2
RELATED REPORTS
reports with extra analysis
4
MORE RELATED ITEMS
»» Access supporting statistics, industry
reports, company profiles, articles
and other analysis
3
4
© E U R O M O N I TO R I N T E R N AT I O N A L
8
Industry Pages
1
SEARCH TREE
»» Quickly access relevant sections within
Access the latest research on a select industry.
the search tree
2
ANALYSIS FINDER
»» Find all analysis related to your topic
3
1
4
5
by type and geography
6
3
RANK COUNTRIES
»» Jump to a high-level statistical view
of top countries by topic
2
4
RANK CATEGORIES
»» Examine the top categories of the
industry by geography
5
REVIEW TOP COMPANIES
»» Access geographic research and market
shares for leading companies in the
specified industry
6
DASHBOARDS
»» Visually explore the industry and
quickly understand large data sets
© E U R O M O N I TO R I N T E R N AT I O N A L
9
Visual Overviews
FROM THE HOME PAGE
Passport’s interactive Dashboards allow you to visually explore category, company and channel data
for an industry or dive deeper into consumer trends using our economic, socioeconomic
and demographic data.
Access Dashboards by selecting
a group and, if necessary, an
industry in the drop downs and
then clicking “Launch”
FROM THE INDUSTRY PAGES
»» Access Dashboards by selecting
an industry in the drop down and
then clicking “Go”
© E U R O M O N I TO R I N T E R N AT I O N A L
10
Connect with Euromonitor
CONNECT WITH US
Follow us to gain exclusive access to:
»» Videocasts
»» Industry events
»» Podcasts
»» Customer service
»» Webinars
»» Contests
»» Industry news
»» Datagraphics
and facts
MORE INFORMATION
Log into Passport to reach your
account manager or email
[email protected].
Passp o rt U ser G uide – 1. 8 - 0 615
© E U R O M O N I TO R I N T E R N AT I O N A L
11