1
User Guide – Getting Started in Alberta Netcare Portal
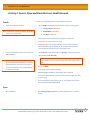
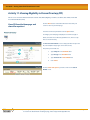
Activity 4c: Locate and Graph Lab Results
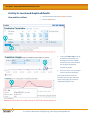
View and Print a Chart
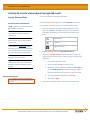
1.
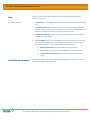
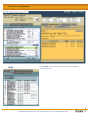
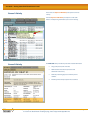
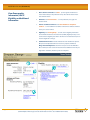
Select the Check box beside the Creatinine lab result.
2.
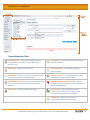
Click the Graph button.
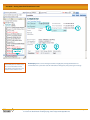
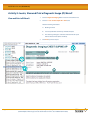
3.
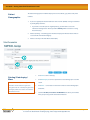
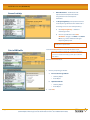
To change the time range to narrow
or widen the result window, click
and drag your mouse to highlight
the time period or results desired on
the top graph. The graph will
automatically update.
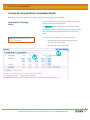
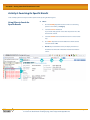
4.
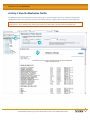
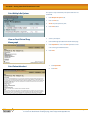
Hover your mouse over each plotted
point to view the lab information.
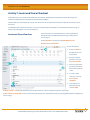
Click another item from the Clinical
Document Tree or the test result link at
the top of the graph page to return to
the Cumulative Results screen.
By accessing Alberta Netcare Portal you agree to be bound by the Terms of Use and Disclaimer
as noted on the Alberta Netcare Portal login page, and to comply with all applicable laws.
Page 17