1
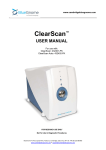
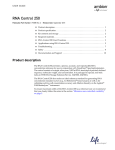
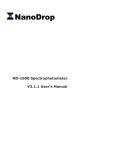
ND-3300 Fluorospectrometer V2.5 User’s Manual NanoDrop Technologies, Inc. 3411 Silverside Road Bancroft Building Wilmington, DE 19810 USA Voice: 302-479-7707 Fax: 302-792-7155 Email: [email protected] www.nanodrop.com NanoDrop is a registered trademark of NanoDrop Technologies, Inc. Other parties’ trademarks are the property of their respective owners and should be treated as such. Copyright © 2006 NanoDrop Technologies, Inc. rev 3/06 TABLE OF CONTENTS 1. Overview ................................................................................................. 1-1 Instrument Description ............................................................................. 1-1 Virtual Filtering – White LED .................................................................... 1-1 Operation ................................................................................................. 1-1 Applications.............................................................................................. 1-2 Patents..................................................................................................... 1-2 2. Initial Set Up ........................................................................................... 2-1 Computer Requirements .......................................................................... 2-1 Software Installation................................................................................. 2-1 Software Upgrades .................................................................................. 2-1 Registering Your Instrument .................................................................... 2-2 3. General Operation.................................................................................. 3-1 The Sample Retention System ................................................................ 3-1 Cleaning the Sample Retention System................................................... 3-1 Software Architecture and Features......................................................... 3-2 Method Editor........................................................................................... 3-3 Data Viewer ............................................................................................. 3-5 Users Manual ........................................................................................... 3-5 User Preferences ..................................................................................... 3-5 Account Management .............................................................................. 3-5 Change Password.................................................................................... 3-6 4. Common Module Functions .................................................................. 4-1 Module Startup......................................................................................... 4-1 Escape Key (ESC) ................................................................................... 4-1 Basic Module Window.............................................................................. 4-1 Measure (F1)............................................................................................ 4-1 Blank (F3) ................................................................................................ 4-1 Re-blank (F2) ........................................................................................... 4-1 Initialize – White LED ............................................................................... 4-1 Print Screen (F4)...................................................................................... 4-2 Print Window ............................................................................................ 4-2 Print Report (F5) ...................................................................................... 4-2 Saving Current Screen as .jpg Image ...................................................... 4-2 Recording (F6) ......................................................................................... 4-2 Print and Save Menu................................................................................ 4-2 Show Report (F7)..................................................................................... 4-2 View Standard Curve ............................................................................... 4-2 Measurement Type .................................................................................. 4-3 Method ..................................................................................................... 4-3 Units......................................................................................................... 4-3 Actual Gain .............................................................................................. 4-3 Minimum Gain .......................................................................................... 4-4 Saturation nm........................................................................................... 4-4 Sample ID ................................................................................................ 4-4 Source...................................................................................................... 4-4 RFU at xxx nm ......................................................................................... 4-4 ∆λ............................................................................................................. 4-5 Configuration............................................................................................ 4-5 Exit ........................................................................................................... 4-5 Show Context Help .................................................................................. 4-6 User’s Manual .......................................................................................... 4-6 5. Nucleic Acid............................................................................................ 5-1 dsDNA 33258 Hoechst............................................................................. 5-1 dsDNA PicoGreen® (dye) ......................................................................... 5-1 RNA RiboGreen® (dye) ........................................................................... 5-2 6. Protein..................................................................................................... 6-1 7. Other Samples........................................................................................ 7-1 Fluorescein, FITC, FAM ........................................................................... 7-1 Cy3, Alexa Fluor 555............................................................................... 7-1 Cy5, Alexa Fluor 647................................................................................ 7-2 Quinine Sulfate......................................................................................... 7-2 4-Methyl umbelliferone, (4-MU)................................................................ 7-2 8. Archived Data and Data Viewer ............................................................ 8-1 Archive File Creation................................................................................ 8-1 Data Storage Hierarchy............................................................................ 8-1 Data Viewer ............................................................................................. 8-1 Opening Archived Data with spreadsheet programs ................................ 8-5 9. Troubleshooting..................................................................................... 9-1 Error USB2000......................................................................................... 9-1 Connection Errors .................................................................................... 9-2 Error: Code 8............................................................................................ 9-3 Installer Error............................................................................................ 9-3 Other Software Error Messages............................................................... 9-3 Sampling Concerns.................................................................................. 9-4 Unusual Spectra....................................................................................... 9-5 Technical Service..................................................................................... 9-5 10. Maintenance and Warranty....................................................... 10-1 Cleaning................................................................................................. 10-1 Decontamination of Measurement & Optical Surfaces........................... 10-1 Warranty ................................................................................................ 10-1 11. Appendices ................................................................................ 11-1 Instrument Specifications ....................................................................... 11-1 Sample Retention System Solvent Compatibility ................................... 11-1 Section 1-Overview 1. Overview Instrument Description The NanoDrop® ND-3300 Fluorospectrometer uses patented sample retention technology (surface tension). The uniquely clean optics of the retention system, combined with proprietary signal processing for the White LED applications, enables measurements across a wide range of wavelengths using sample volumes of 1–2 ul without cuvettes and costly filter changes. The excitation source comes from one of three solid-state light emitting diodes (LED’s), which are oriented 90° to the detector. A 2048-element CCD array detector, covering 400 – 750 nm, is connected by an optical fiber to the optical measurement surface. The spectrometer is configured with a cut filter to eliminate light transmission below 395 nm. The intensity plots for each of the LEDs are shown below: UV LED max= 365nm; equipped with cut filter that eliminates excitation above 400 nm Blue LED max= 470nm; equipped with cut filter that eliminates excitation above 495 nm White LED range= 500-650nm; uses virtual filtering Virtual Filtering – White LED In order to excite a broader range of fluorophores (~500 – 650 nm range), a White LED source is selected. The White LED is composed of a Blue LED and a yellow-orange phosphor excited by the Blue LED to give an approximately White spectrum (typically bluish in appearance). Virtual filtering (patents pending) involves taking a reference spectrum as a wavelength intensity map of the White LED yellow peak. The reference spectrum is then normalized to a non-fluorescence wavelength of the sample’s signal spectrum. This normalized reference spectrum, when subtracted from the signal spectrum, will remove nearly all the stray excitation contribution to the fluorescence signal spectrum. The normalization or scaling is typically done at a wavelength within the stability envelope (the region of the White spectrum) on the short wavelength side of the sample’s fluorescence peak where the fluorescence signal is less than 5% of its peak value. This is illustrated in the figure below: One of the factors making it feasible to extract the Sample fluorescence by subtracting a scaled representation of the source is the inherent “off-angle” light rejection properties of the optical fiber and the reduction in scattering from directly wetted optical surfaces. An additional element making this method possible is the high reproducibility of the relative spectral output intensity vs. the wavelength of the LED. In practice, a “Virtual Emission Filtering Interval (∆λ)” is set for each Method created that uses the White LED. See section 4 for details regarding the ∆λ. Operation A 1-2 ul sample is pipetted onto the end of the lower measurement pedestal (the receiving fiber). A non-reflective “bushing” attached to the arm is then 1-1 Section 1-Overview brought into contact with the liquid sample causing the liquid to bridge the gap between it and the receiving fiber. The gap, or pathlength, is controlled to 1mm. Following excitation with one of the three LEDs, emitted light from the sample passing through the receiving fiber is captured by the spectrometer. The instrument is controlled by NanoDrop fluorospectrometer software run from a PC where all data is logged and archived in the C:\ND-3300 Data folder as well as at a second user defined location. An external power supply is not required. The operating power is supplied by the USB port on the PC. Applications Fluorescence measurements are simple for samples as small as 1-2 ul using the ND-3300. The small sample requirement and ease of use make it ideally suited for fluorescence measurement of a variety of dyes and fluorophores. The image below lists some of the most common fluorophores that can be measured using the ND-3300 along with the most appropriate excitation LED. Patents The sample retention technology used in the ND-1000 Spectrophotometer & ND-3300 Fluorospectrometer is covered under US patents 6,628,382 and 6,809,826. Other patents are pending. 1-2 Section 2- Initial Set Up 2. Initial Set Up Computer Requirements The NanoDrop software will only run on an IBM compatible PC meeting the below criteria. Mac versions of the software are not currently available. • • • • • • • Microsoft Windows, XP or 2000 operating system: The operating software will not work with Windows 95, 98, ME or Windows NT. 233 MHz or higher processor CD ROM drive 32 MB or more of RAM 40 MB of free hard disk space Open USB port (the instrument can only be connected via the USB port) Microsoft Excel or other spreadsheet program to manipulate archived data (optional) Software Installation WARNING: The system software must be loaded onto the PC before the USB cable is connected. Administrator access on the PC is required to install the software. To properly install NanoDrop software: 1. Close all programs and make sure that the USB cable is unplugged. 2. Insert the operating software CD in the CD drive of the PC. The software installation menu should appear automatically. If software menu does not appear, choose ‘My Computer‘ to view the contents of the CD. Double click on the file named ‘nd3300-[version]-install.exe’. 3. After software installation, remove the sticker on the back of the instrument and connect the USB cable. The Found New Hardware Wizard should start as shown below. (Windows XP SP2 operating system will ask to allow it to search the internet for the proper software as shown- Select ‘No, not this time’). Follow the prompts for automatic installation of the software. Intro Page: Windows XP- SP2 All Windows Operating Systems Your NanoDrop® ND-3300 Fluorospectrometer should now be ready for operation. If the software does not start properly, refer to the Troubleshooting section for possible solutions. Configuring the System Font The NanoDrop software is designed to look best with the MS Sans Serif font, 8 point. To check that the system font is set to the proper selection: 1. Open the ‘Displays Properties’ by right clicking on the desktop and select Properties Æ Appearance. (Additional step for Windows XP: click on the ‘Advanced’ button). 2. From item list select ‘icon’. 3. Select the ‘MS Sans Serif (western)’ font and select ‘8 point’. 4. Click ‘OK’. Other selections can be used but may either cause some text in the NanoDrop software window to not fit well or result in the function selection tabs across the top to become inaccessible. Software Upgrades NanoDrop Technologies makes periodic upgrades to the NanoDrop software. These upgrades are available for download at www.nanodrop.com. 2-1 Section 2- Initial Set Up Cable Connection To make measurements with the instrument, simply connect the USB cable to the back of both the instrument and the PC. Registering Your Instrument Please register your product! We periodically update our software and add new features free of charge. We would like to keep our user list updated so that we may alert you to these upgrades. All information supplied to NanoDrop Technologies is completely confidential. You can register at www.nanodrop.com. 2-2 Section 3-General Operation 3. General Operation The Sample Retention System Basic Use The main steps for making a measurement are listed below: 1. With the sampling arm open, pipette the sample onto the lower measurement pedestal. 2. Close the sampling arm and initiate a measurement using the operating software on the PC. The sample column is automatically drawn between the upper bushing and the lower measurement pedestal and the measurement is made. 3. When the measurement is complete, open the sampling arm and wipe the sample from both the upper bushing and the lower pedestal using a soft laboratory wipe. Cleaning the Sample Retention System Wiping the sample from the upper bushing and lower pedestal (as shown above) upon completion of each sample measurement is usually sufficient to prevent sample carryover and avoid residue buildup. Although generally not necessary, 2 ul water aliquots can be used to clean the measurement surfaces after particularly high concentration samples to ensure no residual sample is retained on either the pedestal or the bushing. It is recommended that the areas around the upper bushing and lower pedestal be cleaned (i.e. with water) after measuring a large number of samples. This will prevent the wiping after each measurement from carrying previous samples onto the measurement pedestals and affecting low-level measurements. A final cleaning of all surfaces with deionized water is also recommended after the user’s last measurement. Decontamination of Measurement Pedestals If decontamination is necessary, a sanitizing solution, such as a 5.25% solution of sodium hypochlorite (bleach – freshly prepared), can be used to ensure that no biologically active material is present on the measurement pedestals. The metal fiber optic fittings are made from 303 stainless steel and are resistant to most common laboratory solvents (see the Solvent Compatibility appendix). 3-1 Section 3-General Operation Special Cleaning Requirements for Proteins Proteins and solutions containing surfactants can ”un-condition” the measurement pedestal surfaces so that the liquid column does not form well with 1ul samples. If this occurs, “buff” the measurement pedestal and upper bushing by rubbing each with a dry laboratory wipe 25-50 times. This will “re-condition” the surfaces allowing the liquid sample column to form. Sample Size Requirements Although sample size is not critical, it is essential that a liquid column is formed and the gap between the lower measurement pedestal and the upper bushing is bridged with sample. It is best to use a precision pipettor (0-2 ul) with precision tips to assure that sufficient sample (1-2 ul) is used. Lower precision pipettors (0-10 ul and larger) are not as good at delivering 1 ul volumes to the measurement pedestal. If you are unsure about your sample characteristics or pipettor accuracy, a 2 ul sample is recommended. Sample Carryover Prevention of sample being retained on the ND-3300 fluorospectrometer’s measurement pedestals is easily addressed. Simple wiping of the upper bushing and lower measurement pedestal with a dry laboratory wipe is highly effective. This is possible since the measurement pedestal is, in actuality, the highly polished end of a fiber optic cable. There are no cracks or crevices for residual sample to get trapped within. Sample Homogeneity Sampling from non-homogeneous solutions, particularly when using small volumes, can cause significant deviations in the data generated using all measurement technologies including fluorospectrometry. Genomic DNA, lambda DNA and viscous solutions of other highly concentrated nucleic acids, such as re-suspended nucleic acid preparations, are common examples known to the molecular biologist. Proteins are subject to denaturation, precipitation, and aggregation and therefore may require special handling to ensure sample homogeneity. Bubbles must also be avoided since they can lead to erroneous signals. When dispensing samples, it is advisable not to dispel the full liquid (sample) content from the pipette tip and risk bubble introduction to the sample being measured. Effect of Evaporation and Solvents Evaporation of the sample during the measurement cycle usually has just a minimal effect on readings for aqueous samples. Highly volatile solvents, such as hexane, will likely evaporate before the measurement can be completed. Less volatile solvents such as DMSO can be used successfully. Software Architecture and Features Main Menu With the sampling arm in the down position, start the NanoDrop software by selecting the following path: Start Æ Programs Æ NanoDrop Æ ND-3300 [version] Application Modules 3-2 Section 3-General Operation The software has been tailored to meet the life scientist’s needs. It includes the following pre-coded application modules: • • • Nucleic Acid -using 33258 Hoechst dye, PicoGreen, RiboGreen Proteins -using Quant-iT™ Protein assay Other Samples -includes FITC (fluorescein) (methods for using either the Blue or White LED), Cy3-Alexa 555 and Cy5-Alexa 647, 4-methyl umbelliferone, and Quinine sulfate. Method Editor The Method Editor button, accessible from the Main Menu, gives the user the ability to include or configure new fluorescent dyes and methods, adding to those currently available. Method Name The Method is the unique name used for both inherent fluorophores (e.g., FITC) and named applications (e.g., PicoGreen). Five (5) buttons at the bottom of the Method List in the Method Editor are used to configure, change, remove, and save new methods. Note: Diamonds indicate predefined methods which cannot be modified (see figure below). To add a new method, highlight a method and click on ‘Insert Below’. A new window will appear with several tab options. General tab: allows the user to define the method type as nucleic acid, protein or “other”. Additional parameters set using this tab are: • • Graph minimum nm: minimum wavelength (nm) for the x-axis of the fluorescence spectral plot. Graph maximum nm: maximum wavelength (nm) for the x-axis of the fluorescence spectral plot. 3-3 Section 3-General Operation Fluorescence tab: allows for the selection of the LED source and gain settings. • • • • UV LED: excitation center point 365 nm Blue LED: excitation center point 470 nm White LED: 500-650 nm excitation AutoGain: controls the length of excitation time based on fluorescent signal intensity. Note: The alternative to AutoGain is Fixed gain which sets the excitation time using a factor between 0 and 10. See section 4 for further details. Analysis tab: gives the user the choice of determining concentration by reading off of a standard curve at one wavelength (1 pt analysis) or by defining a specialized formula. • • Standard Curve Type: determines the default standard curve fitting method. Choices include: o Interpolation: linear interpolation between adjacent standards. st o Polynomial order (1, 2 or 3): fits the standard measurements with 1 , 2nd or 3rd order polynomials. Default units: there are six choices of concentration units. Note: The operator may also change the standard curve fit type using the toggle button on the standard curve page within each module. Source Correction tab: an additional window available when the user selects the White LED using the Fluorescence tab. 3-4 Section 3-General Operation Settings include: • • Analysis nm: emission wavelength (or wavelength formula) of optimal fluorescence intensity. Emission Filter interval (∆λ): symmetrically applied around the analysis nm (emission wavelength) selected. Note 1: The analysis wavelength cursor can be manually adjusted by ± 20 nm of the analysis wavelength within the measurement module. Note 2: An equation (formula) comprised of up to four wavelengths and four coefficients can be defined and will report both the RFU of the respective wavelengths and the relationship amongst them. The formula is used to calculate concentration. See section 3 (General Operation) for further detail. Note 3: All fluorescence measurements outside the virtual filter interval are set to zero. The default interval is ± 20nm, and can be set using the User Preferences Table (see below). Note 4: The ∆λ can also be modified within the respective fluorescence method module. Data Viewer This module is designed to offer the user the ability to customize report structures, import archived data and re-plot previously archived data. See section 8 for further details. Users Manual A .pdf version of the user’s manual is available via the Main Menu. User Preferences Each user can select settings for two common features used for application modules. The default setting for saving data in a report is for ‘Auto Report’ to be enabled. The user may elect to deselect this option using the ‘Change Settings’ button. The same button also allows the user to select a previously saved report column configuration as the default for particular methods. This feature is only available when there are stored alternate report formats to choose from. Duplicate data storage The duplicate data storage option is selected using the User Preferences window. Account Management The Account Management module provides options for directing where specific data files are archived, allowing users to segregate their data into personal folders. The Account Management module is accessible to the administrator and level 10 users only. The module will be “grayed out” for all other users. Account Types There are three types of user accounts: Level 10- is the highest security setting and any level 10 can add new users, modify a user, delete a user and set password options. At the time of software installation, the only level 10 account is ‘Administrator’ whose initial password is “nanodrop”. It is strongly recommended that the password be changed after the initial account set up. Any user can be set to a level 10 access, although this is not recommended (see Level 5 below). Note: The administrator (or the last level 10 user) account may not be deleted. 3-5 Section 3-General Operation Level 5- is the security setting recommended for an ordinary user account. An account with this access will be password protected and will be able to select specific user preferences. All data generated will be automatically archived in to the user’s account in c:\ND-3300 data (and the user specified location if that preference is selected). Default- (level 0 security) is the access level reserved for the Default account only. This account enables any user without an account to access all active software measurement modules. It is not password protected, however, user preferences can be set for this account. All data generated will be automatically archived into the Default folder within the c:\nanodrop data folder. Note: The administrator may disable the default user account for laboratories requiring unique user accounts. Account Log-in/Log-out and Time Out The user’s account will remain active until 1) the user logs out of his/her account by using the pull down box on the Main Menu to select either ‘Default’ or another user name or 2) the user closes the software. A user account will also log out if the software “System idle timeout” is exceeded. After 4 hours of inactivity the software account will automatically revert back to the Default user. A screen will appear indicating that the time is about to expire, with a 30-second countdown. If the user elects ‘CANCEL’, the clock with reset and the user account and application module will remain active for another 4 hours. If the time expires, the open application module will close, returning to the Main Menu and the Default user. Account Lockout User-specific accounts can become locked out in several ways as noted below: • • • Failure to change password within the allotted time Incorrectly entering the password 99 consecutive times The administrator locks a specific account Only the administrator (level 10) can unlock a locked account. This is done by using the ‘Modify User’ entry in the Account Management module. Note: All accounts (even the administrator) can be locked if the incorrect password entry occurs as described above. Change Password This module enables each user having an authorized account ID to change their respective password. This option is “grayed out” for the default user. Note: The administrator, using the ‘Options’ entry in the Account Management module, establishes whether user passwords will expire and if so, after how many days. Passwords.log file This file contains the User ID & password for all accounts and is readable only by the software. It can be found in the C:\ND-3300 Data\log files folder. It is strongly recommended that the administrator make a copy of that file and store it in the same log files folder as described above each time a new user account is added or a password is changed. If the administrator’s account becomes locked, the up-to-date copy can be renamed and used as the password.log file. 3-6 Section 4- Common Module Functions 4. Common Module Functions Module Startup Each module (or application) is accessible starting from the Main Menu. All sample data will automatically be logged in the appropriate archive file. Escape Key (ESC) The escape key is set to exit out of all screens. Hitting the escape key twice will log the user out of an application module. Basic Module Window Measure (F1) Each time a software module is opened, the Measure button is inactive as noted by its “grayed-out” appearance. A blank must first be measured before the Measure button will become active. Note: For all methods that use the White LED excitation source, Initialize replaces the Blank / Reblank function. The Measure button is used to initiate the measurement sequence for all samples (non-blanks). It is activated by depressing the ‘F1’ key or clicking the ‘Measure’ button. Blank (F3) Before making a fluorescent measurement, a blank (using the buffer, solvent or carrier liquid the sample of interest is in) must be measured and stored. It is not necessary to blank between every sample. Re-blank (F2) The Re-blanking option (F2) establishes a new reference (blank) that is used for the calculations of subsequent samples. However, unlike the Blank (F3) function, the Re-blank feature recalculates the fluorescence spectrum for the most recent sample and displays this on the screen. When the Re-blank function is used, the following message appears: Initialize – White LED When working with applications that use the White LED, the Blank and Re-blank buttons will be replaced with a single one called ‘Initialize’. Before making a fluorescent measurement utilizing the White LED source, the module must first be initialized and the source’s emission stored. The stored information is required for the “Virtual Filtering” algorithm. 4-1 Section 4- Common Module Functions Print Screen (F4) The Print Screen button will print a copy of the current operating screen to the default printer attached to the operating PC. Print Window A Print dialogue can be initiated from the File pull-down menu or by typing ‘Ctrl+P’. The user can specify which networked printer to use from the Print dialogue. Print Report (F5) Selecting the ‘Print Report’ (F5) button will print the existing sample report to the default printer. It does not clear the sample report contents. The default maximum buffer capacity is 32 samples although the user has the option of increasing the buffer to a maximum of 200 samples. The user also has options as to how the buffer is handled (automatically clear upon printing, prompt before clearing, etc.) See section 8 (Data Viewer) for additional details. All data is stored in the archive file at C:\ND-3300 Data. Saving Current Screen as .jpg Image The current screen can be saved as a .jpg image file by selecting ‘Save Window’ from the File pull down menu. Recording (F6) The default setting has the Recording feature activated which automatically records and prints 32 measurements in a report format. See section 8 (Data Viewer) for additional details. Note: To override this feature, click on the ‘Recording’ button. Once de-selected, the button will read Start Report. Print and Save Menu A print dialogue can be initiated from the File pull-down menu accessible within all modules. The Print Window option and Ctrl P enable selection of printers available to the respective user. By selecting the Save Window option, the user may save the current window as a .jpg image. If the PC is not connected to a printer, you will see an error message that will not cause the software to shut down. Show Report (F7) The user can display the entries comprising the current Sample Report at any time by selecting the ‘Show Report’ button. This function will enable the Data Viewer software described in section 10. Parameters specific for the individual application modules are populated for each individual Sample ID. View Standard Curve All applications or modules include an optional “‘Standard Curve” functionality. In addition to the measured RFU output, the user can generate a standard curve using between 1 to 7 standard concentrations (1 to 5 replicates per point). Note: When a valid standard curve has been established the solid green button will be replaced as seen below: A standard curve can be saved and reloaded using the Standard Curve pull down menu and choosing the ‘Save as’ or ‘Load’ functions respectively. 4-2 Section 4- Common Module Functions Selecting the View Standard Curve button allows the user to view the standard curve at any time. An example is shown below: Note 1: The user should select the proper concentration “units” for the respective assay on the basic module window before generating a standard curve as changing the units after a measurement will result in the loss of the standard curve data. Note 2: The user may exclude points by selecting the data point to be deleted in the table and then clicking on the Delete Point button. Additional module functions Measurement Type The user must select the type measurement (i.e. reference, standard or sample) before each aliquot is read. If desired, a standard curve can be created to calculate the concentration for sample unknowns. Accordingly, the user would select ‘Reference’ for a nonanalyte solution, ‘Standard’ for a known concentration of reagent, and ‘Sample’ for an unknown concentration of the sample of interest. Note 1: The module will always output RFU (relative fluorescent units) even when a standard curve is not generated. Note 2: Be sure to select the preferred concentration units before running the first standard. Changing units after a measurement will result in the loss of the standard curve data. Method Specifies the current application. Units This term refers to the way a sample concentration is expressed based on a standard curve. It is only populated when a standard curve is utilized. The operator can choose which of six unit configurations to use in several ways. The method editor allows a unit choice as a default selection while the method page allows for interactive changes in the selection. The units can be changed once a sample has been run by selecting the Reset Window button. Note: Changing the units will clear all standards. It is important to select the units of interest when generating standard curves before measuring the first standard. Actual Gain Auto / Fixed Gain are the two options for setting the gain or excitation time. When the Auto Gain (default) mode is active, the source (LED) illumination (excitation) time is optimized for each sample. The Actual Gain value for the respective sample will be displayed in this mode. A value of 10.0 corresponds to the maximum gain or excitation time maximum of 1 second (1000 msecs). 4-3 Section 4- Common Module Functions The Fixed Gain option is selected when constant gain or excitation time is wanted for every sample. Fixed Gain settings range from 0.1 to 10.0 in 0.1 increments. Note 1: RFU signals for all gain settings are normalized for the actual time of measurement. Note 2: The Auto Gain feature is activated or deactivated via the Method Editor module. Minimum Gain This feature will appear when the Auto Gain feature is selected. This is a selectable option which alerts the user when the minimum amount of time a measurement should collect data (as set in the method Editor) has not been met. Saturation nm The NanoDrop software automatically limits the amount of time the LED source is on in order to prevent too much light from saturating or flooding the spectrometer detector for all wavelengths above the user selectable setting termed “saturation nm”. The default setting is 490 nm. The user may find that for a particular application, choosing a saturation nm nearer the emission nm of interest may result in longer excitation times and higher sample fluorescence readings. The software will not prevent saturation for wavelengths below the selected saturation nm. Note 1: The fluorescence signal from the sample fluorophore (emission wavelength) is never allowed to saturate the detector when the Auto Gain setting is active. Note 2: When Fixed Gain is active (i.e. when the user defines the excitation time), it supersedes the Saturation nm setting. This can result in saturation at any wavelength of the spectrum including the fluorophore of interest. Sample ID The Sample ID is highlighted for overtyping or barcode scanning. The user may input a sample ID that will be used to identify the measurement in a report print and in the archived data file. The sample ID entry is “key focused”, meaning it is the default selection on the screen and should have a flashing text cursor when the instrument is waiting to make a new measurement. Note: The sample ID name can be changed only by using the Data dropdown box on the reports page: Choosing ‘Rename Selected’ will bring up the following dialog box: Source: specifies the excitation source for the method selected. Note: The source cannot be changed for predefined methods. RFU at xxx nm This is the relative fluorescence output at the wavelength specified for the method (user settable cursor). The user may move the cursor + 20 nm of the analysis wavelength. 4-4 Section 4- Common Module Functions ∆λ For White LED excitation, the virtual emission filter interval (∆λ) is the respective wavelength range over which the residual signal (with scaled background compensation removal), is displayed and calculated. It is symmetrically applied around the Analysis nm (emission wavelength) selected. All fluoresence readings outside the virtual filter interval are set to zero. The Default interval is ± 20nm and may be modified using either the Method Editor module or from within the respective fluorescence (method) module. See section 3 for further details. Note: The baseline for non-analyte (non-fluorescent) samples can exhibit significant non-uniformity and irregularity with the virtual filtering algorithm. The greatest effect is on the detection limits (sensitivity) for low-concentration fluorophores. Fluorescence of concentrated solutions, where the fluorescence intensity is significantly greater than the non-analyte background fluorescence, can be measured with good reproducibility. Working with more concentrated solutions for fluorophores such as Cy3 or Alexa Fluor 555, where the excitation maximum (555 nm) is also the maximum emission of the White LED, can overcome the baseline nonuniformity. Configuration There are four options that are controlled by the Configuration tool bar pull down feature as shown below: 1) The fluorospectrometer has a default setting of making a “beep” noise at the end of each measurement. The user may choose to silence this operation using the Configuration feature. 2) The dropdown allows for the option of having the software automatically scale a plot. 3) An additional option available by this dropdown is the choice of displaying either just the RFU plot or a spectrum showing the blank, raw and RFU plots. Note: The spectrum with all data displayed uses two scales. The right hand scale displays counts and is used for both the blank and raw data. The left hand scale reports the difference between the blank and raw and is reported as RFU. The two scales can be modified independently by overtyping the top value. 4) The final option controlled by the Configuration dropdown is whether or not to display all available parameters on the main screen. Default screen: With advanced parameters displayed: Exit This command closes all application modules and supporting options. After clicking the ‘Exit’ button, the user has 10 seconds to cancel the exit command. If no action is taken within 10 seconds, the exit command is carried out. Note: All measurement data is automatically saved to an archive file and requires no user action. 4-5 Section 4- Common Module Functions Show Context Help Context Help is enabled in the Main Menu, all function modules, and all Application modules. The help feature is enabled by choosing ‘Show Context Help’ from the Help menu or by selecting ‘Ctrl H’. Once enabled, placing the cursor on elements of the screen will automatically generate an explanation of that element. Context Help remains active until the user deselects it. User’s Manual A .pdf version of this User’s Manual is accessible from the Main Menu. It can also be accessed by selecting from the Help pull down menu in any application module or from Start Æ Programs Æ NanoDrop Æ ND-3300 V2.5.0. 4-6 Section 5-Nucleic Acid 5. Nucleic Acid There are three NanoDrop-coded applications within this module for determining nucleic acid sample concentrations: • • • dsDNA 33258 Hoechst dye dsDNA PicoGreen® dye RNA RiboGreen® dye The user can also create and save other methods for analysis within this module by using the Method Editor (see section 5). dsDNA 33258 Hoechst This application is configured to measure fluorescence of the Hoechst dye, which is greatly increased upon binding to doublestranded (ds) DNA. Fluorescence of the Hoechst-dsDNA complex is measured at 450 nm following excitation by the UV LED. Using 2 ul samples, sensitivity for the Hoechst is approximately 150 picograms and the linear range is from 75ng/ml to 1500 ng/ml. Details of a recommended protocol as well as performance data can be found at www.nanodrop.com. A typical standard curve for this dye is represented in the figure that follows: dsDNA PicoGreen® (dye) ® This application is configured to measure fluorescence of PicoGreen dye, which is greatly increased upon binding to double® stranded dsDNA. Fluorescence of the PicoGreen dsDNA complex is measured at 525nm using the Blue LED excitation. 5-1 Section 5-Nucleic Acid Using 2 ul samples, sensitivity for the PicoGreen® assay is approximately 2 picograms and the linear range is from 1ng/ml to 1000 ng/ml. Details of a recommended protocol as well as performance data can be found at www.nanodrop.com. A typical standard curve for this dye is represented in the figure that follows: ® RNA RiboGreen (dye) This application is configured to measure fluorescence of RiboGreen® dye, which is greatly increased upon binding to RNA. Fluorescence of the RiboGreen® RNA complex is measured at 525nm using the Blue LED excitation. Using 1.5 ul samples, sensitivity for the RiboGreen® assay is approximately 7.5 picograms. It is best to use two distinct dye stock working concentrations to cover a dynamic range of 5 ng/ml to 1000 ng/ml. Details of the recommended protocol as well as performance data can be found at www.nanodrop.com. A typical standard curve for this dye is represented in the figure that follows: 5-2 Section 5-Nucleic Acid 5-3 Section 6-Protein 6. Protein TM The single NanoDrop-coded application within this module for determining protein sample concentration uses the Quant-iT system from Molecular Probes. This protein dye is a fluorescent stain used to quantitate minute amounts of protein in solution. The dye is excited using the Blue LED and has an emission wavelength range of 590-610 nm. TM Using 2 ul samples, sensitivity for the Quant-iT assay is approximately 0.05 micrograms. It is best to use two distinct dye stock working concentrations to cover a dynamic range of 0.05 micrograms to 5 micrograms (BSA). Details of the recommended protocol as well as performance data can be found at www.nanodrop.com. A typical standard curve using the recommended high concentration working stock for this dye is represented in the figure below: 6-1 Section 7-Other Samples 7. Other Samples There are five pre-coded applications within this module: • • • • • Fluorescein, FITC, FAM Cy3,Alexa555 Cy5,Alexa647 Quinine Sulfate 4-methyl umbelliferone The Cy3 & Cy5 fluorophores and their respective counterpart methods utilize the White LED excitation source. Both quinine sulfate and 4-MU (methyl umbelliferone) are excited by the UV LED, while FITC (fluorescein) uses the Blue LED source. Fluorescein, FITC, FAM This module is configured to measure the fluorescence of Fluorescein (FITC) at 515nm. Unlike the Nucleic Acid & Protein dyes described earlier, Fluorescein is naturally fluorescent. After covalent attachment of FITC to the molecule of interest, FITC-labeled reagent must be separated from unbound fluorphore before taking a measurement. A representative spectrum of a 0.5 uM (500 nM) Fluorescein sample (diluted NIST SRM 1932) measured on a NanoDrop Fluorospectrometer using the Blue LED follows: Linearity has been demonstrated between 0.1 nM to 500 nM. Performance data can be found at www.nanodrop.com. Cy3, Alexa Fluor 555 This module is configured to measure the fluorescence of Cy3 or Alexa Fluor 555 at 565nm. Unlike the Nucleic Acid & Protein dyes described earlier, these fluorophores are naturally fluorescent. After covalent attachment of the fluorophore to the molecule of interest, the fluorophore-labeled reagent must be separated from unbound fluorophore before taking a measurement. Using 2 ul, sensitivity has been shown to be ˜ 5 femtomoles or 2.5 nM. Linearity has been demonstrated between 2.5 nM to 3000 nm. Performance data can be found at www.nanodrop.com. 7-1 Section 7-Other Samples Cy5, Alexa Fluor 647 This module is configured to measure the fluorescence of Cy5 or Alexa Fluor 647 at 670 nm. Unlike the Nucleic Acid & Protein dyes described earlier, these fluorophores are naturally fluorescent. After covalent attachment of the fluorophore to the molecule of interest, the fluorophore-labeled reagent must be separated from unbound fluorophore before taking a measurement. An example of Alexa 647 is displayed below: Using 2 ul, sensitivity has been shown to be ˜ 5 femtomoles or 2.5 nM. Linearity has been demonstrated between 2.5 nM to 3000 nm. Performance data can be found at www.nanodrop.com. Quinine Sulfate This application is configured to measure the inherent fluorescence of Quinine Sulfate. Fluorescence of Quinine Sulfate is measured at 450 nm following excitation by the UV LED. Using 2 ul, sensitivity has been shown to be ˜ 60 picograms of quinine sulfate. Linearity has been demonstrated between 30 ng/ul to 3000 ng/ul. Performance data can be found at www.nanodrop.com. 4-Methyl umbelliferone, (4-MU) This module is configured to measure the fluorescence of enzymatic cleavage products containing 4-methyl umbelliferone at 460 nM using the UV LED. Detection of 4-methyl umbelliferone may be used as a sensitive, quantitative assay for b –galactosidase or other enzymes that cleave substrates linked to 4-MU. Cleavage of 4-methyl umbelliferyl-b-D-galactoside by b -galactosidase yields the fluorescent molecule 4-methyl umbelliferone (7-hydroxy-4-methylcoumarin, 4-MU). Note: 4-methyl umbelliferone is fluorescent only above pH 8. A representative spectrum of 4-MU diluted in 0.1mM carbonate buffer is shown below: 7-2 Section 7-Other Samples Using 2 ul, sensitivity has been shown to be ˜ 2 picograms or 1 pg/ul. Performance data can be found at www.nanodrop.com. 7-3 Section 8-Archived Data and Data Viewer 8. Archived Data and Data Viewer Sample data from all application modules is automatically stored in archive files and can be opened by either the integrated Data Viewer software program or spreadsheet programs such as MS Excel. Archive File Creation Every time an application module is started, an application-specific archive file is created for the user that is logged in. All measurements made by the user (in that application module) for a given calendar day are stored in a single archive file. These files bear the name of the respective application module with the date appended. For example, an archived file entitled “PicoGreendsDNA 2005 10 10.nfd ” corresponds to PicoGreen® assay data from the software session that was generated on October 10, 2005. A unique file extension (.nfd) has been given to these files to enable automatic startup with spreadsheet formats or by importing into Data Viewer (see section on Data Viewer below). The data may be edited and/or reformatted and stored under names of the user’s choice. The spectrum can be re-plotted from the wavelength data if needed for further analysis. Note1: Fluorescence data shown in archive files are represented as they are displayed on the screen. Note 2: For data from all modules, a column entitled ‘Measurement Type’ is included. For each measurement, this column will contain ‘Measure’, ‘Blank’, or ‘Reblank’. If the value is ‘Measure’, then the values in that row are from a normal measurement that has utilized the stored blank value. If the value is ‘Blank’, it indicates that the measurement is the initial blank recorded. If the value is ‘Reblank’, it is the re-analysis of the previous measurement with a new blank. Data Storage Hierarchy The hierarchy for archive files is as follows: C:\ND-3300 Data Æ User name Æ Application Module (Hoechst dsDNA, PicoGreen dsDNA, RNA RiboGreen, etc.) User-Defined Archive File Location In addition to the primary data storage, users may elect to save their data to an additional location. This option can be chosen under the Archiving Tab in User Preferences on the Main Menu by setting the ‘Duplicate data storage box’ to ‘On’ and then choosing the file path by clicking on the file folder icon under Duplicate Data Folder. Save the alternative path by clicking on the ‘Save Preferences’ button before exiting the User Preferences window. All data is written to the archive file immediately upon completion of the measurement. Inadvertent software or PC shutdowns should not affect the archive file. Data Viewer Data Viewer is a versatile data reporting software program incorporated into the NanoDrop software that offers the user the ability to customize report structures, import stored data and re-plot data generated from NanoDrop instruments. Using the Data Viewer is the most expedient method to review data. This feature may be accessed during measurement sessions from the Show Report function found within each method module. Accessing via the Main Menu is used to import and review previously archived data and also allows the software to be utilized as a stand alone feature (i.e. when an ND-3300 fluorospectrometer is not connected to the PC.) 8-1 Section 8-Archived Data and Data Viewer Data Viewer Features The Data Viewer is composed of two or three pages in a tabular form consisting of Plots, Reports and Standard Curves (where utilized). The user may access any page by clicking on the tabs. The software opens to the Plots page (see Plots section below) whether accessed through the Main Menu or Show Report. Note: Recording rather than Start Report must be selected in order to access the Data Viewer via Show Report. Tool Bar Features common to all three pages include: Configuration: Options controlled by this tool bar function include ‘Auto Scale’, ‘Include graph in printout’ and ‘Include standards in printout’. Data: Includes options to import data, rename samples and delete sample data. Note: After deleting all samples, it is important to exit out of the Data Viewer module and re-enter if importing data for a different application type. Report: This tool bar function allows the user to select columns of interest to be included in a report. See section on Reports Page for more detail. File Page Set-up: Allows the user to define the page set up for printing out the spectra, the report and the standard curve. Print Window: The current Plot, Report, or Standards screen may be printed by selecting ‘Print Window’ or ‘CTL +P’. Save Window: Saves files as .jpgs. Help/Context Help: This feature is enabled in the Main Menu, all function modules, and the application modules. The help feature is enabled by choosing ‘Show Context Help’ from the Help menu pull down or by selecting ‘Ctrl H’. Once enabled, placing the cursor on elements of the screen will automatically generate an explanation of that element. Context Help remains active until the user deselects it. Import Accessing the Data Viewer via the main menu requires the user to import archived data. Use the Data drop down tool on the top menu bar to select Import Samples. This will bring up a new window with an Import Folder box and a Directory Tree. Features include: Import folder: Used to select folder where data is to be imported from. Folder selection must be at the level of user or higher. Directory tree: Used to select specific data to be imported. Clicking on the square to the left of each file name will provide further detail to each level. Users may choose to select either individual samples within a file or the entire file. All import selections must be of the same application or method type. 8-2 Section 8-Archived Data and Data Viewer >>> or <<<: Used to move the highlighted sample choices to or from the Selected Samples box. Note: The software defaults to a buffer size of 200 samples. Search: Function allows the user to locate specific data by searching through sample ID names. Note: This function is case sensitive. Sample Information and Spectrum: Are populated with the information associated with the most recently highlighted sample. Import and Return: Uses selected sample data to populate Plots and Reports windows and then returns to the Plots window. Plots The Plots page is where selected sample spectra are displayed. Features include: Method: Auto fills in module name. Date: Auto fills in date and time of report. Selected Plot: There are two methods of selecting or highlighting individual sample data. The user may simply move the cursor over the plot of interest and click or use the ‘Selected Plot’ drop down box (which will also display the legend). The selected sample will show up as a bold plot line. Plots/Sets: Users may select the maximum number of individual plots (up to 20) graphed per page. Since a report can hold data for 200 samples and a graph page is limited to 20 plots, additional sample spectra are displayed on new pages. Each page is then referred to as a set. Legend: Positioning the cursor over the legend box will bring up a visual display matching the sample name to a plot color. The user is not able to select or highlight a sample from the legend. Sample information: Automatically populates with data associated with selected sample. Data displayed is appropriate for data type chosen. Note: Information is based on data collected at the time the sample was measured and is not modified by a change in cursor position on the Data Viewer real time display. Movable x and y axis: available for all data types. If the cursor is out of view in either direction- rescale the axis by typing over one of the outer limit numbers. The cursor RFU information displayed at the bottom of the page is determined by the position of the movable cursors. The movable X determines the baseline from which the peak of the Y position is calculated. Reset Baseline will reposition the x axis back to zero. Reports The Reports page displays the data for selected samples in a table format. The user may modify column configurations for each method type and save multiple customized formats by using the drop down Report options. 8-3 Section 8-Archived Data and Data Viewer Report tool bar drop down options include: Sort: Allows users to sort data by column (example-by date or sample name). Save report format: Saves specific report in appropriate data type folder. All files saved with .nfd extensions even if ‘all files’ is chosen. To designate a saved report format as the default format, exit to the Main Menu, choose ‘Users Preferences’ and click ‘Change settings’. A list of the various saved formats available for the specific method type will be displayed. Load Report Format: Allows saved report formats to be loaded either before or after data is imported. Print report: Will print out only the Report page by default. Users may choose whether or not to print out the standards or plots pages by selecting these options under the Configure drop down on the tool bar. Save Report and Load Report: There are several choices for this option as seen in the following window: Using the Full Report option will allow the user to use the Data Viewer to reload the report at a later date. The saved report may be recalled using the pull down Load Report. If using the Load Report feature- the report will be displayed with the default column configuration. Note: Access the User Preferences module on the main menu to modify and save preferred default configurations. Reports are saved in an .nfr format. The other two options are meant for reports that are expected to be opened in Excel type spreadsheets. To open these reports, go to the C:\ND-3300 Data\Reports folder and right click on the file of interest. Additional features of the Report page: Method: Automatically populated with data method type. Date and time: Automatically populated when report is generated. Report Name: User defined designation for the current report. Buffer mode: Drop down box defining options for managing reports. Max Buffer size: Default number is set at the maximum of 200. o When the selected buffer size is reached, the Report will either be ‘Saved & Cleared’ or ‘Printed and Cleared’. o Selecting ‘Show Report’ will bring the user to the report page. All data is saved in the archive files and can be retrieved using the Import feature of the Data Viewer module. Standards Page The Standards page will display the actual reference standards applied to each particular sample at the time of measurement. 8-4 Section 8-Archived Data and Data Viewer Opening Archived Data with spreadsheet programs The files are in tab-delimited format and can be opened in Microsoft Excel or an equivalent spreadsheet program. 8-5 Section 9--Troubleshooting 9. Troubleshooting Error USB2000 This error might appear upon software startup and usually indicates that the USB cable is not properly connected or the software is not loaded properly. To troubleshoot, do the following: 1. Confirm that the USB cable is connected to both the PC and the instrument. 2. If the cable is connected properly but the error persists, run the ‘USB Reset’ application located in Start Æ Programs Æ NanoDrop Æ Utilities Æ USB Reset. (If USB Reset is not installed on your PC, you can download it from the “Downloads” section of www.nanodrop.com). 3. Follow the onscreen instructions from USB Reset. After unplugging and then reconnecting the USB cable, the Found New Hardware Wizard should start as shown below. (Windows XP SP2 operating system will ask to allow it to search the internet for the proper software as shown- Select ‘No, not this time’). Follow the prompts for automatic installation of the software. Intro Page: Windows XP- SP2 Other Windows Operating Systems 4. Try the NanoDrop software; if it works properly you are finished. If it does not operate properly, go to step 5. 5. Shutdown the NanoDrop software and open the USBView utility to confirm proper USB communication: Start Æ Programs Æ NanoDrop Æ Utilities Æ USBView. If USBView is not installed on your PC, you can download it from the “Downloads” section of www.nanodrop.com. 6. Click on the ‘Device Connected' as shown below. If more than one USB device is connected, view each of them. One of the connected devices should give an “idVendor” and “idProduct” as 0x2457 and 0x1002 respectively as shown below. If these are present, the USB function of the instrument should be OK. If the “idVendor” and “idProduct” are different than below, or if no USB device is present in the list, go to step 7. 7. Install the instrument on another PC to rule out a faulty USB hub/port on the original PC. Run USBVIEW on the 2nd PC. If the same behavior is exhibited, then the instrument may need service. Contact NanoDrop Technologies or your distributor if this occurs. 9-1 Section 9--Troubleshooting Connection Errors This error occurs whenever the USB connection is disrupted while operating a software module. In most cases, selecting ‘Retry’ will reconnect properly. Some possible causes and solutions are listed below: Power management scheme on the PC: The USB communication will be lost whenever your PC automatically goes into standby or hibernate mode. ‘Retry’ will NOT reconnect the instrument. If this occurs, the USB cable will need to be disconnected and then reconnected before selecting ‘Retry’. You can confirm that the power management settings are correct by opening the Power Options Properties page by choosing Start Æ Control Panel Æ Power Options. Both System Standby and System Hibernate should be set to ‘never’ for the Plugged In column as shown below: Static Electricity Discharge Discharge from the user to the instrument can be a problem in very dry environments. It may be necessary for the user to wear a grounding strap to prevent the discharges from occurring. Defective USB Port on PC If your instrument operates properly most of the time, but the Connection Error appears intermittently, it could be caused by the USB port on the PC. If this occurs, install the software and operate on another PC. If the error does not occur on the second PC, it may be necessary to replace the USB card on the original PC. If none of the troubleshooting steps above solve the problem, refer to the Technical Service section for getting help from your distributor or NanoDrop Technologies. 9-2 Section 9--Troubleshooting Error: Code 8 This error occurs when access to any of the three “.log” files (“dye list.log”, “passwords.log” or “user preferences.log”) has been denied. This usually occurs when a user without administrator access runs the software. If this is the case, someone with administrative privileges must set the permissions on the operating program files folder (C:\ND-3300 Data\Log Files) so that all users have read/write access to the files in the folder. To set the permissions, do the following: 1. 2. 3. 4. Log in using an account with administrator rights. Right click on the C:\ND-3300 Data\Log Files folder. Select ‘Sharing and Security’, or ‘Sharing’. Set the security according to your operating system/networking as shown below: XP Professional using Domain Networking (using a server). Windows 2000 Professional XP Home and XP Professional using Workgroup Networking On the Security tab, set he permissions for ‘Users’ to ‘Full Control’ as shown below On the Sharing tab, select share this folder as shown below: On the Sharing tab, set the Network sharing and security settings as shown below: Note 1: If you encounter a message stating that “Windows has disabled remote access to this computer”, it will be necessary to run the Network Setup Wizard in order to set the permission levels on the folder. Note 2: This error can also occur if the .log files are set to read-only. To confirm, right click each .log file and select ‘properties’. Deselect the ‘read only’ box for each .log file if it is checked. Installer Error Incorrect command line parameters… This error may be seen during the initial installation of the software and will be followed by the message “Unable to locate the LabView Runtime Engine” when the NanoDrop software is first opened. To install the missing file, go to C:\Program Files\NanoDrop\Utilities\Run Time Installers and double click on the file LVRUNTIMEENG.msi. Follow all prompts to install at default location. Other Software Error Messages An Error Occurred: Code: 7 Source: Open file in….. This error occurs when any of the three “.log” files (“dye list.log”, “passwords.log”, “user preferences.log”) has been removed from the folder where the program files were installed (C:\NanoDrop Data\Log Files). These files must be present in this folder in order for the NanoDrop software to operate. 9-3 Section 9--Troubleshooting Can’t find file OOIDRV.INI….. This error occurs when trying to install the software without administrator privileges. Contact your system administrator to install the software. Error 7 Occurred at New File….. This occurs when the “C:\ND-3300 Data” file folder has been removed from the C: drive or it has been corrupted. If this message appears, click on the ‘Stop’ button in the error window. Close the NanoDrop Fluorospectrometer software. Open Windows Explorer and create a new folder on the C: drive. Name the folder “C:\ND-3300 Data” (case sensitive) and close Windows Explorer. Click on the arrow in the far upper left of the NanoDrop Fluorospectrometer software. Restart the NanoDrop Fluorospectrometer software. Can’t Find LabView RunTime Engine….. This error message likely means that one or more of the software components have been removed or corrupted. If this occurs, reinstall the NanoDrop software using the installation CD or download from www.nanodrop.com. EZUSB.SYS Cannot Be Found….. If this error message appears, do the following: Windows 2000: type C:\WINNT\INF in the file path text box. Windows XP: type C:\WINDOWS\INF in the file path text box. This should allow the software to complete the installation successfully. Driver X Configuration Failed- You Must Manually Edit the Registry This error message (or others with similar wording) appears when attempting to install the operating software on a computer running Windows 2000 or XP. It occurs because the user does not have the necessary authorization to install the software on the computer. Contact your system administrator if this message appears. Error 8 Occurred at Open File….. This error message occurs when the user attempts to take a measurement while the data file is open. Close the data file and you should be able to continue taking samples normally. Insufficient Memory….. This error message (or others with similar wording) occurs when attempting to install the operating software on a computer that does not have at least 40MB of free hard disk space. No Printer Connected….. This error appears when attempting to print when a printer is not attached to the PC. It is non-fatal and will not cause the software to shut down. Sampling Concerns Sample Homogeneity The user must be sure the solution is homogeneous when measuring fluorescence. Micro-sampling from non-homogeneous solutions can cause significant deviations in the fluorescence data generated. Sample Accuracy and Reproducibility If you are obtaining results that seem inaccurate or not reproducible, it could be the result of sample or aliquot non-homogeneity or liquid column breakage. It may be helpful to try the following to ensure representative results: Clean the surface Make sure the sample surfaces are clean before starting the software module. A dirty sample pedestal on startup can cause erroneous fluorescence measurements (even negative values) and signal saturation. It is always a good practice to clean the sample surfaces with de-ionized water to remove any dried sample that might be present. 9-4 Section 9--Troubleshooting Use a 1-2 ul sample size Very strange results can occur when the liquid sample column is not completely formed during a measurement. While making a measurement, visually confirm that the liquid column is formed. If necessary, try 1.5-2 ul samples to ensure the column is formed. Also, proteins and solutions containing surfactants are known to ”un-condition” the measurement pedestal surfaces so that the liquid column does not form. If this occurs, “buff” the measurement pedestal surfaces by rubbing each with a dry laboratory wipe 15-20 times. This will “re-condition” the surface allowing for the liquid sample column to form. Unusual Spectra For particularly low fluorescence, a non-uniform spectral profile can result from a change in ambient light hitting the detector relative to the Reference originally obtained during blanking. Mercury vapor lighting may be give rise to a 546nm peak and ~ 610nm as seen in the first image below. Often re-blanking will correct the ambient light difference. Technical Service If after referring to the above troubleshooting tips you are unable to resolve your problem, please contact your local distributor or NanoDrop Technologies for help. The following information will be very helpful: 1. Visual inspection of the light sources: Check to see that the WHITE and/or BLUE light sources are emitting when making a measurement. Caution: Do not look directly at the UV light source while making measurements. To check the UV LED source, hold a piece of White paper in front of the light source and look for a Blue hue on the White background. 2. Application Module Screen Captures: Screen captures of the actual spectrum as seen on your PC can be of great use in diagnosing problems. Making a screen capture is quite easy. Simply choose ‘Save file’ from the pull-down menu in the Header of the respective screen (module). This saves the respective image as a .jpg in the respective module’s folder in which the user is working. The .jpg file can be sent as an email attachment to [email protected]. 3. Data Archive Files: If you have questions about your data, please send the archive file containing the suspect data as an email attachment to your distributor or to [email protected]. The archived file can be found at the following path: C:\ND-3300 data Æ Username Æ Application Module 9-5 Section 10-Maintenance and Warranty 10. Maintenance and Warranty Cleaning The primary maintenance requirement of the NanoDrop® ND-3300 Fluorospectrometer is keeping the measurement and optical surfaces clean. Upon completion of each sample measurement, wipe the sample from the upper bushing and lower pedestal to prevent sample carryover and avoid residue buildup. It is also recommended that both measurement surfaces be cleaned with deionized water upon completion of a testing series. No other regular maintenance is required. Decontamination of Measurement & Optical Surfaces If decontamination is necessary, a sanitizing solution, such as a 5.25% solution of sodium hypochlorite (bleach – freshly prepared), can be used to ensure that no biologically active material is present on the measurement pedestals. The metal fiber optic fittings are made from 303 stainless steel and are resistant to most common laboratory solvents (see “Solvent Compatibility” appendix). Warranty All fluorospectrometers and accessories manufactured by NanoDrop Technologies are warranted against manufacturing defects in parts and labor for a period of one year. Additional one, two, and three year warranty extensions are available. Plan descriptions can be found at the following link: www.nanodrop.com. 10-1 Section 11-Appendices 11. Appendices Instrument Specifications • Sample Size: 1-2 microliters • Light Sources: 3 light emitting diodes (LEDs) • Excitation Maxima of LEDs UV: 365 nm, Blue: 470 nm, White: 500-650 nm • Light Source: three light-emitting diodes (LEDs) • Detector: 2048 element linear silicon CCD array • Wavelength Range: 400-750 nm • Wavelength Accuracy: 1 nm • Wavelength Resolution: 8 nm (FWHM at Hg 546 m) • Fluorescence Precision: < 5% CV (10 nM fluorescein) • Measurement Cycle Time: 10-15 seconds • Dimensions: 20 cm X 15 cm x 12 cm • Weight: 3 Kg • Sample Pedestal Material of Construction: 303 stainless steel and quartz fiber • Operating Voltage: 5 vdc (all power supplied by USB port) • Operating Power Consumption: 2 W • Standby Power Consumption: 1 W • CE and UL/CSA Approval • Included in system: software, compatible with Windows 2000 or XP Sample Retention System Solvent Compatibility The NanoDrop ND-3300 Fluorospectrometer is compatible with most solvents typically used in life science laboratories. These include: methanol, ethanol, n-propanol, isopropanol, butanol, acetone, ether, chloroform, carbon tetrachloride, DMSO, DMF, acetonitrile, THF, toluene, hexane, benzene, sodium hydroxide, sodium hypochlorite (bleach), dilute HCl, dilute HNO3, dilute acetic acid. All forms of Hydrofluoric Acid (HF) are incompatible, as the fluoride ion will dissolve the quartz fiber optic cable. 11-1