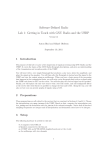
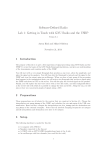
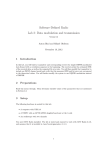
1
LiTH
2013–12–20
MOUCE 2.0
User Manual
Editor: Robin Carlsson
Version 1.1
Status
Reviewed
Approved
TSKS05
Jonas Karhu
Jonas Karhu
Christopher Mollén
2013-12-20
2013-12-20
Signalspanarna
[email protected]
L IPs
Page 1
LiTH
2013–12–20
MOUCE 2.0
PROJECT IDENTITY
2013HT, Signalspanarna
Linköping University, Department of Electrical Engineering (ISY)
Division of Communication Systems (CommSys)
Group members
Name
Robin Carlsson
Sebastian Faxér
Linus Mellberg
Henrik Rydén
Jonas Karhu
Responsibility
Project Leader (PL)
LTE Expert (LE)
Chief Designer (CD)
Test Manager (TM)
Head of Documentation (DOC)
Phone
076-2709056
073-5858550
070-3916857
070-8132759
070-2816120
Email
[email protected]
[email protected]
[email protected]
[email protected]
[email protected]
Email list for the whole group: [email protected]
Web site: http://www.signalspanarna.com
Customer: Christopher Mollén, [email protected]
Course leader: Danyo Danev, [email protected]
Supervisor: Reza Moosavi, [email protected]
TSKS05
Jonas Karhu
Signalspanarna
[email protected]
L IPs
Page 2
Contents
Document History
1 Introduction
2 Components
2.1 Hardware . . . . . . . . . . . . . . . . . . . . . . . . . . . . . . . . . . . . .
2.2 Software . . . . . . . . . . . . . . . . . . . . . . . . . . . . . . . . . . . . . .
3 Hardware Setup
4 Software Installation
5 User Interface
5.1 Control of the receiver and UI . . . . . . . . . . . . . . . . . . . . . . . . . .
6 Web Page
3
4
5
5
5
5
5
5
6
6
10
LiTH
2013–12–20
MOUCE 2.0
Document history
Version
1.0
1.1
TSKS05
Jonas Karhu
Date
2013-12-17
2013-12-20
Changes
First Version
Minor changes and addition of purpose
of MOUCE 2.0
Signalspanarna
[email protected]
Sign
RC
LM
Reviewed
JK
JK
L IPs
Page 4
MOUCE 2.0
1
LiTH
2013–12–20
Introduction
MOUCE 2.0 (Mobile Operator Utilization Coverage Estimator) is a signal processing software
that was created in the autumn of 2013 by five students at Linköping University. The purpose
of MOUCE 2.0 is to process and analyze LTE signals received by a USRP. With MOUCE 2.0
it is possible to decode broadcasts from LTE cells. These broadcasts contain information about
which mobile operator is operating the cell. The cells are also analyzed, the bandwidth usage
and the SNR of the cell is estimated and a ranking number for the cell is calculated. This ranking
number estimates the data rate (in MBit/second) that a mobile cell phone user can expect from
from the cell. The ranking number can for example help a user to choose a suitable mobile
operator.
MOUCE 2.0 is created using the GNU Radio toolkit. The structure consists of different blocks,
which have specific tasks. Each block is created in C++ and all the blocks are connected to each
other using Python. This document aims at giving an easy introduction on how to setup and use
the MOUCE 2.0 software together with the USRP.
2
Components
The components of MOUCE 2.0 can be split into hardware and software.
2.1
Hardware
The hardware used is a USRP with a receiver daughterboard and antenna connected to a computer with MOUCE 2.0. The daughterboard is able to receive at frequencies between 700 MHz
and 3.8 GHz. The daughterboard is called SBX. The USRP is connected to a computer via
USB. To do processing on live data a fast computer is used. Processing on recorded data can be
done on slower system and without the need of a USRP.
2.2
Software
The software is the main part of MOUCE 2.0. It is implemented to run on any Unix based
system with Python 2.7, GNU Radio 3.7 and UHD driver interface.
3
Hardware Setup
To setup the hardware attach the daughterboard to the USRP and connect the antenna to the
daughterboard. Plug the USRP to a power source and connect it to a computer via USB.
4
Software Installation
To run MOUCE 2.0 a the following dependencies are required.
• GNURadio 3.7
• UHD (USRP Hardware Driver) from Ettus Research
• Python 2.7
• cmake
TSKS05
Jonas Karhu
Signalspanarna
[email protected]
L IPs
Page 5
MOUCE 2.0
LiTH
2013–12–20
• pyplot
• python-wxgtk
Make sure these are installed. GNURadio has a lot of dependencies and among them are Python
and cmake. Check out http://gnuradio.org/redmine/projects/gnuradio/wiki/InstallingGR for installation of GNURadio. Make sure you also install the UHD driver and test that you can use
it without super user priviliges. If UHD is installed correctly running uhd_find_devices
can be used to verify that a connected USRP can be found. When the dependencies are installed
get a copy of the MOUCE 2.0 source code. Start a terminal and go to the folder where the
compressed archive is. Run the following commands (the last command will probably need
super user priviliges).:
tar xvf mouce2.0-1.0.tar.gz
cd mouce2.0/src
mkdir build
cd build
cmake ../gr-mouce/
make
make install
The software is now installed. To run the GUI run the following commands (assuming you
continue from the last command).
cd ../gr-mouce/python/
./MOUCE2.0Gui
5
User Interface
The user interface displays information about what is going on in the different receiver steps.
On the left there is textual information about the current state of interesting decoding steps. The
information is sorted by decoding steps along the data flow in the receiver. Figure 1 shows a
screenshot of the UI. Table 1 explains the displayed data.
5.1
Control of the receiver and UI
To start and stop the receiver processing chain, the receiver has two buttons, namely Start Processing and Stop Processing. The UI can search for base station by scanning through all possible
LTE frequencies. A search is initialized by pressing Search Next frequency, the search will be
started from the last set frequency. If no frequency has been set since the start, it will start from
the lowest possible frequency. If a frequency is entered, it will start the search from the closest
possible frequency. To start from the lowest frequency, enter 0 as frequency. If a frequency is
entered in the frequency text box, it is chosen by pressing enter. The receiver will switch to this
frequency and try to decode it. If a MIB or a SIB is found, the available information will be
saved in the box Found cells. When a value in this box is clicked on, the saved information will
be displayed below. Information about the operator of the cell is displayed only if a SIB has
been decoded. Double clicking a value will make the receiver switch to this frequency.
TSKS05
Jonas Karhu
Signalspanarna
[email protected]
L IPs
Page 6
MOUCE 2.0
LiTH
2013–12–20
Figure 1: Screenshot of the UI
TSKS05
Jonas Karhu
Signalspanarna
[email protected]
L IPs
Page 7
MOUCE 2.0
CP
PSS
SSS
Ch
Est
MIB
SIB
LiTH
2013–12–20
Shows data from the CP synchronization block. This block is responsible for
achieving symbol synchronization and fine frequency offset estimation and correction.
Average symbol offset length shows the error in the estimated symbol length and the
expected length, should be close to zero.
Symbol length standard deviation shows the standard deviation of the symbol length,
this is used to decide if we have got symbol synchronization, should be close to zero.
Fine frequency offset shows the estimated fine carrier frequency offset of the receiver.
Symbols Processed is the number of symbols processed.
Shows data from the PSS synchronization block. This block is responsible for
achieving subframe synchronization and for receiving the cells sector id.
Hits is the percentage of hits of expected PSSs averaged on about the last 100
expected hits.
SNR is a rough estimate of how strong the PSS is in a logarithmic scale.
Integer frequency offset shows the estimated integer carrier frequency offset of the
receiver.
Sector id is the found sector id.
Shows data from the SSS synchronization block. This block is responsible for
achieving radio frame synchronization and for receiving the cells group and cell id.
Hits is the percentage of hits of expected SSSs averaged on about the last 100
expected hits.
Cell Id is the currently found cell id.
Group Id is the currently found group id. This together with sector id from PSS gives
the cell id.
Shows data from the channel estimation block. This block does channel estimation
and SNR estimation.
Bandwidth Usage shows the estimated bandwidth usage.
TX antennas used shows the number of Tx antennas used by the cell.
AntennaX shows the estimated SNR on Tx antenna X.
Shows data from the MIB decoding block. This block decodes MIBs and extract
available information from it.
# MIBs found is the total number of MIBs found.
Bandwidth displays the bandwidth decoded from the last found MIB.
PHICH Ng factor displays the PHICH Ng factor decoded from the last found MIB.
PHICH duration displays the PHICH duration decoded from the last found MIB.
Shows data from the SIB decoding block. This block decodes SIBs and extract
available information from it. The information displayed is from the last successfully
decoded SIB on the current frequency.
MCC shows which country the cell belongs to. 240 means Sweden.
MNC is the mobile operator code in the country.
TAC is the Tracking Area Code of the cell.
Cell Identity is a unique identifier for the current cell.
Operator is a string with the mobile operator, derived from MMC and MNC using a
table.
DCI Info shows data from the DCI which encodes where to find the SIB.
Table 1: Information in the UI.
TSKS05
Jonas Karhu
Signalspanarna
[email protected]
L IPs
Page 8
MOUCE 2.0
LiTH
2013–12–20
The receiver can be used to capture data to be used later. This is done by specifying the option --outfile outFile when starting the UI. Data that is sent through the processing
toolchain will be captured into the file outFile. To run the UI and data processing on a previously recorded file use --infile inFile but replace inFile with the recorded file. If the
flag --no_processing is also present the processing chain will be turned off, this can be
useful to record data on a slow computer where the processing chain can not be run with live
data. The flag -h can be used display all options and usage of them.
TSKS05
Jonas Karhu
Signalspanarna
[email protected]
L IPs
Page 9
MOUCE 2.0
LiTH
2013–12–20
There are also a number of visualizations of the received data. The different buttons are used to
toggle the different plots.
• Bandwidth Usage plots the bandwidth usage over time of the cell.
• Eye Plot plots the signal points of the MIB without the phase correction of the channel
estimation.
• Equalized Eye Plot plots the signal points of the MIB after all channel correction has been
applied.
• Channel Estimation Plot plots the channel estimation. The upper plot shows the absolute
value of the channel estimation. The subcarriers or frequency is on the x axis and the
absolute value on the y axis. The lower plot shows the phase of the estimation with
frequency on the x axis.
The last button Upload Data to Webpage is used to send the saved data to
http://www.signalspanarna.com. When this button is pressed a dialogue appears where the user
can enter the location of the measurement and supply a name for the location. The button
Upload to Webpage can then be used to finally send data to the webpage.
6
Web Page
When a measurement has been uploaded on the webpage, it can immediately be viewed. Open
up a browser and go to http://www.signalspanarna.com and click on Results in the menu.
Figure 2: The startpage
Each MOUCE measurement is represented with a tag on the map at the location of measurement. To view a specific measurement, click on the corresponding tag. The results of the
measurement will be shown in a table, ranking the found operators by the calculated cell capacity. The table also includes the cells SNR, Bandwidth, Bandwidth Utilization, Frequency Band,
Number of transmit antennas and Cell ID. The SNR, Bandwidth, Bandwidth Utilization, Capacity and Number of transmit antennas is also graded in red, yellow or green. This represents
how good these values are with red being the worst and green the best.
TSKS05
Jonas Karhu
Signalspanarna
[email protected]
L IPs
Page 10
MOUCE 2.0
LiTH
2013–12–20
Figure 3: The Results page
TSKS05
Jonas Karhu
Signalspanarna
[email protected]
L IPs
Page 11