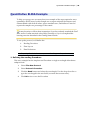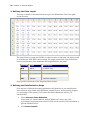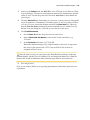
1
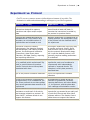
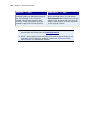
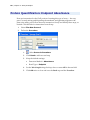
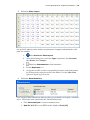
Gen5™ & Gen5 Secure
User's Guide
Microplate Data Collection & Analysis Software
BioTek® Instruments, Inc.
March 2007
© 2006-2007
PN 5321001
Revision C
Chapter 3
Essential Concepts
This section reveals the basic concepts upon which Gen5 was built.
Learning them will enhance your experience using Gen5.
Experiment vs. Protocol ............................................................45
File Storage ............................................................................47
Best Practices .........................................................................48
44 | Chapter 3: Essential Concepts
Essential Concepts
Understanding the basic concepts behind Gen5's structure and behavior will help you
make the most of it. A few topics are covered here, on the next few pages, more
information is provided in Gen5’s Help.
•
Experiment vs. Protocol on page 45
•
File Formats:
Gen5's files are identified by their filename extension:
•
.prt = Protocol file
•
.xpt = Experiment file (contains the protocol and any data acquired or
generated within the experiment)
•
File Storage on page 47
•
Best Practices on page 48
In Gen5, select Help>Help Topics to find:
•
Multiple-Plate Experiments
•
Security and FDA Electronic Records Compliance
Only the Gen5 Secure level of software offers all the capability
required to meet the FDA's electronic records requirements: §21 CFR
Part 11.
Experiment vs. Protocol | 45
Experiment vs. Protocol
Gen5™ uses two common terms to define distinct elements of its toolkit. The
distinction is subtle and understanding it will improve your Gen5 experience.
Protocol
(*.prt)
Experiment
(*.xpt)
A protocol is a "recipe" or set of
instructions designed to capture,
transform and report and/or export
data
An experiment has a copy of the
protocol and at least one plate. It
executes the instructions provided by
the protocol to produce results
Protocols are created and saved as
standalone files. They function as a
template; an unlimited number of
experiments can be based on one
While an experiment is created using an
existing protocol, the experiment’s copy
of the protocol can be modified within
the experiment
A protocol consists of reading
requirements, like detection method
and wavelength, and reading-related
actions, like shaking and incubation
(Procedure), plate layout, data
reduction, and data viewing, reporting
and exporting definitions
Running an experiment is the only way
to process a protocol. Gen5’s Quick
Read function may at first appear to
skip the protocol development stage,
but it uses the default protocol, and
generally requires reading parameters
to be defined
A protocol can be used repeatedly (asis or modified) within experiments. By
itself, a protocol does not produce
results. Protocols do not have plates
associated with them
Multiple plates can be processed in an
experiment; each one considered a
unique assay with independently
reported or exported results. The
exception is multi-plate protocols,
described later
.prt is the protocol's filename extension
.xpt is the experiment's filename
extension
A copy of the protocol is saved within
an experiment, or as a standalone .prt
file. Since protocols do not have plates,
they cannot generate data outside of an
experiment
An experiment is saved as the full
collection of procedures, formulas,
reporting definitions, and other details,
i.e., the protocol, and the plate data
from readings and calculation results
The Gen5™ Secure level of software
maintains an audit trail of all activity
and changes related to a protocol. All
other Gen5™ software levels do not
support this feature
Data acquired and transformed in an
experiment is protected by an audit trail
in both Gen5 Secure and other Gen5
software editions. The Reader Control
edition does not support this feature
46 | Chapter 3: Essential Concepts
Protocol
(*.prt)
Changes made to a standalone protocol
are not reflected in any previously
created experiments based on that
protocol. A new experiment must be
created to apply the revised protocol
Experiment
(*.xpt)
Within an experiment, you can select
Save Protocol As to capture the current
details of the protocol and save them as
either a new protocol or as an overwrite
of the original protocol
All newly created protocols and (unless another protocol is selected)
experiments are based upon the Default Protocol
Gen5™ also supports more complex multi-plate protocols that are not
covered in this introductory material. Check out: Designing a MultiPlate Protocol in a subsequent chapter.
About File Storage | 47
About File Storage
File Types
Gen5™ creates two file types: Protocol = .prt and Experiment = .xpt
•
The Gen5 executable file (.exe) and numerous other types of supporting files,
like an Excel® template, are also installed on the computer.
•
In addition, Clarity™ Microplate Luminometer users will work with Clarity
protocol files, which use a .BPF extension. Gen5 references the Clarity files as
they contain the reading parameters required to control the luminometer.
Databases
Gen5 installs two databases on your system called LocalDB and SharedDB. While the
databases are always used for critical, internally-used files, Gen5 offers you the choice
of using the Windows® File System or the Gen5 (SharedDB) database for storing Gen5's
Protocol (.prt) and Experiment (.xpt) files. This option, combined with the ability to
create multiple databases, allows you to structure file storage according to your
organization's requirements.
•
Files may be stored on the computer’s hard drive, on a network, or on a CD or
other portable medium. Windows Explorer or a similar application can be used
to view the file names and locations, and to move, copy, rename, and delete
files.
•
Alternatively, protocol and experiment files may be stored in a secure, sharedaccess database. This database, initially named SharedDB.mdb, can be stored
on a user’s computer or on a shared-access network/computer (LAN). Gen5
provides a special file maintenance utility for viewing the file names and their
locations, and for moving, copying, renaming, deleting, importing, and
exporting files.
•
Select the preferred method of storing protocol and experiment files at
System>Preferences>File Storage
File Location
During a conventional installation:
•
the program files are stored in this default location: C:\Program
Files\BioTek\Gen5 (software edition)
•
the databases are stored in these default locations:
Windows XP and 2000 systems: C:\Documents and Settings\All
Users\Application Data\BioTek Instruments\Gen5 (software
edition)\(version #)\SharedDB or LocalDB
Windows Vista: Windows XP and 2000 operating systems: C:\Program
Data\BioTek \Gen5 (software edition)\(version #)\SharedDB or LocalDB
•
Gen5 installs Protocol and Experiment folders in the respective File Storage
locations, e.g. C:\Program Files\BioTek\Gen5 (software edition)\Protocol
48 | Chapter 3: Essential Concepts
Best Practices
Like most software tools, Gen5™ is flexible, it offers several ways to accomplish a task.
Here are some recommendations for saving time and using it most efficiently:
Efficiencies
•
For an assay or experiment that you will run numerous times, develop a
Protocol to define the Procedure, Data Reduction, Data Views and Reports
required. Then you can run an Experiment (File>New Experiment) based on
the Protocol whenever necessary. You can fine-tune the protocol within an
experiment, but remember to select File>Save Protocol As to update the
original protocol with your improvements.
•
Just like word processing documents, when you run similar types of
experiments, you can use File>Save As to give you a head start creating a new
protocol based an existing protocol that contains the same plate layout, reading
parameters, or other elements that will be repeated in your new protocol.
•
Define and customize Data Views before selecting what to include in reports or
export files. All the on-screen data (i.e. data views) can be reported or exported.
If you use on-screen views and paper reports equally, it is most efficient to first
fine-tune the Data Views, and then include them in reports/exports.
•
Always assign Blanks to the plate. Blanks can be deionized (DI) water, buffer,
reagent without analyte, substrate and so on. When running fluorescence
cellular assays, a DI-water blank illustrates the background contributed by the
instrument and labware as separate from the cells and media. Identify the
location of the Blanks in the Plate Layout and Gen5 will automatically create
the blank-subtraction data reductions.
•
Backup your database regularly, BioTek recommends once per week for most
organizations. If you're using Gen5's Database for protocol and experiment file
storage, use the built-in Periodic Optimization feature.
•
Take action if you get a warning message about the remaining size of your
databases, see Maintaining Files for instructions on reducing the database size.
•
Consider using Gen5's automatic Save feature to create a new, date-stamped
folder for storing experiment records. This is an especially good practice for
large labs with multiple users who run hundreds of plates per day. Gen5 will
keep all that data organized by date. Define this kind of file management
setting in the Default Protocol so it will apply to all newly created protocols.
•
Turn off the Multi-Read Calculation option to improve Gen5's performance.
Calculation results will be the same, but your PC's resources will not be
diverted for performing interim calculations.
Best Practices | 49
Time Savers
•
Partial Plate: for assays using strips or partially-filled plates, especially if the
read steps are long or complicated, you can save time by telling the reader
exactly which wells or portion of the plate to read
•
Default Protocol: all newly created protocols and Quick Reads are based on the
Default Protocol. If some protocol elements, like plate layout, runtime prompts,
report headers and footers, etc., are largely the same for most of your projects,
you'll save significant time by defining these elements before creating the next
protocol/experiment
•
Print Preview: save time and paper by viewing reports on-screen before
sending them to the printer
50 | Chapter 3: Essential Concepts
Chapter 4
Assay Examples
This section contains step-by-step instructions for programming
commonly known assays using Gen5. Gen5 also ships with Sample
Protocols for most of these assays. Both the Sample Protocols and
the assay descriptions are learning tools. It is your responsibility to
customize and validate them to meet your needs.
Sample Protocols and Experiments .............................................52
How do I set up my assay? .......................................................54
52 | Chapter 4: Assay Examples
Sample Protocols and Experiments
Numerous sample protocols are shipped with Gen5. You can use the protocols to learn
more about Gen5 and as a timesaver, customizing them to meet your needs and then
running them in an experiment to obtain results.
Recommendation: Before making any modifications to the sample
protocols, we recommend selecting File>Save As after opening them
and assigning a unique name to the protocol. This will preserve the
original sample protocol for future use.
A matching experiment file is also shipped with Gen5 for use as a learning tool. Many
of the experiment files contain actual data so you can see how Gen5 presents the
results on-screen and in reports.
Find the sample protocols and experiments shipped with Gen5 in the default file
storage locations. A folder for each detection method is available: Absorbance,
Fluorescence, Luminescence and for Synergy 2 users, there is a Synergy 2 folder within
each detection method folder:
•
Gen5 Secure (and database users): Select File>Open Protocol, in the DB
directory select the Samples folder.
•
All other levels of Gen5: Select File>Open Protocol and browse to C:/Program
Files/BioTek/Gen5/Samples
•
Gen5’s Welcome screen also offers the option to open a Sample File
Important: The sample protocols must be considered as examples
provided for demonstration and guidance purposes. If you plan to use
these protocols or similar ones in a real application, it is your
responsibility to validate the protocol parameters, including the report
and export content (if applicable), before using them.
Notes: Your system administrator can change the path and filenames
described above. If you cannot find the Samples folder, contact your
system administrator. Also note, your reader may not support all of
the sample protocols provided. Review the descriptions in the Samples
Protocol Listing to see if your reader is compatible with the defined
steps.
Sample Protocols and Experiments Guide
You can review a complete description of samples in the Sample Protocols and
Experiments Guide.PDF shipped with Gen5: click the Windows® Start, select All
Programs>Gen5>Sample Protocols and Experiments Guide
Gen5 installs a copy of the Sample Protocols and Experiments Guide in
the Samples folder of the main Gen5 directory. (By default this is
C:\Program Files\BioTek\Gen5\Samples)
Sample Protocols and Experiments | 53
You can also find a summary listing and brief description of the sample protocols in Gen5’s
Help. Review the description of the sample protocol to make sure it is compatible with your
reader.
54 | Chapter 4: Assay Examples
How do I set up my assay?
Here are step-by-step instructions for creating Gen5 Protocols to run common assays.
(More Assay Examples can be found in Gen5’s Help.) We hope that by following the
instructions, making some changes to names and other details, you can adapt them for
use in your lab. Also see the Kinetic Analysis chapter.
Absorbance
•
Quantitative ELISA Example on page 55
•
Subtracting Blank Plate Reads on page 58
•
Pathlength Correction Example on page 60
•
Dual Wavelength Absorbance Endpoint on page 62
•
Basic Spectrum Analysis on page 64
•
Protein Quantification Assay on page 66
•
Max Binding Determination on page 83
•
Toxicity/Cytotoxicity Assay on page 86
•
Endotoxin Test on page 89
•
ß-Galactosidase Kinetic Assay on page 92
Fluorescence
•
Basic Fluorescence Assay on page 69
•
Kinetic Fluorescence Assay on page 71
•
Fluorescence Assay with Injection on page 74
•
Fluorescence Area Scan Example on page 77
•
Fluorescence Polarization on page 79
Luminescence
•
Basic Luminescence Glow Assay on page 81
•
Luminescence Flash Assay with Injection on page 82
Dispensing Reagent
•
Dispensing Reagent in a Kinetic Analysis on page 94
•
Dispensing Reagent in an Endpoint Analysis on page 95
Quantitative ELISA Example | 55
Quantitative ELISA Example
To help you set up your own assay here is an example of the steps required to run a
quantitative ELISA assay. In this example we set up an endpoint Absorbance read,
subtract Blank wells from all others, plot a standard curve, and define a Control to
express the samples as a percentage of the control.
It may be easier to follow these instructions if you have already watched the Gen5
Basic series of online tutorials: select Help>Tutorials or if you've completed the
learning exercises described in the Getting Started Guide.
To set up the protocol, we'll define the:
1.
Reading Procedure
2.
Plate Layout
3.
Data Reductions0.
Reporting Results is the same process for all types of experiments
1. Defining the reading Procedure
This assay example has the simplest read Procedure: a single-wavelength Absorbance
endpoint read:
1.
Select File>New Protocol
2.
Select Protocol>Procedure
3.
Click the Read button and select the wavelength. Use the drop-down list or
type the wavelength in the text field (overwrite the current value).
4.
Click OK twice to save the Procedure0.
56 | Chapter 4: Assay Examples
2. Defining the Plate Layout
This step is critical for the data reduction steps to be defined later. Here's the plate
layout we need:
The critical factor is using the Well IDs, not their location on the plate. We did not need
to customize the Well IDs for this example. We simply selected the Type, defined the
known concentration of the standards and assigned them to the plate:
Well ID
Type
Description
BLK
Blank
DI water only
STD
Standard
Known concentrations
CTL1
Assay Control
Known Control
SPL
Sample
Unknown samples
Find specific instructions in the Preparing Plates chapter.
3. Defining the Data Reduction Steps
Now that we've defined the reading parameters and plate layout, we can define the
data reduction steps: blank-well subtraction, standard curve, and expressing samples
as a percentage of the control. Gen5 creates the blank-subtraction step for you
automatically.
1.
Select Protocol> Data Reduction
Notice that one Transformation, named "Blank nnn" where nnn is the
wavelength, has already been created. We'll use the results of this calculation to
plot the standard curve.
2.
Click Curve Analysis
Quantitative ELISA Example | 57
3.
Notice on the Data In tab, the Well ID is set to STD and X Axis Data to <Plate
Layout Settings>. The known concentrations entered for Standards are plotted
on the X Axis. Use the drop-down list for the Y Axis Data to select Blank nnn
(wavelength)
4.
Click the Curve Fit tab: depending on your assay, you may want to change the
curve fit method to 4 Parameters or another option, or use Log values on the X
or Y axis. For now, retain the defaults and click the Data Out tab. Take note
that the Data Set Name produced from the standard curve is called Conc (by
default. You can change it.). Click OK to save and close the curve.
5.
Click Transformation
1.
For the Data In use the drop-down list to select Conc.
2.
Enter a New Data Set Name for the results of this calculation, e.g.
%Control
3.
In the Formula field enter: (X/CTL1)*100
Retain the default setting to Use single formula for all wells. X represents
the value of the current well. CTL1 is the well ID for the control we
assigned in Plate Layout.
After the plate is read, you can return to the Data Reduction dialog to make any
needed changes, like the Curve Fit Method. Do not change the Data Out or Data Set
Names, this would invalidate the data reduction steps that use those data sets.
6.
Save the protocol.0.
Now you're ready to define your reporting requirements, and run the protocol in an
experiment.
58 | Chapter 4: Assay Examples
Subtracting Blank Plate Reads
To perform a blank-plate subtraction in your experiment, set up an additional Read
Step for the blank plate, and then, create a Data Reduction Transformation to subtract
the measurements of the blank plate from the samples plate.
You can insert a Plate in/Out step in the Procedure sequence to first read the blank
plate, pause the experiment to pipette samples to the plate, and then, read the samples
plate.
Step-by-step procedure:
1.
Select File>New Protocol
2.
Double click Procedures to set the reading parameters:
1
First, create a Read Step for the blank plate: enter Blank for the Step
Label to easily identify the raw data.
2
Add a Plate In/Out step to eject the plate to pipette samples, standards,
etc. Optionally, enter "Load Samples" in the comment field.
3
Finally, create a Read Step for the samples plate. 0
Other steps can be included in the sequence, like Set Temperature and
Shake, if required.
3.
Set up the Plate Layout to match the distribution of samples and standards or
controls.
4.
Double click Data Reduction to define a transformation: Blank Plate Data
Reduction
1
The dialog will contain any automatically generated data reductions.
Highlight the top-most one and click Transformation, to position the
blank subtraction as the first calculation.
2
Click
3
In the Multiple Data Sets screen, use the drop-down lists to select the
Blank plate read data for DS1 and the samples plate data for DS2.
In multiple wavelength protocols there may be several data sets to
choose from. If you've used the Step Labels for each Read Step, it's
easy to match up the blank plate with the samples plate.
Subtracting Blank Plate Reads | 59
5.
4
Enter a New Data Set Name for the resulting data set, e.g. Blanked 390
5
Enter DS2-DS1 in the Plate Formula field and click OK.
6
Repeat steps 2-4 to create as many blank-plate subtraction
Transformations as needed, e.g. one per wavelength.
7
Now you're ready to create other Data Reduction steps using the
blanked data sets. For example, select Curve Analysis to generate a
standard curve based on the blank-subtracted test plate.0
Customize the Data Views and fine-tune the Report Builder as needed before
saving and closing this protocol. File>Save0.
Now you're ready to run the protocol in an experiment: File> New
Experiment
Running the experiment:
After reading the blank plate, Gen5 ejects the carrier so you can load the samples
If you entered a comment, e.g. Load Samples in the Plate
In/Out step, it is displayed on screen. Here's how to proceed:
•
Click OK after loading the samples, when you're ready to continue reading the
plate
60 | Chapter 4: Assay Examples
Pathlength Correction Example
Here is an example of the steps required to perform pathlength correction in an ELISA
assay. In this example we set up an endpoint Absorbance read, subtract Blank wells
from all others, and transform the data to determine the concentrations of the
unknown samples. This is the process used to create the Direct Oligo Quantification
assay shipped as a sample protocol with Gen5.
It may be easier to follow these instructions if you have already watched the Gen5
Basic series of online tutorials: select Help>Tutorials or if you've completed the
learning exercises described in the Getting Started Guide.
To set up this protocol, we'll define the:
1.
Reading Procedure
2.
Plate Layout
3.
Data Reductions0.
Reporting Results is the same process for all types of experiments
1. Defining the reading Procedure
This assay example has the simplest read Procedure: a single-wavelength Absorbance
endpoint read:
1.
Select File>New Protocol
2.
Select Protocol>Procedure
3.
Click the Read button and keep the default settings for Detection Method,
Read Type and Read Speed
4.
Fill in the checkbox next to Pathlength Correction. [Optionally, click the 3dot button to view (and modify if desired) the test and reference wavelengths
used in the process.]
5.
Set the Wavelength. Use the drop-down list or type the wavelength in the text
field (overwrite the current value). For this example, enter 260.
6.
Click OK twice to save the Read step and the Procedure0.
2. Defining the Plate Layout
For this assay example, the plate layout is very simple, comprising two blank wells and
94 unknown samples:
1.
Select Protocol> Plate Layout
Pathlength Correction Example | 61
2.
In the Well Settings box, select the Type of specimen, first Blanks, then
Samples
3.
Assign the blanks to cells A1 and B1
4.
Change the Type to Sample, make sure Next ID is enabled, click and drag over
the remaining wells to assign the unknown samples0.
3. Defining the Data Reduction Steps
After defining the reading parameters and plate layout, we can define the data
reduction steps. Gen5 creates the blank subtraction and the pathlength correction for
you automatically.
1.
Select Protocol> Data Reduction
Notice the two Transformations, "Blank 260" and "Corrected [Blank 260]", Gen5
first subtracts the blanks and then applies the Pathlength Correction
Calculation.
2.
Click Transformation to add anther Data Reduction step
3.
For the Data In use the drop-down list to select Corrected [Blank 260] data set
4.
Enter a New Data Set Name for the results of this calculation, e.g.
Concentration
5.
In the Plate Formula field enter: X*32.5
Retain the default setting to Use single formula for all wells. X represents the
value of the current well. The extinction coefficient for ssDNA oligonucleotides
(1 mg/ml) at 260 nm is 13 ODs for a 1 cm pathlength; this can be recalculated to
mean 1.0 OD has a concentration of 32.5 µg/ml.
6.
Save the protocol.0.
Now you're ready to define your reporting requirements, and run the protocol in an
experiment.
62 | Chapter 4: Assay Examples
Dual Wavelength Absorbance Endpoint
Here are step-by-step instructions for setting up a dual-wavelength absorbance read with
known concentrations of standards against which a linear regression curve is plotted.
Create the protocol:
1.
Select File>New Protocol
Double-click Procedure in the menu tree:
2.
3.
4.
•
Click Read to set the reading parameters: Keep the default settings for
Detection Method and Read Type: Absorbance Endpoint
•
For Wavelengths, click the button for 2 and use the drop-down list to
select (or enter) the test and reference wavelengths: 410 and 630 for this
example.
•
Click OK twice to close the Read Step, and then, the Procedure dialogs.
Double-click Plate Layout to define the location of standards, samples,
and blanks on the microplate. For this example, the standards are placed in the
center of the plate, modify the instructions to match the distribution of samples
and standards on your plate:
•
Set the Well Settings Type to Standard and click the 3-dot button next to the
Conc. field to enter the expected concentrations. For this example, leave 0 in
the STD1 cell at the top of the table. Select Incr. with a tick mark, and enter
10 in the field, then click in the STD1 cell, then in the STD2 cell, and each
subsequent cell in the table until STD8. Click OK to save and close the
concentrations.
•
At the grid, set the Number of Replicates to 2, and select Next Conc. under
Auto Select. Click and hold as you roll the mouse over the 5 and 6 columns,
(the cursor changes to a black, down-facing arrow) to fill the entire
columns.
•
Set the Well Settings Type to Blank, keep the Number of Replicates at 2,
and click and drag over wells A1 and A2.
•
Set the Well Settings Type to Sample, keep the Number of Replicates at 2,
and select Next ID under Auto Select. Click and drag the cursor over the
remaining wells in columns 1 and 2, and then 3-4, and then 7-12, to assign
samples to all the other wells of the plate.
Double-click Data Reduction
Gen5 automatically creates the Blank-Subtraction transformations.
•
5.
Click Transformation to set up the calculation:
Click
Dual Wavelength Absorbance Endpoint | 63
6.
For DS1 (selected by default) use the drop-down list to select Blank 410
Select DS2 and use the drop-down list to select Blank 630
7.
8.
Click OK to close the Multiple Data Set dialog
9.
For this example, we'll call the New Data Set Name: Dual Wavelength. Enter
the name in the text box. Dual wavelength is also known as Delta OD, you may
want to use this name instead .
10. In the Plate Formula field enter: DS1-DS2 to subtract the reference
wavelength (630) measurements from the test (410) measurements. Retain the
default: Use single formula for entire plate.
11. Click OK to save and close the Transformation
•
Click Curve Analysis. In the Data In tab, use the drop-down list to select Y
Data: Dual Wavelength and click OK.
For this simple protocol, the remaining default settings are acceptable.
More options are available, like customizing the names of data sets,
plotting interpolations in the generated curve, and so on. See Plotting
a Curve in the Data Reduction Options chapter.
•
12.
Click OK to close the Data Reduction dialog.
Set the Report parameters and Data Views as desired. For instructions, see
Viewing Results.
13. Save the protocol: select File>Save and name it DualWave1 for this example.
0.
Run the protocol:
Now, you're ready to run the DualWave1 protocol in an experiment.
1.
Select File>New Experiment. By default, Gen5 highlights the DualWave1
protocol in the dialog, making selection quick and easy.
2.
If the reader is all set up, you're ready to go: Click Read and follow the online
prompts.
64 | Chapter 4: Assay Examples
Basic Spectrum Analysis
Numerous applications can profit by a preliminary spectral screening. Here are
instructions for setting up a basic spectrum protocol in Gen5.
It may be easier to follow these instructions if you have already watched the Gen5
Basic series of online tutorials: select Help>Tutorials, or if you've completed the
learning exercises described in the Getting Started Guide.
1. Defining the reading Procedure
This assay example uses a kinetic read for analysis.
1.
Select File>New Protocol
2.
Open the Procedure (double click Procedure in the menu tree)
3.
Click Read and change the Read Type to Spectrum
4.
Set the Wavelength range: for this exercise set Start to 200 and Stop to 550
5.
Set the Step to 3, and close the Read step
6.
Click OK to save and close it.0.
2. Defining the Plate Layout
Define the plate layout in the usual way to reflect the arrangement of unknown
samples, standards and blanks on the microplate.
3. Defining the Data Reduction Steps
Now that you've defined the reading parameters and plate layout, you can define the
data reduction steps:
1.
Select Protocol> Data Reduction
Gen5 automatically sets up the a Well Analysis for Min/Max OD. If Blanks
have been assigned to the plate, it will be preceded by and based on a blanksubtraction Transformation step.
2.
Click Well Analysis to add another step
3.
Enter a unique name for this step in the Label field
4.
Select one of the offered Calculation Types: Integral or Formula
5.
Click OK to save and close the step
6.
Click OK to save and close Data Reduction0.
Basic Spectrum Analysis | 65
4. Save the Protocol
1.
2.
Define the Reporting Requirements using the Report Builder or export options
Save the protocol0.
Now you can run it in an experiment: select File>New Experiment
5. Viewing the Results
After you read the plate, you can take advantage of Gen5's Well Zoom to examine the
results. This feature is described in the Kinetic Analysis chapter.
66 | Chapter 4: Assay Examples
Protein Quantification: Endpoint Absorbance
Here are instructions for the Gen5 portion of running this type of assay — the easy
part. Correctly mixing and dispensing the standards, and pipetting reagents to the
plate is the tricky part. Follow the assay instructions closely and modify these steps, as
needed. Click the links for instructions at each step.
1.
Select File>New Protocol
2.
Define the Procedure
Select Protocol>Procedure
1.
2.
Click Read to add one read step
3.
Keep the default settings:
•
Detection Method = Absorbance
•
Read Type = Endpoint
4.
Set the Wavelength using the drop-down or enter 650 in the nm field
5.
Click OK twice to close and save the Read step and the Procedure0
Protein Quantification: Endpoint Absorbance | 67
3.
Define the Plate Layout
Set up Gen5's plate layout to match your placement of samples and standards on the
plate, for example:
1.
2.
3.
4.
Select Protocol> Plate Layout
In the Well Settings box, select the Type of specimen, first Standards,
then Blanks, then Samples
Define the Concentration of the Standards:
4.
Set the Replicates to 4
5.
Assign the well IDs to their corresponding locations in the plate matrix
by clicking in the respective wells in the matrix. Use the Auto Select
options to speed up your work. 0
Define the Data Reduction:
Gen5 creates a Blank Subtraction data set when you put blanks on the plate, as defined
above. Click in the white space below the Transformation step:
•
Click Curve Analysis to create a standard curve:
•
Data In: Well ID is set to STD. Set the Y Axis = Blank [650]
68 | Chapter 4: Assay Examples
•
5.
Curve Fit: Method is set to Linear Regression
Define the Reporting Requirements 0.
Save the Protocol
Select File> Save when you're finished setting up the protocol. You'll be able to use
this protocol repeatedly to run this assay in an experiment.
Select File> New Experiment and select the protocol when you're ready to run it, i.e.
reagents are reconstituted, the plate is prepared, etc.