1
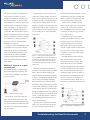
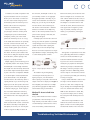
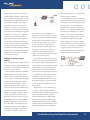
Tr o u b l e s h o o t i n g S w i t c h e d
Environments
Some of the issues that should be consid-
Ten years ago, the network was rela-
ered in a switched environment are:
• How busy is each port?
tively simple. There were hubs, bridges
and routers. Each was a discrete box,
readily identifiable from the others.
Troubleshooting was also simple. If you
were attached to a hub, then the rules
for troubleshooting a collision domain
applied. At the point where the collision domain attached to a bridge, all
errors stopped. Troubleshooting using a
• How do you identify and track the source
of errors?
• What is the source of a broadcast storm?
• Are bridge forwarding tables operating
correctly?
• Which stations are attached to this port?
• Is the switch rate-limiting any protocols
or ports?
• Is this port in a VLAN? And, if so, is it
the same VLAN as the server or service?
How do you determine where to start
looking for a reported problem in a switched
The entire switch tends to be part of a
network? The troubleshooting difficulty orig-
single broadcast domain, including any num-
protocol analyzer was the best avail-
inates from a basic inability to “see” inside
ber of other switches connected in series or
able option, and it was very effective
it. This problem begins with the OSI Layer 2
in parallel. If OSI Layer 3 features are
bridging performed by a switch, and is exac-
enabled, then multiple broadcast domains
once the user knew the basics of the
erbated by enabling VLANs and other OSI
are created, equal to the number of VLANs.
network and the protocols in use.
Layer 3 and higher features and forwarding
At the extreme, and if the switch features
rules. Advanced switching features such as
permit it, each port could be configured to
OSI Layer 4 and higher forwarding and
be a separate broadcast domain. This config-
load balancing require a strong knowledge
uration could reasonably be described as
of the switch configuration options to
routed to the desktop. By creating a sepa-
troubleshoot.
rate broadcast domain for each port, trou-
Then switches appeared on the
scene.
The problems found in a switched
environment are generally the same as
those experienced in a shared media
environment. What happened, who did
it, and how much? The primary difference is that answers need to relate
back to a specific port.
By installing a switch, you tend to create
bleshooting options are limited severely. A
a collision domain on each half duplex port
separate broadcast domain per port will also
– that is simply the nature of a switch. If
need a routing service in the switch typical-
shared media hubs are attached to the port,
ly requiring considerable CPU resources in
then the collision domain may grow to the
forwarding traffic. The network situation
maximum size allowed for that Ethernet
where it is appropriate to require routing on
implementation. Due to the falling price of
every single request and reply is very diffi-
switching technology, most new networks
cult to imagine, and this configuration
have a single station per port. So, in the
should be avoided. Unfortunately, a less
case of half duplex connections, the colli-
obvious form of this configuration is all too
sion domain is only a single cable link.
Vision into Switched Networks
White Paper
common, and is found in networks where the
servers are all located within one subnet or
OptiView™ Network Analysis Solutions
broadcast domain, and all users are in some
have powerful troubleshooting capabili-
number of other subnets or broadcast
ties to put you back in control of your
domains. Virtually all requests must still be
switched network.
routed. If maintenance activities must be
Plug into the network with an OptiView
limited to a single server room, then consider placing servers in separate VLANs. Then
place the users that depend upon that server in the same VLAN. This configuration
would allow the switch matrix to use OSI
Layer 2 bridging for routine traffic, and only
unusual or infrequent requests would be
routed. If the server supports more than one
user community, install additional network
adapters in the server to maintain OSI Layer
2 connectivity to the users.
Integrated (portable) or Workgroup
Figure 1 – A very basic switch scenario.
For simplicity, the troubleshooting model
will be a server attached to a switch, as
shown in Figure 1. Some descriptions will
assume the user(s) in question are attached
to the same switch, other descriptions will
assume the user(s) in question are accessing
the server through the uplink to either
another switch or to a router. The troubleshooting scenario will start with a simple
Analyzer and you’ll have instant vision into
your switches. Trace SwitchRoute shows
you the exact path two devices use to communicate through your switched network.
No more hidden problems.
You’ll also see:
• Switch port utilization, errors and
configuration
• Hosts connected by port
• VLANs on the switch with port
membership
Five techniques for
troubleshooting a switch
report that communications with the server
There are five fundamental approaches used
almost nothing.
to gain visibility into a switch. Each of
Method 1: Access the switch
console via TELNET or the
serial port
full duplex, switched Gigabit Ethernet links
Senior network support staff or others with
working with in-line taps. OptiView
the password to the switch may choose to
Protocol Expert software uses extensive
review the configuration of the switch dur-
seven-layer decodes to make it easy to
ing the troubleshooting process. The switch
identify and solve tough problems on
configuration is available by logging in
switched segments. OptiView Console's
through a TELNET session, or by attaching to
SwitchTap port mirroring feature allows you
the serial port of the switch and logging in.
to easily and safely configure mirror ports.
(Figure 2)
It will even guide you to the best port to
these techniques offers a different view, and
has both positive and negative aspects. Like
many other situations related to networking,
there is no single best answer. The most
suitable solution will be controlled primarily
by the availability of resources (which tools
are available and/or pre-installed), and by
the potential service interruption that will
be created by using that technique.
Even combined, these techniques are not
are “slow.” This report tells the support staff
• Trunk ports and trunking protocol
• Multiport stats show you traffic levels
across switch ports at a glance.
able to monitor the attached network as
OptiView Link Analyzers provide real-time
analysis and line rate packet capture for
use with a Fluke Networks tool attached.
well as when hubs – instead of switches –
You can then import the mirrored data into
were common. It is nearly impossible to see
the OptiView Console database, trend it,
all of the traffic flowing through a switch.
analyze it, map it, and report on it.
Most troubleshooting assumes the traffic will
pass between the station and an attached
Visit www.flukenetworks.com/optiview
server or through the uplink. If two stations
were passing information directly between
Figure 2 – Using the RS-232 console port.
and check out the OptiView Network
Analysis Solutions.
themselves, the traffic would not pass
through the uplink or to any other port on
the switch. Unless you knew to look for it, it
probably would not be detected.
Troubleshooting Switched Environments
2
The switch configuration is available from
Unfortunately, the switch (which we are
interrogating the broadcast domain is useful
either of these console access options,
viewing as a multiport bridge) will only for-
for network discovery and for finding other
though the configuration information will
ward a very tiny amount of the traffic to the
classes of problem, but will not aid a slow
not reveal misbehavior on the part of the
monitored port. This is appropriate behavior
user connection problem significantly.
switch. Whether the operating system of the
on the part of a bridging device, since it’s
switch has bugs, or whether the configura-
designed to prevent unnecessary traffic from
switches, allows traffic from a selected port
tion is incomplete, is not likely to be evi-
reaching ports where it does not belong. The
or ports to be copied to the monitoring
dent from the configuration listing. This
protocol analyzer has not requested any traf-
port. (See Figure 5) This technique is usual-
configuration data will instead be useful in
fic, and usually has not even transmitted a
ly referred to as port aliasing, port mirror-
guiding troubleshooting efforts to see if the
single frame.
ing, or port spanning.
A better option, available from most
The ability to copy or mirror traffic is
switch is operating as expected. To validate
the configuration, it will be necessary to
provided by most switch vendors to allow
utilize one or more of the other switch
a monitoring tool to be connected to a
troubleshooting methods.
configured monitor port on the switch.
Older switches had a specific port that
A variety of runtime troubleshooting aides
are available from some switches, though
could be configured as this special monitor-
the feature set for these troubleshooting
ing port, but most newer switches can be
aides is quite different depending on the
configured to use any port as the output
vendor and switch model. Considerable
experience and theoretical knowledge is
required to obtain benefit from several of
these features.
Method 2: Connect to a spare
(unused) port
The simplest approach to troubleshooting,
this involves attaching a monitoring tool
such as a protocol analyzer to any unused
port on the switch.
Figure 4 – Switches forward traffic between the
source and destination port. Very little traffic goes
to other ports. The monitoring tool will see a few
frames per minute instead of the thousands per
second that may be passing between the stations
and the server
port for monitoring.
The implementation of this technique
varies between vendors, but there are
several common mirroring options. Note
that in almost all cases, the forwarding
technique employed by the switch will also
The traffic forwarded to the monitored
be used to filter data sent to the monitor
port will consist almost entirely of broadcast
port. This means almost all errors are fil-
traffic, with a few frames resulting from
tered by the switch, and do not appear on
unknown destinations appearing sporadical-
the monitor port. For troubleshooting pur-
ly. These occasional frames are probably the
poses, port mirroring can sometimes be
result of aging of the bridge forwarding
quite ineffective because a whole class of
table, and not often from truly unknown
problems is concealed by the switch in this
destinations. Many unwary technicians have
way.
seen the traffic distribution (nearly 100 percent broadcasts) and not noticed the exceptionally low utilization level. This results in
Figure 3 – Monitor from any open port.
the incorrect diagnosis of a broadcast storm
present, or that their network is experienc-
Connecting to a spare switch port then
allows the monitoring tool access to the
attached broadcast domain without disrupting service anywhere. The attached tool has
the same access to the broadcast domain as
ing unbelievably high broadcast rates as a
part of normal operation.
Since this view of the network is all but
useless, it is necessary for the monitoring
tool to solicit traffic. Soliciting traffic or
Figure 5 – Logical effect of configuring a mirror
port.
any other station.
Troubleshooting Switched Environments
3
In addition, the actual configuration must
the same time, the RX path is able to sup-
between the switch port and the file server
be performed either from the console (the
port 100 Mbps of traffic for an aggregate
allows an analyzer to be connected to the
RS-232 port on the switch) or a Telnet ses-
throughput potential of 200 Mbps. If you
same collision domain as the file server, as
sion. This often involves bringing a PC or
seek to mirror that traffic to another 100
shown in Figure 7. This technique enables
terminal along with the monitoring tool so
Mbps port, you can only use the TX path
the analyzer to see all the traffic to and
that the switch can be reconfigured as
from the switch to the monitoring tool.
from the file server, which assists the net-
required for troubleshooting.
The amount of mirrored traffic is therefore
work support staff in diagnosing a wide
limited to a maximum of 100 Mbps. Any
range of problems, including user login
port, though a number of vendors permit
traffic on the switch port that exceeds 50
failures, poor performance, and dropped
configuring the port to be bidirectional.
percent of the capacity of that link (200
connections.
Configuring a mirror port on the switch
Mbps) will be dropped.
The mirror port is often a listen-only
permits the monitoring tool to see a copy
If multiple ports are mirrored to the mon-
of the actual traffic between our reportedly
itoring port, then this problem is potentially
slow user connection and the server. The
correspondingly worse. Since most switches
mirrored port could be any other port on the
operate at far below their capacity, the
switch, including uplink ports. The mirror
problem may not be noticed right away.
could also be several or all other ports on
Most user connections experience low single-
the switch. The more ports included in the
digit utilization averages. Infrequently, there
mirror, the less likely the output will include
is a short but large burst of traffic.
Figure 7 – Using a hub to monitor a switched port.
This approach is impractical in most situations, particularly where there are multiple
all of the traffic, and the capacity of the
servers to be monitored. Where do you
output port is rapidly exceeded.
locate the hub? On all shared resources?
If you choose to move a hub around as
Output capacity on the monitoring port is
an important problem. The output port has a
needed, are you prepared to interrupt the
TX and RX path. It was already noted that
network long enough to install the hub?
the TX path from the monitoring device back
to the switch may be blocked by the switch
Figure 6 – Output capacity is limited on a mirror
port.
This delay is often long enough to cause
dropped connections. Additionally, shared
as part of the mirror configuration. Whether
The situation may be mitigated by
resources may be connected via a technolo-
or not the TX path is blocked (whether the
connecting the monitoring device to a
gy or connection speed that your monitoring
port is bidirectional or not) the RX path
higher speed port, one which has the
tool may not support.
from the switch to the monitoring device is
native capacity to accept all of the mirrored
capacity limited. If you are mirroring a full
output. If the mirror output port in Figure 6
tive way to monitor all traffic and errors
duplex port of the same speed as the mirror
were a Gigabit port instead of a 100 Mbps
present on a link. This is nearly the only
output port, the switch may easily drop traf-
port, then the aggregate 200 Mbps traffic
way to actually see and analyze MAC Layer
fic without notifying you. In this regard, it
load would be easily accommodated.
errors in a switched environment. Using
does not matter whether the monitoring
device is connected at half or full duplex;
the inherent limit to the output path is the
same.
Assume you are seeking to monitor the
traffic associated with a server connected to
the switch at 100 Mbps in full duplex. At
full duplex, the server’s port – the TX path –
Method 3: Insert a hub into
the link
Using a shared media hub involves a strategic placement of the monitoring tool. In
many networks, most traffic will be received
or transmitted by a shared resource such as
a file server. Adding a shared-media hub
Using a shared media hub is still an effec-
SNMP to learn about them is useful. But,
for good error analysis, there is nothing
like seeing them with the diagnostic tool
directly.
There are two major drawbacks to this
method. The server link cannot be a full
duplex connection or the resulting duplex
mismatch will introduce more errors than
is able to support 100 Mbps of traffic. At
Troubleshooting Switched Environments
4
you are likely to reveal. Also, to diagnose
path will be offered on one connection and
problems with this method, a shared media
the receive path on another.
hub is necessary. Many newer hubs are actu-
To simultaneously monitor a request and
ally bridging devices masquerading as hubs.
response passing through the tapped link, it
If you insert a hub that is not a shared
is necessary to have a monitoring tool with
media device, then you will not see the
traffic you are looking for. It would be the
equivalent of inserting another switch in the
link, and would not benefit you at all. Dual
speed hubs – such as 10/100 – may offer a
collision domain at each speed, with a
bridge between speeds. In this situation,
you can use the dual speed hub as long as
you are certain the monitored link is operating at the same speed as the diagnostic
tool. Other hubs offer full bridging between
all ports, and are therefore actually misleadingly labeled low-cost switches. They will
not work for this method.
two input ports. Tools with dual inputs
Figure 8 – Use of a tap or splitter
fiber link. Some transmitters are more robust
than others, so even if installation of a
splitter at one end causes the link to fail, it
may still be possible to install the splitter at
the other end of the link without causing it
to fail. Fiber optic splitters do not require
power, as the split is accomplished by
splicing fiber optic strands together very
precisely. Since the splice is created in
alignment with the inbound signal, it is
vital to ensure the splitter input and output
lems, as some of the signal is needed by the
This is somewhat similar to adding a shared
tap in order to read the passing traffic. For
media hub, except the tapped link may only
copper cables, this is the equivalent of addi-
be used for receiving and does not allow the
tional attenuation, and also may cause the
monitoring tool to transmit.
tapped link to fail during the installation
for analysis. The alternative is to examine
traffic in one direction at a time, which is
more difficult to analyze. There is no operational difference when monitoring half
duplex or full duplex, and a tap is equally
effective with either. You have the choice of
monitoring a single direction separately with
a typical single-input monitoring tool, or
monitoring both directions simultaneously
with a dual-input monitoring tool.
Copper taps cause similar signal loss prob-
Figure 9 – Functional diagram of tap operation
process if the link being tapped is very long
interchangeable, though splitter usually
or is already facing cable problems. Copper
applies to fiber optic links. On a fiber optic
taps require power, as the signal is recov-
link, the splitter is rated by how much light
ered and retransmitted to the monitor port.
is taken from the primary path and redi-
If properly designed, a copper tap will not
rected to the monitoring path. Typical
drop or disrupt the tapped link if power is
splitter ratings include 80:20, 70:30, or
lost to the tap.
even 50:50. Using the first example, 80 per-
direction, or to integrate both data streams
cables are connected correctly.
Method 4: Using a tap or
splitter
The terms tap and splitter are potentially
typically have the ability to separate each
Tapping the line is an excellent way to
cent of the light continues through the
see what is passing through a link. Once
splitter to its original destination, and 20
installed, the tap is invisible to the attached
percent of the light is redirected to the
devices and may be utilized at any time
monitoring connection. This loss of power
without further disruption. Unfortunately,
clearly implies that if a link is already suf-
the link must be broken to insert the tap.
fering from cable faults or excessive dis-
Furthermore, the nature of a tap or splitter
tance, the splitter could easily cause the
is that it will offer the data passing in each
link to fail by taking too much light from
direction separately. That is, the transmit
the primary transmit path. A splitter can
easily cause a 3 dB loss in power over a
Troubleshooting Switched Environments
5
Method 5: Query the switch
using SNMP
unrestricted, then potentially anyone
Almost the only effective method of
on your network or modifying your switch
troubleshooting a switched network is to
configurations. SNMP is usually enabled with
ask the switch itself how the network is
a very common password when the switch is
behaving. This is done with SNMP or by
sold. SNMP passwords are called community
connecting to the console port of the
switch. Obviously, directing queries through
anywhere could be monitoring activity
Figure 10 – Using SNMP to monitor a switch.
Because switches do not routinely forward
the console port is not desirable because
errors, using SNMP is perhaps the best
you would have to physically touch every
method of locating ports experiencing them.
switch in the network. It is possible to
The switch may not forward the error, but it
minimize the impact of this alternative by
is certainly aware of the presence of errors.
setting up terminal servers that connect to
There are a variety of MIBs available from
the console ports. SNMP is a better choice
most switches that support SNMP. Each MIB
most of the time because it allows you to
supported brings the console a slightly dif-
make queries in-band from anywhere on the
ferent or more detailed view of network con-
attached network, and it does that without
ditions around the switch. In addition to
any extra hardware. If you have implement-
private MIBs, which typically have cus-
ed a network management system, you may
tomized support for each switch and level of
configure the switch to send an unsolicited
operating code, the standard MIBs can be
response called an SNMP trap whenever uti-
used very effectively to monitor a switched
lization, errors, or some other parameter
network. In increasing order of detail, the
exceeds a specified threshold. Then use net-
following MIBs are useful for troubleshoot-
work management or a network monitoring
ing, though many others are good too.
tool to investigate what caused the thresh-
RFC 1213 – MIB II
old to be exceeded.
RFC 1643 – Ethernet-Like Interface MIB
Virtually all but the least expensive
RFC 2819 – RMON Ethernet
switches ship with SNMP management capa-
RFC 2021 – RMON 2
bility. The primary differences are in how
RFC 2613 – SMON
granular the answers are. Some less expen-
Many RFCs are updated or enhanced follow-
sive switches have SNMP agents that only
ing their introduction, so always check the
offer information about the switch as a
latest RFC index for updates. For example,
whole; other, more expensive switches offer
RFC 1213 is updated or enhanced by at least
very detailed information about each indi-
five newer RFCs (2011, 2012, 2013, 2358
vidual port.
and 2665). In addition to the MIBs defined
SNMP is probably the most common and
by these RFCs, which contain excellent infor-
least intrusive method of monitoring a
mation on utilization and errors, the bridge
switched network. The SNMP console does
MIB (RFC 1493) is very useful for trou-
not have to be anywhere near the monitored
bleshooting.
device as long as there is a routed path to
Security is a concern when using SNMP
the target, and security configurations per-
to monitor a network. If SNMP agents are
strings, and are both case and punctuation
sensitive. Community strings are transmitted
in clear text, too, which in itself creates a
security risk. While not widely deployed at
this time, SNMP V3 offers encrypted communication to address this exposure. The most
common default community string is public.
It is shocking how many SNMP agents are
accessible from the Internet with the public
community string – even today.
At a minimum, the default community
string should always be changed immediately. Agents may be configured to respond
to different community strings for different
levels of access, to queries from a specific
subnet and no other, to queries from a specific IP address and no other, and many
other configurations. The routers providing a
path to those SNMP agents may impose a
variety of limits on SNMP. Firewalls may
block SNMP entirely. If you are able to reach
the agent using SNMP, the agent still has to
support the MIB you are querying. Most
vendors support the standard MIBs adequately. However, some vendors do not.
In some cases it is necessary to upgrade the
operating system on the switch before
it is capable of supporting a desired MIB.
Problems with this method include when an
SNMP agent’s implementation of a specific
MIB is not accurate, and responses to
queries are simply wrong. It doesn’t happen
that often, but programming errors occasionally result in inaccurate responses.
mit the console to communicate with the
agent in the switch.
Troubleshooting Switched Environments
6
There are many reasons why your switch
does not respond to a specific SNMP query.
Once any access problems are resolved,
SNMP offers a very useful tool for monitoring and trending.
Conclusion
A commonly used troubleshooting method is
to wait for user complaints. This method
should not be discounted due to its simplicity – it is very effective. The user community
has a very finely tuned subconscious sense
of what the normal performance of the
network is. Any perceived degradation of
that sense of normal will result in a rapid
complaint to the network support center.
Once a user complains, you can start the
troubleshooting process from his or her
connection point. The problem with this
method is that it is entirely reactive
instead of proactive.
Ideally, the approach should be proactive.
Proactive efforts to prevent problems from
affecting users include regularly interrogating each switch, and monitoring the quality
of traffic on each switch port – just as any
other segment would be monitored on a
regular basis. Implementing tactics such
as monitoring and trending switch port
statistics and using tools that allow you
see inside switches will take you from a
troubleshooting mode to a trouble
prevention mode.
N E T W O R K S U P E R V I S I O N
Fluke Networks
P.O. Box 777, Everett, WA USA 98206-0777
Fluke Networks operates in more than 50 countries
worldwide. To find your local office contact details, go
to www.flukenetworks.com/contact.
©2004 Fluke Corporation. All rights reserved.
Printed in U.S.A. 4/2004 2142429 A-ENG-N Rev A