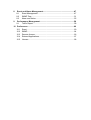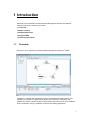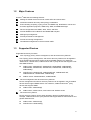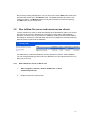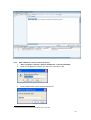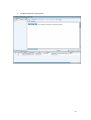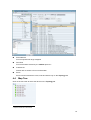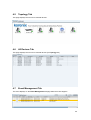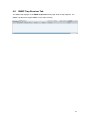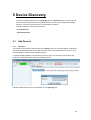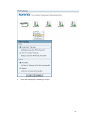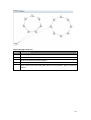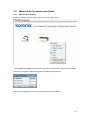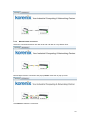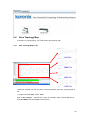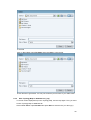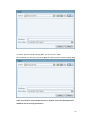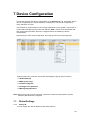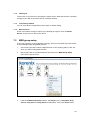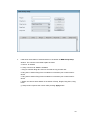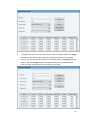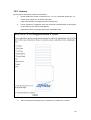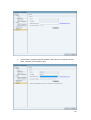
1
Industrial Innovation Network Management System (JetView Pro) User Manual Version 1.0, March, 2010 www.korenix.com Industrial Innovation Network Management System User Manual Copyright Notice Trademarks mentioned in this manual, even if not specifically identified as such, give no right to assume that such names may be considered as being free within the meaning of the trademark legislation nor that anyone may use them freely. Copyright 2009 Korenix Technology Co., Ltd. Manuals and software are subject to copyright. All rights reserved. Copying, duplication, translation, conversion to any electronic medium or machine-readable form in whole or in part are not permitted. The performance features described here are binding only if they have been expressly guaranteed in the contract. This publication has been created by Korenix according to the best of our knowledge. Korenix reserves the right to change the contents of the manual without prior notice. Korenix can give no guarantee in respect of the correctness or accuracy of the details in this publication. Under no circumstances can Korenix be held liable for any damage arising in any connection with use of the network components or their operation software. We also refer to the conditions of use stated in the license agreement. Korenix Technology Co., Ltd. Fl 2, No. 188, Bao-ciao Rd., Shing Tien City 23145 Taipei Taiwan Tel. +886-2-8911-1000 Index 1 Introduction.............................................................................................1 1.1 Overview .........................................................................................1 1.2 1.3 1.4 1.5 Major Features ................................................................................2 Supported Devices ..........................................................................2 Support MIBs...................................................................................3 Ordering Information .......................................................................3 2 Installation...............................................................................................4 2.1 System Requirements .....................................................................4 2.2 Installation .......................................................................................5 2.3 Uninstallation...................................................................................9 3 Getting Started......................................................................................10 3.1 JetView Pro Applications ...............................................................10 3.2 Run JetView Pro server and remote access clients ......................11 4 Interface of JetView Pro .......................................................................14 4.1 Main Window of JetView Pro.........................................................14 4.2 Menu Function...............................................................................16 4.3 Toolbar Function ...........................................................................18 4.4 4.5 4.6 4.7 Map Tree .......................................................................................19 Topology Tab ................................................................................20 All Devices Tab .............................................................................20 Event Management Tab ................................................................20 4.8 SNMP Trap Receiver Tab .............................................................21 5 Device Discovery ..................................................................................22 5.1 Add Devices ..................................................................................22 5.2 Delete Devices ..............................................................................23 6 Topology Map .......................................................................................25 6.1 Device Information ........................................................................25 6.2 Auto Topology ...............................................................................27 6.3 Manual Add Connection and Delete..............................................33 6.4 7 Save Topology Map ......................................................................35 Device Configuration............................................................................38 7.1 Global Settings ..............................................................................38 7.2 MSR group setup ..........................................................................39 7.3 Firmware Upgrade.........................................................................42 7.4 7.5 Configure File Operation ...............................................................42 Manage by Application ..................................................................42 8 Event and Alarm Management.............................................................47 8.1 Event Management .......................................................................47 8.2 SNMP Trap....................................................................................51 8.3 Alarm and Action ...........................................................................55 9 Performance Management ...................................................................58 9.1 Traffic Report.................................................................................58 10 Preferences ...........................................................................................60 10.1 Event .............................................................................................60 10.2 10.3 10.4 10.5 SNMP ............................................................................................64 Remote Access .............................................................................66 External Applications.....................................................................67 License..........................................................................................68 1 Introduction Welcome to the Industrial Innovation Network Management System User Manual. Following topics are covered in this section: 1.1 Overview 1.2 Major Features 1.3 Supported Devices 1.4 Support MIBs 1.5 Ordering Information 1.1 Overview JetView Pro is an Industrial Innovation Network Management System (i2-NMS). JetView Pro is specifically designed for mission critical industrial environments. The JetView Pro provides a comprehensive platform for monitoring, configuring, and maintaining mission-critical IP-based communication networks, such as IP surveillance, factory automation, mining, substation, maritime and military applications. 1 1.2 Major Features Korenix i2-NMS has the following features: Manage IP-based devices from both central office and remote sites Automated network discovery and topology visualization Event handling via polling, syslog, email, and SNMP trap. Notifications can be sent via email, application programs, SNMP trap, SMS, and MSN Messenger Device configurations via SNMP, Web, Telnet, and SSH Provide SNMPv1/v2c/v3 Browser and SNMP MIB compiler MSR group management Provide performance management Provide accounting management Centralized management to reduce network traffic. 1.3 Supported Devices Supported Devices by functions: Auto Topology (LLDP), device management, and device discovery features Auto Toplogy, device management, and device discovery features can be applied in the IP-enabled devices which support LLDP and SNMP features. For instances, rd JetNet series, JetPoE series, JetRock series and 3 party devices that support LLDP and SNMP features. JetNet series: JetNet6524G, JetNet6059G, JetNet5628G, JetNet5228G, JetNet5428G, JetNet5018G, JetNet5012G, JetNet5010G, JetNet4510(f), JetNet4006(f) JetPoE series: JetNet6710G, JetNet5728G-24P, JetNet5728G-16P, JetNet5720G-8P, JetNet5708G, JetNet4706(f) JetRock series: JetNet4506-M12, JetNet4506-RJ Device management and device discovery features Device management and device discovery features can be applied in the IP-enabled rd devices which support SNMP feature. For instances, JetNet series and 3 party devices that support SNMP. JetNet series: JetNet4508(f) JetBox series, JetPort series, JetIO series and JetWave series Device discovery feature Device discovery feature can be widely applied in all the IP-enabled devices. For rd example, JetNet series and 3 party devices that support WEB or telnet features and general windows PCs. JetNet series: JetNet4010(f) JetPoE series: JetNet3706(f) 2 1.4 Support MIBs JetView Pro supports the following standard MIBs in addition to the Korenix private MIBs. RFC1213-MIB-II.mib RFC1215-MIB-II.mib RFC1398-ETHER.mib RFC1493-BRIDGE.mib RFC1724-RIP.mib RFC1757-RMON.mib RFC1850-OSPF.mib RFC3621-PSE.mib 1.5 Ordering Information A trial version that supports monitoring of 64 IP-enabled devices is available for authorized distributors. Request licenses as follows: 128 – manage 128 devices 256 – manage 256 devices 1024 – manage 1024 devices Unlimited – unlimited devices For more detailed information, please contact your local sales representative. 3 2 Installation This section includes software installation. Following topics are covered in this section: 2.1 System Requirements 2.2 Installation 2.3 Uninstallation 2.1 System Requirements • Hardware: Processor Minimum Intel Core 2 Duo CPU 2.5 GHz or higher RAM 1GB RAM Disk 1GB hard disk • Software Operation system Windows XP/2000/2003 platforms • Java Runtime Environment (JRE) 1.6.0 or higher Screen Resolution It is optimized for a screen resolution of 1024x768 Note: Before starting the JetView Pro installation, please confirm whether Java Runtime Environment is installed on your computer. If not, you can download Java Runtime Environment (JRE) package from http://www.java.com and install JRE to your computer. 4 2.2 Installation 1. Run setup.exe 2. Press Next to the next screen. 5 3. Please read the license agreement and select “I accept the terms of the license agreement. Press Next to next screen. 4. Input User Name and Company Name and press Next to next screen. 6 5. Select the type of setup and press Next to next screen. Note: choose client installation for client only, server installation for all or custom installation. 7 6. Press Finish to end installation. On the desktop or in Start / Programs / Korenix / Korenix JetView Pro /, ,you can see two program shortcuts (as figure). The “Launch JetView Pro(localhost)” is for local connection, while the “Launch JetViewPro” is used to connect to remote server. Note: Failed to Run JetView Pro. In case of failure the following dialog or other error dialogs will appear on your desktop. 8 Please connect to http://www.java.com and download the java runtime environment (JRE). 2.3 Uninstallation Remember to quit the JetView Pro program before you get starting the uninstallation Follow below steps to uninstall 1. To uninstall JetView Pro, select Start / Control Panel / Add or Remove Program. 2. Select the program “Korenix JetView Pro”. 3. Click on Remove and follow the instructions of the uninstallation routine. Or directly run this shortcut Start / All Programs / Korenix / Korenix JetView Pro / Uninstall Korenix JetView Pro 9 3 Getting Started Following topics are covered in this section: 3.1 JetView Pro Applications 3.2 Run JetView Pro server and remote access clients 3.1 JetView Pro Applications JetView Pro is a client/server based network system. One JetView Pro server can serve 1 many remote access JetView Pro clients (maximum is 5) (see figure below). Central Office Switch JetView Pro JetView Switch Server Pro Client Router Remote Site B Remote Site A Router Router Switch Switch Switch JetView Pro Client Switch Switch Switch Switch JetView Pro Switch 1 Client Only one remote client connection per computer is possible. The server will refuse the new connection if already one session exists. 10 Due to the accounting management, only one client can enter the Edit mode at the same time and other clients are in the Monitor mode. The default password to enter the two modes is “korenix”. The Monitor mode can only allow viewers to browse the topology. The Edit mode can use all functions. 3.2 Run JetView Pro server and remote access clients “Korenix JetView Pro Service” starts automatically when Windows XP starts. You can get the status of the service in Windows XP under Start / Control Panel / Administration / Services. This service has a connection to a database containing all the relevant data for the settings of JetView Pro. Note that when the service is stopped, the relevant monitored data cannot be recorded into the database. For Windows XP, it starts automatically “Korenix JetView Pro Service” after installation. You can change Startup type of this service to Manual if you don’t want the service to run after your pc boot up. 3.2.1 Start JetView Pro server on Server site 1. Start / Programs / Korenix / Korenix JetView Pro / Launch JetViewPro(localhost) 2. Display JetView Pro main window 11 3.2.2 1. 2 Start JetView Pro client (connect to server) Start / Programs / Korenix / Korenix JetView Pro / Launch JetViewPro 2. Enter server address to connect. (ex. Server IP: 192.168.10.100) 3. Enter password into monitor mode and press Ok. 2 Note that the default password for Monitor Mode access is “korenix”. 12 4. Display JetView Pro main window 13 4 Interface of JetView Pro Following topics are covered in this section: 4.1 Main Window of JetView Pro 4.2 Menu Function 4.3 Toolbar Function 4.4 Map Tree 4.5 Topology Tab 4.6 All Devices Tab 4.7 Event Management Tab 4.8 SNMP Trap Receiver Tab 4.1 Main Window of JetView Pro 4.1.1 Main Window When you start JetView Pro, the main window appears on the screen. It consists of the following parts: Menu Function Toolbar Function Map Tree Topology Tab All Devices Tab Event Management Tab SNMP Trap Receiver Tab 14 4.1.2 Enter the Edit Mode The Monitor mode is only able to “view” the topology when starting JetView Pro into main window. To change the settings, need to enter Edit mode. 1. Click on Edit Mode on the toolbar, it displays Password dialog. 15 3 2. Input password and press Ok. 3. After entering Edit Mode, the button will become green. In the Edit mode, all functions are available. If return to Monitor mode, click on Edit Mode again. 4.2 Menu Function The menu function contains the following selection items: File Management Configuration Help 3 Note that the default password for Edit Mode is “korenix”. 16 4.2.1 File Submenu File - Open: opens the previous saved database file. File - Save: saves the current database into file. File - Export: exports the displayed map in the Topology Map as Image file (BMP, JPEG, PNG format) File - Print: exports the displayed map in the Topology Map as PDF file. File - Exit: closes the JetView Pro Main Window. File - Exit and Stop Service: closes JetView Pro Main Window and stops JetView Pro Service 4.2.2 Management Submenu Please refer to section 7.4 for more information. 4.2.3 Configuration Submenu Please refer to section 9 for more information. 4.2.4 Help Submenu It shows the version and release date of JetView Pro. 17 4.3 Toolbar Function Find Quickly find out the selected device by IP address. Edit Mode Click on Edit Mode to enter into Edit mode by input password. Web Browser Run web browser to configure by Java Applet on Korenix’s switch device SNMP Browser The SNMP Browser tool lets you read and write the MIB of the IP-Address device. Please refer to section 7.4.2 for more information 18 Scan Network Find out specified IP range assigned. Fast Scan 4 Find out all switch devices by the JetView protocol. Preferences Please refer to section 9 for more information. Zoom Zoom in and out the device icons, texts and others only on the Topology tab. 4.4 Map Tree Click on the tree node to select the device on the Topology tab. 4 Only Korenix devices can be found 19 4.5 Topology Tab This page displays the icons for monitored devices. 4.6 All Devices Tab This page displays the icons for monitored devices (as Topology tab) 4.7 Event Management Tab The event displays on the Event Management tab page while the event happens. 20 4.8 SNMP Trap Receiver Tab The SNMP trap displays on the SNMP Trap Receiver tab page while the trap happens. The SNMP Trap Receiver support SNMP v1/v2c traps receiving. 21 5 Device Discovery To see the installed devices on the Topology tab or the All Devices tab, you have to add devices. How to do add devices and delete devices? How to quickly update the installed devices? This section gives answers to all the above questions. Following topics are covered in this section: 5.1 Add Devices 5.2 Delete Devices 5.1 Add Devices 5.1.1 Fast Scan This function is to discovery devices using the JetView protocol in the local network. JetView Pro discovers all network devices on the subnet network via the selected interface on the PC. This function adapts to setup a newly installed network. To update installed network components (or devices), click on Fast Scan on the toolbar and select one of your NIC which connect to network devices. It displays all Korenix devices in the network on the Topology tab. 22 5.1.2 Scan Network This function is to discovery devices via the assigned IP address range. While you want to add the specified IP-enabled device, this function is suitable. Note: The “End Address” should great or equal then “Start Address” 5.2 Delete Devices You can delete any device on Topology tab. Use the mouse to select multiple devices by CTRL key and right-click the selected device. Then display a pop-up menu and click on Delete menu item. 23 24 6 Topology Map Following topics are covered in this section: 6.1 Device Information 6.2 Auto Topology 6.3 Manual Add Connection and Delete 6.4 Save Topology Map 6.1 Device Information 6.1.1 Device Status Move mouse cursor over the switch device icon on Topology tab. It will show the following status for the device. The device (IP address: 192.168.10.1) lists in left tree panel with a status icon use to show its online/offline status. Green means online, while white means offline. The device icon on Topology tab also shows its status in the background. If the color is red, which indicates an error status (hint: the detail is in Event management tab). In other words, JetView Pro sends ICMP Ping request and then receives incorrect response (unreachable). 25 There is a green check on right-bottom of the device. This green check 5 indicates the normal status for SNMP . 6.1.2 5 Device refresh To update the device status, select one more device (especially on error status) and right-click mouse on the selected device. Then pop up as follows: You may need to wait 0.5 minute to let JetView Pro collect devices’ information. 26 6.1.3 Device delete To remove the device nodes, select one or one more devices and right-click mouse on the selected device. Then pop up as follows: 6.1.4 Managing devices To manage the devices, select one device and right-click mouse on the selected device. It will pop up a dialog as follows. Choose to use Web Browser, SNMP Browser, Telnet, SSH, or Ping to manage the device. Also refer to section 7.4 for more details. 6.2 Auto Topology The Auto Topology function allows you to automatically create the links (connections) between the devices (nodes). To support this function, the devices must support with LLDP and SNMP. LLDP enables the user to have automatic topology recognition for his LAN. Therefore the devices support for LLDP and SNMP and have to be configured to ready state. 6.2.1 Enable LLDP To let “Auto Topology” working, each device MUST enable LLDP function on installed network devices. You can use Web browser to confirm whether LLDP is enabled. 1. Use mouse to select one device on the Topology tab which you want to enable as LLDP. 27 2. Mouse right-click on the selected device and click on the Web Browser menu-item of pop-up menu. 3. 6 6 When the login screen appears, login with the user name and password. Note: The default login User Name and Password: admin/admin 28 4. Click on the tree node Topology Discovery. 5. Confirm whether LLDP is enabled. If it is Disable, please set Enable and press Apply. You can manual set the timers of LLDP. The range of LLDP timer is 5~254 and LLDP hold time is 10~255. 29 6.2.2 Generate connections 7 Generate connections between the devices. 1. Check every devices’ icon that each one has a green check on it. Device icon without check icon can’t access by SNMP. 2. Mouse right-click on the Topology tab and click on Auto Topology on pop-up menu. It will display as follows: 7 In the example below, JetView Pro add connections and place all devices according to the SNMP mib. 30 3. Press OK to display the following of screen. 31 Auto Topology Check List: Yes/No Requirement Does every device enable SNMP? Does any device not using default SNMP community? (public, private) Does every devices’ icon show green? Does every device enable LLDP? If the device show red (not reachable), after you fix the problem, did you refresh the device? 32 6.3 Manual Add Connection and Delete 6.3.1 Manual Add connection Select two switch icons and mouse right-click to show popup menu. Click on Add Connection menu item of the pop menu. It will show this Add Connection dialog. Enter two port number connected between two switches and press OK. The screen will display that there is a connection between two switches. 33 6.3.2 Manual Delete connection Select the connection between 192.168.10.20 and 192.168.10.10 by Mouse-Click. Mouse Right-Click the connection and pop up Delete menu-item of pop-up menu. Click Delete to delete the connection. 34 6.4 Save Topology Map To present to Topology Map, you could need to get topology map. 6.4.1 Save Topology Map as file JPG File BMP File PNG File PDF File These two methods can help you save currently displayed map in the Topology Map to file. 1. Image format file (BMP, JPEG, PNG) Click on File / Export…. Choose File of Type to use BMP, JPEG, PNG image format. Input File Name and press Save to save the file. 35 2. PDF file Click on File / Print. Input File Name and press Save to save the file. A PDF file will be generated. You can print it with the print function of your PDF viewer. 6.4.2 Save Topology Map as database file (*.jvp) To record current displayed map in the Topology Map, use this map again. First, you need to save Topology Map as database file. Click on File / Save. Input File Name and press Save to save the file. (ex. demo.jvp) 36 To restore previous saved Topology Map, you click on File / Open… Set File Name (ex. demo.jvp) and press Open to restore previous saved Topology Map. Note: This function only available on server. Remote client can’t backup/restore database due to security precautions. 37 7 Device Configuration This section explains the device configuration on the All Devices Tab. One switch device can be configured by one mouse selection. Group devices can also be configured by many selections at a time. The methods of mouse selection can be single selected any rows by Ctrl + mouse click or continuously selected by first mouse click and then Shift + mouse click. Remember that first mouse select the switch devices to configure before the following of device configurations. After having one more devices selections, show pop-up menu by mouse right-click. Following topics are covered in this section describing the pop-up menu functions: 7.1 Global Settings 7.2 MSR group setup 7.3 Firmware Upgrade 7.4 Configure File Operation 7.5 Manage by Application Note: Before using pop-up menu functions, remember to select the target device (mouse selection) that should be configured. 7.1 Global Settings 7.1.1 Change IP You can assign the new IP address to the switch devices. 38 7.1.2 LED Signal This function is convenient for searching the switch device. While this function is enabled, the light of the LED on the switch device constantly twinkles. 7.1.3 Load Factory Default You can reset all the configurations of the switch to default setting. 7.1.4 Reboot Device Some of the feature change to require you rebooting the system. Click on Reboot Device on pop-menu to reboot your device. 7.2 MSR group setup To let “Auto Topology” to generate Ring Topology, devices in the install ring network have to setup Multiple Super Ring (MSR) function. 1. Use mouse right click to select multiple devices on the Topology tab by CTRL key which you want to setup MSR function. 2. Mouse right-click on the selected device and click on the MSR Group Setup menu-item of pop-up menu. 3. It will show MSR Group Setup window. Set Ring ID (0~31), Ring Name, Ring Version, Ring Port1 and Ring Port2 for MSR setup. Then press Check button 39 4. It will show check status of selected device in the bottom of MSR Group Setup window. The columns in the table explain as follow: a. Device: IP address b. Snmp: Connect via SNMP is available c. Ring ID: whether Ring ID is used or exceeds the ring number limit d. Ring Port1: whether Ring Port1 is enabled or exceed the port number limit for device e. Ring Port2: whether Ring Port2 is enabled or exceed the port number limit for device f. Status: the device status based on the status of Snmp, RingID, Ring Port1, Ring Port2. g. Setup result: response this column after pressing Apply button 40 5. To indicate that there is at least one of device in the unavailable status if the Apply is disabled. Press Check button again after solving the problem for unavailable devices. If all the selected devices are in the available status, the Apply button will enable. Then press Apply button to setup MSR setting for all selected devices. Final, the setup result will show the last column in the table. 41 6. If you want to use these settings for rebooted devices, you MUST press Save to Flash button to save these settings into flash for each devices. 7.3 Firmware Upgrade In this section, you can update the latest firmware for your switch. Korenix provides the latest firmware in Korenix Web site. The new firmware may include new features, bug fixes or other software changes. We’ll also provide the release notes for the update as well. For technical viewpoint, we suggest you use the latest firmware before installing the switch to the customer site. The UI also shows you the version and built date of current firmware. Please check the version number after the switch is rebooted. Note: The system will be automatically rebooted after you finished upgrading new firmware/bootloader. Please remind the attached users before you do this. 7.4 Configure File Operation The configuration file of the switch is a pure text file. You can open it by word/txt read file. You can also modify the file, add/remove the configuration settings, and then restore back to the switch. 7.4.1 Backup With Backup function, you can save current configuration file saved in the switch’s flash 7.4.2 Restore This will allow you to go to Restore function later to restore the configuration file back to the switch. 7.4.3 Load default All of the configurations will be rollback to the factory default settings, except the device IP address. 7.5 7.5.1 Manage by Application Web browser For managing Korenix’s Ethernet switch devices, you need to consider that they have web management function. Korenix web management page is developed by JAVA. It allows you to use a standard web-browser such as Microsoft Internet Explorer, or Mozilla, to configure and interrogate the switch from anywhere on the network. 1. Use mouse to select one device on the Topology tab which you want to configure. 2. Mouse right-click the selected device and click on the Web Browser menu-item of pop-up menu. 3. The login screen will appear next. 4. Key in user name and the password. Default user name and password are both admin. 42 Click on Enter or OK. Welcome page of the web-based management interface will then appear. 5. Once you enter the web-based management interface, you can freely change the IP address to fit your network environment. 7.5.2 SNMP Browser JetView Pro provides a SNMP browser for user to management SNMP devices. The SNMP Browser supports SNMP v1/v2c/v3 get, get next, walk, table view and set functions. And the SNMP Browser provides MIB file compiler tool “MIB File Manager” that can load public standard MIBs and private MIBs and build a MIB tree. Korenix provides many standard MIBs for users to configure or monitor the switch’s configuration by SNMP. But, since some commands can’t be found in standard MIB, Korenix provides Private MIB to meet up the need. Compile the private MIB file by your SNMP tool. You can then use it. Private MIB can be found in product CD or downloaded 43 from Korenix Web site. Private MIB tree is the same as the web tree. This is easier to understand and use. If you are not familiar with standard MIB, you can directly use private MIB to manage /monitor the switch, no need to learn or find where the OIDs of the commands are. The SNMP Browser tool lets you read and write the MIB of the selected device. The MIB Compiler assists user in building MIB tree. While MIB files have been changed, user uses the MIB Compiler to rebuild MIB tree. To add new MIB into MIB Tree, go File > MIB Manager… It will show the following window. 44 Press Add MIB from file… to add new MIB file. Load this new MIB file and then press Rebuild MIB Tree… to update MIB Tree. 7.5.3 Telnet Korenix‘s network devices support Telnet console. You can connect to the switch by Telnet. The command lines are the same as what you see by RS232 console port. 45 You can use CLI command to configure your device. 7.5.4 SSH (Secure Shell) Korenix‘s network devices also support SSH console. You can remotely connect to the switch by command line interface. The SSH connection can secure all the configuration commands you sent to the switch. SSH is a client/server architecture where network devices are considered as the SSH server. When you want to make SSH connection with the switch, you should download the SSH client tool first. 7.5.5 Ping This ping function can confirm your host access to Korenix‘s network devices via network. Ping the selected device to verify a normal response time. 46 8 Event and Alarm Management Following topics are covered in this section: 8.1 Event Management 8.2 SNMP Trap 8.3 Alarm and Action 8.1 Event Management Administers can identify the event threshold (OK, Warning, Error, No Status) by the color. Notifications based on any event (Node up, Node down, Link up, Link down, Remote Access Client mode, etc.) can be generated. Besides, notifications can be sent via email, SNMP trap and this JetView Pro program. For the event settings refer to section 9.1. In the case of red background icon on Topology tab, relevant fields in the event line of Event Management tab are colored as red (see in the following screen). According to the event message, users can identify what occurs to the devices with red background. Ack This column is to check the status of each event and confirm these events for network manager. After checking Ack, the corresponding links or device icons in the topology are restored to the normal color. This is also to recognize updated status in the topology. Use mouse to click checkbox to check. 47 Ack for the green link, for example: While you check ths Ack of ID 504 and 505, the link color will restore from green to gray. 48 Event Filter You can choose to use All Events, Unacknowledged Events, Warnings & Errors, Warnings, Errors, Unacknowledged Warnings & Errors and Source = ,so that show the event status you want to see. While choosing “Source =”, you must append the IP address(ex, 192.168.10.1) behind the “Source = “ string and press Filter button to filter the events matched by Source column, 8.1.1 Link up/down Events While the link failure happens, JetView Pro will issue a Link Down event in Event Management tab page and update the Topology Map. (Figure: link down event). This event will show “Port1 Link Down” Message. Figure: link down event While the link restores, JetView Pro will issue a Link Up event in Event Management tab page and update the Topology Map. (Figure: link up event). This event will show “Port1 Link UP” Message. 49 Figure: link up event 8.1.2 Node up/down Events While the node failure happens, JetView Pro will issue a Node down event in Event Management tab page and update the Topology Map. (Figure: node down event). This event will show “Status ERROR(Reachability=No)” Message. Figure: node down event 50 While the node restores, JetView Pro will issue a Node up event in Event Management tab page and update the Topology Map. (Figure: node up event). This event will show “Status OK(Reachability=Yes)” Message. Figure: node up event 8.2 SNMP Trap SNMP Trap is the notification feature defined by SNMP protocol. All the SNMP management applications can understand such trap information. So you don’t need to install new application to read the notification information. The SNMP Trap Receiver of JetView Pro supports SNMP v1/v2c traps receiving. The following sections illustrate SNMP Trap with Link down and up event. 8.2.1 Enable Link-down and Link-up Event To enable link-down and link-up event, you must enable SNMP Trap Server and Link down and up event. Enter Web screen to configure these settings. 1. Use mouse to select one device on the Topology tab which you want to enable link down and up event. 2. Mouse right-click the selected device and click on the Web Browser menu-item of pop-up menu. 3. When the login screen appears, login with the user name and password. The default login User Name and Password: admin/admin 51 4. Click on the tree node SNMP Traps. Enable SNMP Trap, and set SNMP Trap Server IP address on the machine where the JetView Pro is installed. 52 5. Click on the tree node Event Selection. Enable the specified port for link-down and link-up event (ex. Set Port 1 as Both). 53 8.2.2 Receive SNMP Trap 1. Click on Start on the SNMP Trap Receiver tab. 2. While plugging in or out the network line (ex. RJ45) on the port 1 of device (ex.192.168.10.1), it will display as follows: 54 8.3 Alarm and Action When event or SNMP trap are produced. They in addition to display in event management or SNMP Trap Receiver, and they can trigger some alarms and do some actions. The alarm can be triggered by type or other field of event. The actions of JetView Pro supported are Popup Message, E-mail and Run Executable File. The following sections illustrate how to use alarm and action. 8.3.1 Create an Action Open JetView Pro Preference, select Event Action and new an action. Press New button the Action Editor window will be opened. You need input action name and select an action type (Popup Message, Send E-Mail or Run Executable File) to create a new action. Or you can manage actions via Edit, Duplicate or Delete functions. 55 8.3.2 Create an Alarm Open JetView Pro Preference, select Event Action and new an alarm. Press New button the Alarm Editor window will be opened. You need input action name and select actions to create a new alarm. Select Active option to active this alarm. Change Filter Type or Source to filter what event that you want to trigger. Select actions to decide what action will be executed when this alarm is trigged. Or you can manage actions via Edit, Duplicate or Delete functions. 56 8.3.3 Popup Message Action When a Popup Message action is executed, all JetView Pro clients will popup a message as follows: 8.3.4 E-mail Action When a Send E-mail action is executed, the JetView Pro will send an alarm e-mail to your e-mail account (configured in Preference->SMTP configuration). The e-mail could show as follows: 8.3.5 Run Executable File Action When a Run Executable File action is executed, the user specified executable file will be executed. 57 9 Performance Management If you want to monitor the traffic of your local network for a period of time, JetView Pro can give you an indication of the network traffic for the connections in a time context. It is useful as a quick reference for determining the amount of network bandwidth being consumed. The following topics are covered in this section: 9.1 Traffic Report 9.1 Traffic Report JetView Pro monitor and report selected connection statistics. The tab name of the current traffic history shows two connected devices’ IP address and port -- Port 13 on the device (192.168.10.10) connects to port 9 on the other device (192.168.10.1). The data was 8 collected by through SNMP’s polling. The default sampling rate is set to 30 seconds. The figure below indicates network load for the specified port. In order to show a visible line on the graph for network traffic on any interface, the view automatically scales to magnify the Y-axle’s unit of traffic. The X-axle is time. The Y-axle means the total number of bytes sent on the connection in the polling time interval. The maximum number of entries can be recorded in 30 minutes. When the maximum number of entries is reached, JetView Pro throws out the oldest entry when a new one is recorded. 8 The JetView Pro can be centrally deployed to reduce network traffic cause by JetView Pro server gathering devices’ SNMP statistics 58 To view the traffic report • Mouse Double-Click on the line between the two devices. • The traffic report only available if the network connection is present. • The traffic tab provides an indication of the network traffic for the connection. 59 10 Preferences Following topics are covered in this section: 10.1 Event 10.2 SNMP 10.3 Remote Access 10.4 External Applications 10.1 Event 10.1.1 Events This page allows you to record events into the log file. You can change maximum number of traps, trap log to file and trap log directory. 60 10.1.2 Events Action This page allows you to manage Actions and Alarms; the management functions include New, Edit, Delete and Duplicate. If you press New, Edit, Delete or Duplicate of Action, the Action Editor will popup for Action configuring. If you press New, Edit, Delete or Duplicate of Alarm, the Alarm Editor will popup for Alarm configuring. 61 10.1.3 Status Colors This page allows you to assign a color to each status. You can change text and background color of 4 types status. 62 10.1.4 SMTP Configuration While you use to send Email function for Event Action, you must set SMTP Configuration. If SMTP server requests you to authorize first, you can also set up the username and password in this page. And you can press “Test SMTP configuration” to test your configuration after you finish this configuration. 63 10.2 SNMP 10.2.1 SNMP Configuration The JetView Pro will add a default SNMP agent profile for discovered devices. You can use this page to new, edit, delete or duplicate a profile. The configurations of profile include agent listening port (default is 161), SNMP version (support v1/v2c/v3), read/write community, retry numbers and timeout (in second(s)). 64 10.2.2 SNMP Trap Receiver This page allows you to configure SNMP Trap Receiver and record SNMP Trap into the log file. You can enable the SNMP Trap Receiver on system starting, change listening port, change maximum number of traps, trap log to file and trap log directory. 65 10.3 Remote Access Due to the access synchronization, we only allow one client to enter the Edit mode at the same time and the other clients on Monitor mode. The allowed default password for entering two modes is “korenix”. The Monitor mode can only allow viewer to browse the topology. Edit mode can use all functions. The maximum number of remote client is default 5. You can setup new passwords on Monitor and Edit mode. 66 10.4 External Applications JetView Pro uses external applications for the functions. This page allows you to assign specified programs or use default application to run the functions. 67 10.5 License By the steps to use license, follow the instructions. 1. Check whether the version of JetView Pro is 1.0. If no, download JetView Pro 1.0 version (only support for 16 nodes) and install. ( http://www.korenix.com/support-jetview-software.htm) 2. Fill out JetView Pro registration form and we will send authentication code (support for 64 nodes) to your filled E-mail address. (http://www.korenix.com/support-jetviewpro-registration.htm) 3. After receiving the E-mail letter, go to JetView Pro> Preference> License. 68 4. Fill out Name, Company,and Authorization Code base on the content of E-mail letter. And then press Register button. 69 5. Finally, press OK to apply license. 70