1
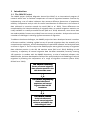
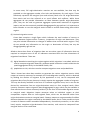
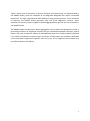
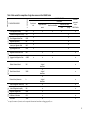
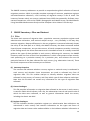
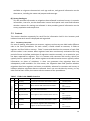
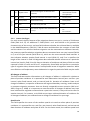
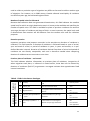
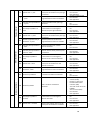
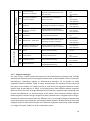
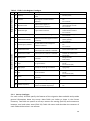
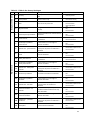
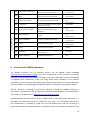
Queensland Centre for Population Research
The IMAGE Inventory:
A User Guide
Martin Bell, Aude Bernard, Elin Charles-Edwards, Dorota
Kupiszewska, Marek Kupiszewski, John Stillwell, Yu Zhu,
Philipp Ueffing and Alison Booth
February 2015
Working Paper No 2015/01
School of Geography, Planning and
Environmental Management
www.gpem.uq.edu.au/qcpr
Contents
1
2
Introduction .................................................................................................................................... 3
1.1
The IMAGE Project .................................................................................................................. 3
1.2
The IMAGE Inventory .............................................................................................................. 4
1.3
Outline..................................................................................................................................... 4
Impediments to cross-national comparisons of migration ............................................................. 5
2.1
Dimensions of migration ......................................................................................................... 5
2.2
Comparability of migration data ............................................................................................. 9
2.3
Type of migration data............................................................................................................ 9
2.4
Observation interval ............................................................................................................. 10
2.5
Spatial framework ................................................................................................................. 11
3
Review of internal migration data collection practice .................................................................. 11
4
Assembling the IMAGE Inventory ................................................................................................. 13
5
IMAGE Inventory: Files and Content............................................................................................. 14
6
5.1
Files ....................................................................................................................................... 14
5.2
Content ................................................................................................................................. 15
5.2.1
Inventory Overview ....................................................................................................... 15
5.2.2
Census Inventory........................................................................................................... 16
5.2.3
Register Inventory ......................................................................................................... 19
5.2.4
Survey Inventory ........................................................................................................... 20
Access to the IMAGE Inventory .................................................................................................... 21
References ............................................................................................................................................ 24
2
1 Introduction
1.1 The IMAGE Project
The IMAGE project (Internal Migration Around the GlobE) is an international program of
research which aims to facilitate comparisons of internal migration between countries by
implementing a set of robust indicators that measure different dimensions of population
mobility. Comparative analysis calls for careful consideration of differences in the nature of
data collected in countries around the world (Bell et al. 2002). These differences are
complicated by the limited availability of migration data, as national migration statistics are
rarely available in a readily accessible format (Bell et al. 2014). Moreover, even where data
are made available, formats vary widely from one country to another. Analysts also confront
a number of challenges in deriving rigorous measures of migration.
To address the above challenges, the IMAGE project has been developed around a number
of discrete modules, including a global survey of internal migration data, the assembly of a
comprehensive repository, and the development of specialised software and analytical tools,
as shown in Figure 1. The first step to the IMAGE project was a global inventory of migration
data collection practice in the 193 UN member states (Bell et al. 2014). Building on this
inventory, a repository of internal migration data has been assembled, currently covering
135 countries. In tandem with the IMAGE Repository, a suite of analytical software, the
IMAGE Studio, has been developed to facilitate the spatial analysis and modelling of internal
migration by allowing the computation of a range of migration measures (Daras 2014;
Stillwell et al. 2014).
The IMAGE Inventory
Review of internal migration
data collection practice in the
193 UN member states
The IMAGE Repository
Global collection of
population and internal
migration data and GIS
boundaries
The IMAGE Studio
Analytical software to
compute internal migration
measures and address key
methodological issues
3
Figure 1 The IMAGE Project Framework
1.2 The IMAGE Inventory
The IMAGE Inventory is a database for developed for the use by the research community
interested in the study of internal migration that can be downloaded from the IMAGE
website (www.gpem.uq.edu.au/qcpr-image). It is based on findings from the Internal
Migration Around the GlobE project, which established an inventory of internal migration
data collections for the 193 UN member States. The IMAGE Inventory covers three main
sources of internal migration data: population censuses, population registers and
administrative collections, and national sample surveys. It distinguishes data from the latest
two UN census rounds: the 2000 round (1995-2004) and the 2010 round (2005-2014), but
also includes information on a number earlier censuses, particularly for countries which
have not undertaken a recent census. The Inventory was last updated in February 2015.
The content of the IMAGE Inventory has been carefully selected to provide information that
is thought to be of most value to migration scholars. It contains information on the types of
migration data collected, the interval over which migration is measured and the spatial
frameworks employed, but does not attempt to provide an exhaustive list of all data items
in any individual data collection. It is important to recognise that data collection does not
guarantee dissemination. For example, statistical agencies may code and release migration
data at spatial scales other than those used for collection purposes. Moreover, relatively
little data on internal migration is routinely made available in statistical publications or
electronic form, so potential users will often need to inquire further to establish the
availability of items particular data. The IMAGE Inventory essentially represents a first port
of call. Nevertheless, in order to facilitate access data, the IMAGE project has also
established a Repository of internal migration data, which currently holds internal migration
data sets for 135 countries. Access to some data from the IMAGE Repository can be
provided under certain conditions. The Inventory includes links to the IMAGE Repository.
1.3 Outline
This document is a user guide to the IMAGE Inventory and is organised as follows. Section 2
summarises the main impediments to comparing migration between nations. Section 3
summarises current data collection practice in countries around the world. Section 4
discusses the strategy employed to assemble the IMAGE Inventory, with regard to the
characteristics of the migration data selected and the data sources used. Section 5
introduces the content and structure of the Inventory and lists the different files available
for each country and each data source. Finally, Section 6 explains how to access data from
the IMAGE Inventory.
4
2 Impediments to cross-national comparisons of migration
Three main issues stand in the way of effective cross-national comparisons of internal
migration: the multifaceted nature of migration itself; the choice of migration indicators;
and the widespread variation in the type of migration data that are collected. In any
comparative analysis, a crucial first decision concerns the particular aspect of migration to
be explored. Four discrete dimensions of migration can be recognised: intensity, impact,
distance and connectivity (Bell et al. 2002), each of which call for somewhat different forms
of data and methods of analysis. The IMAGE Repository has been assembled to facilitate
comparisons on all these aspects of migration, so an understanding of the four dimensions
of migration, the associated data and the migration indicators is essential to appreciate the
way in which the Repository has been designed.
2.1 Dimensions of migration
Four broad dimensions of internal migration can be recognised, each of which provides
insights into a different aspect of migration at a particular spatial scale. These are:
(1) migration intensity, which indicates the overall level or incidence of migration
within a country;
(2) migration impact, which captures the extent of population redistribution through
migration;
(3) migration distance, which indicates the distance decay associated with population
movement; and
(4) migration connectivity, which reveals the way migration serves to link cities and
regions.
Each of these dimensions can be captured using a number of statistical indicators and each
of these indicators requires somewhat different forms of data. Table 1 lists in summary form
the suite of 15 migration measures proposed by Bell et al. (2002) and sets out the data
required for their computation. Table 1 also indicates which of these measures are
generated in the IMAGE Studio.
For the purposes of discussion, it is useful to identify three broad forms in which migration
data are commonly available:
(1) Origin-destination matrices
Also described as flow matrices, these contain region-to-region migration flows in which,
by convention, rows represent origins and columns represent destinations. The diagonal
element of flow matrices commonly indicates the number of people who changed
residence but remained in the same region at the start and end of the observation,
interval but it may also contain non-movers, or a subset of people who moved between
smaller zones within the region.
(2) Marginal totals
5
In some cases, full origin-destination matrices are not available, but data may be
provided on the aggregate number of arrivals and departures for each region. These
effectively represent the marginal (row and column) totals of a full origin-destination
flow matrix and are also referred to as zonal inflows and outflows. While these
aggregates do not provide information on flows between specific origin-destination
pairs, they can be used to generate aggregate system-wide measures of migration
impact, and are also commonly available disaggregated by age and sex. It is important to
know whether or not the marginal totals include or exclude flows taking place within
regions.
(3) National migration counts
Count data comprise a single figure which indicates the total number of movers or
moves between regions within a country, irrespective of origin and destination. They
may also include information on changes of address that occurred within regions. They
do not provide any information on the origin or destination of flows, but may be
disaggregated by age and sex.
Allied to these three forms of migration data are two other types of information that are
required to compute some of the 15 indicators associated with the four dimensions of
migration listed above. These are:
(1) digital boundaries matching the regions against which migration is recorded, which are
used to compute migration distances, calibrate spatial interaction models and drive the
spatial aggregation facility in the IMAGE Studio, and
(2) populations at risk, which are used to compute migration rates and probabilities.
Table 1 shows how these data combine to generate the various migration metrics. With
respect to intensity measures, for example, the Crude Migration Intensity, which is obtained
by dividing the number of migrants by the population at risk, can be computed with
migration data of any format, because it simply requires the aggregate number of migrants.
This may be directly available in the form of a national migration count, but it can also be
derived by summation from an origin-destination matrix or from marginal totals. Other
intensity measures require migration data disaggregated by age, which may be available in
flow matrices but are more commonly held only in the form of nationwide migration counts
or marginal totals. Migration impact measures relate to individual regions so their
computation requires data on inter-regional flows, which can be obtained either from
origin-destination matrices or marginal totals. Distance measures are generated as Euclidian
distances between the region centroids by the IMAGE Studio, but it is also possible to input
a matrix of distance values assembled independently. Connectivity measures, on the other
hand, require complete origin-destination flow matrices, and cannot be computed from
marginal totals or from count data.
6
Table 1 shows that all measures of impact, distance and connectivity can be generated in
the IMAGE Studio, with the exception of the Migration-Weighted Gini which is excluded
because of the high computational load leading to long processing times. As for measures
of intensity, the IMAGE Studio generates only the Crude Migration Intensity. Other
measures of intensity require migration data disaggregated by age and are not computed in
the IMAGE Studio.
The IMAGE Studio incorporates a spatial aggregation routine which was designed to assist in
generating estimates of migration intensity that are comparable between countries, and to
explore the scale and pattern effects of the Modifiable Areal Unit Problem (MAUP) (Stillwell
et al. 2014). Provided the requisite types and forms of information are available, the Studio
can be employed to generate migration metrics for any size of migration matrix based on a
set of Basic Spatial Units (BSUs).
7
CONNECTIVIY
DISTANCE
IMPACT
INTENSITY
1
ACRONYM
DIMENSIO
N
Table 1 Data needed for computation of migration measures in the IMAGE Studio
MIGRATION MEASURE
Population at
risk
Origin-destination
matrix
●
●
Measures
generated
in the
IMAGE Studio
Crude Migration Intensity
CMI
●
Standardised Migration Intensity
SMI
●
●
Gross Migraproduction Rate
GMR
●
●
Migration Expectancy
ME
●
●
Intensity at Migration Peak
IMP
●
●
Age at Migration Peak
AMP
●
●
Migration Effectiveness Index
MEI
Aggregate Net Migration Rate
ANMR
Median Distance Moved
MD
Mean Distance Moved
MDM
Distance Decay Parameter
b
Index of Migration Connectivity
IMC
●
●
Index of Migration Inequality
IMI
●
●
Migration-Weighted Gini
MWF
●
Coefficient of Variation
ACV
●
●
Theil Index
THEIL
●
●
●
●
DATA REQUIREMENT
Data format
1
National count data
Zonal in and outflows
Total
by age
●
●
●
●
●
●
●
●
+ digital
boundaries
●
+ digital
boundaries
●
+ digital
boundaries
●
●
●
sex-specific measures of intensity can be computed when national count data are disaggregated by sex.
8
2.2 Comparability of migration data
Comparability between countries is complicated by the fact that, irrespective of data
format, migration can be measured in various ways using different instruments ranging from
population registers and administrative records, to censuses and surveys. As a result,
significant variation exists between countries with regard to the type of migration data
collected, the time interval over which migration is measured, and the spatial frameworks
used.
2.3 Type of migration data
Migration can be measured as an event or transition, or by reference to duration of
residence. Event data are usually associated with population registers and are the most
common form of internal migration data available in many European countries. Transition
data measure migration by comparing place of residence at two points in time and are the
type of data most commonly derived from censuses and surveys (Bell et al. 2014). Because
of the way they are measured, events and transitions count different things; population
registers count migrations while censuses count migrants. The difference is important
because transition data fail to capture return and onwards moves that occur within the
observation interval, and therefore undercount the number of migration events. There are
also differences in the treatment of migration among those who are born or die in the
interval, as well as in the inclusion or exclusion of immigrants (Bell and Rees 2006), and
these may vary further between individual countries. The impact of these differences on
overall migration intensities is small over relatively short intervals (Long and Boertlein 1990)
but increases as the observation interval lengthens, and care is also needed to eliminate or
control for variations in population coverage (Boden et al. 1991).
Censuses around the world also commonly collect data on duration of residence in the
current dwelling or locality. By filtering duration data for fixed durations of residence, it is
possible to derive a surrogate estimate of the number of moves that have occurred within a
given interval, comparable to the migration count data commonly derived from events or
transitions. Duration of residence data are also commonly collected in association with
information on previous place of residence, to generate origin-destination matrices that
effectively capture each respondent’s last move. In this instance, duration of residence can
be used as a filter to generate a migration flow matrix, which is broadly comparable to the
conventional migration transition. However, lack of precision in the measurement of
duration and ambiguity in the locality to which it applies necessitate caution in the use of
these data to make cross-national comparisons (Bell et al. 2014).
Table 2 summarises the principal differences between events, transitions, duration and last
move data. It shows that duration and last move data essentially represent a hybrid in terms
of population and migration coverage. They fail to capture multiple migration events that
occur within the observation interval but capture return moves missed by transition data.
9
Despite these measurement differences national count data can be generated from event,
transition, duration or last move data. Origin-destination matrices, zonal inflows and
outflows can be generated from all data types, except when duration data are collected in
isolation from information on previous place of residence.
Table 2 Population coverage of migration flow matrices by data type
Element
Events
Migration
All moves undertaken
within the interval
Population
Individuals in the
population during the
observation interval
Immigrants
Emigrants
Born in
interval
Die during
interval
Included
Included
Transitions
Changes of residence
between the start and end
of the interval
Individuals alive and
resident in the country at
both the beginning and end
of the interval.
Excluded
Excluded
Last Move/Duration
Included
Excluded
Included
Included
Excluded
Excluded
Most recent moves within the
defined duration of residence
Individuals resident in the
country at the end of the
interval.
Included
Excluded
Source: Bell et al. (under review)
2.4 Observation interval
Migration can be measured over a range of observation intervals, which may be of a fixed
(defined) or variable length and the IMAGE Repository incorporates flow matrices pertaining
to these intervals.
Countries which measure migration over a fixed interval commonly use one or five years as
the interval length, but other intervals ranging from two to ten years are also employed (Bell
et al., 2014). Migration data measured over intervals of different length are not readily
comparable due to the effects of chronic and repeat movement. The consequence is that
five-year migration data are not equivalent to five times the one-year migration data, with
empirical evidence showing that the ratio between one and five-year transition rates varies
over time and space. While approximate conversions have been proposed, there is no
straightforward analytical solution to harmonise these data (Kitsul and Philipov 1981;
Rogers et al. 2003; Rogerson 1990). Data on migration events, derived from population
registers and administrative collections commonly refer to a single-year interval.
Some countries measure migration by comparing place of residence with place of birth,
which delivers a measure of lifetime migration, and this in fact is the most common
measure of internal migration collected by censuses worldwide (Bell et al. 2014). Lifetime
migration data provide useful insights into the cumulative impact of migration over a
population’s collective lifetime. However, because individuals have been exposed to
migration for varying periods, differences in age structure prejudice comparability between
10
countries. Moreover, lifetime migration data offer limited insights into contemporary
migration processes.
A third approach to the collection of migration data is based on asking each person’s
previous place of residence (PPR), irrespective of when the migration look place. As noted
above, these data can be filtered by duration of residence, if collected, to generate a
surrogate estimate that approximates a fixed interval transition.
2.5 Spatial framework
Countries also vary widely in regard to the number of spatial units into which they are
divided and which are used to record migration. Some countries record all changes of
address, including those that take place within the same region, but for most it is the change
of address that crosses regional boundaries that is recorded in the migration flow matrix
described earlier. The level at spatial scale at which data are collected, as apparent on the
Census form or other record, does not necessarily correspond to the level at which the data
are subsequently coded or made available. At the same time, migration flow matrices for
the same country, source and time interval may be made available at multiple levels of
aggregation.
3 Review of internal migration data collection practice
Previous sections have highlighted the diversity of ways in which migration is collected and
measured. The IMAGE Inventory covers three main sources of internal migration data:
population censuses, population registers and administrative collections, and national
sample surveys. Five main strategies were used to identify the forms of data on internal
migration collected by individual countries around the world: (1) mining of statistical
organisation websites; (2) review of prior inventories and papers; (3) questionnaire survey
of statistics agencies; (4) analysis of country census and survey forms; and (5) advice from
an international network of scholars. The review process was conducted in 2013 for the 193
UN member states, and resulted in two main outputs. First, a synthesis and assessment of
global data collections was produced (Bell et al. 2014), which provides summary statistics on
the number of countries collecting migration data, the sources used, and the types of
migration data collected. Second, a detailed inventory was assembled, which provides
information on the types of migration data collected for each 193 UN member state. Before
introducing the IMAGE Inventory, the remainder of this section provides an overview of the
findings published in Bell et al. (2014).
The IMAGE survey shows that most countries rely on population censuses to measure
internal migration (158 countries). As shown in Table 3, nationally representative surveys
are also widely used (110 countries), while population registers and administrative data
11
feature in 50 countries and are the dominant collection practice in Europe. Most countries
(109) draw migration statistics from multiple sources.
Table 3 Countries collecting internal migration data since 1995 by region and source
Register
Survey
Multiple
sources
Total countries
collecting data
Total
countries
Africa
43
0
Asia
37
15
Europe
31
32
Latin America
32
0
Northern America
2
2
Oceania
13
1
Total
158
50
Source: IMAGE Inventory; see Bell et al. (2014)
38
24
32
12
2
2
110
31
27
34
12
2
3
109
50
41
41
32
2
13
179
54
47
43
33
2
14
193
Region
Census
Among countries using census-based statistics, lifetime migration based on region of birth is
the most common migration measure worldwide (122 countries), but many countries also
measure migration by reference to last place of residence. A total of 52 countries measure
migration over a five-year interval, whereas 29 countries use a one-year interval. A total of
71 countries collect data on duration of residence at their census, often in association with
place of last residence.
Table 4 Countries collecting internal migration data in the 2000 UN Census round by
region
Type of Data
Observation Period
Other
One
Five year
fixed
Lifetime
year
interval
Africa
9
8
8
29
Asia
2
13
8
27
Europe
13
4
12
25
Latin America
2
17
2
29
Northern America
1
2
0
2
Oceania
2
8
2
10
Total
29
52
32
122
Source: IMAGE Inventory; see Bell et al. (2014)
Region
Last move
13
18
10
12
0
2
55
Duration of
residence
17
24
12
13
0
5
71
Total
countries
collecting
data
32
35
31
29
2
13
142
The review of two large-scale survey programs in developing countries − the USAID’s
Demographic and Health Surveys (DHS) and the World Bank’s Living Standards
Measurement Study (LSMS) − showed that duration of current residence is also commonly
asked, together with place of previous residence. Duration of residence is available for a
total of 60 countries in the DHS and 14 countries in the LSMS. Among developed countries,
the review of the European Union’s Labour Force Surveys and the American Community
12
Survey showed that most countries utilising surveys measure migration by reference to
place of residence one year previously.
Table 5 Countries collecting internal migration data by survey(s) by region
Region
Demographic
and Health
Survey
Africa
38
Asia
18
Europe
3
Latin America and Caribbean
10
Northern America
0
Oceania
1
Total
70
Source: IMAGE Inventory; see Bell et al. (2014)
Living
Standards
Measurement
Survey
2
8
5
4
0
1
20
Other
national
Survey
All surveys
0
8
26
0
2
0
36
38
24
32
12
2
2
110
Population registers and administrative records capture migration as an event (Rees et al.
2000), although it is feasible to generate transition data from comparison of registers at two
points in time. The IMAGE inventory identified 50 nations producing migration statistics
using administrative records or population registers, 32 of them being in Europe.
4 Assembling the IMAGE Inventory
To facilitate access to the findings of this review, a detailed inventory was assembled to
provide information on the types of migration data collected for each of 193 UN member
states. It is important to note that not all data collected are subsequently released and that
the IMAGE Inventory provides information on what is theoretically available. However, the
Inventory also contains information on register-based migration statistics known to be
available.
The IMAGE Inventory contains information on the types of migration data collected, the
interval over which migration is measured and the spatial frameworks employed, but does
not attempt to provide an exhaustive list of all data items in any individual data collection.
This limitation is particularly true in the case of surveys, since many provide information
such as detailed migration histories which cannot be adequately summarised here. While
some information items, such as the types of migration data collected, the interval over
which migration is measured, and the spatial frameworks are common to censuses,
registers and surveys, others are specific to particular data sources. For example,
information on migrant characteristics, including age and sex, are reported only for registers
whereas reasons for moving are reported only for surveys.
13
The IMAGE Inventory endeavours to provide a comprehensive global collection of internal
migration practices. While it provides complete coverage of censuses, population registers
and administrative collections, a full inventory of migration surveys is out of reach. The
inventory focuses mainly on surveys conducted since 1995 that potentially facilitate crossnational comparison, such as the USAID's Demographic and Health Survey, the World Bank's
Living Standards Measurement Study and the European Union Labour Force Surveys.
5 IMAGE Inventory: Files and Content
5.1 Files
The three main sources of migration data - population censuses, population registers and
administrative collections, and national sample surveys – vary markedly in the way they
measure migration. Because differences in the way migration is measured ultimately shapes
the utility of the data (Bell et al. 2014), the IMAGE Inventory has been structured around
three discrete components, one per data source. A fourth component provides a summary
of the findings across the three data sources and is intended to serve as a readily accessible
guide to the types of data available in each country. Reflecting this structure, the IMAGE
Inventory takes the form of four Excel spreadsheets in which rows present unique records,
each pertaining to a particular country for a particular year, and columns sets out the
particular feature of the data collected for each country (e.g. observation interval). These
four Excel components of the Inventory are as follows:
(1) Inventory Overview
The overview file indicates whether a census, register or national survey is conducted in
each country and whether these instruments are used to collected any form of
migration data. This file enables analysts to identify whether migration data are
collected in their country of interest, and from which type of data collection technique.
Note that this file does not contain any information on the type of migration data
collected.
(2) Census Catalogue
This file provides information on migration data collected at the census in each country.
It contains fields which indicate, inter alia, the observation interval and spatial scale at
which the data were collected, as well as general information about the census,
including the date it was held.
(3) Register Catalogue
This file indicates whether population registers or administrative data collections are
maintained in each country and contains information on the types and forms of
migration data are known to be made available. It also indicates whether information is
14
available on migrants characteristic such age and sex, and general information on the
data source, including the name and purpose and coverage.
(4) Survey Catalogue
This file provides information on migration data collected in national surveys. It contains
information, inter alia, on the observation interval and spatial scale used and indicates
whether reasons for moving are collected. It also provides general information on the
survey population and sample size.
5.2 Content
This section describes separately for each file the information held in the Inventory and
indicates how each record is displayed and organised.
5.2.1
Inventory Overview
For ease of reading, information on censuses, registers and surveys are held under different
tabs in the Excel spreadsheet. For each record, 4 fields related to censuses, 3 fields to
registers and four fields to surveys. Table 7 names and describes the contents of each field
and the values it can assume. Most registers have been continuously maintained for long
period of times and allow production of migration statistics annually, so no particular year
has been reported for registers. This is in contrast with censuses and surveys, which are
typically held in a particular year. While registers and administrative sources typically collect
information on place of residence, it does not guarantee that migration data are
subsequently made available. For that reason, the migration data field specifies whether
migration data from registers are known to available, whereas for censuses and surveys it
indicates whether migration data are collected. Users can sort the data by country, or any
other field of their choice, but cannot edit the content of the spreadsheet.
Table 7 Fields in the IMAGE Overview
Register
Census
Tab
Field
Description
Values
1
Country
Country for which the information is held
-
Country name
2
Census
Was a census held at this census round?
-
Yes
No
Do not know
3
Census year
Year the census was held
-
Year
Yes
No
Do not know
Not applicable
4
Migration data
Are migration data collected at the census?
-
1
Country
Country for which the information is held
-
Country name
Register
Are internal migration data collected by a
register or administrative dataset?
-
Yes
No
Do not know
2
15
Survey
3
5.2.2
Register name
Name of the register or administrative
collection
-
Name of the register or
administrative records
Not applicable
1
Country
Country for which the information is held
-
Country name
2
Survey name
Name of the survey
-
Survey name
3
Year
Year the survey was held
-
Year
4
Migration data
Are internal migration data collected in the
survey?
-
Yes
No
Do not know (
Census Catalogue
For each record, the key features of the migration data are set out in a series of 24 discrete
fields (field 4 to 27). An additional 7 fields (fields 1 to 3 and field 28 to 31) present the
characteristics of the census, and one field indicates whether the collected data is available
in the IMAGE Repository (field 31). Table 8 names and describes the contents of each field
and the values it can assume. Because migration can be measured over different intervals,
the Inventory specifies whether migration data are measured over one-year interval (field 4
to 7) or a five-year interval (fields 8 to 11), which are the most common fixed intervals. It
also indicates whether another fixed interval is used (field 12), and if so it specifies the
length of the interval in field 13. Migration data collected without reference to a particular
interval are listed in field 21 to 24. Data on duration of residence and place of birth are also
reported in fields 17 to 20 and 25 to 27, respectively. Some fields are specific to a particular
type of migration data, whereas others are duplicated across all migration measures. While
most fields are self-explanatory some elaboration in regard to particular fields may be useful.
All changes of address
This field indicates wether information on all changes of address is collected in relation to
place of previous residence. It is reported for each observation interval (one- and five- year
interval, other fixed interval, and no interval) and for duration of residence. Data on all
changes of address, irrespective of distance and regional boundary crossing, enable analysts
to compute migration measures that are directly comparable across countries (Bell et al.
2002; Long et al. 1988). It is important to note that while all changes of address may have
been collected for migration measured over a particular interval, it may well not be case for
another interval. For instance, at its 2010 census Japan collected duration of residence for
all changes of address, but collected town or village of residence five years ago.
Spatial units
This field specifies the name of the smallest spatial unit used to collect place of previous
residence. It is reported for one- and five- year interval, other fixed interval, and no interval
data duration of residence and place of birth. For the same record, the smallest spatial unit
16
used to collect a particular type of migration may differ to that used to collect another type
of migration. For instance, at its 2006 census, Canada collected municipality of residence
one and five years ago, but collected region of birth.
Number of spatial units for OD matrix
Because data collection does not guarantee dissemination, this field indicates the smallest
spatial unit for which an origin-destination matrix is known to be available and specifies the
number of spatial units. This field is available for place of previous residence one and five
years ago, duration of residence and place of birth. In most instances, the spatial unit used
to disseminate flow matrices will be different from the smallest unit used for collection
purposes.
Duration question
Important variations exist between countries in the way data on duration of residence is
collected. This field specifies if duration of residence is collected based on year of arrival,
year and moth of arrival, or period of residence in years, in years and months, or in predefined duration intervals. Duration of residence derived from date of arrival and period of
residence are not directly comparable, and care is therefore needed when comparing
duration of residence across countries or over time.
Previous place of residence – no interval
This field indicates whether information on previous place of residence, irrespective of
when migration took place, is collected. As noted earlier, these data can be filtered by
duration of residence (field 17) to generate a surrogate estimate that approximates fixed
interval transitions.
Table 8 Fields in the Census Catalogue
One-year interval
Migration data
Background
information
Field
Description
Country for which the information is
held
Values
-
Country name
-
Year
-
Yes
No
Do not know
Yes
No
Do not know
Yes
No
Do not know
Not applicable
1
Country
2
Census year
Year the census was held
3
Migration data
Are migration data collected at the
census?
4
Previous place of Residence
- 1 year
Is place of residence a year ago
collected?
5
All changes of address - 1
year
Is information on all changes of
address one year ago collected?
17
Five-year interval
Other fixed interval
Duration of residence
6
Spatial units - 1 year
Name of the smallest spatial unit for
which place of residence one year ago
is collected
7
Spatial units for OD matrix
- 1 year
Smallest spatial unit for which an
origin-destination matrix is available
8
Previous place of Residence
– 5 years
Is place of residence five years ago
collected?
9
All changes of address -5
years
Is information on all changes of
address five years ago collected?
10
Spatial units - 5 years
Name of the smallest spatial unit for
which place of residence five years ago
is collected
11
Number of spatial units for
OD matrix - 5 years
Smallest spatial unit for which an
origin-destination matrix is available
12
Previous place of residence
– other
Is place of residence at another
interval collected?
13
Previous place of residence
interval – other
Interval used to collect previous place
of residence
14
All changes of addressother
Is information on all changes of
address for this interval collected?
15
Spatial units - other
Name of the smallest spatial unit for
which place of residence for this
interval is collected
16
Number of spatial units for
OD matrix - other
Smallest spatial unit for which an
origin-destination matrix is available
17
Duration of residence
Is duration of residence collected?
-
18
Duration question
How is duration of residence
collected?
19
All changes of address duration
Is information on all changes of
address collected?
20
Spatial units – duration
Name of the smallest spatial unit for
which place of residence is collected
-
Name of the spatial unit
Do not know
Not applicable
Number of spatial units
Do not know
Not applicable
Yes
No
Do not know
Yes
No
Do not know
Not applicable
Name of the spatial unit
Do not know
Not applicable
Number of spatial units
Do not know
Not applicable
Yes
No
Do not know
Interval
Do not know
Not applicable
Yes
No
Do not know
Not applicable
Name of the spatial unit
Do not know
Not applicable
Number of spatial units
Do not know
Not applicable
Yes
No
Do not know
Duration in years and
months (DYM)
Duration n years (DY)
Pre-defined duration
intervals (DOI)
Year and month of arrival
(YMOA)
Year of arrival (YOA)
Do not know
Not applicable
Yes
No
Do not know
Not applicable
Name of the spatial unit
Do not know
Not applicable
18
No interval
Place of birth
General information
5.2.3
21
Previous place of
residence- no interval
Is information on previous place of
residence without reference to any
date collected?
22
All changes of address -previous residence
Is information on all changes of
address collected?
23
Spatial units – previous
residence
Name of the smallest spatial unit for
which place of residence is collected
24
Number of zonal units for
OD matrix – previous
residence
Smallest spatial unit for which an
origin-destination matrix is available
25
Birth place
Is place of birth collected?
26
Spatial units – birth place
Name of the smallest spatial unit for
which place of birth is collected
27
Number of zonal units for
OD matrix – birth place
Smallest spatial unit for which an
origin-destination matrix is available
28
Source
Source of the information
29
Latest census
Is this the latest census?
30
Counted In Census
Date the census was held
31
IMAGE Repository
Is migration data from this census held
in the IMAGE Repository?
-
Yes
No
Do not know
Yes
No
Do not know
Not applicable
Name of the spatial unit
Do not know
Not applicable
Number of spatial units
Do not know
Not applicable
Yes
No
Do not know
Name of the spatial unit
Do not know
Not applicable
Number of spatial units
Do not know
Not applicable
-
source
-
Yes
No
Do not know
Date
Do not know
-
Yes
No
Register Catalogue
For each record, 5 fields specify the features of the administrative collection and 34 fields
describe the characteristics of the migration data known to be available. Of the 53 countries
maintaining a population register or administrative datasets, 33 are known to make
migration statistics available. Table 9 names and describes the contents of each field and
the values it can assume. As noted in Section 2, each of the 15 migration measures call for
specific data format (Bell et al. 2002), so the data format field indicates wether migration
data are held in the form of origin-destination flow matrices, marginal totals capturing total
arrivals and departures, or national counts of all moves. Some countries publish registerbased migration statistics using a range of formats (national count, marginal totals or origindestination matrix) and spatial units for different years. For example, Bulgaria releases both
origin-destination matrix between and marginal totals between 28 administrative units and
marginal totals for 264 administrative units. Because migration data can be made available
in a range of formats, fields 6 to 14 are replicated 4 times.
19
Table 9 Fields in the Register Catalogue
Migration data available
Background Information
Field
1
Country
2
Register
3
Register name
Name of the register or
administrative collection
Values
-
Country name
-
Yes
No
Do not know
Name of the register or
administrative records
Do not know
Population register
Administrative dataset
Do not know
Population coverage
Do not know
Calendar year
Other (specify)
Do not know
Yes
No
Do not know
4
Collection type
Type of data collection
5
Population coverage
Persons included in the register
6
Observation interval
Interval over which migration data is
collected
7
All changes of address
Is information on all changes of
address available?
8
Spatial unit name
Name of the smallest spatial unit for
which place of residence is available
-
Name of the spatial unit
9
Spatial unit number
Smallest spatial unit (number) for
which place of residence is available
-
Number of spatial units
10
Data format
Format in which migration data is
available
11
Age
Is age available?
-
Count data
Marginal totals
Flow matrix
Yes (1)
No (0)
Do not know (DK)
12
Age groups
Groups in which age is available
-
Age groups
13
Sex
Is sex available?
-
Yes (1)
No (0)
Do not know (DK)
14
Years
Years for which the data are
available
-
Years
...
...
39
5.2.4
Description
Country for which the information is
held
Are internal migration data collected
by a register or administrative
dataset?
IMAGE Repository
...
Is migration data from this register
held in the IMAGE Repository?
...
-
Yes
No
Survey Catalogue
For each record, 30 fields specify the features of the migration data available and provide
general information about the survey. Most fields are similar to those in the Census
Inventory. Two fields are specific to surveys: reasons for moving (field 22) and movements
between rural and urban areas (field 24). Table 10 names and describes the contents of
each field and the values it can assume.
20
Table 10 Fields in the Survey Catalogue
Migration data
Background information
Field
Description
Country for which the information is
held
1
Country
2
Survey Name
Name of the survey
3
Year
Year the survey was held
4
Migration data
Is migration data collected in this
survey?
5
Previous place of residence
Is place of residence at a fixed interval
collected?
6
Fixed interval
Interval used to collect previous place
of residence
7
All changes of addressfixed interval
Is information on all changes of
address available?
8
Spatial unit - fixed interval
Name of the smallest spatial unit for
which place of previous residence is
collected
9
Previous place Residence –
other
Is place of residence at another fixed
interval collected?
10
Other fixed interval
Interval used to collect previous place
of residence
11
All changes of addressother fixed interval
Is information on all changes of
address available?
12
Spatial unit - other fixed
interval
Name of the smallest spatial unit for
which place of previous residence is
collected
13
Duration of residence
Is duration of residence collected?
14
All changes of address duration
Is information on all changes of
address collected?
15
Spatial unit - duration
16
Previous residence- no
interval
17
All changes of address -previous residence
Is information on all changes of
address collected?
18
spatial unit – previous
residence
19
Birth place
Values
-
Country name
-
Name
No known survey
Year
Do not known
Not applicable
Yes
No
Do not know
Yes
No
Do not know
Interval as specified in
the census form
Yes
No
Do not know
-
Name of the spatial unit
Do not know
-
Yes
No
Do not know
Interval as specified in
the census form
Yes
No
Do not know
-
Name of the spatial unit
Do not know
-
Yes
No
Do not know
Yes
No
Do not know
-
Name of the spatial unit
Do not know
-
Yes
No
Do not know
Yes
No
Do not know
Name of the smallest spatial unit for
which place of previous residence is
collected
-
Name of the spatial unit
Do not know
Is place of birth collected?
-
Yes
No
Do not know
Name of the smallest spatial unit for
which duration of residence is
collected
Is information on previous place of
residence without reference to any
date collected?
21
General Information
20
Spatial units – birth place
Name of the smallest spatial unit for
which place of birth is collected
-
Name of the spatial unit
Do not know
21
Number spatial unit – birth
place
Number of smallest spatial units for
which place of birth is collected
22
Reasons for moving
Are reasons for moving collected?
-
Name of the spatial unit
Do not know
Yes
No
Do not know
23
Code frame
-
code frame
24
Rural-urban movement
-
Yes
Do not know
25
Additional waves
Are there additional waves to the
survey?
26
Survey population
Population studied in the survey
-
Yes
No
Do not know
Population
Do not know
27
Sample
Size of the survey sample
-
Sample size
Do not know
28
Source
Source of the information
-
Source
29
Comments
Additional information on migration
data collected
-
comment
30
IMAGE Repository
Is migration data from this survey held
in the IMAGE Repository?
-
Yes
No
What is the code frame used to collect
reasons for moving?
Is any information on movement
between rural and urban areas
collected?
6 Access to the IMAGE Inventory
The IMAGE Inventory can be accessed directly on the IMAGE Project webpage
(www.gpem.uq.edu.au/qcpr-image). The four components of the Inventory (Inventory
Overview, Census Inventory, Register Inventory and Survey Inventory) can be downloaded
as separate Excel documents. These are being made freely available to the research
community, but we ask that publications and reports which drawn on or utilise data from
these workbooks to acknowledge the IMAGE Inventory by citing the user guide as follows:
Bell, M., Bernard, A., Ueffing, P., and Charles-Edwards E. (2015), The IMAGE Inventory: A
User Guide. Queensland Centre for Population Research Working Paper Series, No 2015/01,
The University of Queensland, www.gpem.uq.edu.au/qcpr-image
Notwithstanding the best efforts of the IMAGE team in assembling the Inventory, it is
inevitable that some inaccuracies and omissions may occur. The information contained in
the spreadsheets is provided in good faith but the IMAGE team and the University of
Queensland accept no responsibility for any decisions taken or not taken on the basis of the
22
information provided in the Inventory. The IMAGE team would be grateful for any
comments on the Inventory and notification of any corrections, which should be emailed to
[email protected].
In order to facilitate access data, the IMAGE project has also established a Repository of
internal migration data, which currently holds internal migration data sets for 135 countries.
A
guide
to
the
IMAGE
Repository
(http://www.gpem.uq.edu.au/qcprdocs/ImageRepositoryUserGuide.pdf) and a catalogue of data holdings can also be found on
the IMAGE Project webpage (www.gpem.uq.edu.au/qcpr-image). Access to some data from
the IMAGE Repository can be provided under certain conditions.
23
References
Bell, Martin and Rees, P (2006), 'Comparing migration in Britain and Australia: harmonisation
through use of age-time plans', Environment and Planning A, 38 (50), 959-88.
Bell, Martin, et al. (2014), 'Internal Migration Data Around the World: Assessing Contemporary
Practice', Population, Space and Place.
--- (under review), 'Internal migration and development: comparing migration intensities around the
world', Population, Space and Place
Bell, Martin, et al. (2002), 'Cross-national comparison of internal migration: issues and measures',
Journal of the Royal Statistical Society: Series A (Statistics in Society), 165 (3), 435-64.
Boden, P, Stillwell, J, and Rees, P (1991), Internal migration projection in England: the OPCS/DOE
model examined (Migration Models: Macro and Micro Approaches; London: Belhaven).
Daras, K. (2014), 'IMAGE Studio 1.1 User Manual', Working Paper (University of Leeds).
Kitsul, P and Philipov, D (1981), 'The One-Year-Five-Year Migration Problem', Advances in
Multiregional Demography, Research Report 81-6 (Laxenburg, Austria: International Institute
for Applied Systems Analysis).
Long, L. and Boertlein, C.G. (1990), 'Comparing migration measures having different intervals',
Current Population Reports, Series P-23 (Washington DC: US Bureau of Census), 1-11.
Long, L., Tucker, C.J., and Urton, W.L. (1988), 'Migration distances: An international comparison',
Demography, 25 (4), 633-40.
Rees, Philip, et al. (2000), 'Problems and solutions in the measurement of migration intensities:
Australia and Britain compared', Population Studies, 54 (2), 207-22.
Rogers, A, Raymer, J, and Newbold, K B (2003), 'Reconciling and translating migration data collected
over time intervals of differing widths', The Annals of Regional Science, 37 (4), 581-601.
Rogerson, P.A. (1990), 'Migration analysis using data with time intervals of differing widths', Papers
of the Regional Science Association, 68, 97-106.
Stillwell, John, et al. (2014), 'The IMAGE studio: a tool for internal migration analysis and modelling',
Applied Spatial Analysis and Policy, 7 (1), 5-23.
24