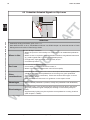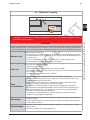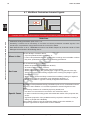
1
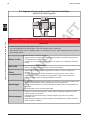
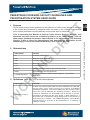
PEDESTRIAN CROSSING FACILITY GUIDELINES AND PRIORITISATION SYSTEM USER GUIDE AF This technical note provides guidance on the selection of traffic control devices to be used in the control and protection of pedestrian traffic on roads. It also outlines a prioritisation tool to assess pedestrian crossing difficulty and prioritise sites for treatment. 2 Abbreviations DR Prior to amending the Manual of Uniform Traffic Control Devices (MUTCD), this document has been issued as a technical guideline in the TRUM Manual. This will allow further feedback and iterative improvements to the methodology. The Executive Director (Traffic & Road Use Management) has approved the application of this methodology, in lieu of the numerical warrants in Part 10 of the MUTCD. Full title AS Australian Standard ASD Approach Sight Distance CSD Crossing Sight Distance EAU Equivalent Adult Unit RK IN LOS G Abbreviation Level of Service MUTCD Manual of Uniform Traffic Control Devices (QLD) RP&D Road Planning and Design Manual TORUM Regulation Transport Operations (Road Use Management – Road Rules) Regulation 3 Definitions (refer MUTCD for full descriptions) O Expression W Children's Crossing Definition An area of a road at a place with stop lines marked on the road with official traffic signs (flags) bearing the legend ‘CHILDREN CROSSING’ displayed. Two red and white posts are erected on each side of the road to delineate the crossing boundary. Where the crossing is supervised, an official traffic sign in the form of a handheld banner inscribed with the word ‘STOP’ in black lettering on a fluorescent red or fluorescent orange background is held across or partly across the roadway. The TORUM Regulation (Road Rules) requires drivers to give way to any pedestrian on or entering a children's crossing. 3.13 UNCONTROLLED COPY WHEN DOWNLOADED FROM THE WEB T 1 Purpose 2 Definition Mid-Block pedestrian actuated traffic signals A signal installation (other than at an intersection) at which a pedestrian initiates a change of signal phasing (a pedestrian phase), usually by pressing a button. The TORUM Regulation (Road Rules) requires drivers to stop at red traffic signals. Pedestrian Includes any person walking, running, standing or sitting on a road or persons in a toy vehicle, a pram or in a mobility device not capable of exceeding 10 km/h. Dismounted cyclists are also included. Pedestrian refuge An island provided as a staging area for pedestrians crossing a road. Signalised intersection with pedestrian actuated traffic signals A signal installation at an intersection at which a pedestrian initiates a change of signal phasing (a phase including a pedestrian phase), usually by pressing a button. In addition to requiring motorists to stop at red traffic signals, the TORUM Regulation (Road Rules) also requires turning vehicles to give way to pedestrians on side streets and slip lanes at any intersection. Zebra crossing An area of roadway delineated by white stripes across the full width of roadway approximately parallel to the centre of the roadway, together with associated pedestrian crossing and advance warning signs displayed to vehicular traffic. The TORUM Regulation (Road Rules) requires drivers to give way to any pedestrian on a zebra crossing. DR AF T Expression 4 Background IN G The implementation of pedestrian facilities is not an easy task given the diverse characteristics of pedestrians and motorists. Issues such as the variation in pedestrian walking speeds, the needs of pedestrians with a disability and the willingness of pedestrians and motorists to take risks in order to save time, all contribute to the complexity of selecting an appropriate pedestrian facility. These guidelines should be used to assist in exercising judgment and not as a substitute for it. They are intended to assist assessors in ensuring that the major relevant factors have been considered in the selection process. Where quantitative limits are recommended, they are intended as a guide only and are no substitute for common sense and judgment based on local knowledge and past experience. RK UNCONTROLLED COPY WHEN DOWNLOADED FROM THE WEB 3.13 Issue: 22/3/2010 These guidelines were prepared following a broad consultation process with Main Roads district offices, local government and community groups following identification of a need to review the current pedestrian guidelines included in the Manual of Uniform Traffic Control Devices (MUTCD). W O This amendment is the result of extensive research of measures of pedestrian and vehicular flow characteristics, crash performance, road network performance and other relevant attributes. It provides a rational, defensible mechanism for the implementation, replacement and removal of pedestrian facilities through the state. This guideline outlines a priority system for the allocation of points to these attributes according to the characteristics of the selected site. This allows for quantification of the pedestrian crossing difficulty. The system encompasses Pedestrian Facility Guidelines and Prioritisation Points System (Excel Spreadsheet), for the evaluation of a potential crossing site, as follows: Pedestrian Facility Guidelines Table 1 to Table 9 included in this User Guide Traffic & Road Use Management Manual - Pedestrian Crossing Facility Guidelines & Prioritisation System User Guide Issue: 22/3/2010 3 Pedestrian Facility Prioritisation Workbook - Excel Spreadsheet Description Title sheet The title sheet provides space for the user to document the site location and other details. T Data input 2 AF Data input 1 Traffic and pedestrian volume data. This sheet allows the user to input pedestrian and traffic volumes. Considerations for small community expectations, special allowances for pedestrians with disabilities, medians and walking speed can also be specified. Road environment factors: • Crash history • Sight distance • Distance to alternative crossing • Road network factors Background calculations are processed for crossings where the crossing manoeuvre is staged (e.g. at a pedestrian refuge island). Calculation (Full crossing) Background calculations are processed for crossings where the pedestrian crosses in a single manoeuvre. Results Results for all facility types are presented. The practitioner must make a decision on the most appropriate facility for the location based on the point system and the pedestrian guidelines. Reference tables (1,2 & 3) These are the various tables used by the formulae and macros in the workbook, including pre-calculated values of times between suitable gaps with given flows and crossing distances. G DR Calculation (Half crossing) IN purpose of this document is to guide practitioners on the use of the excel The spreadsheet and guidelines, and to provide clarification regarding values, tables and RK simulations used for the development of the point system. Although the explanations contained in this user guide might seem complex, the input of values into the worksheet is quite simple and easy to understand. However, it is important that the practitioner understands the rationale behind the calculations and results. Shaded boxes like this throughout the user guide provide background technical information to assist with this understanding. 5 Prioritisation Point System O 5.1 Pedestrian Level of Service W This worksheet evaluates the difficulty of the crossing task at a site where pedestrians have to give way to traffic. It includes general information regarding the characteristics of a potential site for implementation of a pedestrian facility, such as walking distance, walking speed, number of traffic lanes or presence of median or refuge. The worksheet includes definitions and explanations of the information and data to be collected for the evaluation of a crossing site. The level of service (LOS), as defined in this document, is an indicator of the difficulty of the crossing task. It is based on the time a pedestrian needs to wait to cross the road or the average time between gaps in the traffic flow that would allow pedestrians to cross the road safely. Traffic & Road Use Management Manual - Pedestrian Crossing Facility Guidelines & Prioritisation System User Guide 3.13 UNCONTROLLED COPY WHEN DOWNLOADED FROM THE WEB Name 4 Issue: 22/3/2010 The length of a suitable gap is calculated from the distance pedestrians have to walk while exposed to traffic and the speed at which they walk plus an allowance for reaction time and a safety margin of three seconds. Generally a crossing speed of 1.2m/s is recommended; however 1.0m/s may be used where elderly or pedestrians with a disability are present or pedestrian crowding is likely to reduce the walking speed. If the crossing is in two parts (for example with a refuge or median) then two parts of the crossing should be considered separately. T 3.13 The time between suitable gaps can then be calculated based on the length of the gap, the traffic volume and the number of trafficable lanes. AF DR suitable gap in the traffic appears will wait for little or no time. Those who arrive just after a previous gap in the traffic will wait for the full time between gaps. The average time pedestrians will need to wait will be equal to approximately half the time between suitable gaps because of the randomness of pedestrian arrivals. G However, due to the random nature of the traffic flow, the time between gaps is also quite variable. The calculation is based on the average time between gaps, but some gaps will be much closer and some much further apart than the average. The 95th percentile time between gaps is about double the average time. The average pedestrian has to wait only half the average time between gaps, but a few pedestrians (those who are unlucky enough just to miss a gap at a time when by chance there is a long delay to the next gap) may have to wait double this time or even longer. This variability in the waiting time is taken into consideration when the delay thresholds for the various LOS categories were defined. RK IN For simple cases, such as uninterrupted traffic flows (refer to Section 5.1.1), values for the average time between suitable gaps are built into the tables in the worksheet, for given traffic flows and crossing widths. These values have been derived from a microscopic simulation model spreadsheet. The model evaluates the headways of 1000 vehicles, according to a given traffic flow and number of traffic lanes at a particular location. The model identifies and counts the suitable gaps in the traffic during a one-hour operation. The model also provides the 85th and 95th percentile time between gaps that can be used to ascertain the worst-case delay scenario. For more complex cases of uninterrupted flow, data from other sources can be used (e.g. site observation or from another model). For interrupted flows (sites near traffic signals), the average time between gaps must be measured or calculated. O UNCONTROLLED COPY WHEN DOWNLOADED FROM THE WEB pedestrians arrive randomly when crossing a road, they will have to wait less Because than the average time between suitable gaps to cross. Those who arrive just before a W Pedestrian LOS is the most important factor in the points system. Points have been allocated for each LOS based on the difficulty of the crossing task and the period of time a pedestrian needs to wait for a suitable gap to be able to cross a road. Pedestrian LOS ranges from LOS A – extremely easy to cross the road to LOS F - extremely difficult to cross the road. Tables 1 and 2 define LOS in terms of average time between suitable gaps. A crossing with LOS C would indicate that pedestrians could cross the road with a reasonable degree of comfort. LOS D indicates that pedestrians would experience some degree of difficulty. LOS E would indicate that the time between suitable gaps was unsatisfactory and most pedestrians would have considerable difficulty crossing the road. Remedial action, to facilitate the crossing task, would usually only be considered for sites with LOS D - F. A site with LOS E or F would be given priority for treatment over sites with Traffic & Road Use Management Manual - Pedestrian Crossing Facility Guidelines & Prioritisation System User Guide Issue: 22/3/2010 5 LOS D. The points system provides a more graduated approach and ensures that other relevant factors are considered. Times for LOS with interrupted and uninterrupted flows are expressed as the average time (in seconds), between available gaps for pedestrians to cross a road. 5.1.1 LOS for Uninterrupted and Interrupted Flows T Table 1 is used to evaluate the LOS at sites with uninterrupted traffic flows. This applies to sites where traffic arrives in a purely random manner. AF Table 2 is used for sites with interrupted flows. This applies when traffic upstream of the site is interrupted in a regular, cyclic manner by traffic signals or other traffic control device. 3.13 pedestrians are aware that the traffic signal nearby will eventually stop the traffic flow, As providing good crossing opportunities, they are willing to wait longer for a suitable gap to Table 1: Pedestrian Level of Service for Uninterrupted Traffic Flows Average time between suitable LOS Classification gaps (s) A Excellent 10 - 20 B Very Good 20 - 30 C Satisfactory 30 - 40 D Some concern 40 - 80 E Major Concern F Unsatisfactory IN RK O W > 80 Pedestrian are able to cross almost immediately upon arrival at the crossing point. Most pedestrians are able to cross with little delay. - Average ped delay ≤ 10 sec, - 95-percentile worst case delay ≈ 40 seconds. Most pedestrians are able to cross within an acceptable period. - Average ped delay ≤ 15 sec, - 95-percentile worst case delay ≈ 60 seconds. Some pedestrians have to wait longer than desirable for a gap. - Average ped delay ≤ 20 sec, - 95-percentile worst case delay ≈ 80 seconds. Most pedestrians have to wait longer than desirable for a gap. - Average ped delay ≤ 40 sec, - 95-percentile worst case delay ≈ 160 seconds. Most pedestrians have to wait longer than acceptable for a gap. - Average ped delay > 40 sec. G <10 Description Traffic & Road Use Management Manual - Pedestrian Crossing Facility Guidelines & Prioritisation System User Guide UNCONTROLLED COPY WHEN DOWNLOADED FROM THE WEB DR cross the road. Therefore, average times between gaps for each LOS are longer for interrupted flows than for uninterrupted flows. 6 Issue: 22/3/2010 Table 2: Pedestrian Level of Service for Interrupted Traffic Flows Average time between suitable LOS gaps (s) B Very Good 30 - 60 C Satisfactory 60 - 100 D Some concern 100 - 150 E Major Concern >150 F Unsatisfactory T 15 - 30 Pedestrian are able to cross almost immediately upon arrival at the crossing point. Most pedestrians are able to cross with little delay. - Average ped delay ≤ 15 sec, - 95-percentile worst case delay ≈ 60 seconds. Most pedestrians are able to cross within an acceptable period. - Average ped delay ≤ 30 sec, - 95-percentile worst case delay ≈ 120 seconds. Some pedestrians have to wait longer than desirable for a gap. - Average ped delay ≤ 50 sec, - 95-percentile worst case delay ≈ 200 seconds. Most pedestrians have to wait longer than desirable for a gap. - Average ped delay ≤ 75 sec, - 95-percentile worst case delay ≈ 300 seconds. Most pedestrians have to wait longer than acceptable for a gap. - Average ped delay > 75 sec. AF Excellent DR A Description G < 15 IN For evaluation of simple cases of potential crossing sites (e.g. uninterrupted flows), the average time between acceptable gaps can be determined based on traffic flows and crossing distances provided by the tables supplied in the worksheet. For more complex cases (including interrupted flows) the average time between acceptable gaps needs to be surveyed at the site. 5.1.2 LOS Point Allocation RK Using the LOS established in Tables 1 or 2, points are allocated from the following tables depending upon whether the site is located in Brisbane (and other major regional centres) or a small community. Brisbane and other major regional centres: LOS A B C D E F Points -1 1 3 5 8 11 LOS A B C D E F Points -1 1 4 7 10 12 O UNCONTROLLED COPY WHEN DOWNLOADED FROM THE WEB 3.13 Classification W Small communities: values have been assigned so that an LOS F will not, on its own, justify mid block These signals. Additional points from pedestrian volumes, crash history and/or other site environmental factors will be necessary in order to reach the threshold score for midblock traffic signals. The points allocated are subject to calibration of the system, to ensure the outcomes are reasonable. Fewer points are assigned to LOS C and above in Brisbane and other major regional centres, in recognition that pedestrians in these busier locations have an expectation of longer delays. Traffic & Road Use Management Manual - Pedestrian Crossing Facility Guidelines & Prioritisation System User Guide Issue: 22/3/2010 7 5.2 Pedestrian Volumes Additional points are allocated to take account of the number of pedestrians utilising the crossing as follows. 5.2.1 Pedestrian Equivalent Adult Units T Pedestrian volumes from existing sites are converted to equivalent adult units (EAU) as shown in Table 3. This allows higher weightings to be given to sites with significant numbers of vulnerable pedestrians, such as children, or pedestrians with a disability. Pedestrian volumes for sites without pedestrian provisions or with inadequate pedestrian provisions should be estimated to allow for suppressed pedestrian demand. AF Suppressed pedestrian demand should be considered where: 3.13 • Pedestrians currently experience considerable difficulty crossing (LOS ≥ D); or Where no current crossing facility exists, pedestrians crossing within 50m of the proposed location should be considered. In locations where a significant number of cyclists cross the road, each dismounted cyclist can be counted as 1 EAU. Mounted cyclists find the crossing task easier than pedestrians, as they travel significantly faster and therefore require a shorter gap in the traffic. Pedestrians Children (under 12 years) No. of Peds/hour* Factor X 2.0 = Persons with a disability X 5.0 = Adults X 1.0 = RK Total EAU per hour EAU X 2.0 = IN Elderly (over 65 years) G Table 3: Equivalent Adult Units (EAU) calculation * Use the same one hour period used to assess LOS. If the pedestrian flows peak at a different time from the traffic flows, determine LOS and pedestrian volume points for both periods separately and use the higher score. Refer to the shaded box on page 8. 5.2.2 Pedestrian Volume Points O Using the pedestrian volumes established in Table 3, points are allocated from the following tables depending upon whether the site is located in Brisbane (and other major regional centres) or a small community. A more generous scale is used to allocate additional points to allow for community expectations in small communities. W Brisbane and other major regional centres: Pedestrian Volume per hour (EAU) 0 -20 20 - 60 Points -2 0 1 Pedestrian Volume per hour (EAU) 0 -10 10 - 40 40 - 80 Points -2 0 1 60 - 120 120 - 180 180 - 240 240 - 300 2 3 4 > 300 5 Small Community: 80 - 120 120 - 160 160 - 200 2 3 4 > 200 5 Traffic & Road Use Management Manual - Pedestrian Crossing Facility Guidelines & Prioritisation System User Guide UNCONTROLLED COPY WHEN DOWNLOADED FROM THE WEB DR • The presence of facilities such as schools, shops or train stations are likely to result in a significant number of additional pedestrians who would normally cross if a provision was provided. 8 Issue: 22/3/2010 Further points can be included, if an additional allowance (adjustment factor) is required for pedestrians with disabilities as shown below. ‘Some’ allowance will increase actual pedestrian numbers by 25%; ‘Full’ allowance will increase numbers by 50%. Some Additional Allowance Full Additional Allowance 1 1.25 1.5 Adjustment factor 3.13 T No Additional Allowance 5.2.3 Duration of Pedestrian and Traffic Volumes 2 hours 3 hours Points 0 1 2 AF 1 hour 4 hours >4 hours 3 4 DR Flow Duration The worksheet calculates points for LOS and pedestrian volume for each high-level pedestrian/traffic flow hour input in the worksheet. and traffic volumes might peak at different times of the day. It is necessary to Pedestrian identify high-level traffic and pedestrian flow periods throughout the day, input the values G in the worksheet and assess which combination (or combinations) provides the highest point score. IN For example, if the highest combined scores are 8 and 8 (2 hour-periods) (worksheet 2 potential ped volume points + potential ped LOS points), the number of extended hours of high pedestrian/traffic volumes is 2. The table indicates that, for 2 hours of extended duration of pedestrians and traffic flows, 1 point should be added to the general score. Note that if the highest scores are very close, e.g. 8, 8 and 9 (1 point difference between results), the three high-flow periods (3 hours) should be considered and the relevant points allocated, from the table, to the general score (in this case, 2 points for 3 hours). RK UNCONTROLLED COPY WHEN DOWNLOADED FROM THE WEB Additional points are allocated to take account of the duration of high-level traffic and pedestrian flows. Flow data should be provided for both peak traffic and peak pedestrian hours (as demonstrated in the shaded box below). Up to 5 time periods are allowed in the worksheet. 5.3 Road Environmental Factors O 5.3.1 Crash History W Crash points are allocated to take account of the crash history at the proposed site. Determine the average number of pedestrian related crashes per year resulting in either injury or fatality to the pedestrian or vehicle occupant, over the previous three years. This should include pedestrian related crashes within 50m of the proposed crossing site. Pedestrian related crashes also include rear end crashes resulting in injury, where the crash is a consequence of the leading vehicle stopping for a pedestrian. Points are allocated as indicated below: Pedestrian Crashes in the past 3 Years 0 1 2 3 >3 Points 0 1 3 6 12 Traffic & Road Use Management Manual - Pedestrian Crossing Facility Guidelines & Prioritisation System User Guide Issue: 22/3/2010 9 Crashes caused by factors that cannot be addressed by the installation of a pedestrian facility should not be counted, such as those crashes caused by intoxicated pedestrians or drivers. 5.3.2 Restricted Visibility Visibility requirements at various crossing types are as follows: T • At an uncontrolled crossing, the pedestrian should be able to see approaching traffic in sufficient time to judge a gap to cross the road safely. This is the crossing sight distance (CSD) as defined in the Austroads Guide to Road Design Part 4A - Unsignalised and Signalised Intersections, depicted on the following page. 3.13 DR • At signalised intersections, the driver must be able to see the signal lanterns at the stopping sight distance. A minimum of two signal faces need to be visible. Where stationary queues are expected, stopping sight distance must also be provided to the rear of the queue. • Points are allocated to take account of restricted visibility only when the introduction of a new crossing type will address an existing visibility deficiency. IN G In some cases, pedestrians desire to cross at particular locations, despite their view of approaching traffic being poor, making it difficult for them to choose a safe gap to cross the road. If motorists have adequate ASD, provision of a controlled crossing (zebra or traffic signals) will alleviate the problem, as ASD is usually less than CSD in urban environments. At a refuge or kerb extension facility for example, when the walking distance is such that the calculated CSD is less than ASD in Table 4, the ASD (to the refuge island) should also be satisfied. Crossing Sight Distance RK From Austroads Guide to Road Design Part 4A - Unsignalised and Signalised Intersections. CSD = Vt c 3.6 Where: CSD = sight distance required for a pedestrian to safely cross the roadway (m) O tc = minimum gap, in seconds, required for a pedestrian to safely cross the roadway W V = the 85th percentile vehicle approach speed or the speed environment in (km/h) Traffic & Road Use Management Manual - Pedestrian Crossing Facility Guidelines & Prioritisation System User Guide UNCONTROLLED COPY WHEN DOWNLOADED FROM THE WEB AF • At a zebra crossing, the driver must be able to see any pedestrian waiting to cross and the crossing pavement markings (and other cues) in time to stop to allow the pedestrian to cross. This is the approach sight distance (ASD) as defined in the Austroads Guide to Road Design Part 4A - Unsignalised and Signalised Intersections. 10 Issue: 22/3/2010 T AF DR G IN RK Figure 1: CSD and ASD from Austroads Guide to Road Design Part 4A - Unsignalised and Signalised Intersections Existing Sight Distance (CSD) Required Sight Distance (CSD) <0.95* 0.95*-0.99 ≥1 Points 3 1 0 O UNCONTROLLED COPY WHEN DOWNLOADED FROM THE WEB 3.13 W * When a pedestrian crosses a road with only 95% of the recommended CSD, they will be required to walk 5.3% faster than if 100% CSD was provided. For example, if a pedestrian walking speed of 1.2m/s (15%ile pedestrian speed) is adopted for determining 100% CSD, they would be required to walk at 1.26m/s at 95% CSD. Approach Sight Distance Refer to Table 4 for Approach Sight Distance and Table 5 for Grade corrections for ASD (from Austroads Guide to Road Design Part 4A - Unsignalised and Signalised Intersections). Traffic & Road Use Management Manual - Pedestrian Crossing Facility Guidelines & Prioritisation System User Guide Issue: 22/3/2010 11 Table 4: Approach sight distance (ASD) and corresponding minimum crest vertical curve size for sealed Roads (vert. curve radius = 100 x K) RT=2.0 s RT=2.5 s ASD (m) K ASD (m) K ASD (m) K 40 34 5.3 40 7.2 - - 50 48 10.5 55 13.8 60 64 18.8 73 24.0 70 83 31.1 92 38.9 80 103 48.5 114 90 126 72.3 139 100 151 104 165 110 - - 193 120 - - 130 - - - - - - 59.5 - - 87.3 151 104 124 179 146 171 209 198 AF - DR Truck stopping capability provided by the minimum crest curve size 4 - 224 229 241 264 257 301 275 344 G d= 0.22, h1 = 2.4 m, h2 = 0 m Notes: 1. If the average grade over the braking length is not zero, calculate the approach sight distance (ASD) values using the correction factors in Table 5 by applying the average grade over the braking length. 1.5 s reaction time is only to be used in constrained situations where drivers will be alert. Typical situations are given in Table 4.2 of the Guide to Road Design - Part 3: Geometric Design (Austroads 2009a). The general minimum reaction time is 2 s. RK 3. IN 2. In constrained locations (typically lower volume roads, less important roads, mountainous roads, lower speed urban roads and tunnels), a coefficient of deceleration of 0.46 may be used. For any horizontal curve with a side friction factor greater than the desirable maximum value for cars (in constrained locations), use a coefficient of deceleration of 0.41. The resultant crest curve size can then be calculated according to using the relevant equations in the Guide to Road Design - Part 3: Geometric Design (Austroads 2009a). 4. This check case assumes the same combination of design speed and reaction time as those listed in the table, except that the 120 km/h and 130 km/h speeds are not used. Combinations of design speed and reaction times not shown in this table are generally not used. W O Refer to the Guide to Road Design - Part 3: Geometric Design (Austroads 2009a) to determine the ASD for trucks around horizontal curves. Traffic & Road Use Management Manual - Pedestrian Crossing Facility Guidelines & Prioritisation System User Guide 3.13 UNCONTROLLED COPY WHEN DOWNLOADED FROM THE WEB RT=1.5 s 3 T Design speed (km/h) Based om approach sight distance for a car 1 h1 = 1.1, h2 = 0, d = 0.362 12 Issue: 22/3/2010 Table 5: Grade corrections to ASD Design speed (major road) (km/h) Upgrade Downgrade 4% 6% 8% 2% 4% 6% 8% 40 -1 -2 -2 -3 1 2 3 5 50 -1 -3 -4 -5 2 3 5 8 60 -2 -4 -6 -7 2 5 8 11 70 -3 -5 -8 -10 3 7 11 15 80 -4 -7 -10 -13 4 9 14 20 90 -5 -9 -13 -16 5 11 18 25 100 -6 -11 -16 -20 6 14 22 31 110 -7 -13 -19 -24 8 17 26 38 120 -8 -16 -22 -29 9 20 31 45 130 -10 -18 -26 37 53 AF DR Notes: T 2% -34 11 23 1. Corrected sight distances should be rounded up to the nearest 5 m 2. The minimum and desirable standards set out in Table 4 are based on safe stopping distances for cars. G 3. At a site with a grade: drivers should ideally be able to see the markings of the pedestrian crossing or other cues (signage) from the recommended sight distance. If the pavement markings or signage cannot be seen from the recommended sight distance then a more suitable location should be sought, particularly if a new crossing is being installed. IN 4. Correction to be added to ASD for downgrade and subtracted for upgrade. 5.3.3 Proximity of alternative crossing Deduct points if there are alternative crossing locations within 200 m of the proposed facility. RK Consideration could be given to deducting only half of the points indicated in the table, if the alternative crossing facility is not signed or signal controlled i.e. if the alternative crossing facility is a formalised crossing, with a refuge and/or kerb extension but not a zebra or a pedestrian signal. Proximity of alternative facility <50m 50-100m 100-150m 150-200m >200m Points -6 -4 -2 -1 0 O UNCONTROLLED COPY WHEN DOWNLOADED FROM THE WEB 3.13 Correction (m) W 5.3.4 Road network performance Deduct points to account for adverse impacts of the crossing facility on the road network. A mid-block signalised crossing may have a significant impact on a major arterial road and a severe impact on a freeway or motorway. A high overall score in the point system should not automatically warrant the installation of a pedestrian facility. The proposed crossing should also meet the criteria established by the Pedestrian Facility Guidelines in Section 6. Traffic & Road Use Management Manual - Pedestrian Crossing Facility Guidelines & Prioritisation System User Guide Issue: 22/3/2010 13 A site on a freeway or motorway could score sufficient points in the system to warrant the provision of a signalised pedestrian crossing at a totally inappropriate location. These points allow the site to be revised to reflect the appropriateness of the location. Table 6: Point adjustments for impacts of pedestrian facilities on road network performance Adjustment Appropriate treatment for this road environment and impact on network performance acceptable 0 -2 Crossing will have a major negative impact on road network performance -4 AF T Crossing not really appropriate for this road environment or negative impact on road network significant Crossing will have a extreme negative impact on road network performance 5.3.5 Pedestrian Connectivity Factors -10 DR Extra points may be added where pedestrians have a desire or need to access facilities or services. For example, roads with existing: • Bike ways; • Public transport; • Event venues; G • Outdoor facilities – beaches, parks, picnic areas; • Focal points- memorials, lookouts, rotundas; • Community facilities – schools, libraries, age care, child care, hospitals; or IN • Shopping precincts. Table 7: Point adjustments for impacts of pedestrian facilities on pedestrian connectivity Option Adjustment Crossing in this location is highly appropriate, it provides a direct link to existing facilities or services 2 Crossing in this location is appropriate as it provides a useful link to existing facilities or services 1 Pedestrian connectivity issues in this location are neutral 0 Crossing in this location will have no impact on pedestrian mobility -1 O RK 3.13 W 5.3.6 Local Traffic Impacts Consideration should also be given the local traffic impacts of pedestrian facilities, resulting from their physical requirements. For example: • Loss of shop or business front parking; • Loss of driveway access; • Impact on drainage; • Relocation of water mains and other services due installation of pram ramps; and • Impact on surrounding residences. Traffic & Road Use Management Manual - Pedestrian Crossing Facility Guidelines & Prioritisation System User Guide UNCONTROLLED COPY WHEN DOWNLOADED FROM THE WEB Option 14 Issue: 22/3/2010 Table 8: Point adjustments for impacts of pedestrian facilities on local traffic Option 0 Moderate negative impact. The pedestrian zone will need significant modification to meet the standards -1 Crossing will have a major negative impact on the existing or proposed infrastructure -2 T Minimal negative impact 5.3.7 Other AF 3.13 Adjustment Option Adjustment RK IN G Other (score using engineering judgement) DR Table 9: Other point adjustments for impacts of pedestrian facilities W O UNCONTROLLED COPY WHEN DOWNLOADED FROM THE WEB In some cases, other site-specific point adjustments may be needed according to local knowledge and engineering judgement. Traffic & Road Use Management Manual - Pedestrian Crossing Facility Guidelines & Prioritisation System User Guide Issue: 22/3/2010 15 6 Pedestrian Facility Guidelines The pedestrian facility guidelines that follow provide guidance on the selection of crossing facilities. After obtaining the Pedestrian Facility Prioritisation Point System score to identify potential treatments, the practitioner needs to consult the guidelines in order to select the most appropriate facility. Guidelines are provided for the following facilities: Section No. T Facility Type Pedestrian Refuge Island 6.1 6.2 AF Footpath/Kerb Extension 3.13 Zebra Crossings 6.3 Zebra Crossings on Slip Lanes 6.4 Pedestrian Actuated Signals on Slip Lanes 6.5 Mid-Block Pedestrian Actuated Signals 6.7 6.8 Grade Separation 6.9 W O RK IN G Signalised Intersections With Pedestrian Facilities Traffic & Road Use Management Manual - Pedestrian Crossing Facility Guidelines & Prioritisation System User Guide UNCONTROLLED COPY WHEN DOWNLOADED FROM THE WEB 6.6 DR Children's Crossing 16 Issue: 22/3/2010 6.1 Pedestrian Refuge Island (with optional footpath/kerb extension – refer to Footpath/Kerb Extension guidelines) T AF DR Consider the pedestrian refuge option first before considering other pedestrian facilities. Guidelines Use pedestrian refuges: • Where a staged crossing is desired; • On wide roadways (15m or more) where the pedestrian needs to cross four lanes or more. Although there is a greater benefit from installing refuges on four lane roads, installation on two lane roads also provides benefits for pedestrians; • At sites where a zebra crossing is warranted, but design conditions are unable to be satisfied. RK Where to Use IN G • Pedestrian facility prioritisation point score ≥ 6. • Generally, it should not be necessary to consider other devices, if the introduction of a refuge results in a LOS of D or better. • A refuge is preferred to footpath/ kerb extensions because: - It halves the crossing width; - It allows pedestrians to cross the road in two stages making the crossing task much easier because pedestrians only need to negotiate traffic in one direction at a time. • Refer MUTCD Part 10; RP&D Chapter 13; Austroads Guide to Traffic Management and Guide to Road Design Series. Do not use pedestrian refuges where: • Minimum refuge island widths or length cannot be met; • Sight distance requirements cannot be met (CSD and ASD); • The speed limit is >70km/hr (the MUTCD indicates pedestrian refuges are useful where the 85th percentile speed is greater than 60km/hr. This limitation will be amended in the future to align with this guideline); • High turning volumes of trucks exist, with potential for the swept paths to cross the refuge. O UNCONTROLLED COPY WHEN DOWNLOADED FROM THE WEB 3.13 W Don’t use Traffic & Road Use Management Manual - Pedestrian Crossing Facility Guidelines & Prioritisation System User Guide • Use this facility as part of a strategy to encourage public transport by providing safer access to bus stops; • Use this facility as a part of a bikeway strategy; • Instead of installing closely spaced pedestrian refuge islands, consider a continuous median; • Handrails should be installed particularly at sites with a high number of elderly and/or pedestrians with a mobility disability (refer Figure 3 for details of handrail); • Kerb extensions can be combined with refuges to make the crossing task more comfortable, but care is required to ensure the extensions don’t result in a cyclist pinch point; • Pedestrian refuge islands at roundabouts must be designed in accordance with Austroads Guide to Traffic Management and Guide to Road Design Series. AF T Other considerations 17 Disadvantages • May require minor road widening in certain situations; • Require street lighting (for major roads (category V) refer AS1158.1.1 or minor roads (category P) refer AS1158.3.1); • May cause damage to vehicles if drivers hit them; • Will restrict parking near the refuge island; • May require pedestrian fencing to direct pedestrians through the refuge at the safest crossing point. This can restrict pedestrian movement; • May affect right turn access to properties; • Where used as part of a staged signalised crossing, they can result in increased delays to pedestrians as staging is usually done to improve traffic flow rather than benefit pedestrians. W O RK IN G DR Advantages • Provides a staged crossing at locations where pedestrian crossing movements are concentrated; • Make the crossing task much easier for pedestrians; • Provides physical protection for pedestrians; • Are available for use by pedestrians at all times; • Relatively low cost; • Give pedestrians a resting place when crossing wide roads or intersections; • Walk-though areas of refuges can be installed at the same level as the road surface to ensure that pedestrians with prams and/or a mobility impairment have easy access. Ramps can also be provided if the walk-through area is not at road level. Traffic & Road Use Management Manual - Pedestrian Crossing Facility Guidelines & Prioritisation System User Guide 3.13 UNCONTROLLED COPY WHEN DOWNLOADED FROM THE WEB Issue: 22/3/2010 18 Issue: 22/3/2010 6.2 Footpath/Kerb Extension AF T 3.13 DR Guidelines • Pedestrian facility prioritisation point score ≥ 7. • Generally, it should not be necessary to consider footpath/kerb extensions, if the introduction of a refuge results in a LOS of D or better. • Refer MUTCD Part 10; RP&D Chapter 13; Austroads Guide to Traffic Management and Guide to Road Design Series. G RK IN Where to Use Use footpath/kerb extensions: • On wide roads, particularly where motorists have difficulty perceiving the presence of pedestrians due to the road width; • Where there is substantial vehicle/pedestrian conflict. Special consideration should be given to roads where there is a significant number of children, elderly or pedestrians with disabilities as the shorter crossing distance lessens their exposure; • Where a parking lane exists or creation of a parking lane will not compromise traffic capacity. May be used at an intersection, mid-block location or in association with a pedestrian refuge island, marked pedestrian crosswalk (zebra) or traffic signals. Don’t use Do not use footpath/kerb extensions where: • Sight distance requirements cannot be met (CSD and ASD); • Their introduction at an intersection impinges upon heavy vehicle turning paths; • A cyclist pinch point would be created. Advantages • Improve safety by reducing pedestrian crossing distance and time; • Encourages pedestrians to cross at designated locations; • Make pedestrian crossing points more visible to drivers. Care should be taken to ensure that street furniture and landscaping do not block motorists view of pedestrians; • May visually enhance the street through landscaping; • May assist in creating a lower speed environment; • Parking restrictions may be reduced - refer Figure 2 for details. Grates and ramps can be provided to allow wheelchair and pram access. Disadvantages • May occupy street area otherwise available for kerb side parking; • May require lighting; • May make it difficult to accommodate full bicycle lane. W O UNCONTROLLED COPY WHEN DOWNLOADED FROM THE WEB Consider a Median/Refuge option before considering footpath/kerb extension. Traffic & Road Use Management Manual - Pedestrian Crossing Facility Guidelines & Prioritisation System User Guide Issue: 22/3/2010 19 DR Consider the zebra crossing option only if the installation of a pedestrian refuge or midblock pedestrian traffic signals is not suitable. In this case, a special study should be conducted to ensure the suitability of installing a zebra crossing. Guidelines G • Pedestrian facility prioritisation point score ≥ 8. • Generally, it should not be necessary to consider zebra crossings, if the introduction of a refuge results in a LOS of D or better. • Refer MUTCD Part 10; RP&D Chapter 13; TRUM Manual Volume 1.29; Austroads Guide to Traffic Management and Guide to Road Design Series. IN RK Where to Use Use zebra crossings where: • There is consistent pedestrian usage throughout the day; • On two lane roads with one through lane in each direction; • The speed limit is not more than 50 km/h (the MUTCD indicates zebra crossings are to be installed where the 85th percentile speed is not more than 60km/hr. This will be amended in the future to align with this guideline). O Do not use zebra crossings: • On arterial roads or motorways; • On roads where more than one lane of traffic travels in the same direction (two, three and four-lane roads). Some drivers may not physically see pedestrians because a vehicle in an adjacent lane may be obscuring their view. This also includes one way roads with more than one travel lane; • Within 100 m of an alternative pedestrian facility, except in central business districts or other locations where there is a well defined need; • On roads with high flows of random pedestrian arrivals that will cause unacceptable delay to vehicles; • Where sight distance requirements cannot be met (ASD); or • Where the delay to traffic would cause traffic operational problems (such as queuing over railway level crossings) or safety problems (including inadequate sight distance to the back of the queue). W Don’t use Traffic & Road Use Management Manual - Pedestrian Crossing Facility Guidelines & Prioritisation System User Guide 3.13 UNCONTROLLED COPY WHEN DOWNLOADED FROM THE WEB AF T 6.3 Zebra Crossings 20 Issue: 22/3/2010 Special Cases Regardless of the pedestrian facility prioritisation point score, consideration may be given to the installation of a zebra crossing at a site where: • community severance is created by a primary arterial; and • no other controlled crossing points exist within 200 metres of the proposed site; and/or • significant proportion of the pedestrian activity required to make the crossing is elderly or people with a disability. See clause 6.7 Mid-Block Pedestrian Actuated Signals - Special Cases also. Other relative criteria for specific treatments always need to be satisfied, for example, a zebra crossing shall not be installed where more than one lane travels in the same direction. Other considerations • Zebra crossings on flat top road humps can be used on local and collector streets and are generally located near schools or shopping precincts. Ensure that the road hump profile is suitable for low floor buses; • Kerb extensions and/or pedestrian refuges may be incorporated into at grade zebra crossings; • Less suitable when crossing numbers are small; • Pedestrian crossings (zebra) at roundabouts must be designed in accordance with Austroads Guide to Traffic Management and Guide to Road Design Series. Advantages • Relatively low cost to install and maintain; • Shorter delays to motorists than signalised crossings, except where pedestrian volumes are high. Disadvantages • Pedestrians’ expectation of priority can create a false sense of security; • Can be poorly respected by motorists and may add to driver frustration; • Pedestrians (especially children) may not take into account the distance motorists need to react to their presence and stop; • Can result in higher levels of rear end collisions as motorists in following vehicles may not be able to see pedestrians and are not prepared for the leading vehicle to stop; • May require ongoing education campaigns; • Supplementary lighting may be required at some pedestrian crossing locations (refer Chapter 17 RP&D). T AF DR G IN RK W O UNCONTROLLED COPY WHEN DOWNLOADED FROM THE WEB 3.13 Traffic & Road Use Management Manual - Pedestrian Crossing Facility Guidelines & Prioritisation System User Guide Issue: 22/3/2010 21 DR If using the ”Pedestrian crossing prioritisation workbook”, to assess a slip lane treatment, toggle both median/refuge options on the “Data input 1” tab, “Step 1-refuge” row to “No” and treat the traffic volumes at the slip lane as the “Total flow” at ”Step 2”. Guidelines G • Pedestrian facility prioritisation point score ≥ 4. • Refer MUTCD Part 10; RP&D Chapter 13; Austroads Guide to Traffic Management and Guide to Road Design Series. IN RK Where to Use Use this facility in locations where: • The provision of this facility is a continuation of an established pedestrian route; • Access is required to other pedestrian facilities at a signalised intersection (e.g. traffic signals with pedestrian phases); • There are high entry angle (70°), single lane slip lanes that discourage highspeed turns; • The 85th percentile speed of vehicles using the slip lane is not more than 60km/h; • The zebra crossing can be installed in an area at a reasonable distance from the give way line, so that the driver is still looking ahead and not already looking for gaps in the traffic; and/ or • There is evidence that pedestrians currently cross at unsafe locations. Do not use this facility in locations: • Where sight distances cannot be met (ASD); • On multi-lane slip lanes. O Don’t use • Regardless of the pedestrian facility prioritisation point score, consideration should be given to the installation of a zebra crossing on a slip lane where pedestrians with a vision impairment regularly cross. Advantages • Aids vulnerable pedestrians (children, elderly and pedestrians with disabilities). Disadvantages • Drivers attention could be focussed on looking for a break in the traffic and they might not see a pedestrian; • Pedestrians’ expectation of priority can create a false sense of security; • Supplementary lighting may be required at some pedestrian crossing locations (refer Chapter 17 RP&D). W Special Cases Traffic & Road Use Management Manual - Pedestrian Crossing Facility Guidelines & Prioritisation System User Guide 3.13 UNCONTROLLED COPY WHEN DOWNLOADED FROM THE WEB AF T 6.4 Zebra Crossings on Slip Lanes 22 Issue: 22/3/2010 6.5 Pedestrian Actuated Signals on Slip Lanes DR • Pedestrian facility prioritisation point score ≥ 11. • Refer MUTCD Parts 10 & 14; TRUM Manual Volume 2.5; RP&D Chapter 18; Austroads Guide to Traffic Management and Guide to Road Design Series. Don’t use Do not use this facility in locations: • On low traffic, low pedestrian volume roads; or • Where sight distance requirements cannot be met (ASD). Other considerations • Consideration can be given to the use to two aspect vehicle lantern signals (redyellow) to stop traffic when pedestrians are crossing on a green pedestrian signal (activated by a push button). Trials have shown that this type of control reduces traffic delays. Refer TRUM Manual Volume 2.5 for guidance on two aspect control. Advantages • Aids vulnerable pedestrians (children, elderly and pedestrians with disabilities). RK IN G Where to Use Use this facility in locations: • Where the provision of this facility is a continuation of an established pedestrian route; • Where access is required to other pedestrian facilities at a signalised intersection (e.g. traffic signals with a connecting pedestrian phase); • On high traffic, high pedestrian volume roads; and/or • On double slip lanes. • Pedestrians may cross the slip lane after pressing the push button, but before the green pedestrian signal is displayed, resulting in unnecessary delays to traffic; • Supplementary lighting may be required at some pedestrian crossing locations (refer Chapter 17 RP&D). O UNCONTROLLED COPY WHEN DOWNLOADED FROM THE WEB Guidelines AF T 3.13 W Disadvantages Traffic & Road Use Management Manual - Pedestrian Crossing Facility Guidelines & Prioritisation System User Guide Issue: 22/3/2010 23 AF T 6.6 Children's Crossing 3.13 DR Guidelines • Refer MUTCD Part 10; Queensland Transport “School Environment Safety Guidelines”; www.roadsafety.qld.gov.au; Austroads Guide to Traffic Management and Guide to Road Design Series. Don’t use Do not use this facility in locations: • Other than near schools; • Where sight distance requirements cannot be met (ASD); • On multi-lane roads or one-way roads with more than one lane unless supervised by a crossing supervisor; • On roads where the speed limit is > 70km/hr. RK IN G Where to Use Use this facility in locations: • Outside a school or within 200m of a school location on the walking route where the requirements for such a facility arise only during specific and limited times of the school day; • In lieu of a pedestrian crossing (zebra) where a crossing would be used predominately during daylight hours on school days. W O Other considerations • Children’s crossings may be raised and/or include kerb extensions; • Where raised crossings are used, it is important to ensure that the road hump profile is suitable for low floor buses; • If a children’s crossing is used on a road with a median, both halves of the crossing should be considered as separate crossings; • A children’s crossing and zebra crossing may be located at the same site provided there is substantial pedestrian use other than school children during and outside school hours. The children’s crossing is only operational when ‘Children’s Crossings’ flags are displayed; • It is strongly recommended that a crossing supervisor operates when the children’s crossing flags are displayed. Advantages • Improved control of children than at zebra crossings (an adult assesses when it is safe to cross); • Unnecessary restrictions are not imposed on drivers outside the start and finish of normal school hours. Disadvantages • More than one crossing supervisor may be required on a busy roads or roads with medians; • Supervisor’s salary is an ongoing expense. Traffic & Road Use Management Manual - Pedestrian Crossing Facility Guidelines & Prioritisation System User Guide UNCONTROLLED COPY WHEN DOWNLOADED FROM THE WEB Installation of a children’s crossing is independent of any score, which emerges from this prioritisation point system. 24 Issue: 22/3/2010 6.7 Mid-Block Pedestrian Actuated Signals AF T 3.13 Consider lower order facilities before considering mid-block pedestrian actuated signals. DR • Pedestrian facility prioritisation point score ≥ 13. • Generally, it should not be necessary to consider mid block pedestrian actuated signals, if the introduction of a pedestrian refuge island results in a LOS of D or better. • Refer MUTCD Parts 10 & 14; TRUM Manual Volume 2.6; RP&D Chapter 18; Austroads Guide to Traffic Management and Guide to Road Design Series. Don’t use Do not use this facility in locations: • Where the speed limit is greater than 80 km/h; • At locations with low traffic volumes; • Where sight distance requirements cannot be met (ASD); • Where pedestrian flows are generally light or light for long periods of the day (drivers accustomed to not being stopped at the crossing may begin to ignore the signals); • Where vehicle queues are likely to extend across railway crossings or adjacent intersections. Signal coordination may mitigate this problem; or • Where it is feasible to upgrade a nearby unsignalised intersection. RK IN G Where to Use Use this facility in locations where: • A proven pedestrian black spot exists; or • Lower order pedestrian facilities or alternative crossings are not feasible or where they exist, pedestrians have difficulty in asserting precedence. Regardless of the pedestrian facility prioritisation point score, consideration should be given to the installation of a mid-block pedestrian actuated signals at a site where: • community severance is created by a primary arterial; and • two lanes or more need to be crossed in one movement; and/or • no other controlled crossing points exist within 200 metres of the proposed site; and/or • significant proportion of the pedestrian activity required to make the crossing is elderly or people with a disability. Other relative criteria for specific treatments always need to be satisfied, for example, sight distance requirements must be satisfied. O UNCONTROLLED COPY WHEN DOWNLOADED FROM THE WEB Guidelines W Special Cases Traffic & Road Use Management Manual - Pedestrian Crossing Facility Guidelines & Prioritisation System User Guide 25 Disadvantages • Without careful consideration of site and traffic characteristics, can result in excessive delay for motorists and/or pedestrians, signal disobedience and an increase in certain types of accidents; • Expensive to install and maintain; • Supplementary lighting may be required at some pedestrian crossing locations (refer Chapter 17 RP&D). W O RK IN G DR AF T Advantages • Assigns the right-of-way to vehicular and pedestrian traffic; • Can be incorporated into a coordinated signal system, which reduces delays to motorists; • Suitable for pedestrians with a disability, in particular, audio-tactile signals can be provided for pedestrians with hearing and/or vision impairment; • Where pedestrian volumes are high, pedestrian actuated signals will better regulate pedestrian flows and result in lower delays to motorists than a zebra crossing. Traffic & Road Use Management Manual - Pedestrian Crossing Facility Guidelines & Prioritisation System User Guide 3.13 UNCONTROLLED COPY WHEN DOWNLOADED FROM THE WEB Issue: 22/3/2010 26 Issue: 22/3/2010 6.8 Signalised Intersections with Pedestrian Facilities (Walk/Don't Walk Signals) AF T 3.13 DR Guidelines • Pedestrian facility prioritisation point score ≥ 11. • For general warrants for traffic signals, refer to the MUTCD Part 14 Section 5. • Refer MUTCD Parts 10 & 14; RP&D Chapter 18; Austroads Guide to Traffic Management and Guide to Road Design Series. Don’t use Do not use this facility in locations: • Where sight distance requirements cannot be met (ASD). Other considerations • Supervision may be provided if significant numbers of school children are present; • An exclusive pedestrian phase (scramble crossing) can be used to allow pedestrians to cross in all directions (generally in CBD environments with significant vehicle traffic and high pedestrian volumes). Advantages • Suitable for pedestrians with a disability, in particular, audio-tactile signals can be provided for pedestrians with hearing and/or vision impairment; • Can be incorporated into a coordinated signal system, which reduces delays to motorists; • Provides safer access for side street traffic. RK IN G Where to Use Use this facility in locations where: • Signals are being installed to control vehicular traffic movements and provision for pedestrians is needed; and/or • Intersections with high pedestrian volumes and there is no alternative crossing facility. W O UNCONTROLLED COPY WHEN DOWNLOADED FROM THE WEB Consider a median/refuge option before considering other types of pedestrian crossings. Disadvantages • Expensive to install and maintain, unless signals are being installed to control vehicular traffic movements; • Pedestrians assume that turning vehicles will give way and may not take adequate care; • Supplementary lighting may be required at some pedestrian crossing locations (refer Chapter 17 RP&D). Traffic & Road Use Management Manual - Pedestrian Crossing Facility Guidelines & Prioritisation System User Guide Issue: 22/3/2010 27 AF T 6.9 Grade Separation (Pedestrian Underpass or Overpass) 3.13 DR Guidelines • Pedestrian facility prioritisation point score ≥ 13. • Refer MUTCD Part 10; RP&D Chapter 16; Austroads Guide to Traffic Management and Guide to Road Design Series. Don’t use Do not use this facility in locations: • Where alternative pedestrian crossing treatments are feasible; or • If pedestrians are required to walk significant distances (out of their way) to use the facility. Poor usage may occur. RK IN G Where to Use Use this facility in locations: • Where the pedestrian facility prioritisation point system indicates that mid-block pedestrian actuated signals are warranted, but an at-grade crossing cannot be installed due to high traffic volume roads (e.g. arterial roads, freeways and motorways); • Across major roads where alternative pedestrian crossing facilities are not feasible; • Where there are extremely high pedestrian volumes; and/or • Where they can be provided as part of an adjacent development that would generate a high demand to cross at that location. • Can be subject to poor patronage (except at schools or where fencing is used) due to the level difference and longer walking distance; • High capital cost; • May require fencing and signage to encourage use; • May require changes in access points to encourage use (e.g. bus stop locations, school gates); • Supplementary lighting may be required at some pedestrian crossing locations (refer AS1158.3.1). Underpasses: • May reduce personal security; • Have high lighting costs; and • Are prone to vandalism. W O Advantages • The safest type of pedestrian crossing facility; • Causes no delays to vehicular traffic; • Underpass or overpass may be selected based on surrounding land topography. Disadvantages Traffic & Road Use Management Manual - Pedestrian Crossing Facility Guidelines & Prioritisation System User Guide UNCONTROLLED COPY WHEN DOWNLOADED FROM THE WEB Consider at grade pedestrian facilities before grade separation. 28 Issue: 22/3/2010 Disadvantages Overpasses: • Level difference can cause problems for the elderly and pedestrians with a disability; • Can be visually intrusive and result in privacy concerns for nearby residences; • Projectiles may be thrown at passing vehicles from overpasses and some form of caging may be required to ensure safety for the traffic below. T AF DR G IN RK W O UNCONTROLLED COPY WHEN DOWNLOADED FROM THE WEB 3.13 Traffic & Road Use Management Manual - Pedestrian Crossing Facility Guidelines & Prioritisation System User Guide 29 W O Figure 2: Parking reductions possible when kerb extension or blister islands are used at pedestrian refuge facilities Traffic & Road Use Management Manual - Pedestrian Crossing Facility Guidelines & Prioritisation System User Guide 3.13 UNCONTROLLED COPY WHEN DOWNLOADED FROM THE WEB RK IN G DR AF T Issue: 22/3/2010 30 Issue: 22/3/2010 T AF DR G IN RK W O UNCONTROLLED COPY WHEN DOWNLOADED FROM THE WEB 3.13 Figure 3: Holding Rail Traffic & Road Use Management Manual - Pedestrian Crossing Facility Guidelines & Prioritisation System User Guide