1
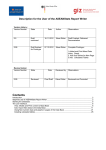
www.motionmaster.com.au
[email protected]
MotionMaster User Guide
Congratulations on your purchase of a MotionMaster device
We hope that it helps improve your sport as much as it has helped us!
We’re allways interested in any feedback you have, we like our software, and hope
its very easy to use. If you have any question or comments, or would like to have
some extra information added, please let us know!
MotionMaster user guide........................................................................................................1 Registering your software.......................................................................................................1 Common tasks ........................................................................................................................1 Reading a log file................................................................................................................1 Setting a zero level .............................................................................................................2 Zooming and navigating the graph .....................................................................................3 Toolbar functions....................................................................................................................6 Display data descriptions........................................................................................................8 Main tabs ............................................................................................................................8 Replay Tab..........................................................................................................................8 Impulse panel:...............................................................................................................10 Dynamics panel ............................................................................................................11 GPS panel .....................................................................................................................11 Main Graph Display .....................................................................................................11 Map tab .............................................................................................................................12 Editing preferences ...............................................................................................................13 MotionMaster user guide
Registering your software
If you’ve purchased a MotionMaster, you’ll have also received a serial number to
register the software with.
1. Launch the MotionMaster Software, located under the start menu under the
MotionMaster Folder (Start>MotionMaster>MotionMaster)
2. Once launched, goto the About menu.
3. Enter your serial number in the text field and press the Register button, if
your serial number is entered incorrectly, you’ll be prompted to enter it
again.
4. Once a valid serial number has been entered, it will be saved. If you need to
re-enter it, you can at any time.
Common tasks
Reading a log file
There are two ways to open a MotionMaster log file. You can either double click
the log file in Windows Explorer, or open it from within the MotionMaster software.
1
www.motionmaster.com.au
[email protected]
MotionMaster User Guide
To open the file from within MotionMaster:
1. Go to the File>Open menu option, or click on the Open File toolbar button
(
)
2. Using the open file dialog window, locate the log file you wish to open and
double click on it.
3. The log file will then be opened. Depending on the speed of your computer
and the size of the log file, it may take a few seconds at least to open. While
the file is being opened, a progress bar whows the file loading progress in
the toolbar area:
4. Once the file is loaded, the loading progress bar will stop, and the graphed
data will be shown.
Setting a zero level
This is one of the most important steps in interpreting your data. You need to tell
the MotionMaster software where a point on the graph lies that represents a stable
level position.
This would be the position that your craft or body represents as stopped and level.
In a boat, or kayak, this would be an unloaded boat, on calm, flat water. If you are
measuring human movement, this would be when standing still, upright, before
doing your sport.
While finding this position is not absolutely necessary, it does help getting an
accurate pitch and roll measurement. You’ll still be able to view the pitch and roll
data, via the replay functions even if you don’t get this perfectly right.
To set a zero level:
2
www.motionmaster.com.au
[email protected]
MotionMaster User Guide
1. Scroll, or zoom to the location on the graph you are going to set the zero
level on, in this graph, it is very easy to see our zero position, it’s the flat bit
at the start.
2.
3.
4.
5.
6.
Press the Zero button on the toolbar (
)
Click on the point in the graph where you wish to set the zero level
You’ll see the pitch and roll widgets level them selves.
You can re-zero at anytime, by repeating this process.
You’re now ready to interpret your information.
Zooming and navigating the graph
The graph allows you to zoom in on any piece of data.
To zoom, simply click on hold the left mouse button, and drag a box around the
data you wish to zoom, and then let go of the mouse button.
The graph will zoom in, and place scroll bars as necessary.
When zooming, the graph will display a greyed out section, highlighting the data
you’ll be zooming in on.
You can also zoom in horizontally and vertically, by cloicking and dragging on a
horizontal scale, or a vertical scale. When doing this the graph will highlight the
area, either vertically or horizontally, releasing the mouse button, will then perform
the zoom.
Standard zooming:
3
www.motionmaster.com.au
[email protected]
MotionMaster User Guide
zooms to:
4
www.motionmaster.com.au
[email protected]
MotionMaster User Guide
Horizontal zooming:
zooms to:
5
www.motionmaster.com.au
[email protected]
MotionMaster User Guide
Verticle zooming:
zooms to:
Toolbar functions
All our functions are available on a main toolbar strip of buttons. While some of
these function are also available via the menus, and shortcut keys, the toolbar
functions are where most people start.
Open a log file
Open File
Append File
Open a new log file, and append it to
the data already displayed on the graph
Export Data
Export data contained in the graph to a
csv, or xml file.
Reload the last opened log file
Reload File
6
www.motionmaster.com.au
[email protected]
MotionMaster User Guide
Play
Play from the last position clicked on the
graph
Rewind
Rewind to the start of the last play
beginning position
Pause
Pause the currently playing simulation
(restart by pressing play again)
Stop the current simulation
Stop
Reset all zoom levels
Set zero level
Reset verticle zoom
Save sreenshot
Reset the graph view to zoom out to a
level that show all data on the graph
Zero level function. Press this button,
and then click on the point in the graph
where you would like to set a zero level.
Reset verticle zoom. If you have
selected another graph metric to view,
and it is off the verticle display of the
graph, this will resize to include all the
new data.
Export the current graph view in a
number of popular image formats
Zoom the map view in
Map zoom in
Zoom the map view out
Map zoom out
Export map data
Export map data for use in other
applications.
7
www.motionmaster.com.au
[email protected]
MotionMaster User Guide
Display data descriptions
Below is a typical log file view, of a dragon boat start sequence
It displays a lot of information, so its important to become familiar with this
interface.
Main tabs
Beneath the toolbar are two tabs.
The first tab Replay, displays all the movement information for the data file, the
second tab, Map, displays mapping information for data files that have GPS data
Replay Tab
Selecting the Replay tabs gives us a view similar to the following view:
8
www.motionmaster.com.au
[email protected]
MotionMaster User Guide
Starting in the top right hand corner, is the roll widget. This show you roll front the
point of view of looking forwards. So when you are looking at this widget, think of
moving forwards. If the widget was tilting downwards on the left, then you would be
rolling to the left, and rightwards tilt means rolling to the right.
The following picture shows a roll to the left
The next widget is the pitch widget, its is a side on view, with the motion movement
happening from left to right. So the right hand side of the widget is the front, the left
is the back.
If the widget was pointing down on the left hand side, you would be pitching up, or
point your nose towards the sky, if it was tilting down on the right hand side, you
would be facing down, or pointing towards the ground.
9
www.motionmaster.com.au
[email protected]
MotionMaster User Guide
The following picture show an upwards pitch:
Continuing to move left we have three main panels of information. Depending on
the MotionMaster device you have, not all of these will have data in them
Impulse panel:
Point
Impluse time
Impulse force
Impulse rate
The data point on the graph currently
selected
The time between the last peak before
the currently selected point, and the
next point after the current point
The force at the currently selected point
The number of impulses per second,
averaged out over 1,3,5 and 7 of the
previous impulses. This will give you
stroke rate, or step rate for example.
10
www.motionmaster.com.au
[email protected]
MotionMaster User Guide
Dynamics panel
Pitch
Roll
m/s
Time
Ov’all time
The pitch, in degrees at the current
point
The roll, in degress at the current point
The acceleration in meters per second
per second
The time from the start point when using
the replay function (a simple stop watch
function)
The time from the beginning of the
datafile for the currently selected point.
GPS panel
For motionmaster files from a MotionMaster device fitted with a GPS unit the
following information is displayed:
Speed
The speed in km/h at the selected point
Time
The timestamp for the currently selected
point
Distance
The distance from the starting point
when in replay mode
Lat
The Latitude of the currently selected
point
Lng
The longitude of the currently selected
point
Total Distance
The total distance covered by the data
file
Main Graph Display
Data is displayed in one large graphing window. Data for the different axes can be
turned on and off. You can zoom in and out and scroll as needed.
In the following screenshot we’ve got the Y and Speed information showing.
Clicking on the name of any of the data series in the legend will toggle it between
visible and hidden.
When the series is visible, a green tick is displayed, when a series is hidden, a red
cross is displayed. When turning on and off series display, you may need to use
the verticle zoom button to fit the data in, as it may not fit your current view.
Pressing this button adjusts the verticle size of the graph to include all data points,
with out adjusting the horizontal zoom.
11
www.motionmaster.com.au
[email protected]
MotionMaster User Guide
Map tab
The map tab displays the recorded track from GPS models. When viewing a non
GPS enabled data file a default image of a map of the earth is displayed instead
When clicking on a point in the Replay tab, the corresponding point in the track on
the Map is then highlighted, with a small pop up displaying information for that
point.
When in replay mode, the point moves as the track moves, allowing you to see the
how you have moved along the track
You can select different map providers in th preferences of the MotionMaster
software, and the map will also cache the map images locally, so you can still view
the map later on, even if you don’t have a connection to the internet.
You can use the map zoom in/out toolbar buttons to zoom. To move the map
around left click and hold with the mouse and then drag the map to move it.
12
www.motionmaster.com.au
[email protected]
MotionMaster User Guide
Editing preferences
MotionMaster settings allow finer control over how your data is processed and
displayed. These settings are applied to the log fiel when it is read by the software,
and are not permanent in the log file. So if you were to change the settings after
viewing a logfile, the output could be quite different. Generally there is not a great
need to change these settings often, but they are available.
The common settings tab has some of the more general settings.
Log path
You can set a default folder to open
when pressing the open file button, this
is useful if you copy your logfiles off the
motionmaster device and store them in
a common folder on your computer.
Map Type
Used to set what mapping provider to
use to generate the GPS map. There
are a lot to choose from, all with their
own pros and cons. If you have a data
file loaded with gps data, select the map
tab, and then go into the preferences
setting, and try changing this settings.
You’ll see it update in real time.
13
www.motionmaster.com.au
[email protected]
MotionMaster User Guide
Home Location
Not yet active, in a future version will be
used to set your home (starting) location
in the map view tab
Gyro filter
Adjusts the gyrscope sensitivity
Angle filter
Adjusts the Angle sensitivity
The gyro and angle filter settings are two of the most important settings in the
software. They control the relationship between how much we trust the
accelerometers vs the gyroscopes. In a fast moving motion, with lots of angular
change, we’d need to trust the gyros more than the accelerometers. In a fast
moving motion with very slight angular changes, we’d trust the accelerometers
much more than the gyroscopes. Contact us for more information on how to set
these up, as a minor change can have a big impact!
All settings on the tab relate to the way data is displayed on the graph
Often a device, when used moany times, is normally placed in the same position
each time a log file is recorded. Due to the influence of gravity, the accelerometer
values can be thrown off the graph, or they may be appart from each other. These
settings here are used to zero each data series, allowing you to overlay them over
each other. Its very important to have the axis you ar analyzing, zeroed out
correctly, so you can rely on the output figures for acceleration. Most users will
generally track trends form peak to peak, not actual values from session to
session, which makes this less important.
To zero out a dataseries:
1. Set all the zero values to 0
2. Attach your motionmaster device as you normally would, and turn it on.
14
www.motionmaster.com.au
[email protected]
MotionMaster User Guide
3. Record at least 30 seconds of information.
4. Plug your motionmaster device in and read the log file.
5. Click on the axis near a nice flat portion of the graph (most of the graph
should be flat!)
6. Read the Impulse Force value, this is the value to use to zero out the graph.
X zero
The X axis zero figure
Y zero
The Y axis zero figure
Z zero
The Z axis zero figure
Anlyse
The axis to analyse the impulses for.
Impulse cut
The upper cut off range to stop
displaying impulse figures. Sometimes
your impulse values can jump when the
device is in a resting state, any impulses
above this value simply wont be
displayed in their respective 1,3,5,7
impulse count fields.
Calc Impulses
Whether or not to calculate impulses. Its
useful to turn this off when measuring
the motion of things such as motorsport
activities etc where there is no repeated
action to be measured, such as a
paddle stroke on a kayak.
Accel Multiplier
The multiplier to apply to the graphed
acceleration values. As the scale of
acceleration vs speed can mean the
data is not very easily aligned/overlaid
in the graph, you can appky a scale
factor to increase the amplitude of the
acceleration data. This doesn’t affect
any of the text based display
information, only the graph display.
This settings in applied each time a file
is loaded.
15