1
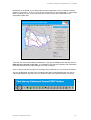
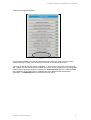
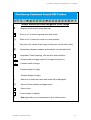
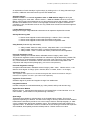
Peel-Harvey Biodiversity DSS Toolbox User’s Manual
Peel-Harvey Catchment Biodiversity DSS
Toolbox User’s Manual Vers.2
Based on Land Monitor™ and ancillary data and delivered through Landgate™
This Decision Support System Toolbox has been made available through a partnership between
the Peel-Harvey Catchment Council and the Dept of Land Administration and has been
designed to suit the Peel-Harvey Catchment. Additional data layers and modifications to the
existing layers can be made and the content and use will be reviewed in late 2006.
Funding for the for the original biodiversity project that has progressed to develop this Toolbox
was provided by the Natural Heritage Trust (NHT), a joint initiative of the Western Australian
and Australian Governments and administered by the South West Catchments Council. The
development of the DSS Toolbox would not have been possible without the significant efforts of
Adrian Allen and his team at the Department of Land Administration; all credit and much
appreciation is given for their work and that of Dr Peter Hick from the Peel-Harvey Catchment
Council.
The web address for the PHCC Biodiversity DSS Toolbox is:
http://landmonitor.dli.wa.gov.au/peel-harvey.asp
Access is available through the World Wide Web although a username and password is
required. The need for a formalised login has not been done to restrict usage, we welcome and
encourage any use of the system but do need to track who is using the system (which helps
with applying for on-going funding) and importantly to protect the intellectual property involved
and limit access to some data within the system which has been donated to the PHCC for noncommercial use only.
To be provided with a username and password please email the PHCC Executive Officer
via [email protected] or phone (08) 95504225.
Peel-Harvey Catchment Council
1
Peel-Harvey Biodiversity DSS Toolbox User’s Manual
Depending on the speed of your internet link and the configuration of your screen this should
appear on your screen. If not, you may have to check with your service provider, or if the image
below is partially on your screen you may have to reset your screen configuration to an
appropriate aspect ratio.
There are two menus that initially need attention. They are the Tools (across the top) and the
Data Layers (in the box on the side. It is advisable in the interest of speed of the download to
select the area of interest, and initial layers you wish to display.
(click on the zoom button and then on the image drag a selection box over the area of interest)
This can be altered at any time but for simplicity start with a general display layer eg: click on
“Other Map Datasets” say with one or two levels of roads for the general location of interest.
Peel-Harvey Catchment Council
2
Peel-Harvey Biodiversity DSS Toolbox User’s Manual
Then select an appropriate layer:
This should now display your area of interest with major and minor roads. Now if the area
needs redefining it is easy to do so before the inclusion of the various data layers.
The menu of data layers and options is selected, D with the cursor and when active shows (1
on). Usually only one selection from the data layer menu can be viewed at once, but integrated
products can be built up and stored. However, the Other Data Sets option is usually activated
at the beginning to set up the level of cadastral and vector data that suits the particular
application. The REFRESH button will activate the new choice.
Peel-Harvey Catchment Council
3
Peel-Harvey Biodiversity DSS Toolbox User’s Manual
Toolbar buttons provide navigation of the image

Displays whole extent image data set.
®
Zoom in x 2 or select required area with cursor.
\
Zoom out x 2, based on centre or cursor position.
®
Pan (move the centre of the image to this point, select with cursor)
L
Information (displays cadastre and statistics for selected block)
IiII
Vegetation Trend Graphing, click on then select location.
Expand width of image (useful to fit report formats etc.)
Contract width of image
Expand height of image
Contract height of image
H
Search tool (enter site name and cords will be displayed)
¬
Various Printer options and paper sizes
Save to disc
V
Current layers in display
Help (generally more comprehensive than follows here)
Peel-Harvey Catchment Council
4
Peel-Harvey Biodiversity DSS Toolbox User’s Manual
An explanation of each data layer is given simply by clicking on the “?” along side each layer.
However, additional notes about each layer are also added here.
Agimage Imagery
BIOMASS based on normalised vegetation index or RGB satellite image for each year
(Winter Spring) from 1993-2004. Need to selectD Perth and Collie scenes to cover PHC*.
Mainly useful for agricultural estimates of crop and pasture progress and variability. AgImage Biomass scale References to "NVDI" under AgImage have been changed to "Biomass" for
consistency. Also, the Biomass scale is now only visible when at least one biomass image has
been turned on.
Landsat Satellite Imagery
Background images using traditional enhancements to represent airphoto-like content
Salinity Monitoring data
D Shows areas mapped as salt scalds (Orange = 1988-91, Red = 1991-98)
D Shows areas mapped as salt scalds with background image
D Shows areas mapped as salt scalds with remnant vegetation mask.
Valey Hazard (Potential High Watertable)
D “Valley hazard” based on valley contour, maps area within +2 m of flowpath.
D “Valley hazard” maps area within +2 metres with background image.
D “Valley hazard” within +2 metres with salinity scalds and remnant vegetation.
Perennial Vegetation Cover
Vegetation coverage for individual dates, calibrated summer imagery 1988 – 2004.
The perennial vegetation masks are derived from reflectance signals detected by Landsat TM,
and depend on a contrast between vegetation and other cover types (soil, crops, bare rocks
etc). The thresholds for classification of bush have been derived from interpretation and
comparison with maps and air photography. (see notes for full explanation)
Perennial Vegetation Change
Compares individual dates, calibrated summer imagery 1988 – 2004. Need to select D the
dates to show degree of change. (Red = decline, Blue = increase, Green = no change)
Vegetation Trend
The ‘Vegetation Trend’ product is a multi-channel image file that contains summaries of change in
reflectance of vegetation over time. (see notes for full explanation)
Vegetation Trend Classes
Classifies degree of positive and negative change from stable state
Integrated Products
Includes examples of combined datasets (eg. Valley hazard, salinity and remnant veg)
Digital Elevation Models
Need to select D appropriate enhancement to suit Coastal Plain or Inland at either 10 or 25
metre models. (Some areas not completed at high resolution)
Spot Image
These data are available for a limited area on the Coastal Plain at present. This may be
expanded depending on demand. The date of this image is January 2005 and several standard
treatments are included to provide a “true colour image” similar to aerial photography, a “falsecolour” infrared image that shows vegetation vigour, and a biomass image that is based on a
vegetation index. A “feed-back” button is included as we are wishing to evaluate the expansion
of this dataset, both spatially and with refined products. Please comment on value.
Peel-Harvey Catchment Council
5
Peel-Harvey Biodiversity DSS Toolbox User’s Manual
Aerial Photography
The area of coverage must be selected from different sources that relate to photographic
missions. Prior knowledge is required of extent of local coverage. If unsure select several, but
additional unwanted area of coverage will slow down refresh speed.
Other Data Sets
Multiple selections D can be made to suit application. (Other layers can be added, eg. DRFs)
D Cadastre (most property and reserve boundaries)
D Peel-Harvey Catchment boundary
D Basins (sub-catchments, needs up-grading - DoE)
D Catchments (major subcatchments)
Pastoral boundaries (not relevant)
D Roads (major and minor)
D Water Bodies (major lakes and dams)
D City/Towns
D Shire Boundaries
Contours (not yet working)
Property Street address (not at relevant scale)
Options with M indicate that Metadata may be available
Coordinate grids are added to all printouts. They are added automatically when you click on
one of the print icons, and there are four different grids - 100km, 50km, 10km, 1km - and the
grid added depends on the scale to which you have zoomed in. The grids are labelled, however
the labels won't show up if labels from other layers are in the way - so if there are a lot of
cadastre or road labels showing you may not see the coordinate labels.
If the coordinate grids are required when viewing the website, (not just on printouts), a checkbox
under "Other Map Datasets" can be applied. The grids are turned on by default so you can turn
them off by unchecking this checkbox.
Three Layers of Roads The road layers available are "Major", "Sealed", and "Formed", and
can be turned on or off independently. Labels should become visible when you zoom in far
enough, and the roads can be identified using the "Identify" tool.
Road searching is additional to the existing search function. Currently you enter a search term
which is compared against road names, and select the road type (e.g. HWY, RD, ST) from a
drop down list. Because this list is populated in real time from the roads in the Peel Harvey
area, it takes a long time to load, so when you click on the Search button there will be a delay
while this occurs. Limiting the search to only one or two of the road layers will increase the
speed at which search results are returned.
Once your results are returned, you can click on "View" to zoom to the extent of that road. Most
of the results you get should be in the Peel Harvey area, but the search is limited to a rectangle
area, not the actual Peel Harvey polygon, so you may get some results falling outside of the
Peel Harvey area. Limiting your search as much as possible should reduce the likelihood of this
occurring.
Peel-Harvey Catchment Council
6
Peel-Harvey Biodiversity DSS Toolbox User’s Manual
Vegetation Index Graphing
This tool creates charts which show Vegetation Index of a given pixel over time derived
from the Land Monitor dataset. It can be used regardless of what imagery is displayed
on screen,
Text values are also provided below the graphs, allowing you to paste the Vegetation
Index values into Microsoft Excel or other software.
For any selected location a graph of the vegetation index 1988- 2005 will be displayed for the
individual pixel (25mx25m) or 9 pixels 3x3 (75m x75m) or 25 pixels 5x5 (125mx125m). The raw
data are also listed and these can be exported to Excel or any stats package.
Vegetation Trend Class: Large Decrease - Note that the Vegetation Index value graphed is
inversely proportional to vegetation density – a low value on the graph represents high
vegetation density, and vice versa.
Peel-Harvey Catchment Council
7
Peel-Harvey Biodiversity DSS Toolbox User’s Manual
Holding your cursor above this button will bring up a list of all layers currently enabled on the
website. Imagery at the bottom of the list may sit on top of imagery at the bottom of the list.
Clicking on the button will bring up the list of enabled layers in a new window.
Information
Cadastral and other staistical data can be sourced by clicking the “i” button when for a region
selected by the cursor. The image will redisplay and beneath the image a list of all relevant
data conatined for that region will be displayed. The source for this is Landgate and their
provisions and conditions must be respected.
Peel-Harvey Catchment Council
8