1
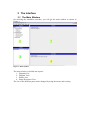
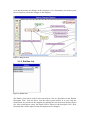
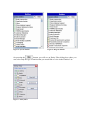
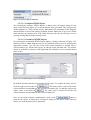
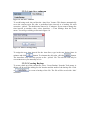
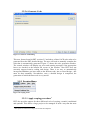
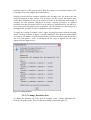
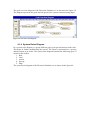
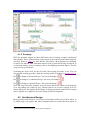
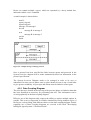
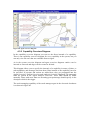
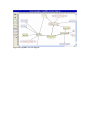
Prometheus Design Tool
Version 2.5
User Manual
Authors: Lin Padgham, John Thangarajah, Paresh Paul
RMIT Agents Group
[email protected]
1
2
Contents
Introduction.......................................................................................4
Installation and Setup ........................................................................4
2.1
Downloading the standalone application .................................................... 4
2.2
Using as standalone application.................................................................. 4
2.3 Downloading the Eclipse plug-in ..................................................................... 5
2.4
Using as an Eclipse plug-in ........................................................................ 5
3
The Interface .....................................................................................6
3.1
The Main Window ..................................................................................... 6
3.1.1
Diagrams List..................................................................................... 7
3.1.2
Diagram View.................................................................................... 7
3.1.3
Entities List ........................................................................................ 8
3.1.4
Entities Descriptor View .................................................................. 10
3.2
Menu bar ................................................................................................. 11
3.2.1
File Menu......................................................................................... 11
3.2.2
Tools Menu ...................................................................................... 11
3.2.3
Scoping Menu .................................................................................. 16
3.2.4
Entities Menu ................................................................................... 19
3.2.5
View Menu ...................................................................................... 22
3.2.6
Help Menu ....................................................................................... 24
4
Diagrams......................................................................................... 27
4.1
System Specification................................................................................ 27
4.1.1
Analysis Overview Diagram............................................................. 27
4.1.2
Scenarios Diagram ........................................................................... 29
4.1.3
Goal Overview Diagram................................................................... 30
4.1.4
System Roles Diagram ..................................................................... 31
4.1.5
Scoping ............................................................................................ 32
4.2
Architectural Design ................................................................................ 32
4.2.1
Data Coupling Diagram.................................................................... 35
4.2.2
Agent-Role Grouping Diagram......................................................... 36
4.2.3
Agent Acquaintance Diagram........................................................... 37
4.2.4
System Overview Diagram............................................................... 38
4.3
Detailed Design ....................................................................................... 39
4.3.1
Agent Overview Diagram................................................................. 39
4.3.2
Capability Overview Diagram .......................................................... 41
5
Entities ............................................................................................ 43
5.1
5.2
5.3
5.4
5.5
5.6
5.7
5.8
5.9
5.10
5.11
5.12
5.13
Action...................................................................................................... 43
Agent ....................................................................................................... 43
Capability ................................................................................................ 43
Message................................................................................................... 43
Data ......................................................................................................... 44
Role ......................................................................................................... 44
Goal......................................................................................................... 44
Percept..................................................................................................... 44
Plan ......................................................................................................... 44
Protocol ................................................................................................... 45
Scenario ................................................................................................... 45
Actor........................................................................................................ 45
Edge ........................................................................................................ 45
6
How To ........................................................................................... 46
6.1
Do file manipulations............................................................................... 46
6.1.1
Start working on a new file............................................................... 46
6.1.2
Open an existing file ........................................................................ 46
6.1.3
Save the current file.......................................................................... 46
6.1.4
Save a copy of the current file .......................................................... 46
6.1.5
Close the current file ........................................................................ 46
6.1.6
Quit the Prometheus Design Tool..................................................... 46
6.2
Performing Crosscheck functionality ....................................................... 46
6.3
Save diagrams in PNG format .................................................................. 46
6.4
Generate HTML reports........................................................................... 46
6.5
Change the frequency of Auto Save ......................................................... 46
6.6
Create a backup file ................................................................................. 47
6.7
Apply scoping procedure ......................................................................... 47
6.8
Change the partitions size used for scoping .............................................. 47
6.9
Add an entity ........................................................................................... 47
6.10 Edit the description of an entity................................................................ 47
6.11 Remove an entity ..................................................................................... 48
6.12 Edit the steps in a scenario ....................................................................... 48
6.13 Edit a protocol ......................................................................................... 49
1 Introduction
The Prometheus Design Tool is a graphical editor which supports the design tasks
specified within the Prometheus methodology for designing agent systems. It is
developed to support the design and development of multi-agent systems. It is
intended to support software engineers and developers in both developing and
documenting the various aspects of specifying and designing a system using an agent
oriented approach. The three design phases in Prometheus, which are supported
within the tool, are:
1. System specification: in which actors (human or software) expected to interact
with the system, are identified, along with the interface to the system in terms
of actions and percepts; system goals are elaborated, and scenarios described
in terms of sequences of steps are developed. Roles encompassing small
chunks of functionality (identified by goals, percepts and actions) are
described and captured.
2. High-level (architectural) design: in which the agent types that will exist in
the system are defined by combining roles, the overall structure of the system
is described using a system overview diagram, and interaction protocols are
used to capture the dynamics of the system in terms of legal message
sequences.
3. Detailed design: in which the internals of each agent are developed in terms of
capabilities, events, plans and data.
The design tool assists the developer in maintaining consistency as a design changes
and develops. It also propagates information from abstract to more detailed design
levels as well as checking some aspects of the design. The files generated by the
Prometheus Design Tool are in XML format with extension ‘.pd’. The design tool
also generates skeleton code in JACK, and design reports in HTML.
2 Installation and Setup
The Prometheus Design Tool is written in Java and runs on any platform supporting
Java. (PDT version 2.5 requires Java 1.5.) It can be downloaded from
http://www.cs.rmit.edu.au/agents/pdt. The tool may be used as a standalone
application or it can be used as a plug-in for Eclipse.
2.1 Downloading the standalone application
1.
2.
3.
4.
Go to http://www.cs.rmit.edu.au/agents/pdt
Click on `PDT Download'
Fill in the details and click `Download PDT'
Save the jar file to the desired location
2.2 Using as standalone application
1. You need to also ensure you have Java 1.5 or above
2. Double click on the jar file (Windows) or do java -jar <jar file name> from
the command prompt if it doesn’t work or if you use UNIX.
3. Choose ‘Open’ from the file menu, and select the .pd file. You can also put the
filename on the command-line in UNIX.
4. An example file can be downloaded from the website. It is a project of an
Electronic Bookstore. To download the ‘.pd’ file, visit the website
(http://www.cs.rmit.edu.au/agents/pdt). You can find it in the `Documentation'
section.
2.3 Downloading the Eclipse plug-in
1.
2.
3.
4.
Go to http://www.cs.rmit.edu.au/agents/pdt
Click on `Eclipse plug-in for PDT'
Fill in the details and click `Download PDT Plugin'
Save the file to the desired location and extract into plugins folder of Eclipse
2.4 Using as an Eclipse plug-in
1. You need to also ensure you have Eclipse 3.0 or above and Java 1.5 or above.
2. If you have downloaded PDT plug-in for eclipse and extracted into plugins
folder, PDT will be detected on starting Eclipse.
3. To confirm, go to Help->About in Eclipse, click on the Plug-in Details button
on the about screen and scroll down the list of plug-ins till the end. There
should be a plug-in named PDT Plug-in.
4. For eclipse, you need to either:
a. Import a .pd file into your working directory and double click it, or
b. Create a new .pd file (empty text file, with extension ".pd") within
your working directory and double click; this should open PDT with a
new project.
5. To open, double click ‘.pd’ file or right click and open with PDT.
3 The Interface
3.1 The Main Window
On invoking the standalone interface, you will get the main window as shown in
Figure 1.
Figure 1. Main Window
The main window is divided into 4 parts:
1. Diagrams List
2. Diagram View
3. Entities List
4. Entity Descriptor View
The size of the different parts can be changed by using the mouse and resizing.
3.1.1 Diagrams List
Figure 2. Diagrams List
The diagrams list contains the list of all diagrams grouped into 3 levels of the design
which corresponds to the 3 phases in the Prometheus methodology:
1. System Specification
a. Analysis Overview Diagram
b. Scenarios Diagram
c. Goal Overview Diagram
d. System Roles Diagram
2. Architectural Design
a. Data Coupling Diagram
b. Agent-Role Grouping Diagram
c. Agent Acquaintance Diagram
d. System Overview Diagram
3. Detailed Design
a. Agent Overview Diagram
b. Capability Overview Diagram
You can click on each diagram to view the contents in the Diagram View.
3.1.2 Diagram View
The diagram view shows the contents of the selected diagram in the Diagrams List.
Figure 3 shows the System Overview Diagram of the example electronic Bookstore.
The tool bar to the left of the Diagram view contains the entities that are applicable to
the diagram. You can add entities, delete them, edit them or make connections
between the entities in the diagram view. To add an entity, click on the corresponding
icon and click on the diagram, where you want the entity to be placed. A dialog box
will appear asking for the name of the new Entity or to select an existing entity from
the list. To edit the name or the description of the entity, select it from the diagram
view and then make the changes in the descriptor view. Sometimes you need to press
the set button to refresh the changes in the diagram.
Figure 3. Diagram View
3.1.3 Entities List
Figure 4. Entities List
The Entities List can be used to select an entity to view its description in the Entities
Descriptor View. You can opt to view the entire system entities or to view only the
entities that are present on the diagram by making the selection from the drop down
list. After selecting an entity, the details will be shown in the descriptor view. Here
the name and various aspects of the description can be changed.
Figure 5. System Entities
Figure 6. Diagram Entities
button, you will see an Entity Filter dialog box where you
On pressing the
can select only the type of entities that you would like to view in the Entities List.
Figure 7. Entity Filter
3.1.4 Entities Descriptor View
The Entities Descriptor view shows the description of the selected Entity in the
Entities List. The figure 8 below shows the entity descriptor for the book ordering
protocol from the Electronic Bookstore example.
Figure 8. Entity Descriptor View
The contents of the Descriptor form vary between entities. Some of the fields can be
edited whilst some cannot be edited. For example if Figure 8, for a particular protocol,
it is possible to edit the Scenarios but not the Agents.
After changes are made via the descriptor form, use the “set” button at the bottom
right hand corner to apply these changes.
From the descriptor view you can also delete an entity from the project. When you
delete an entity from the project all links to this entity will be removed. That means
that if you remove an entity and change your mind you will have to recreate all
information for the entity.
3.2 Menu bar
3.2.1 File Menu
The File menu contains all the standard
file manipulation options as in Figure
9. Use this menu to:
New – Create a new ‘.pd’ file.
Open – Open an existing ‘.pd’file.
Save – Save the current ‘.pd’file.
Save As – Save a copy of the current
‘.pd’file.
Close – Close the current ‘.pd’file.
Exit – Quit the Prometheus Design
Tool Interface.
Figure 9. File Menu
3.2.2 Tools Menu
Figure 10. Tools Menu
3.2.2.1 Crosscheck
PDT prevents inconsistency between different levels of detail. For example, it is not
possible to create an incoming percept to a plan within an agent, without that percept
also being shown on the system overview diagram, as incoming to the agent whose
plan it is. Similarly if an agent is specified only as reading a belief set, it cannot
contain a plan which writes to that belief set.
The other aspect is a consistency check that is performed on demand, using the Tools
menu with the Crosscheck option. This generates a list of errors and warnings that can
be checked by the developer. Examples of a warning are writing of internal data that
is never read, while an example of an error is a mismatch between the interaction
protocol specified between two agents and the messages actually sent and received by
processes within those agents. The consistency checking is based on the relationships
between design artefacts documented in the Prometheus methodology, not on an
explicit meta-model.
Select ‘Crosscheck’ from the Tools menu to invoke the crosschecking functionality of
the Prometheus Design Tool. A window as shown in Figure 11 will appear. Select
from the ‘consistency check alternatives’ group if you want to include Agents and/or
Capabilities in the check. Also select the entities under the ‘Find unused’ group to
find any broken entities from the project. This is very useful when a project undergoes
many changes and some unused entities remain in the project definitions, although
deleted from the diagrams/specifications. Select which of the ‘Ok’, ‘Warnings’ or
‘Errors’ that need to be displayed. After the necessary selections have been made, hit
the
button. The tool will search for all the selected inconsistencies and will
come up with a dialog as shown in Figure 12.
Use the
button to close the dialog and use the
error display text area.
Figure 11. Consistency Checking Dialog
button to clear the
Figure 12. Consistency Checking Dialog with Errors
The first warning states that there is an action named ‘Other’ that is not linked to any
of the agents.
3.2.2.2 Save Diagram as PNG
You can export any of the diagrams from PDT as an image with .PNG (Portable
Network Graphics) extension. This file format can then be opened in almost all
picture viewers for printing or editing. This is a nice functionality when you need to
insert diagrams into System Specification documents.
To use this functionality, Select ‘Save Diagram as PNG’ from Tools menu. You will
get a dialog asking the location where you want to save
the picture file. You can change the resolution of the
picture by changing the fields.
Provide a location, type in a name and click
to save the file.
3.2.2.3 Generate Report submenu
One of the useful features of PDT is its ability to generate a design document in
HTML format. This document contains both figures and textual information. The
textual information is obtained from the descriptors of each entity. The document also
contains an index (.Dictionary.) over all the design entities.
Select ‘Generate Report’ from the Tools menu and you are provided with 2 options.
There is provision to either generate a complete HTML Report or a Customized
Report.
Figure 13. Generate Report Submenu
3.2.2.3.1 Complete HTML Report
On selecting the complete HTML Report, A dialog box will appear asking for the
name of the directory where you want the Report to be generated. This will generate
all the diagrams in ‘.PNG’ format and an ‘index.html’ file containing all the diagrams
and the details of each of the entities in tabular format. Make sure to give a new folder
name that does not already exist. If the folder already exists, the tool will give an error
message stating that the folder already exists.
3.2.2.3.2 Customized HTML Report
On selecting the customized HTML Report option, a dialog as shown in Figure 14 is
displayed. Select which diagrams need to be included in the report by checking the
appropriate options. You can also select which entity instances to include from a
selected entity type. All the entity types are shown on the left hand side. The entities
which are selected are shown on the right hand side and those are not selected shown
in the centre.
Figure 14. Customized Report Generation Dialog
By default all entity instances are included in the report. To exclude an entity, select it
from the right most list and click
. The entity will be removed from the
selected entities list and added to the non selected entities list. To add any entity to the
report, select it and click on
. The entity will be removed from the non
selected entities list and added to the selected entities list.
Once you are done with the customization, click on the
button to
generate the report. A dialog box will appear asking for the name of the directory
where you want the Report to be generated.
3.2.2.4 Auto Save submenu
Figure 15. Auto Save Submenu
To avoid losing work, the tool has the ‘Auto Save’ feature. This feature automatically
saves the current open file after a predefined time interval as a backup file with
extension ‘.pd.bak’. The default time interval is 15 minutes. If you want to change the
time interval to another value, select AutoSave -> Time Settings from the Tools
menu. You will get a dialog as shown in figure 16.
Figure 16. AutoSave Settings Dialog
To assign the new time interval for the Auto Save, type in the new desired time in
minutes and click
button. To reinstate the old value, click the
button.
The AutoSave only saves the project to the ‘.pd.bak’ file. The old file will only be
overwritten once you manually save it.
3.2.2.5 Creating Backup
To create a back up of the current file, select ‘Create Backup’ from the Tools menu. A
dialog will be provides asking for the location and the name of the backup file. Click
on
extension.
to create a backup of the file. The file will be saved with ‘.bak’
3.2.2.6 Generate Code
Figure 17. Genarate Code Dialog
This new feature found in PDT versions 2.5 and above, allows JACK code stubs to be
generated from the PDT detailed design. The user will need to manually complete the
code that is automatically generated. Figure 17 shows the code generation window.
The console window will display any error and warning messages if the appropriate
boxes are checked at the bottom left corner of the window. Also PDT does not
currently support iterative coding and design. There is no way to automatically
incorporate additions you have made to the skeleton code, into a revised design – this
must be done manually. Nevertheless, once a detailed design is completed, the
generation of initial skeleton code is very useful.
3.2.3 Scoping Menu
Figure 18. Scoping menu
3.2.3.1 Apply scoping procedure1
PDT also provides support for three different levels of scoping, essential, conditional
and optional. This allows a large project to be managed in such a way that the most
1
This aspect has some known bugs and is under development
important aspects of the system can be fully developed, in a consistent manner, prior
to starting work on less highly prioritised aspects.
Scoping is done based on scenarios, ranked by the developer on a five point scale, and
is then propagated to other entities. The developer can also specify the relative sizes
of the three partitions (levels) of the system in terms of the allowable percentage of
scenarios in each partition. When the developer requests scoping to be applied
(available from the tool menu in PDT), the scenarios are partitioned in a way that is as
close to the specified partition sizes as possible. All other entities are then assigned to
the appropriate partition in order to maintain overall consistency.
To apply the scoping procedure, select ‘Apply Scoping Procedure from the Scoping
menu. A dialog as shown in figure 19 will be displayed. This shows the total number
of scenarios, the number of prioritized and non-prioritized scenarios and the partition
size. For each option, a score is calculated and the scope is applied for one of the
options with the highest score.
Figure 19. Scoping Statistics
3.2.3.2 Change Partitions Size
To change the partition size to be used for scoping, select ‘Change Partitions Size’
from the ‘Scoping’ menu. This will display a dialog as shown in figure 20.
Figure 20. Partition Sizes Dialog
The default values of the are already set as shown in the figure. To change the values,
just type in the new values and press ‘Ok’.
3.2.4 Entities Menu
The Entities menu contains the operations that are applicable to an entity in the
diagram. It has 3 submenus.
1. Create Entity
2. Edit Scenario
3. Edit Protocol
Figure 21. Entities Menu
3.2.4.1 Create Entity submenu
Figure 22. Create Entity Submenu
You can use the Create Entity Menu to add an entity into the project. You can see a
list of all the Entities in the submenu. Select an entity to add it to the project. A dialog
box will appear asking for the name of the entity. Type the name and click ‘Ok’ to
add the entity to the project. If you look through the diagrams, you will see the entity
appears as a light shade in all the applicable diagrams. Please refer to Section 4 to get
the list of applicable entities for each diagram. Adding an entity will in some cases
cause it to be automatically added to a diagram. An agent entity will be automatically
added to the system overview. You must then integrate the entity by placing it
appropriately and linking to other entities.
3.2.4.2 Edit Scenario submenu
Figure 23. Edit Scenario Submenu
Refer to Section 5.11 to know more about a scenario. You can use the Edit Scenario
submenu from the Entities menu to edit the steps in a scenario. A list of all the
scenarios in the project is displayed as shown in figure 23. Upon selecting a scenario,
you will get a dialog as shown in figure 24. There is option to insert, reorder and
remove steps within a scenario.
Figure 24. Edit Scenario Dialog
Use the up and down arrows to reorder the steps in a scenario. Editing the step
invokes the step description in a separate dialog as shown in figure 25. The following
types of steps can be a part of a scenario:
1. Action
2. Goal
3. Percept
4. Another Scenario
5. Others
Figure 25. Edit Step Dialog
This dialog is also obtainable by double clicking on the scenario in the scenario
diagram.
3.2.4.3 Edit Protocol submenu
Use the Edit Protocol submenu from the Entities menu to edit the messages in a
protocol. A list of all the protocols in the project gets displayed as shown in figure 26.
Upon selecting a protocol, you will get a dialog as shown in figure 27. It shows the
textual notation and the corresponding diagrammatic notation. Editing protocols is
done by changing the textual notation of the protocol - see section 4.2 for details on
the textual notation.
Figure 26. Edit Protocol Submenu
Figure 27. Edit Protocol Dialog
3.2.5 View Menu
Figure 21. View menu
1. Entity Dictionary
2. Project Properties
3.2.5.1 Entity Dictionary
Entity dictionary displays the list of all the entities in the current project as shown in
figure 29. This displays the same entities that we see in the Entities List when viewing
the system entities as mentioned in section 3.1.3. The default ordering is with types.
To change the ordering according to the alphabetical order of names of the entities,
click on ‘Name’ at the top. To make the ordering according to the type, click on
‘Type’ at the top.
Figure 29. Entity Dictionary
3.2.5.2 Project Properties
To edit the project properties, select Project Properties from the view menu. You will
get a dialog as shown in figure 30.
Figure 30. Project Properties
You can edit the name, description, author’s name and version of the project. Just edit
the fields and click ‘Ok’ to commit the changes.
3.2.6 Help Menu
Figure 31. Help menu
3.2.6.1 About
‘About’ shows a dialog with some brief details about the Prometheus Design Tool as
shown in figure 32.
Figure 32. About Dialog
3.2.6.2 New Features and Enhancements
To get the version history or bug fixes and new enhancements made to the tool at each
version, use select ‘New Feature and Enhancements’ from the Help menu. You will
get a dialog as shown in figure 33.
Figure 33. New Features and Enhancements
3.2.6.3 Online PDT Documents(PDF)
It gives access to two documents on the web,
(1) PDT Manual
(2) PDT Tutorial
These documents are in Portable Document Format(PDF) web, the
user should have access to internet and Adobe acrobat reader to view
these documents.
4 Diagrams
4.1 System Specification
During System Specification it is necessary to define the expected interactions with
the system, the system goals, the roles within the system to be designed, and some
scenarios that provide a sense of what the system will do. It can also be desirable to
specify the interface between the system and its environment in terms of "percepts"
(incoming information) and "actions" (outgoing information/actions).
4.1.1 Analysis Overview Diagram
Figure 35. Analysis Overview Diagram
An analysis overview diagram is used to develop the high level view of the system
requirements.
Use the Analysis Overview diagram:
• To specify key external actors that will use the system, and key scenarios they
will be involved in.
• To link the actors to the scenarios they are involved in, using percepts and
actions. Percepts are signals from actor to system. Actions are responses from
the system, possibly directed towards a particular actor.
This diagram can be used very freely to sketch a design of the system. All icons are
available and are linkable to all other icons. One way to use this diagram is to develop
an Actor-Scenario diagram. It is also possible to specify a range of other diagrams and
relationships. Entities introduced are placed in the lists of entities, but no relationships
are propagated from this diagram.
The diagram view is as shown in figure 35. Use the toolbar as shown in figure 36 to
add the entities to the diagram. Most of the diagrams in the project have a toolbar
associated with it similar to this one and functions in the same way.
Help Icon
Notes Icon
Remove
Actor
Scenario
Goal
Action
Percept
Message
Data
Protocol
Edge
Scoping buttons
Figure 36. Analysis Overview Toolbar
The “Help” icon is used to access the help text associated with each diagram in the
project. Click on the icon to get an idea of the diagram you are currently viewing.
It is also possible to add notes for each diagram. In order to access the notes simply
right click on any empty space in the diagram and the notes area will appear at the
point of click as shown in figure 37. Click elsewhere on the window and the noted
will be hidden.
Figure 37. Analysis Overview Diagram notes
4.1.2 Scenarios Diagram
A scenarios diagram represents the different scenarios that can exist in the system.
Double click on the scenario to enter the different steps within a scenario. Steps may
be goals, actions, percepts or other scenarios. In the process of developing scenarios,
new goals (and scenarios) are often identified. This leads to further work linking the
new goals into the goal hierarchy. Arrange the visual scenario hierarchy in the
Scenarios diagram for understanding of scenario relationships.
The Scenario Diagram contains only one type of entity in the toolbar:
1. Scenario
The scenario diagram of the Electronic Bookstore is as shown in the figure 38.
This diagram is used mostly only to have a graphical interface to scenario editing for
consistency.
Figure 38. Scenarios Diagram
4.1.3 Goal Overview Diagram
The goal overview diagram is a directed acyclic graph of all goals in the system.
Use the Goal Overview diagram to develop sub-goals (and possibly parent goals) for
the goals generated by the initial analysis. Sub-goals can be generated by asking "how
will the system accomplish this goal" Parent goals can be generated by asking "why
does the system accomplish this goal".
In this diagram you can create new goals to the system or create or remove
connections between the goals in the diagram.
You are not able to make cyclical dependencies between the goals that mean that you
cannot draw an edge from a goal to another if that will mean that a cycle will be
created.
This diagram is used to conceptualize and design the goals in the system. Often
similar goals may be merged and linked to from different places. Considerable effort
must be used in layout for it to be useful.
You cannot remove a goal from the diagram since all goals in the system should be
shown in this diagram. If you wish to remove a goal from the diagram you will have
to delete the goal from the system using the delete button in the descriptor for that
goal.
The goal overview diagram contains two types of entities in the toolbar:
1. Goal
2. Edge
The goal overview diagram of the Electronic Bookstore is as shown in the figure 39.
The diagram represents the goals and sub goals of the system connected using edges.
Figure 39. Goal Overview Diagram
4.1.4 System Roles Diagram
In a system roles diagram, we group different goals, percepts and actions under roles.
This helps in further modularizing the system. The input is represented as a percept
and the output as an action. The system roles diagram contains the following types of
entities in the toolbar:
1. Role
2. Goal
3. Action
4. Percept
5. Edge
The system roles diagram of the Electronic Bookstore is as shown in the figure 40.
Figure 40. System Roles Diagram
4.1.5 Scoping2
PDT also provides support for three different levels of scoping, essential, conditional
and optional. This is a functionality only present in the system specification diagrams
currently. Refer to 3.2.3.1 for more details. This allows a large project to be managed
in such a way that the most important aspects of the system can be fully developed, in
a consistent manner, prior to starting work on less highly prioritised aspects. Use the
scope icons to perform this.
On hitting the scope icons for the first time, the scoping procedure is run. You can
also run the scoping procedure from the Scoping menu as mention in section 3.2.3.1.
Hit
to change to Essential Scope. The icon will change to
Hit
to change to Conditional Scope. The icon will change to
.
.
to change to Optional Scope. The icon will change to
.
Hit
Once the scope has been changed, you will notice that some entities in the diagram
view will change the colour to grey. Entities that are at a lower scoping level are
shown faded out. This guides the developer to design prioritised entities first. Scoping
can be applied or re-applied at any time during system development.
4.2 Architectural Design
During architectural design it is necessary to determine which roles will be taken on
by which (types of) agents, and what communications are needed between agents in
2
This aspect has some known bugs and is under development.
order to realise the behaviour identified in the specification. It is also necessary to
identify any external data, or data to be shared by agents.
The suggested first step is to decide which roles should be grouped into which agents.
Various tools can be used to assist in this analysis, including data coupling diagrams.
However these are not really well supported yet in PDT. Once agent types have been
determined as groupings of roles, information about the goals of the agent types is
inferred from the Role-Goal relationships in the System Specification. Agent types
can be specified and associated with Roles graphically on the "Agent-Role Grouping
Diagram".
The next step is to specify the interaction protocols between agents. The book
"Developing Intelligent Agent Systems: A Practical Guide" provides some
mechanisms for going from scenarios to protocols. Protocols must be specified using
a textual notation that maps to AUML2. In PDT Protocols can be introduced either on
the system overview diagram (most commonly) or via the entities menu, or even on
the Analysis Overview diagram. To provide the detailed specification of the protocol
you must access the protocol editing window. This can be done either by double
clicking on the relevant protocol icon, in a diagram, or by using the Entities menu and
selecting Edit Protocol. The text tab on the protocol window allows you to type in a
textual representation of the desired protocol. The check button will check for and
notify errors. When you select the save button, the protocol is applied both to the
underlying model, and to the diagram available from the adjacent diagram tab. When
you save, any new agents or messages required by the definition are created, and the
protocol structure is shown as an AUML2 diagram.
The syntax used for the specification is defined by the following BNF:
Figure 41. The AUML Notation (BNF grammar)
A protocol starts with a ‘start <protocolname>’ and ends with ‘finish’. Basically the
contents of the protocol is defined by first specifying the agents that will participate in
the protocol, using ‘agent sn longname’ where longname is the name or identifier of
the agent, and ‘sn’ is a short name for use within the protocol specification. Whedreas
the longname can contain spaces, the short name (sn) may not contain spaces. Each
agent is defined on a new line.
Messages between agents are then specified using the syntax ‘message fromagent
toagent messagename’, with one message per line. The ‘fromagent’ and ‘toagent’ are
the agents’ short names.
Alternatives, loops and other deviations from a simple sequence are depicted in
AUML2 using nested boxes. The syntax for defining a box is
box tag
<box contents>
end tag
where ‘tag’ is the box tag (e.g. option, loop, alternative, break). The intended
interpretation of the different box tags is described in AUML papers (e.g. Huget, M.P. and Odell, J. (2004). Representing agent interaction protocols with agent UML). In
Proceedings of the Fifth International Workshop on Agent Oriented Software
Engineering (AOSE), or see www.auml.org) and in appendix C of the book
“Developing Intelligent Agents: A Practical Guide”.
Boxes can contain multiple regions, which are separated by a heavy dashed line,
indicated with the ‘next’ command.
A small example is shown below:
start P1
agent A Agent1
agent B Agent2
message A B message1
box alt
message B A message 2
next
message B A message 3
end alt
finish
Figure 42. A simple message exchange protocol
Once a protocol has been specified the links between agents and protocols in the
System Overview diagram will be made automatically based on information in the
protocol specification.
The System Overview Diagram needs to be arranged in order to be easy to
understand. In some cases it makes sense to place identical icons on top of each other
to give greater readability. All percepts and actions must be linked to some Agent.
4.2.1 Data Coupling Diagram
The roles that were formed in the last step of the previous phase are linked to data that
has been identified as necessary for performing that role. This information can be
viewed graphically in the data coupling diagram.
Effective use of this diagram really requires the ability to explore multiple options in
parallel. This is not yet supported. It could be simulated by having multiple copies of
the Project, each working with different choices in the data coupling diagram. Details
regarding use of Data Coupling diagrams are covered in the book "Developing
Intelligent Agent Systems: A Practical Guide".
In the data-coupling diagram you can see all roles and data types in the system. In this
diagram you can add new roles and data types to the system, and can add and remove
links. Links represent reading and writing of data, by a role..
You cannot remove roles or data types from this diagram since all roles and data types
in the system should be shown in this diagram. If you wish to remove a role or data
type from the diagram you will have to delete it from the system.
You can also rearrange the icons for the roles and the data types in the diagram
according to an algorithm in the system. This can help you getting a better view of the
diagram.
The data coupling diagram of the electronic book store is as shown in figure 43
Figure 43. Data coupling diagram
The data coupling diagram contains the following entities in the toolbar:
1. Role
2. Data
3. Edge
Use the rearrange icon
to arrange the entities in the diagram as a grid.
4.2.2 Agent-Role Grouping Diagram
In this diagram we group the roles into agent types. Decisions regarding how to group
depend on role similarity, as well as analysis of data usage.. For details on things to
consider when grouping roles into agents see "Developing Intelligent Agent Systems:
A Practical Guide". The agent-role coupling diagram shows the group of roles that
come under an agent. The agents are connected to their roles using edges. The agent
role coupling diagram of the electronic bookstore is as shown in figure 44. An agent
role coupling diagram contains the following entities in the toolbar:
1. Agent
2. Role
3. Edge
Figure 44. Agent role grouping diagram
4.2.3 Agent Acquaintance Diagram
In the agent acquaintance diagram you can see all agents within the system and which
agents interact. This diagram is only for presentation, which means that you cannot
add or remove agents or edges between agents; you can only rearrange the icons in
the diagram.
Effective use of this diagram really requires the ability to explore multiple options in
parallel. This is not yet supported. It could be simulated by having multiple copies of
the Project, each working with different choices. Details regarding use of Agent
Acquaintance diagrams are covered in the book "Developing Intelligent Agent
Systems: A Practical Guide".
The agent acquaintance diagram of the electronic bookstore is shown in figure 45. An
agent acquaintance diagram contains only one type of entity; an agent.
Figure 45. Agent acquaintance diagram
4.2.4 System Overview Diagram
In the system overview diagram you can see all agents in the system, along with their
interface and interactions. Entities can be added or removed from the diagram. Edges
can be created or deleted.
This diagram is the central diagram of the entire system design. It can be developed
directly, or it can inherit the agents from the Agent-Role Coupling diagram. Percepts
and actions are inherited from the System Specification phase if they have been
specified there. Alternatively they can be specified directly within the System
Overview. Protocols cannot be linked to agents directly within the diagram. The links
are inferred from the specification of the protocols.
The reason for that is that edges are dependant on the messages in the protocol. All
edges to and from a protocol in the system overview diagram are created based on the
specifications of message sending within the protocol. If you specify a message from
agent A to agent B in a protocol, the edges between the protocol and the agents will
automatically be created in the diagram.
The system overview diagram of the electronic bookstore is as shown in figure 46. A
system overview diagram contains the following types of entities in the toolbar:
1. Agent
2. Action
3. Data
4. Message
5. Percept
6. Protocol
7. Edge
Figure 46. System overview diagram
4.3 Detailed Design
Detailed Design is done at the level of individual agents. An initial Agent Overview
Diagram is generated for each agent type specified in the System Overview Diagram
of the Architectural Design. All messages, percepts and actions linked to an agent will
appear in the Agent Overview Diagram. The inherited interface entities are light
shaded. The Agent Overview Diagram needs to be populated with either capabilities,
or plans, providing an overview of how the agent will achieve its goals. Often the
roles of the agent, from System Specification can be used to suggest an initial set of
capabilities. The Agent Overview Diagram also needs to show the messages required
between capabilities (and plans if they are present) in order to realise the required
behaviour.
Each capability specified will generate a capability overview diagram, which then
must be populated with sub-capabilities or plans, and the messages between them.
Data should be shown in both Agent and Capability Overview Diagrams, at the level
that it is needed.
Descriptors should be filled in for all entities, especially plans and messages.
Descriptors are in the bottom pane of PDT and are accessed by clicking on the entity
in either a diagram, or in the entity list.
4.3.1 Agent Overview Diagram
The agent overview diagram shows the internals of an agent. There is one agent
overview diagram for every agent in the system.
In the detailed design, much finer details of the system are established. The messages
used to communicate between the agents are decided upon. If the roles within an
agent grow very large, they are grouped into capabilities. As in the system overview
diagram entities can be inserted or removed and edges can be created or deleted.
This diagram allows you to specify the internals of the agent, in terms of capabilities,
plans, and messages between them. Data internal to the agent can also be specified. If
percepts and actions are added here, they are propagated into the System Overview
Diagram, and into the Analysis Overview Diagram. No automatic links are placed in
the Agent Analysis Overview. These links should be added manually. Plans with
more than one incoming percept/message should specify in the descriptor which is the
trigger.
The agent over view diagram of stock manager agent in the electronic bookstore is as
shown in figure 48. The stock managing capability which belongs to the agent can be
viewed by clicking on the capability in the diagram list that appears after expanding
the agent as shown in figure 47.
Figure 47. Expanded Stock Manager
Agent overview diagram contain the following types of entities:
1. Action
2. Capability
3. Data
4. Message
5. Plan
6. Percept
7. Edge
Figure 48. Agent overview diagram
4.3.2 Capability Overview Diagram
In the capability overview diagram you can see the direct internal of a capability.
There is one capability overview diagram for every capability in the system, but you
can only view the once that are reachable from an agent.
As in the system overview diagram and agent overview diagrams entities can be
inserted or removed and edges can be created or deleted.
This diagram allows you to specify the internals of a capability in terms of plans, or
sub-capabilities and messages between them. Data internal to the capability can also
be specified. If percepts and actions are added here, they are propagated into the
Agent Overview, System Overview and Analysis Overview Diagrams. No automatic
links are placed in the Agent Analysis Overview. These links should be added
manually. Plans with more than one incoming percept/message should specify in the
descriptor which is the trigger.
The stock managing capability of the stock manager agent in the electronic bookstore
is as shown in figure 49.
Figure 49. Capability overview diagram
5 Entities
5.1 Action
An action is what the agent does that effects the environment. It is denoted by a shape
as shown below.
5.2 Agent
An agent is denoted by a shape as shown below.
5.3 Capability
A capability is different roles of an agent grouped. It can be considered as a part of an
agent. It is denoted by a shape as shown below.
5.4 Message
A message which goes from one agent to another is denoted by a shape as shown
below.
Messages are usually added in a top down order. For example, if you create a message
in an agent overview diagram you cannot use this particular message in the system
overview diagram. You can create a new message of the same type in the system
overview diagram and if you create an edge between the agent and the message a new
message (related to the one in the system overview diagram) will automatically be
created in the agent.
A particular message can be seen as a chain of messages going from the lowest level,
up to the highest level and then down again. For example a message can go from Plan
A in Capability A in Agent A to Plan B in Capability B in Agent B. If you break the
chain by removing an edge (to or from an agent/capability) or removing the message
icon in a diagram you will not be able to mend it. You will have to reconstruct the
message chain from that point and downwards.
So when working with messages you should create the message on the highest level
and then create the edges you would like to and from this message. When you create
edges between an agent/capability and a message, a new message (linked to the
former one) will be created in the agent/capability.
5.5 Data
A data store is used to store beliefs of an agent. It is denoted by a shape as shown
below. (If data is added within an agent, and then later a decision is made to include it
as shared data, shown within the System Overview, then the copy within the agent
will need to be manually removed to avoid having 2 copies on the diagram, of the
same underlying object).
5.6 Role
A role is denoted by a shape as shown below.
5.7 Goal
A goal is denoted by a shape as shown below.
5.8 Percept
A percept is the input coming from the environment to the agent. It is denoted by a
shape as shown below.
5.9 Plan
A plan is denoted by a shape as shown below.
5.10 Protocol
A protocol which is a specification of allowable agent interaction sequences, within a
given conversation, is shown as below.
5.11 Scenario
A scenario, which is an abstract description of a particular sequence of steps within
the system, is denoted by a shape as shown below.
5.12 Actor
An actor which is an entity (human or software/hardware) external to the system
being designed is denoted by a shape as shown below.
5.13 Edge
An edge which is used to connect entities is denoted by an arrow as shown below.
6 How To3
6.1 Do file manipulations
6.1.1 Start working on a new file
To create a new ‘.pd’ file, Select New from File menu. The tool will ask whether you
want to save the current project or not.
6.1.2 Open an existing file
To open an existing ‘.pd’ file, Select Open from File menu. The tool will ask whether
you want to save the current project or not. Then browse to the file you want to open
and Click
to open the file.
6.1.3 Save the current file
To save the current project as a ‘.pd’ file, Select Save from File menu. The tool will
ask for a location if the file is not already saved. If its already saved, it will just
overwrite the existing copy.
6.1.4 Save a copy of the current file
To save a copy of the current project as a ‘.pd’ file, Select ‘Save As’ from File menu.
The tool will ask for a location where the copy has to be saved.
6.1.5 Close the current file
To close the currently opened project, select ‘Close’ from ‘File’ menu.
6.1.6 Quit the Prometheus Design Tool
Select Exit from File menu to close the Prometheus Design Tool Interface.
6.2 Performing Crosscheck functionality
Refer to section 3.2.2.1 Crosscheck
6.3 Save diagrams in PNG format
Refer to section 3.2.2.2 Save Diagram as PNG
6.4 Generate HTML reports
Refer to section 3.2.2.3 Generate Report submenu
6.5 Change the frequency of Auto Save
Refer to section 3.2.2.4 Auto Save submenu
3
Where things are described elsewhere, references are included for more details
6.6 Create a backup file
Refer to section 3.2.2.5 Creating Backup
6.7 Apply scoping procedure
Refer to section 3.2.3.1 Apply scoping Procedure
6.8 Change the partitions size used for scoping
Refer to section 3.2.3.2 Change Partitions Size
6.9 Add an entity
There are 2 ways of adding an entity into the project.
a) One way is to use the Create Entity Menu. You can see list of all the Entities
in the submenu. Select an entity to add it to the project.
b) The second option is to use the entity toolbar present at the left hand side of
each diagram. Click on the preferred entity and then click on the location on
the diagram where you want to place the entity.
A dialog box will appear asking for the name of the entity. Put the name and click
‘Ok’ to add the entity on to the project. If you look through the diagrams, you will see
the entity is appears as a light shade in all the applicable diagrams. Please refer to
Section 4 get the list of applicable entities for each diagram. Once an entity is used in
the diagram to link to some other entities, its colour changes to a solid shade. All
names are unique in the system, which means that you cannot give two different
entities the same name.
6.10 Edit the description of an entity
Select the entity from the diagram view or the entities list. The description of the
entity will be displayed in the descriptor view. Type in to change the fields. To
button. An edit list dialog as shown in figure 50
change the list, click on the
will be displayed.
Figure 50. Edit list dialog
Use the
,
,
and
buttons to edit the list.
Upon completion of making the changes, click
button located at the lower
right hand corner of the descriptor view to commit the changes.
6.11 Remove an entity
To remove an entity from the diagram, click on the
button and then click on the
entity you wish to remove from the diagram. Dialog boxes will be shown asked the
user whether to remove the entity from the other diagrams.
To remove an entity from the project, click on the
lower right hand corner of the descriptor view. Click on
shown to delete the entity from the project or
button located at the
in the dialog box
to keep it.
6.12 Edit the steps in a scenario
There are 2 ways to edit the steps in a scenario:
a) One way is to use the Edit Scenario submenu from the Entities menu.
b) The second method is to double click on the scenario in the diagram.
A list of all the scenarios in the project gets displayed as shown in figure 51. There is
option to insert, reorder and remove steps within a scenario.
Figure 51. Edit scenario dialog
6.13 Edit a protocol
There are 2 ways to edit a protocol:
a) One way is to use the Edit Protocol submenu from the Entities menu. This will
show a list of all the protocols in the project, as shown in figure 52.
b) The second method is to double click on the protocol in the diagram.
See section 4.2 for details on how to edit a protocol's textual representation.
Figure 52. Edit protocol submenu