1
IBM SPSS Modeler Text Analytics 16
User's Guide
Note
Before using this information and the product it supports, read the information in “Notices” on page 225.
Product Information
This edition applies to version 16, release 0, modification 0 of IBM SPSS Modeler Text Analytics and to all
subsequent releases and modifications until otherwise indicated in new editions.
Contents
Preface . . . . . . . . . . . . . . vii
About IBM Business Analytics .
Technical support . . . . .
.
.
.
.
.
.
.
.
.
.
.
.
. vii
. vii
Chapter 1. About IBM SPSS Modeler
Text Analytics . . . . . . . . . . . . 1
Upgrading to IBM SPSS Modeler Text Analytics
Version 16 . . . . . . . . . . . . .
About Text Mining . . . . . . . . . .
How Extraction Works . . . . . . . .
How Categorization Works . . . . . .
IBM SPSS Modeler Text Analytics Nodes . . .
Applications . . . . . . . . . . . .
.
.
.
.
.
.
.
.
.
.
.
.
1
2
5
7
8
8
Chapter 2. Reading in Source Text . . . 11
File List Node . . . . . . . . . .
File List Node: Settings Tab . . . . .
File List Node: Other Tabs . . . . .
Using the File List Node in Text Mining .
Web Feed Node . . . . . . . . . .
Web Feed Node: Input Tab . . . . .
Web Feed Node: Records Tab . . . .
Web Feed Node: Content Filter Tab . .
Using the Web Feed Node in Text Mining
.
.
.
.
.
.
.
.
.
.
.
.
.
.
.
.
.
.
.
.
.
.
.
.
.
.
.
11
12
13
13
13
14
15
16
17
Chapter 3. Mining for Concepts and
Categories . . . . . . . . . . . . . 19
Text Mining Modeling Node. . . . . . .
Text Mining Node: Fields Tab . . . . .
Text Mining Node: Model Tab . . . . .
Text Mining Node: Expert Tab . . . . .
Sampling Upstream to Save Time . . . .
Using the Text Mining Node in a Stream .
Text Mining Nugget: Concept Model . . . .
Concept Model: Model Tab . . . . . .
Concept Model: Settings Tab. . . . . .
Concept Model: Fields Tab . . . . . .
Concept Model: Summary Tab . . . . .
Using Concept Model Nuggets in a Stream .
Text Mining Nugget: Category Model . . .
Category Model Nugget: Model Tab . . .
Category Model Nugget: Settings Tab . .
Category Model Nugget: Other Tabs . . .
Using Category Model Nuggets in a Stream
.
.
.
.
.
.
.
.
.
.
.
.
.
.
.
.
.
.
.
.
.
.
.
.
.
.
.
.
.
.
.
.
.
.
20
21
23
27
29
30
30
31
33
34
35
35
39
40
41
42
42
Chapter 4. Mining for Text Links . . . . 47
Text Link Analysis Node . . . . . .
Text Link Analysis Node: Fields Tab .
Text Link Analysis Node: Model Tab .
Text Link Analysis Node: Expert Tab .
TLA Node Output . . . . . . .
Caching TLA Results . . . . . .
Using the Text Link Analysis Node in a
. . .
. . .
. . .
. . .
. . .
. . .
Stream
.
.
.
.
.
.
47
47
49
49
51
51
51
Chapter 5. Translating Text for
Extraction . . . . . . . . . . . . . 55
Translate Node . . . . .
Translate Node: Translation
Translation Settings . . .
Using the Translate Node.
. .
Tab
. .
. .
.
.
.
.
.
.
.
.
.
.
.
.
.
.
.
.
.
.
.
.
.
.
.
.
55
56
56
57
Chapter 6. Browsing External Source
Text . . . . . . . . . . . . . . . . 59
File Viewer Node . . . . .
File Viewer Node Settings .
Using the File Viewer Node .
.
.
.
.
.
.
.
.
.
.
.
.
.
.
.
.
.
.
. 59
. 59
. 59
Chapter 7. Node Properties for
Scripting . . . . . . . . . . . . . . 63
File List Node: filelistnode . . . . . . . .
Web Feed Node: webfeednode . . . . . . .
Text Mining Node: TextMiningWorkbench . . .
Text Mining Model Nugget: TMWBModelApplier
Text Link Analysis Node: textlinkanalysis . . .
Translate Node: translatenode . . . . . . .
. 63
. 63
. 64
66
. 67
. 69
Chapter 8. Interactive Workbench Mode 71
The Categories and Concepts View . . . . .
The Clusters View . . . . . . . . . . .
The Text Link Analysis View . . . . . . .
The Resource Editor View . . . . . . . .
Setting Options . . . . . . . . . . . .
Options: Session Tab . . . . . . . . .
Options: Display Tab . . . . . . . . .
Options: Sounds Tab . . . . . . . . .
Microsoft Internet Explorer Settings for Help . .
Generating Model Nuggets and Modeling Nodes .
Updating Modeling Nodes and Saving . . . .
Closing and Ending Sessions . . . . . . .
Keyboard Accessibility. . . . . . . . . .
Shortcuts for Dialog Boxes . . . . . . .
.
.
.
.
.
.
.
.
.
.
.
.
.
.
71
74
76
78
79
80
80
81
81
81
82
82
82
83
Chapter 9. Extracting Concepts and
Types . . . . . . . . . . . . . . . 85
Extraction Results: Concepts and Types
Extracting Data . . . . . . . .
Filtering Extraction Results . . . .
Exploring Concept Maps . . . . .
Building Concept Map Indexes . .
Refining Extraction Results . . . .
Adding Synonyms . . . . . .
Adding Concepts to Types . . .
Excluding Concepts from Extraction
Forcing Words into Extraction . .
.
.
.
.
.
.
.
.
.
.
.
.
.
.
.
.
.
.
.
.
.
.
.
.
.
.
.
.
.
.
Chapter 10. Categorizing Text Data
The Categories Pane .
.
.
.
.
.
.
.
.
.
.
.
.
.
.
.
.
.
.
.
.
.
.
.
.
.
.
.
85
86
89
90
92
93
94
95
96
97
. . 99
.
.
. 100
iii
Methods and Strategies for Creating Categories
Methods for Creating Categories . . . . .
Strategies for Creating Categories . . . .
Tips for Creating Categories . . . . . .
Choosing the Best Descriptors . . . . . .
About Categories . . . . . . . . . . .
Category Properties . . . . . . . . .
The Data Pane . . . . . . . . . . . .
Category Relevance . . . . . . . . .
Building Categories . . . . . . . . . .
Advanced Linguistic Settings . . . . . .
About Linguistic Techniques . . . . . .
Advanced Frequency Settings . . . . . .
Extending Categories . . . . . . . . . .
Creating Categories Manually . . . . . . .
Creating New or Renaming Categories . . .
Creating Categories by Drag-and-Drop . . .
Using Category Rules . . . . . . . . .
Category Rule Syntax . . . . . . . .
Using TLA Patterns in Category Rules . . .
Using Wildcards in Category Rules . . . .
Category Rule Examples. . . . . . . .
Creating Category Rules. . . . . . . .
Editing and Deleting Rules . . . . . . .
Importing and Exporting Predefined Categories
Importing Predefined Categories . . . . .
Exporting Categories . . . . . . . . .
Using Text Analysis Packages . . . . . . .
Making Text Analysis Packages . . . . .
Loading Text Analysis Packages . . . . .
Updating Text Analysis Packages . . . . .
Editing and Refining Categories . . . . . .
Adding Descriptors to Categories . . . .
Editing Category Descriptors . . . . . .
Moving Categories . . . . . . . . .
Flattening Categories . . . . . . . . .
Merging or Combining Categories . . . .
Deleting Categories . . . . . . . . .
.
.
.
.
.
.
.
.
.
.
.
.
.
.
.
.
.
.
.
.
.
.
.
.
.
.
.
.
.
.
.
.
.
.
.
.
102
102
102
103
104
106
107
107
108
109
111
113
118
119
121
121
122
123
123
125
127
128
130
131
131
132
135
136
136
137
137
138
139
139
139
140
140
140
Text Link Analysis Graphs
Concept Web Graph .
Type Web Graph . .
Using Graph Toolbars and
. . .
. . .
. . .
Palettes
.
.
.
.
.
.
.
.
.
.
.
.
.
.
.
.
.
.
.
.
.
.
.
.
.
.
.
. 159
. 161
. 162
Chapter 14. Session Resource Editor
Editing Resources in the Resource Editor .
Making and Updating Templates . . . .
Switching Resource Templates . . . . .
.
.
.
156
156
156
156
159
Chapter 15. Templates and Resources 163
Template Editor vs. Resource Editor . .
The Editor Interface . . . . . . .
Opening Templates . . . . . . .
Saving Templates . . . . . . . .
Updating Node Resources After Loading
Managing Templates . . . . . . .
Importing and Exporting Templates . .
Exiting the Template Editor. . . . .
Backing Up Resources . . . . . .
Importing Resource Files . . . . .
.
.
.
.
.
.
.
.
.
.
.
.
.
.
.
.
.
.
.
.
.
.
.
.
.
.
.
.
.
.
.
.
.
.
.
.
.
.
.
.
.
.
.
.
.
.
.
.
.
.
.
.
.
.
.
.
.
.
.
.
.
.
.
.
.
.
.
.
.
.
.
.
.
.
.
.
.
.
.
.
.
.
Chapter 16. Working with Libraries
Shipped Libraries . . . .
Creating Libraries . . . .
Adding Public Libraries . .
Finding Terms and Types .
Viewing Libraries . . . .
Managing Local Libraries .
Renaming Local Libraries
Disabling Local Libraries
Deleting Local Libraries .
Managing Public Libraries .
Sharing Libraries . . . .
Publishing Libraries . .
Updating Libraries . .
Resolving Conflicts . . .
.
.
.
.
.
.
.
.
.
.
.
.
.
.
.
.
.
.
.
.
.
.
.
.
.
.
.
.
.
.
.
.
.
.
.
.
.
.
.
.
.
.
.
.
.
.
.
.
.
.
.
.
.
.
.
.
.
.
.
.
.
.
.
.
.
.
.
.
.
.
164
164
168
169
169
170
170
171
171
172
173
173
174
174
175
175
176
176
176
176
177
177
178
179
179
Chapter 11. Analyzing Clusters . . . . 141
Chapter 17. About Library Dictionaries 181
Building Clusters . . . . . . .
Calculating Similarity Link Values
Exploring Clusters. . . . . . .
Cluster Definitions . . . . .
Type Dictionaries . . . . . . . .
Built-in Types . . . . . . . .
Creating Types . . . . . . . .
Adding Terms . . . . . . . .
Forcing Terms . . . . . . . .
Renaming Types . . . . . . .
Moving Types . . . . . . . .
Disabling and Deleting Types . . .
Substitution/Synonym Dictionaries . .
Defining Synonyms . . . . . .
Defining Optional Elements . . .
Disabling and Deleting Substitutions
Exclude Dictionaries . . . . . . .
.
.
.
.
.
.
.
.
.
.
.
.
.
.
.
.
.
.
.
.
142
144
144
145
Chapter 12. Exploring Text Link
Analysis . . . . . . . . . . . . . 147
Extracting TLA Pattern Results
Type and Concept Patterns . .
Filtering TLA Results . . . .
Data Pane . . . . . . .
.
.
.
.
.
.
.
.
.
.
.
.
.
.
.
.
.
.
.
.
.
.
.
.
.
.
.
.
148
149
149
151
Chapter 13. Visualizing Graphs . . . . 153
Category Graphs and Charts
Category Bar Chart . .
Category Web Graph . .
Category Web Table . .
Cluster Graphs . . . . .
Concept Web Graph . .
Cluster Web Graph . .
iv
.
.
.
.
.
.
.
.
.
.
.
.
.
.
.
.
.
.
.
.
.
.
.
.
.
.
.
.
.
.
.
.
.
.
.
.
.
.
.
.
.
.
.
.
.
.
.
.
.
IBM SPSS Modeler Text Analytics 16 User's Guide
.
.
.
.
.
.
.
153
154
154
154
154
155
155
.
.
.
.
.
.
.
.
.
.
.
.
.
.
.
.
.
.
.
.
.
.
.
.
.
.
.
.
.
.
.
.
.
.
.
.
.
.
.
.
.
.
.
.
.
.
.
.
.
.
.
.
181
182
183
184
186
186
187
187
187
188
190
190
191
Chapter 18. About Advanced
Resources. . . . . . . . . . . . . 193
Finding . . .
Replacing. . .
Target Language
Fuzzy Grouping
.
.
for
.
. . . .
. . . .
Resources
. . . .
.
.
.
.
.
.
.
.
.
.
.
.
.
.
.
.
.
.
.
.
.
.
.
.
.
.
.
.
194
195
195
196
Nonlinguistic Entities. . . . .
Regular Expression Definitions
Normalization . . . . . .
Configuration . . . . . .
Language Handling . . . . .
Extraction Patterns . . . .
Forced Definitions . . . . .
Abbreviations . . . . . .
Language Identifier . . . . .
Properties . . . . . . .
Languages . . . . . . .
.
.
.
.
.
.
.
.
.
.
.
.
.
.
.
.
.
.
.
.
.
.
.
.
.
.
.
.
.
.
.
.
.
.
.
.
.
.
.
.
.
.
.
.
.
.
.
.
.
.
.
.
.
.
.
.
.
.
.
.
.
.
.
.
.
.
.
.
.
.
.
.
.
.
.
.
.
.
.
.
.
.
.
.
.
.
.
Chapter 19. About Text Link Rules
Where to Work on Text Link Rules . .
Where to Begin . . . . . . . . .
When to Edit or Create Rules . . . .
Simulating Text Link Analysis Results .
Defining Data for Simulation . . .
Understanding Simulation Results .
Navigating Rules and Macros in the Tree
.
.
.
.
.
.
.
196
197
199
200
201
201
201
202
202
202
203
205
205
206
206
207
207
208
209
Working with Macros . . . . . . . . . .
Creating and Editing Macros . . . . . . .
Disabling and Deleting Macros . . . . . .
Checking for Errors, Saving, and Cancelling . .
Special Macros: mTopic, mNonLingEntities, SEP
Working with Text Link Rules . . . . . . . .
Creating and Editing Rules . . . . . . . .
Disabling and Deleting Rules . . . . . . .
Checking for Errors, Saving, and Cancelling . .
Processing Order for Rules . . . . . . . . .
Working with Rule Sets (Multiple Pass) . . . .
Supported Elements for Rules and Macros . . .
Viewing and Working in Source Mode . . . . .
210
211
211
211
212
213
215
216
216
217
218
219
221
Notices . . . . . . . . . . . . . . 225
Trademarks .
.
.
.
.
.
.
.
.
.
.
.
.
. 226
Index . . . . . . . . . . . . . . . 229
Contents
v
vi
IBM SPSS Modeler Text Analytics 16 User's Guide
Preface
IBM® SPSS® Modeler Text Analytics offers powerful text analytic capabilities, which use advanced
linguistic technologies and Natural Language Processing (NLP) to rapidly process a large variety of
unstructured text data and, from this text, extract and organize the key concepts. Furthermore, IBM SPSS
Modeler Text Analytics can group these concepts into categories.
Around 80% of data held within an organization is in the form of text documents—for example, reports,
Web pages, e-mails, and call center notes. Text is a key factor in enabling an organization to gain a better
understanding of their customers’ behavior. A system that incorporates NLP can intelligently extract
concepts, including compound phrases. Moreover, knowledge of the underlying language allows
classification of terms into related groups, such as products, organizations, or people, using meaning and
context. As a result, you can quickly determine the relevance of the information to your needs. These
extracted concepts and categories can be combined with existing structured data, such as demographics,
and applied to modeling in IBM SPSS Modeler's full suite of data mining tools to yield better and
more-focused decisions.
Linguistic systems are knowledge sensitive—the more information contained in their dictionaries, the
higher the quality of the results. IBM SPSS Modeler Text Analytics is delivered with a set of linguistic
resources, such as dictionaries for terms and synonyms, libraries, and templates. This product further
allows you to develop and refine these linguistic resources to your context. Fine-tuning of the linguistic
resources is often an iterative process and is necessary for accurate concept retrieval and categorization.
Custom templates, libraries, and dictionaries for specific domains, such as CRM and genomics, are also
included.
About IBM Business Analytics
IBM Business Analytics software delivers complete, consistent and accurate information that
decision-makers trust to improve business performance. A comprehensive portfolio of business
intelligence, predictive analytics, financial performance and strategy management, and analytic
applications provides clear, immediate and actionable insights into current performance and the ability to
predict future outcomes. Combined with rich industry solutions, proven practices and professional
services, organizations of every size can drive the highest productivity, confidently automate decisions
and deliver better results.
As part of this portfolio, IBM SPSS Predictive Analytics software helps organizations predict future events
and proactively act upon that insight to drive better business outcomes. Commercial, government and
academic customers worldwide rely on IBM SPSS technology as a competitive advantage in attracting,
retaining and growing customers, while reducing fraud and mitigating risk. By incorporating IBM SPSS
software into their daily operations, organizations become predictive enterprises – able to direct and
automate decisions to meet business goals and achieve measurable competitive advantage. For further
information or to reach a representative visit http://www.ibm.com/spss.
Technical support
Technical support is available to maintenance customers. Customers may contact Technical Support for
assistance in using IBM Corp. products or for installation help for one of the supported hardware
environments. To reach Technical Support, see the IBM Corp. web site at http://www.ibm.com/support.
Be prepared to identify yourself, your organization, and your support agreement when requesting
assistance.
vii
viii
IBM SPSS Modeler Text Analytics 16 User's Guide
Chapter 1. About IBM SPSS Modeler Text Analytics
IBM SPSS Modeler Text Analytics offers powerful text analytic capabilities, which use advanced linguistic
technologies and Natural Language Processing (NLP) to rapidly process a large variety of unstructured
text data and, from this text, extract and organize the key concepts. Furthermore, IBM SPSS Modeler Text
Analytics can group these concepts into categories.
Around 80% of data held within an organization is in the form of text documents—for example, reports,
Web pages, e-mails, and call center notes. Text is a key factor in enabling an organization to gain a better
understanding of their customers’ behavior. A system that incorporates NLP can intelligently extract
concepts, including compound phrases. Moreover, knowledge of the underlying language allows
classification of terms into related groups, such as products, organizations, or people, using meaning and
context. As a result, you can quickly determine the relevance of the information to your needs. These
extracted concepts and categories can be combined with existing structured data, such as demographics,
and applied to modeling in IBM SPSS Modeler's full suite of data mining tools to yield better and
more-focused decisions.
Linguistic systems are knowledge sensitive—the more information contained in their dictionaries, the
higher the quality of the results. IBM SPSS Modeler Text Analytics is delivered with a set of linguistic
resources, such as dictionaries for terms and synonyms, libraries, and templates. This product further
allows you to develop and refine these linguistic resources to your context. Fine-tuning of the linguistic
resources is often an iterative process and is necessary for accurate concept retrieval and categorization.
Custom templates, libraries, and dictionaries for specific domains, such as CRM and genomics, are also
included.
Deployment. You can deploy text mining streams using the IBM SPSS Modeler Solution Publisher for
real-time scoring of unstructured data. The ability to deploy these streams ensures successful, closed-loop
text mining implementations. For example, your organization can now analyze scratch-pad notes from
inbound or outbound callers by applying your predictive models to increase the accuracy of your
marketing message in real time.
Note: To run IBM SPSS Modeler Text Analytics with IBM SPSS Modeler Solution Publisher, add the
directory <install_directory>/ext/bin/spss.TMWBServer to the $LD_LIBRARY_PATH environment variable.
Automated translation of supported languages. IBM SPSS Modeler Text Analytics, in conjunction with
SDL's Software as a Service (SaaS), enables you to translate text from a list of supported languages,
including Arabic, Chinese, and Persian, into English. You can then perform your text analysis on
translated text and deploy these results to people who could not have understood the contents of the
source languages. Since the text mining results are automatically linked back to the corresponding
foreign-language text, your organization can then focus the much-needed native speaker resources on
only the most significant results of the analysis. SDL offers automatic language translation using
statistical translation algorithms that resulted from 20 person-years of advanced translation research.
Upgrading to IBM SPSS Modeler Text Analytics Version 16
Upgrading from previous versions of PASW Text Analytics or Text Mining for Clementine
Before installing IBM SPSS Modeler Text Analytics version 16 you should save and export any TAPs,
templates, and libraries from your current version that you want to use in the new version. We
recommend that you save these files to a directory that will not get deleted or overwritten when you
install the latest version.
© Copyright IBM Corporation 2003, 2013
1
After you install the latest version of IBM SPSS Modeler Text Analytics you can load the saved TAP file,
add any saved libraries, or import and load any saved templates to use them in the latest version.
Important! If you uninstall your current version without saving and exporting the files you require first,
any TAP, template, and public library work performed in the previous version will be lost and unable to
be used in IBM SPSS Modeler Text Analytics version 16.
About Text Mining
Today an increasing amount of information is being held in unstructured and semistructured formats,
such as customer e-mails, call center notes, open-ended survey responses, news feeds, Web forms, etc.
This abundance of information poses a problem to many organizations that ask themselves, "How can we
collect, explore, and leverage this information?"
Text mining is the process of analyzing collections of textual materials in order to capture key concepts
and themes and uncover hidden relationships and trends without requiring that you know the precise
words or terms that authors have used to express those concepts. Although they are quite different, text
mining is sometimes confused with information retrieval. While the accurate retrieval and storage of
information is an enormous challenge, the extraction and management of quality content, terminology,
and relationships contained within the information are crucial and critical processes.
Text Mining and Data Mining
For each article of text, linguistic-based text mining returns an index of concepts, as well as information
about those concepts. This distilled, structured information can be combined with other data sources to
address questions such as:
v Which concepts occur together?
v What else are they linked to?
v What higher level categories can be made from extracted information?
v What do the concepts or categories predict?
v How do the concepts or categories predict behavior?
Combining text mining with data mining offers greater insight than is available from either structured or
unstructured data alone. This process typically includes the following steps:
Identify the text to be mined. Prepare the text for mining. If the text exists in multiple files, save the
files to a single location. For databases, determine the field containing the text.
2. Mine the text and extract structured data. Apply the text mining algorithms to the source text.
1.
Build concept and category models. Identify the key concepts and/or create categories. The number
of concepts returned from the unstructured data is typically very large. Identify the best concepts and
categories for scoring.
4. Analyze the structured data. Employ traditional data mining techniques, such as clustering,
classification, and predictive modeling, to discover relationships between the concepts. Merge the
extracted concepts with other structured data to predict future behavior based on the concepts.
3.
Text Analysis and Categorization
Text analysis, a form of qualitative analysis, is the extraction of useful information from text so that the
key ideas or concepts contained within this text can be grouped into an appropriate number of categories.
Text analysis can be performed on all types and lengths of text, although the approach to the analysis
will vary somewhat.
Shorter records or documents are most easily categorized, since they are not as complex and usually
contain fewer ambiguous words and responses. For example, with short, open-ended survey questions, if
we ask people to name their three favorite vacation activities, we might expect to see many short
2
IBM SPSS Modeler Text Analytics 16 User's Guide
answers, such as going to the beach, visiting national parks, or doing nothing. Longer, open-ended responses,
on the other hand, can be quite complex and very lengthy, especially if respondents are educated,
motivated, and have enough time to complete a questionnaire. If we ask people to tell us about their
political beliefs in a survey or have a blog feed about politics, we might expect some lengthy comments
about all sorts of issues and positions.
The ability to extract key concepts and create insightful categories from these longer text sources in a
very short period of time is a key advantage of using IBM SPSS Modeler Text Analytics. This advantage
is obtained through the combination of automated linguistic and statistical techniques to yield the most
reliable results for each stage of the text analysis process.
Linguistic Processing and NLP
The primary problem with the management of all of this unstructured text data is that there are no
standard rules for writing text so that a computer can understand it. The language, and consequently the
meaning, varies for every document and every piece of text. The only way to accurately retrieve and
organize such unstructured data is to analyze the language and thus uncover its meaning. There are
several different automated approaches to the extraction of concepts from unstructured information.
These approaches can be broken down into two kinds, linguistic and nonlinguistic.
Some organizations have tried to employ automated nonlinguistic solutions based on statistics and neural
networks. Using computer technology, these solutions can scan and categorize key concepts more quickly
than human readers can. Unfortunately, the accuracy of such solutions is fairly low. Most statistics-based
systems simply count the number of times words occur and calculate their statistical proximity to related
concepts. They produce many irrelevant results, or noise, and miss results they should have found,
referred to as silence.
To compensate for their limited accuracy, some solutions incorporate complex nonlinguistic rules that
help to distinguish between relevant and irrelevant results. This is referred to as rule-based text mining.
Linguistics-based text mining, on the other hand, applies the principles of natural language processing
(NLP)—the computer-assisted analysis of human languages—to the analysis of words, phrases, and
syntax, or structure, of text. A system that incorporates NLP can intelligently extract concepts, including
compound phrases. Moreover, knowledge of the underlying language allows classification of concepts
into related groups, such as products, organizations, or people, using meaning and context.
Linguistics-based text mining finds meaning in text much as people do—by recognizing a variety of word
forms as having similar meanings and by analyzing sentence structure to provide a framework for
understanding the text. This approach offers the speed and cost-effectiveness of statistics-based systems,
but it offers a far higher degree of accuracy while requiring far less human intervention.
To illustrate the difference between statistics-based and linguistics-based approaches during the extraction
process with all language texts except Japanese, consider how each would respond to a query about
reproduction of documents. Both statistics-based and linguistics-based solutions would have to expand
the word reproduction to include synonyms, such as copy and duplication. Otherwise, relevant
information will be overlooked. But if a statistics-based solution attempts to do this type of
synonymy—searching for other terms with the same meaning—it is likely to include the term birth as
well, generating a number of irrelevant results. The understanding of language cuts through the
ambiguity of text, making linguistics-based text mining, by definition, the more reliable approach.
Note: Japanese text extraction is available in IBM SPSS Modeler Premium.
The use of linguistic-based techniques through the Sentiment analyzer makes it possible to extract more
meaningful expressions. The analysis and capture of emotions cuts through the ambiguity of text, and
makes linguistics-based text mining, by definition, the more reliable approach.
Chapter 1. About IBM SPSS Modeler Text Analytics
3
Understanding how the extraction process works can help you make key decisions when fine-tuning your
linguistic resources (libraries, types, synonyms, and more). Steps in the extraction process include:
v Converting source data to a standard format
v Identifying candidate terms
v Identifying equivalence classes and integration of synonyms
v Assigning a type
v Indexing and, when requested, pattern matching with a secondary analyzer
Step 1. Converting source data to a standard format
In this first step, the data you import is converted to a uniform format that can be used for further
analysis. This conversion is performed internally and does not change your original data.
Step 2. Identifying candidate terms
It is important to understand the role of linguistic resources in the identification of candidate terms
during linguistic extraction. Linguistic resources are used every time an extraction is run. They exist in
the form of templates, libraries, and compiled resources. Libraries include lists of words, relationships,
and other information used to specify or tune the extraction. The compiled resources cannot be viewed or
edited. However, the remaining resources can be edited in the Template Editor or, if you are in an
interactive workbench session, in the Resource Editor.
Compiled resources are core, internal components of the extraction engine within IBM SPSS Modeler Text
Analytics . These resources include a general dictionary containing a list of base forms with a
part-of-speech code (noun, verb, adjective, and so on).
In addition to those compiled resources, several libraries are delivered with the product and can be used
to complement the types and concept definitions in the compiled resources, as well as to offer synonyms.
These libraries—and any custom ones you create—are made up of several dictionaries. These include
type dictionaries, synonym dictionaries, and exclude dictionaries.
Once the data have been imported and converted, the extraction engine will begin identifying candidate
terms for extraction. Candidate terms are words or groups of words that are used to identify concepts in
the text. During the processing of the text, single words (uniterms) and compound words (multiterms)
are identified using part-of-speech pattern extractors. Then, candidate sentiment keywords are identified
using sentiment text link analysis.
Note: The terms in the aforementioned compiled general dictionary represent a list of all of the words that
are likely to be uninteresting or linguistically ambiguous as uniterms. These words are excluded from
extraction when you are identifying the uniterms. However, they are reevaluated when you are
determining parts of speech or looking at longer candidate compound words (multiterms).
Step 3. Identifying equivalence classes and integration of synonyms
After candidate uniterms and multiterms are identified, the software uses a normalization dictionary to
identify equivalence classes. An equivalence class is a base form of a phrase or a single form of two
variants of the same phrase. To determine which concept to use for the equivalence class the extraction
engine applies the following rules in the order listed:
v The user-specified form in a library.
v The most frequent form, as defined by precompiled resources.
Step 4. Assigning type
4
IBM SPSS Modeler Text Analytics 16 User's Guide
Next, types are assigned to extracted concepts. A type is a semantic grouping of concepts. Both compiled
resources and the libraries are used in this step. Types include such things as higher-level concepts,
positive and negative words, first names, places, organizations, and more. See the topic “Type
Dictionaries” on page 181 for more information.
Note that Japanese language resources have a distinct set of types.
Linguistic systems are knowledge sensitive—the more information contained in their dictionaries, the
higher the quality of the results. Modification of the dictionary content, such as synonym definitions, can
simplify the resulting information. This is often an iterative process and is necessary for accurate concept
retrieval. NLP is a core element of IBM SPSS Modeler Text Analytics.
How Extraction Works
During the extraction of key concepts and ideas from your responses, IBM SPSS Modeler Text Analytics
relies on linguistics-based text analysis. This approach offers the speed and cost effectiveness of
statistics-based systems. But it offers a far higher degree of accuracy, while requiring far less human
intervention. Linguistics-based text analysis is based on the field of study known as natural language
processing, also known as computational linguistics.
Important! For Japanese language text, the extraction process follows a different set of steps. Note:
Japanese text extraction is available in IBM SPSS Modeler Premium.
Understanding how the extraction process works can help you make key decisions when fine-tuning your
linguistic resources (libraries, types, synonyms, and more). Steps in the extraction process include:
v Converting source data to a standard format
v Identifying candidate terms
v Identifying equivalence classes and integration of synonyms
v Assigning a type
v Indexing
v Matching patterns and events extraction
Step 1. Converting source data to a standard format
In this first step, the data you import is converted to a uniform format that can be used for further
analysis. This conversion is performed internally and does not change your original data.
Step 2. Identifying candidate terms
It is important to understand the role of linguistic resources in the identification of candidate terms
during linguistic extraction. Linguistic resources are used every time an extraction is run. They exist in
the form of templates, libraries, and compiled resources. Libraries include lists of words, relationships,
and other information used to specify or tune the extraction. The compiled resources cannot be viewed or
edited. However, the remaining resources (templates) can be edited in the Template Editor or, if you are
in an interactive workbench session, in the Resource Editor.
Compiled resources are core, internal components of the extraction engine within IBM SPSS Modeler Text
Analytics. These resources include a general dictionary containing a list of base forms with a
part-of-speech code (noun, verb, adjective, adverb, participle, coordinator, determiner, or preposition). The
resources also include reserved, built-in types used to assign many extracted terms to the following types,
<Location>, <Organization>, or <Person>. See the topic “Built-in Types” on page 182 for more
information.
In addition to those compiled resources, several libraries are delivered with the product and can be used
to complement the types and concept definitions in the compiled resources, as well as to offer other types
Chapter 1. About IBM SPSS Modeler Text Analytics
5
and synonyms. These libraries—and any custom ones you create—are made up of several dictionaries.
These include type dictionaries, substitution dictionaries (synonyms and optional elements), and exclude
dictionaries. See the topic Chapter 16, “Working with Libraries,” on page 173 for more information.
Once the data have been imported and converted, the extraction engine will begin identifying candidate
terms for extraction. Candidate terms are words or groups of words that are used to identify concepts in
the text. During the processing of the text, single words (uniterms) that are not in the compiled resources
are considered as candidate term extractions. Candidate compound words (multiterms) are identified
using part-of-speech pattern extractors. For example, the multiterm sports car, which follows the
"adjective noun" part-of-speech pattern, has two components. The multiterm fast sports car, which
follows the "adjective adjective noun" part-of-speech pattern, has three components.
Note: The terms in the aforementioned compiled general dictionary represent a list of all of the words that
are likely to be uninteresting or linguistically ambiguous as uniterms. These words are excluded from
extraction when you are identifying the uniterms. However, they are reevaluated when you are
determining parts of speech or looking at longer candidate compound words (multiterms).
Finally, a special algorithm is used to handle uppercase letter strings, such as job titles, so that these
special patterns can be extracted.
Step 3. Identifying equivalence classes and integration of synonyms
After candidate uniterms and multiterms are identified, the software uses a set of algorithms to compare
them and identify equivalence classes. An equivalence class is a base form of a phrase or a single form of
two variants of the same phrase. The purpose of assigning phrases to equivalence classes is to ensure
that, for example, president of the company and company president are not treated as separate concepts.
To determine which concept to use for the equivalence class—that is, whether president of the company
or company president is used as the lead term, the extraction engine applies the following rules in the
order listed:
v The user-specified form in a library.
v The most frequent form in the full body of text.
v The shortest form in the full body of text (which usually corresponds to the base form).
Step 4. Assigning type
Next, types are assigned to extracted concepts. A type is a semantic grouping of concepts. Both compiled
resources and the libraries are used in this step. Types include such things as higher-level concepts,
positive and negative words, first names, places, organizations, and more. Additional types can be
defined by the user. See the topic “Type Dictionaries” on page 181 for more information.
Step 5. Indexing
The entire set of records or documents is indexed by establishing a pointer between a text position and
the representative term for each equivalence class. This assumes that all of the inflected form instances of
a candidate concept are indexed as a candidate base form. The global frequency is calculated for each
base form.
Step 6. Matching patterns and events extraction
IBM SPSS Modeler Text Analytics can discover not only types and concepts but also relationships among
them. Several algorithms and libraries are available with this product and provide the ability to extract
relationship patterns between types and concepts. They are particularly useful when attempting to
discover specific opinions (for example, product reactions) or the relational links between people or
objects (for example, links between political groups or genomes).
6
IBM SPSS Modeler Text Analytics 16 User's Guide
How Categorization Works
When creating category models in IBM SPSS Modeler Text Analytics, there are several different
techniques you can choose to create categories. Because every dataset is unique, the number of techniques
and the order in which you apply them may change. Since your interpretation of the results may be
different from someone else’s, you may need to experiment with the different techniques to see which
one produces the best results for your text data. In IBM SPSS Modeler Text Analytics, you can create
category models in a workbench session in which you can explore and fine-tune your categories further.
In this guide, category building refers to the generation of category definitions and classification through
the use of one or more built-in techniques, and categorization refers to the scoring, or labeling, process
whereby unique identifiers (name/ID/value) are assigned to the category definitions for each record or
document.
During category building, the concepts and types that were extracted are used as the building blocks for
your categories. When you build categories, the records or documents are automatically assigned to
categories if they contain text that matches an element of a category's definition.
IBM SPSS Modeler Text Analytics offers you several automated category building techniques to help you
categorize your documents or records quickly.
Grouping Techniques
Each of the techniques available is well suited to certain types of data and situations, but often it is
helpful to combine techniques in the same analysis to capture the full range of documents or records. You
may see a concept in multiple categories or find redundant categories.
Concept Root Derivation. This technique creates categories by taking a concept and finding other
concepts that are related to it by analyzing whether any of the concept components are morphologically
related, or share roots. This technique is very useful for identifying synonymous compound word
concepts, since the concepts in each category generated are synonyms or closely related in meaning. It
works with data of varying lengths and generates a smaller number of compact categories. For example,
the concept opportunities to advance would be grouped with the concepts opportunity for
advancement and advancement opportunity. See the topic “Concept Root Derivation” on page 114 for
more information. This option is not available for Japanese text.
Semantic Network. This technique begins by identifying the possible senses of each concept from its
extensive index of word relationships and then creates categories by grouping related concepts. This
technique is best when the concepts are known to the semantic network and are not too ambiguous. It is
less helpful when text contains specialized terminology or jargon unknown to the network. In one
example, the concept granny smith apple could be grouped with gala apple and winesap apple since
they are siblings of the granny smith. In another example, the concept animal might be grouped with cat
and kangaroo since they are hyponyms of animal. This technique is available for English text only in this
release. See the topic “Semantic Networks” on page 115 for more information.
Concept Inclusion. This technique builds categories by grouping multiterm concepts (compound words)
based on whether they contain words that are subsets or supersets of a word in the other. For example,
the concept seat would be grouped with safety seat, seat belt, and seat belt buckle. See the topic
“Concept Inclusion” on page 115 for more information.
Co-occurrence. This technique creates categories from co-occurrences found in the text. The idea is that
when concepts or concept patterns are often found together in documents and records, that co-occurrence
reflects an underlying relationship that is probably of value in your category definitions. When words
co-occur significantly, a co-occurrence rule is created and can be used as a category descriptor for a new
subcategory. For example, if many records contain the words price and availability (but few records
contain one without the other), then these concepts could be grouped into a co-occurrence rule, (price &
Chapter 1. About IBM SPSS Modeler Text Analytics
7
available) and assigned to a subcategory of the category price for instance. See the topic
“Co-occurrence Rules” on page 117 for more information.
Minimum number of documents. To help determine how interesting co-occurrences are, define the
minimum number of documents or records that must contain a given co-occurrence for it to be used as a
descriptor in a category.
IBM SPSS Modeler Text Analytics Nodes
Along with the many standard nodes delivered with IBM SPSS Modeler, you can also work with text
mining nodes to incorporate the power of text analysis into your streams. IBM SPSS Modeler Text
Analytics offers you several text mining nodes to do just that. These nodes are stored in the IBM SPSS
Modeler Text Analytics tab of the node palette.
The following nodes are included:
v The File List source node generates a list of document names as input to the text mining process. This
is useful when the text resides in external documents rather than in a database or other structured file.
The node outputs a single field with one record for each document or folder listed, which can be
selected as input in a subsequent Text Mining node. See the topic “File List Node” on page 11 for more
information.
v The Web Feed source node makes it possible to read in text from Web feeds, such as blogs or news
feeds in RSS or HTML formats, and use this data in the text mining process. The node outputs one or
more fields for each record found in the feeds, which can be selected as input in a subsequent Text
Mining node. See the topic “Web Feed Node” on page 13 for more information.
v The Text Mining node uses linguistic methods to extract key concepts from the text, allows you to
create categories with these concepts and other data, and offers the ability to identify relationships and
associations between concepts based on known patterns (called text link analysis). The node can be
used to explore the text data contents or to produce either a concept model or category model. The
concepts and categories can be combined with existing structured data, such as demographics, and
applied to modeling. See the topic “Text Mining Modeling Node” on page 20 for more information.
v The Text Link Analysis node extracts concepts and also identifies relationships between concepts
based on known patterns within the text. Pattern extraction can be used to discover relationships
between your concepts, as well as any opinions or qualifiers attached to these concepts. The Text Link
Analysis node offers a more direct way to identify and extract patterns from your text and then add
the pattern results to the dataset in the stream. But you can also perform TLA using an interactive
workbench session in the Text Mining modeling node. See the topic “Text Link Analysis Node” on
page 47 for more information.
v The Translate node can be used to translate text from supported languages, such as Arabic, Chinese,
and Persian, into English or other languages for purposes of modeling. This makes it possible to mine
documents in double-byte languages that would not otherwise be supported and allows analysts to
extract concepts from these documents even if they are unable to speak the language in question. The
same functionality can be invoked from any of the text modeling nodes, but use of a separate Translate
node makes it possible to cache and reuse a translation in multiple nodes. See the topic “Translate
Node” on page 55 for more information.
v When mining text from external documents, the Text Mining Output node can be used to generate an
HTML page that contains links to the documents from which concepts were extracted. See the topic
“File Viewer Node” on page 59 for more information.
Applications
In general, anyone who routinely needs to review large volumes of documents to identify key elements
for further exploration can benefit from IBM SPSS Modeler Text Analytics.
Some specific applications include:
8
IBM SPSS Modeler Text Analytics 16 User's Guide
v Scientific and medical research. Explore secondary research materials, such as patent reports, journal
articles, and protocol publications. Identify associations that were previously unknown (such as a
doctor associated with a particular product), presenting avenues for further exploration. Minimize the
time spent in the drug discovery process. Use as an aid in genomics research.
v Investment research. Review daily analyst reports, news articles, and company press releases to
identify key strategy points or market shifts. Trend analysis of such information reveals emerging
issues or opportunities for a firm or industry over a period of time.
v Fraud detection. Use in banking and health-care fraud to detect anomalies and discover red flags in
large amounts of text.
v Market research. Use in market research endeavors to identify key topics in open-ended survey
responses.
v Blog and Web feed analysis. Explore and build models using the key ideas found in news feeds,
blogs, etc.
v CRM. Build models using data from all customer touch points, such as e-mail, transactions, and
surveys.
Chapter 1. About IBM SPSS Modeler Text Analytics
9
10
IBM SPSS Modeler Text Analytics 16 User's Guide
Chapter 2. Reading in Source Text
Data for text mining may reside in any of the standard formats used by IBM SPSS Modeler, including
databases or other "rectangular" formats that represent data in rows and columns, or in document
formats, such as Microsoft Word, Adobe PDF, or HTML, that do not conform to this structure.
v To read in text from documents that do not conform to standard data structure, including Microsoft
Word, Microsoft Excel, and Microsoft PowerPoint, as well as Adobe PDF, XML, HTML, and others, the
File List node can be used to generate a list of documents or folders as input to the text mining
process. See the topic “File List Node” for more information.
v To read in text from Web feeds, such as blogs or news feeds in RSS or HTML formats, the Web Feed
node can be used to format Web feed data for input into the text mining process. See the topic “Web
Feed Node” on page 13 for more information.
v To read in text from any of the standard data formats used by IBM SPSS Modeler, such as a database
with one or more text fields for customer comments, any of the standard source nodes native to IBM
SPSS Modeler can be used. See the IBM SPSS Modeler node documentation for more information.
File List Node
To read in text from unstructured documents saved in formats such as Microsoft Word, Microsoft Excel,
and Microsoft PowerPoint, as well as Adobe PDF, XML, HTML, and others, the File List node can be
used to generate a list of documents or folders as input to the text mining process. This is necessary
because unstructured text documents cannot be represented by fields and records—rows and
columns—in the same manner as other data used by IBM SPSS Modeler. This node can be found on the
Text Mining palette.
The File List node functions as a source node, except that instead of reading the actual data, the node
reads the names of the documents or directories below the specified root and produces these as a list. The
output is a single field, with one record for each file listed, which can be selected as input for a
subsequent Text Mining node.
You can find this node on the IBM SPSS Modeler Text Analytics tab of nodes palette at the bottom of the
IBM SPSS Modeler window. See the topic “IBM SPSS Modeler Text Analytics Nodes” on page 8 for more
information.
Important! Any directory names and filenames containing characters that are not included in the machine
local encoding are not supported. When attempting to execute a stream containing a File List node, any
file- or directory names containing these characters will cause the stream execution to fail. This could
happen with foreign language directory names or file names, such as a Japanese filename on a French
locale.
RTF Processing. To process RTF files, a filter is required. You can download an RTF filter from Microsoft
web site and manual registering it.
Adobe PDF Processing. In order to extract text from Adobe PDFs, Adobe Reader version 9 must be
installed on the machine where IBM SPSS Modeler Text Analytics and IBM SPSS Modeler Text Analytics
Server reside.
Important! Do not upgrade to Adobe Reader version 10 or later because it does not contain the
required filter.
v Upgrading to Adobe Reader version 9 helps you avoid a rather substantial memory leak in the filter
that caused processing errors when working with the volumes of Adobe PDF documents (near or over
1,000) . If you plan to process Adobe PDF documents on either 32-bit or 64-bit Microsoft Windows OS,
v
11
v
v
v
v
upgrade to either Adobe Reader version 9.x for 32-bit systems or Adobe PDF iFilter 9 for 64-bit
systems, both of which are available on the Adobe website, and append the <installation>\bin
subdirectory to your system path. For example, in the Environment Variables dialog box available
from: Control Panel > System > Advanced, add C:\Program Files\Adobe\Adobe PDF iFilter 9 for
64-bit platforms\bin\ to the PATH variable and restart your computer.
Adobe changed the filtering software they used starting from Adobe Reader 8.x. Older Adobe PDFs
files may not be readable or may contain foreign characters. This is an Adobe issue and is outside of
IBM SPSS Modeler Text Analytics's control.
If an Adobe PDF's security restriction for "Content Copying or Extraction" is set to "Not Allowed" in
the Security tab of the Adobe PDF's Document Properties dialog, then the document cannot be filtered
and read into the product.
Adobe PDF files cannot be processed under non-Microsoft Windows platforms.
Due to limitations in Adobe, it is not possible to extract text from image-based Adobe PDF files.
Microsoft Office Processing.
v To process the newer formats of the Microsoft Word, Microsoft Excel, and Microsoft PowerPoint
documents introduced in Microsoft Office 2007, you need to either have Microsoft Office 2007 installed
on the computer where IBM SPSS Modeler Text Analytics Server is running (local or remote) or install
the new Microsoft Office 2007 filter pack (found on the Microsoft website).
v Files from Microsoft Office files cannot be processed under non-Microsoft Windows platforms.
Local data support. If you are connected to a remote IBM SPSS Modeler Text Analytics Server and have a
stream with a File List node, the data should reside on the same machine as the IBM SPSS Modeler Text
Analytics Server or ensure that the server machine has access to the folder where the source data in the
File List node is stored.
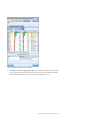
File List Node: Settings Tab
On this tab you can define the directories, file extensions, and output desired from this node.
Note: Text mining extraction cannot process Microsoft Office and Adobe PDF files under non-Microsoft
Windows platforms. However, XML, HTML or text files can always be processed.
Any directory names and filenames containing characters that are not included in the machine local
encoding are not supported. When attempting to execute a stream containing a File List node, any file- or
directory names containing these characters will cause the stream execution to fail. This could happen
with foreign language directory names or file names, such as a Japanese filename on a French locale.
Directory. Specifies the root folder containing the documents that you want to list.
v
Include subdirectories. Specifies that subdirectories should also be scanned.
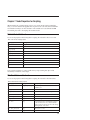
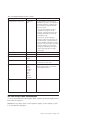
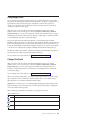
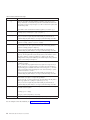
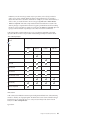
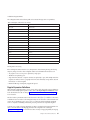
File type(s) to include in list: You can select or deselect the file types and extensions you want to use. By
deselecting a file extension, the files with that extension are ignored. You can filter by the following
extensions:
Table 1. File type filters by file extension.
v
.rtf, .doc, .docx, .docm
v
.xls, .xlsx, .xlsm
v
.ppt, .pptx, .pptm
v
.txt, .text
v
.htm, .html, .shtml
v
.xml
v
.pdf
v
.$
Note: See the topic “File List Node” on page 11 for more information.
If you have files with either no extension, or a trailing dot extension (for example File01 or File01.), use
the No extension option to select these.
12
IBM SPSS Modeler Text Analytics 16 User's Guide
Output field represents. Select the format of the output field. Choices are:
v Actual text. Select this option if the field will contain exact text. You are then able to choose the Input
encoding value from the following list:
– Automatic (European)
– Automatic (Japanese)
– UTF-8
– UTF-16
– ISO-8859-1
– US ascii
– CP850
– Shift-JIS
v Pathnames to documents. Select this option if the out put field will contain one or more pathnames for
the location(s) of where the documents reside.
Important! Since version 14, the 'List of directories' option is no longer available and the only output will
be a list of files.
File List Node: Other Tabs
The Types tab is a standard tab in IBM SPSS Modeler nodes, as is the Annotations tab.
Using the File List Node in Text Mining
The File List node is used when the text data resides in external unstructured documents in formats such
as Microsoft Word, Microsoft Excel, and Microsoft PowerPoint, as well as Adobe PDF, XML, HTML, and
others. This node is used to generate a list of documents or folders as input to the text mining process (a
subsequent Text Mining or Text Link Analysis node).
If you use the File List node, make sure to specify that the Text field represents pathnames to documents
in the Text Mining or Text Link Analysis node to indicate that rather than containing the actual text you
want to mine, the selected field contains paths to the documents where the text is located.
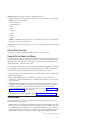
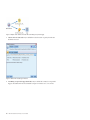
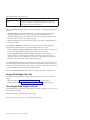
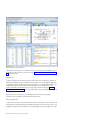
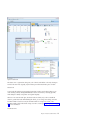
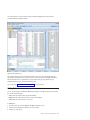
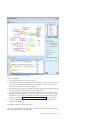
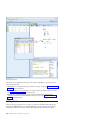
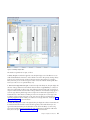
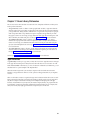
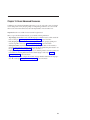
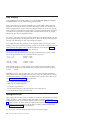
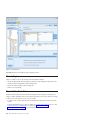
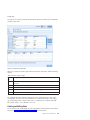
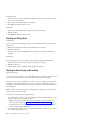
As an example, suppose we connected a File List node to a Text Mining node in order to supply text that
resides in external documents:
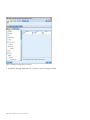
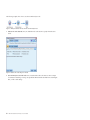
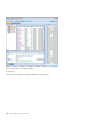
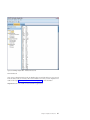
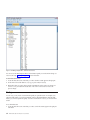
1. File List node (Settings tab). First, we added this node to the stream to specify where the text
documents are stored. We selected the directory containing all of the documents on which we want to
perform text mining.
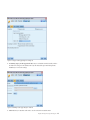
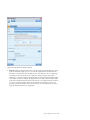
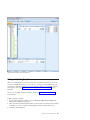
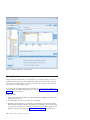
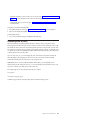
2. Text Mining node (Fields tab). Next, we added and connected a Text Mining node to the File List
node. In this node, we defined our input format, resource template, and output format. We selected
the field name produced from the File List node and selected the option where the text field
represents pathnames to documents as well as other settings. See the topic “Using the Text Mining
Node in a Stream” on page 30 for more information.
For more information on using the Text Mining node, see “Text Mining Modeling Node” on page 20.
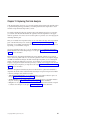
Web Feed Node
The Web Feed node can be used to prepare text data from Web feeds for the text mining process. This
node accepts Web feeds in two formats:
v RSS Format. RSS is a simple XML-based standardized format for Web content. The URL for this format
points to a page that has a set of linked articles such as syndicated news sources and blogs. Since RSS
is a standardized format, each linked article is automatically identified and treated as a separate record
in the resulting data stream. No further input is required for you to be able to identify the important
text data and the records from the feed unless you want to apply a filtering technique to the text.
Chapter 2. Reading in Source Text
13
v HTML Format. You can define one or more URLs to HTML pages on the Input tab. Then, in the
Records tab, define the record start tag as well as identify the tags that delimit the target content and
assign those tags to the output fields of your choice (description, title, modified date, and so on). See
the topic “Web Feed Node: Records Tab” on page 15 for more information.
Important! If you are trying to retrieve information over the web through a proxy server, you must
enable the proxy server in the net.properties file for both the IBM SPSS Modeler Text Analytics Client
and Server. Follow the instructions detailed inside this file. This applies when accessing the web through
the Web Feed node or retrieving an SDL Software as a Service (SaaS) license since these connections go
through Java. This file is located in C:\Program Files\IBM\SPSS\Modeler\16\jre\lib\net.properties by
default.
The output of this node is a set of fields used to describe the records. The Description field is most
commonly used since it contains the bulk of the text content. However, you may also be interested in
other fields, such as the short description of a record (Short Desc field) or the record's title (Title field).
Any of the output fields can be selected as input for a subsequent Text Mining node.
You can find this node on the IBM SPSS Modeler Text Analytics tab of nodes palette at the bottom of the
IBM SPSS Modeler window. See the topic “IBM SPSS Modeler Text Analytics Nodes” on page 8 for more
information.
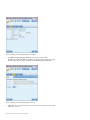
Web Feed Node: Input Tab
The Input tab is used to specify one or more Web addresses, or URLs, in order to capture the text data. In
the context of text mining, you could specify URLs for feeds that contain text data.
Important! When working with non RSS data, you may prefer to use a web scraping tool, such as
WebQL®, to automate content gathering and then referring the output from that tool using a different
source node.
You can set the following parameters:
Enter or paste URLs. In this field, you can type or paste one or more URLs. If you are entering more
than one, enter only one per line and use the Enter/Return key to separate lines. Enter the full URL path
to the file. These URLs can be for feeds in one of two formats:
v RSS format. RSS is a simple XML-based standardized format for Web content. The URL for this format
points to a page that has a set of linked articles such as syndicated news sources and blogs. Since RSS
is a standardized format, each linked article is automatically identified and treated as a separate record
in the resulting data stream. No further input is required for you to be able to identify the important
text data and the records from the feed unless you want to apply a filtering technique to the text.
v HTML format. You can define one or more URLs to HTML pages on the Input tab. Then, in the Records
tab, define the record start tag as well as identify the tags that delimit the target content and assign
those tags to the output fields of your choice (description, title, modified date, and so on). When
working with non RSS data, you may prefer to use a web scraping tool, such as WebQL®, to automate
content gathering and then referring the output from that tool using a different source node. See the
topic “Web Feed Node: Records Tab” on page 15 for more information.
Number of most recent entries to read per URL. This field specifies the maximum number of records to
read for each URL listed in the field starting with the first record found in the feed. The amount of text
impacts the processing speed during extraction downstream in a Text Mining node or Text Link Analysis
node.
Save and reuse previous web feeds when possible. With this option, web feeds are scanned and the
processed results are cached. Then, upon subsequent stream executions, if the contents of a given feed
14
IBM SPSS Modeler Text Analytics 16 User's Guide
have not changed or if the feed is inaccessible (an Internet outage, for example), the cached version is
used to speed processing time. Any new content discovered in these feeds is also cached for the next time
you execute the node.
v Label. If you select Save and reuse previous web feeds when possible, you must specify a label name
for the results. This label is used to describe the cached feeds on the server. If no label is specified or
the label is unrecognized, no reuse will be possible. You can manage these web feed caches in the
session table of the IBM SPSS Text Analytics Administration Console . Refer to the IBM SPSS Text
Analytics Administration Console User Guide for more information.
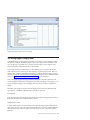
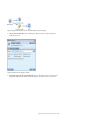
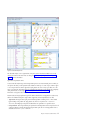
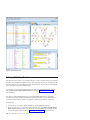
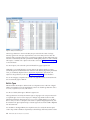
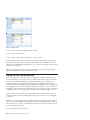
Web Feed Node: Records Tab
The Records tab is used to specify the text content of non-RSS feeds by identifying where each new
record begins, as well as other relevant information regarding each record. If you know that a non-RSS
feed (HTML) contains text that is in multiple records, you must identify the record start tag here or else
the text will be treated as one record. While RSS feeds are standardized and do not require any tag
specification on this tab, you can still preview the content in the Preview tab.
Important! When working with non RSS data, you may prefer to use a web scraping tool, such as
WebQL®, to automate content gathering and then referring the output from that tool using a different
source node.
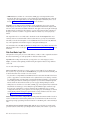
URL. This drop-down list contains a list of URLs entered on the Input tab. Both HTML and RSS
formatted feeds are present. If the URL address is too long for the drop-down list, it will automatically be
clipped in the middle using an ellipsis to replace the clipped text, such as http://www.ibm.com/example/
start-of-address...rest-of-address/path.htm.
v With HTML formatted feeds, if the feed contains more than one record (or entry), you can define
which HTML tags contain the data corresponding to the field shown in the table. For example, you can
define the start tag that indicates a new record has started, a modified date tag, or an author name.
v With RSS formatted feeds, you are not prompted to enter any tags since RSS is a standardized format.
However, you can view sample results on the Preview tab if desired. All recognized RSS feeds are
preceded by the RSS logo image.
Source tab. On this tab, you can view the source code for any HTML feeds. This code is not editable. You
can use the Find field to locate specific tags or information on this page that you can then copy and paste
into the table below. The Find field is not case sensitive and will match partial strings.
Preview tab. On this tab, you can preview how a record will be read by the Web feed node. This is
particularly useful for HTML feeds since you can change how a record will be read by defining HTML
tags in the table below the Preview tab.
Non-RSS record start tag. This option only applies to non-RSS feeds. If your HTML feed contains
multiple text that you want to break up into multiple records, specify the HTML tag that signals the
beginning of a record (such as an article or blog entry) here. If you do not define one for a non-RSS feed,
the entire page is treated as one single record, the entire contents are output in the Description field, and
the node execution date is used as both the Modified Date and the Published Date.
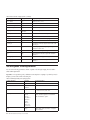
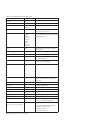
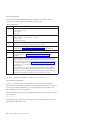
Field table. This option only applies to non-RSS feeds. In this table, you can break up the text content
into specific output fields by entering a start tag for any of the predefined output fields. Enter the start
tag only. All matches are done by parsing the HTML and matching the table contents to the tag names
and attributes found in the HTML. You can use the buttons at the bottom to copy the tags you have
defined and reuse them for other feeds.
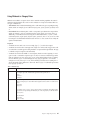
Table 2. Possible output fields for non-RSS feeds (HTML formats)
Output Field Name
Expected Tag Content
Title
The tag delimiting the record title. (optional)
Chapter 2. Reading in Source Text
15
Table 2. Possible output fields for non-RSS feeds (HTML formats) (continued)
Output Field Name
Expected Tag Content
Short Desc
The tag delimiting the short description or label. (optional)
Description
The tag delimiting the main text. If left blank, this field will contain all other content
in either the <body> tag (if there is a single record) or the content found inside the
current record (when a record delimiter has been specified).
Author
The tag delimiting the author of the text. (optional)
Contributors
The tag delimiting the names of the contributors. (optional)
Published Date
The tag delimiting the date when the text was published. If left blank, this field will
contain the date when the node reads the data.
Modified Date
The tag delimiting the date when the text was modified. If left blank, this field will
contain the date when the node reads the data.
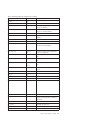
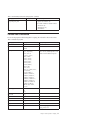
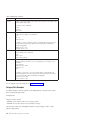
When you enter a tag into the table, the feed is scanned using this tag as the minimum tag to match
rather than an exact match. That is, if you entered <div> for the Title field, this would match any <div>
tag in the feed, including those with specified attributes (such as <div class=”post three”>), such that
<div> is equal to the root tag (<div>) and any derivative that includes an attribute and use that content
for the Title output field. If you enter a root tag, any further attributes are also included.
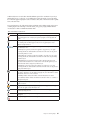
Table 3. Examples of HTML tags used identify the text for the output fields
If you enter:
It would match:
And also match:
But not match:
<div>
<div>
<div class=”post”>
any other tag
<p class=”auth”>
<p class=”auth”>
<p color=”black” class=”auth”
id=”85643”>
<p color=”black”>
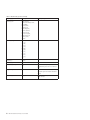
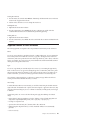
Web Feed Node: Content Filter Tab
The Content Filter tab is used to apply a filter technique to RSS feed content. This tab does not apply to
HTML feeds. You may want to filter if the feed contains a lot of text in the form of headers, footers,
menus, advertising and so on. You can use this tab to strip out unwanted HTML tags, JavaScript, and
short words or lines from the content.
Content Filtering. If you do not want to apply a cleaning technique, select None. Otherwise, select RSS
Content Cleaner.
RSS Content Cleaner Options. If you select RSS Content Cleaner, you can choose to discard lines based
on certain criteria. A line is delimited by an HTML tag such as <p> and <li> but excluding in-line tags
such as <span>, <b>, and <font>. Please note that <br> tags are processed as line breaks.
v Discard short lines. This option ignores lines that do not contain the minimum number of words
defined here.
v Discard lines with short words. This option ignores lines that have more than the minimum average
word length defined here.
v Discard lines with many single character words. This option ignores lines that contain more than a
certain proportion of single character words.
v Discard lines containing specific tags. This option ignores text in lines that contain any of the tags
specified in the field.
v Discard lines containing specific text. This option ignores lines that contain any of the text specified in
the field.
16
IBM SPSS Modeler Text Analytics 16 User's Guide
Using the Web Feed Node in Text Mining
The Web Feed node can be used to prepare text data from Internet Web feeds for the text mining process.
This node accepts Web feeds in either an HTML or RSS format. These feeds serve as input into the text
mining process (a subsequent Text Mining or Text Link Analysis node).
If you use the Web Feed node, you must make sure to specify that the Text field represents actual text in
the Text Mining or Text Link Analysis node to indicate that these feeds link directly to each article or blog
entry.
Important! If you are trying to retrieve information over the web through a proxy server, you must
enable the proxy server in the net.properties file for both the IBM SPSS Modeler Text Analytics Client
and Server. Follow the instructions detailed inside this file. This applies when accessing the web through
the Web Feed node or retrieving an SDL Software as a Service (SaaS) license since these connections go
through Java. This file is located in C:\Program Files\IBM\SPSS\Modeler\16\jre\lib\net.properties by
default.
Example: Web Feed node (RSS Feed) with the Text Mining modeling node
As an example, suppose we connect a Web Feed node to a Text Mining node in order to supply text data
from an RSS feed into the text mining process.
1. Web Feed node (Input tab). First, we added this node to the stream to specify where the feed
contents are located and to verify the content structure. On the first tab, we provided the URL to an
RSS feed. Since our example is for an RSS feed, the formatting is already defined, and we do not need
to make any changes on the Records tab. An optional content filtering algorithm is available for RSS
feeds, however in this case it was not applied.
2. Text Mining node (Fields tab). Next, we added and connected a Text Mining node to the Web Feed
node. On this tab, we defined the text field output by the Web Feed node. In this case, we wanted to
use the Description field. We also selected the option Text field represents actual text, as well as other
settings.
3. Text Mining node (Model tab). Next, on the Model tab, we chose the build mode and resources. In
this example, we chose to build a concept model directly from this node using the default resource
template.
For more information on using the Text Mining node, see “Text Mining Modeling Node” on page 20.
Chapter 2. Reading in Source Text
17
18
IBM SPSS Modeler Text Analytics 16 User's Guide
Chapter 3. Mining for Concepts and Categories
The Text Mining modeling node is used to generate one of two text mining model nuggets:
v Concept model nuggets uncover and extract salient concepts from your structured or unstructured text
data.
v Category model nuggets score and assign documents and records to categories, which are made up of the
extracted concepts (and patterns).
The extracted concepts and patterns as well as the categories from your model nuggets can all be
combined with existing structured data, such as demographics, and applied using the full suite of tools
from IBM SPSS Modeler to yield better and more focused decisions. For example, if customers frequently
list login issues as the primary impediment to completing online account management tasks, you might
want to incorporate “login issues” into your models.
Additionally, the Text Mining modeling node is fully integrated within IBM SPSS Modeler so that you
can deploy text mining streams via IBM SPSS Modeler Solution Publisher for real-time scoring of
unstructured data in applications such as PredictiveCallCenter. The ability to deploy these streams
ensures successful closed-loop text mining implementations. For example, your organization can now
analyze scratch-pad notes from inbound or outbound callers by applying your predictive models to
increase the accuracy of your marketing message in real time. Using text mining model results in streams
has been shown to improve the accuracy of predictive data models.
Note: To run IBM SPSS Modeler Text Analytics with IBM SPSS Modeler Solution Publisher, add the
directory <install_directory>/ext/bin/spss.TMWBServer to the $LD_LIBRARY_PATH environment variable.
In IBM SPSS Modeler Text Analytics, we often refer to extracted concepts and categories. It is important
to understand the meaning of concepts and categories since they can help you make more informed
decisions during your exploratory work and model building.
Concepts and Concept Model Nuggets
During the extraction process, the text data is scanned and analyzed in order to identify interesting or
relevant single words, such as election or peace, and word phrases. such as presidential election,
election of the president, or peace treaties. These words and phrases are collectively referred to as
terms. Using the linguistic resources, the relevant terms are extracted, and similar terms are grouped
together under a lead term called a concept.
In this way, a concept could represent multiple underlying terms depending on your text and the set of
linguistic resources you are using. For example, let's say we have a employee satisfaction survey and the
concept salary was extracted. Let's also say that when you looked at the records associated with salary,
you noticed that salary isn't always present in the text but instead certain records contained something
similar, such as the terms wage, wages, and salaries. These terms are grouped under salary since the
extraction engine deemed them as similar or determined they were synonyms based on processing rules
or linguistic resources. In this case, any documents or records containing any of those terms would be
treated as if they contained the word salary.
If you want to see what terms are grouped under a concept, you can explore the concept within an
interactive workbench or look at which synonyms are shown in the concept model. See the topic
“Underlying Terms in Concept Models” on page 33 for more information.
A concept model nugget contains a set of concepts that can be used to identify records or documents that
also contain the concept (including any of its synonyms or grouped terms). A concept model can be used
© Copyright IBM Corporation 2003, 2013
19
in two ways. The first would be to explore and analyze the concepts that were discovered in the original
source text or to quickly identify documents of interest. The second would be to apply this model to new
text records or documents to quickly identify the same key concepts in the new documents/records, such
as the real-time discovery of key concepts in scratch-pad data from a call center.
See the topic “Text Mining Nugget: Concept Model” on page 30 for more information.
Categories and Category Model Nuggets
You can create categories that represent, in essence, higher-level concepts or topics to capture the key
ideas, knowledge, and attitudes expressed in the text. Categories are made up of set of descriptors, such
as concepts, types, and rules. Together, these descriptors are used to identify whether or not a record or
document belongs in a given category. A document or record can be scanned to see whether any of its
text matches a descriptor. If a match is found, the document/record is assigned to that category. This
process is called categorization.
Categories can be built automatically using the product's robust set of automated techniques, manually
using additional insight you may have regarding the data, or a combination of both. You can also load a
set of prebuilt categories from a text analysis package through the Model tab of this node. Manual
creation of categories or refining categories can only be done through the interactive workbench. See the
topic “Text Mining Node: Model Tab” on page 23 for more information.
A category model nugget contains a set of categories along with its descriptors. The model can be used
to categorize a set of documents or records based on the text in each document/record. Every document
or record is read and then assigned to each category for which a descriptor match was found. In this way,
a document or record could be assigned to more than one category. You can use category model nuggets
to see the essential ideas in open-ended survey responses or in a set of blog entries, for example.
See the topic “Text Mining Nugget: Category Model” on page 39 for more information.
Text Mining Modeling Node
The Text Mining node uses linguistic and frequency techniques to extract key concepts from the text and
create categories with these concepts and other data. The node can be used to explore the text data
contents or to produce either a concept model nugget or category model nugget. When you execute this
modeling node, an internal linguistic extraction engine extracts and organizes the concepts, patterns,
and/or categories using natural language processing methods.
You can execute the Text Mining node and automatically produce a concept or category model nugget
using the Generate directly option. Alternatively, you can use a more hands-on, exploratory approach
using the Build interactively mode in which not only can you extract concepts, create categories, and
refine your linguistic resources, but also perform text link analysis and explore clusters. See the topic
“Text Mining Node: Model Tab” on page 23 for more information.
You can find this node on the IBM SPSS Modeler Text Analytics tab of nodes palette at the bottom of the
IBM SPSS Modeler window. See the topic “IBM SPSS Modeler Text Analytics Nodes” on page 8 for more
information.
Requirements. Text Mining modeling nodes accept text data from a Web Feed node, File List node, or
any of the standard source nodes. This node is installed with IBM SPSS Modeler Text Analytics and can
be accessed on the IBM SPSS Modeler Text Analytics palette.
Note: This node replaces the Text Extraction node for all users and the old Text Mining node for Japanese
users, which was offered in previous versions of Text Mining for Clementine. If you have older streams
that use these nodes or model nuggets, you must rebuild your streams using the new Text Mining node.
Note: Japanese text extraction is available in IBM SPSS Modeler Premium.
20
IBM SPSS Modeler Text Analytics 16 User's Guide
Text Mining Node: Fields Tab
The Fields tab is used to specify the field settings for the data from which you will be extracting
concepts. Consider using a Sample node upstream from this node when working with larger datasets to
speed processing times. See the topic “Sampling Upstream to Save Time” on page 29 for more
information.
You can set the following parameters:
Text field. Select the field containing the text to be mined, the document pathname, or the directory
pathname to documents. This field depends on the data source.
Text field represents. Indicate what the text field specified in the preceding setting contains. Choices are:
v Actual text. Select this option if the field contains the exact text from which concepts should be
extracted.
v Pathnames to documents. Select this option if the field contains one or more pathnames for the
location(s) of where the text documents reside.
Document type. This option is available only if you specified that the text field represents Pathnames to
documents. Document type specifies the structure of the text. Select one of the following types:
v Full text. Use for most documents or text sources. The entire set of text is scanned for extraction.
Unlike the other options, there are no additional settings for this option.
v Structured text. Use for bibliographic forms, patents, and any files that contain regular structures that
can be identified and analyzed. This document type is used to skip all or part of the extraction process.
It allows you to define term separators, assign types, and impose a minimum frequency value. If you
select this option, you must click the Settings button and enter text separators in the Structured Text
Formatting area of the Document Settings dialog box. See the topic “Document Settings for Fields Tab”
on page 22 for more information.
v XML text. Use to specify the XML tags that contain the text to be extracted. All other tags are ignored.
If you select this option, you must click the Settings button and explicitly specify the XML elements
containing the text to be read during the extraction process in the XML Text Formatting area of the
Document Settings dialog box. See the topic “Document Settings for Fields Tab” on page 22 for more
information.
Textual unity. This option is available only if you specified that the text field represents Pathnames to
documents and selected Full text as the document type. Select the extraction mode from the following:
v Document mode. Use for documents that are short and semantically homogenous, such as articles
from news agencies.
v Paragraph mode. Use for Web pages and nontagged documents. The extraction process semantically
divides the documents, taking advantage of characteristics such as internal tags and syntax. If this
mode is selected, scoring is applied paragraph by paragraph. Therefore, for example, the rule apple &
orange is true only if apple and orange are found in the same paragraph.
Paragraph mode settings. This option is available only if you specified that the text field represents
Pathnames to documents and set the textual unity option to Paragraph mode. Specify the character
thresholds to be used in any extraction. The actual size is rounded up or down to the nearest period. To
ensure that the word associations produced from the text of the document collection are representative,
avoid specifying an extraction size that is too small.
v Minimum. Specify the minimum number of characters to be used in any extraction.
v Maximum. Specify the maximum number of characters to be used in any extraction.
Input encoding. This option is available only if you indicated that the text field represents Pathnames to
documents. It specifies the default text encoding. For all languages except Japanese, a conversion is done
from the specified or recognized encoding to ISO-8859-1. So even if you specify another encoding, the
Chapter 3. Mining for Concepts and Categories
21
extraction engine will convert it to ISO-8859-1 before it is processed. Any characters that do not fit into
the ISO-8859-1 encoding definition will be converted to spaces. For Japanese text, you can choose one of
several encoding options: SHIFT_JIS, EUC_JP, UTF-8, or ISO-2022-JP.
Partition mode. Use the partition mode to choose whether to partition based on the type node settings or
to select another partition. Partitioning separates the data into training and test samples.
Document Settings for Fields Tab
Structured Text Formatting
If you want to skip all or part of the extraction process because you have structured data or want to
impose rules on how to handle the text, use the Structured text document type option and declare the
fields or tags containing the text in the Structured Text Formatting section of the Document Settings
dialog box. Extracted terms are derived only from the text contained within the declared fields or tags
(and child tags). Any undeclared field or tag will be ignored.
In certain contexts, linguistic processing is not required, and the linguistic extraction engine can be
replaced by explicit declarations. In a bibliography file where keyword fields are separated by separators
such as a semicolon (;) or comma (,), it is sufficient to extract the string between two separators. For this
reason, you can suspend the full extraction process and instead define special handling rules to declare
term separators, assign types to the extracted text, or impose a minimum frequency count for extraction.
Use the following rules when declaring structured text elements:
v Only one field, tag, or element per line can be declared. They do not have to be present in the data.
v Declarations are case sensitive.
v If declaring a tag that has attributes, such as <title id="1234">, and you want to include all variations
or, in this case, all IDs, add the tag without the attribute or the ending angle bracket (>), such as <title
v Add a colon after the field or tag name to indicate that this is structured text. Add this colon directly
after the field or tag but before any separators, types, or frequency values, such as author: or
<place>:.
v To indicate that multiple terms are contained in the field or tag and that a separator is being used to
designate the individual terms, declare the separator after the colon, such as author:, or <section>:;.
v To assign a type to the content found in the tag, declare the type name after the colon and a separator,
such as author:,Person or <place>:;Location. Declare type using the names as they appear in the
Resource Editor.
v To define a minimum frequency count for a field or tag, declare a number at the end of the line, such
as author:,Person1 or <place>:;Location5. Where n is the frequency count you defined, terms found
in the field or tag must occur at least n times in the entire set of documents or records to be extracted.
This also requires you to define a separator.
v If you have a tag that contains a colon, you must precede the colon with a backslash character so that
the declaration is not ignored. For example, if you have a field called <topic:source>, enter it as
<topic\:source>.
To illustrate the syntax, let's assume you have the following recurring bibliographic fields:
author:Morel, Kawashima
abstract:This article describes how fields are declared.
publication:Text Mining Documentation
datepub:March 2010
For this example, if we wanted the extraction process to focus on author and abstract but ignore the rest
of the content, we would declare only the following fields:
author:,Person1
abstract:
22
IBM SPSS Modeler Text Analytics 16 User's Guide
In this example, the author:,Person1 field declaration states that linguistic processing was suspended on
the field contents. Instead, it states that the author field contains more than one name, which is separated
from the next by a comma separator, and these names should be assigned to the Person type and that if
the name occurs at least once in the entire set of documents or records, it should be extracted. Since the
field abstract: is listed without any other declarations, the field will be scanned during extraction and
standard linguistic processing and typing will be applied.
XML Text Formatting
If you want to limit the extraction process to only the text within specific XML tags, use the XML text
document type option and declare the tags containing the text in the XML Text Formatting section of the
Document Settings dialog box. Extracted terms are derived only from the text contained within these tags
or their child tags.
Important! If you want to skip the extraction process and impose rules on term separators, assign types
to the extracted text, or impose a frequency count for extracted terms, use the Structured text option
described next.
Use the following rules when declaring tags for XML text formatting:
v Only one XML tag per line can be declared.
v Tag elements are case sensitive.
v If a tag has attributes, such as <title id="1234">, and you want to include all variations or, in this
case, all IDs, add the tag without the attribute or the ending angle bracket (>), such as <title
To illustrate the syntax, let's assume you have the following XML document:
<section>Rules of the Road
<title id="01234">Traffic Signals</title>
<p>Road signs are helpful.</p>
</section>
<p>Learning the rules is important.</p>
For this example, we will declare the following tags:
<section>
<title
In this example, since you have declared the tag <section>, the text in this tag and its nested tags,
Traffic Signals and Road signs are helpful, are scanned during the extraction process. However,
Learning the rules is important is ignored since the tag <p> was not explicitly declared nor was the tag
nested within a declared tag.
Text Mining Node: Model Tab
The Model tab is used to specify the build method and general model settings for the node output.
You can set the following parameters:
Model name. You can generate the model name automatically based on the target or ID field (or model
type in cases where no such field is specified) or specify a custom name.
Use partitioned data. If a partition field is defined, this option ensures that data from only the training
partition is used to build the model.
Build mode. Specifies how the model nuggets will be produced when a stream with this Text Mining
node is executed. Alternatively, you can use a more hands-on, exploratory approach using the Build
interactively mode in which not only can you extract concepts, create categories, and refine your
linguistic resources but you can also perform text link analysis and explore clusters.
Chapter 3. Mining for Concepts and Categories
23
v Build interactively. When a stream is executed, this option launches an interactive interface in which
you can extract concepts and patterns, explore and fine-tune the extracted results, build and refine
categories, fine-tune the linguistic resources (templates, synonyms, types, libraries, etc.), and build
category model nuggets. See the topic “Build Interactively” for more information.
v Generate directly. This option indicates that, when the stream is executed, a model automatically
should be created and added to the Models palette. Unlike the interactive workbench, no additional
manipulation is needed from you at execution time besides the settings defined in the node. If you
select this option, model specific options appear with which you can define the type of model you
want to produce. See the topic “Generate Directly” on page 25 for more information.
Copy resources from. When mining text, the extraction is based not only on the settings in the Expert tab
but also on the linguistic resources. These resources serve as the basis for how to handle and process the
text during extraction to get the concepts, types, and sometimes patterns. You can copy resources into this
node from either a resource template or a text analysis package. Select one and then click Load to define
the package or template from which the resources will be copied. At the moment that you load, a copy of
the resources is stored in the node. Therefore, if you ever wanted to use an updated template or TAP, you
would have to reload it here or in an interactive workbench session. For your convenience, the date and
time at which the resources were copied and loaded is shown in the node. See the topic “Copying
Resources From Templates and TAPs” on page 26 for more information.
Text language. Identifies the language of the text being mined. The resources copied in the node control
the language options presented. You can select the language for which the resources were tuned or
choose the ALL option. We highly recommend that you specify the exact language for the text data;
however, if you are unsure, you can choose the ALL option. ALL is unavailable for Japanese text. This
ALL option lengthens execution time since automatic language recognition is used to scan all documents
and records in order to identify the text language first. With this option, all records or documents that are
in a supported and licensed language are read by the extraction engine using the language-appropriate
internal dictionaries. See the topic “Language Identifier” on page 202 for more information. Contact your
sales representative if you are interested in purchasing a license for a supported language for which you
do not currently have access.
Build Interactively
In the Model tab of the text mining modeling node, you can choose a build mode for your model
nuggets. If you choose Build interactively, then an interactive interface opens when you execute the
stream. In this interactive workbench, you can:
v Extract and explore the extraction results, including concepts and typing to discover the salient ideas in
your text data.
v Use a variety of methods to build and extend categories from concepts, types, TLA patterns, and rules
so you can score your documents and records into these categories.
v Refine your linguistic resources (resource templates, libraries, dictionaries, synonyms, and more) so you
can improve your results through an iterative process in which concepts are extracted, examined, and
refined.
v Perform text link analysis (TLA) and use the TLA patterns discovered to build better category model
nuggets. The Text Link Analysis node doesn't offer the same exploratory options or modeling
capabilities.
v Generate clusters to discover new relationships and explore relationships between concept, types,
patterns, and categories in the Visualization pane.
v Generate refined category model nuggets to the Models palette in IBM SPSS Modeler and use them in
other streams.
Note: You cannot build an interactive model if you are creating an IBM SPSS Collaboration and
Deployment Services job.
24
IBM SPSS Modeler Text Analytics 16 User's Guide
Use session work (categories, TLA, resources, etc.) from last node update. When you work in an
interactive workbench session, you can update the node with session data (extraction parameters,
resources, category definitions, etc.). The Use session work option allows you to relaunch the interactive
workbench using the saved session data. This option is disabled the first time you use this node, since no
session data could have been saved. To learn how to update the node with session data so that you can
use this option, see “Updating Modeling Nodes and Saving” on page 82.
If you launch a session with this option, then the extraction settings, categories, resources, and any other
work from the last time you performed a node update from an interactive workbench session are
available when you next launch a session. Since saved session data are used with this option, certain
content, such as the resources copied from the template below, and other tabs are disabled and ignored.
But if you launch a session without this option, only the contents of the node as they are defined now are
used, meaning that any previous work you've performed in the workbench will not be available.
Note: If you change the source node for your stream after extraction results have been cached with the
Use session work... option, you will need to run a new extraction once the interactive workbench session
is launched if you want to get updated extraction results.
Skip extraction and reuse cached data and results. You can reuse any cached extraction results and data
in the interactive workbench session. This option is particularly useful when you want to save time and
reuse extraction results rather than waiting for a completely new extraction to be performed when the
session is launched. In order to use this option, you must have previously updated this node from within
an interactive workbench session and chosen the option to Keep the session work and cache text data
with extraction results for reuse. To learn how to update the node with session data so that you can use
this option, see “Updating Modeling Nodes and Saving” on page 82.
Begin session by. Select the option indicating the view and action you want to take place first upon
launching the interactive workbench session. Regardless of the view you start in, you can switch to any
view once in the session.
v Using extraction results to build categories. This option launches the interactive workbench in the
Categories and Concepts view and, if applicable, performs an extraction. In this view, you can create
categories and generate a category model. You can also switch to another view. See the topic Chapter 8,
“Interactive Workbench Mode,” on page 71 for more information.
v Exploring text link analysis (TLA) results. This option launches and begins by extracting and
identifying relationships between concepts within the text, such as opinions or other links in the Text
Link Analysis view. You must select a template or text analysis package that contains TLA pattern rules
in order to use this option and obtain results. If you are working with larger datasets, the TLA
extraction can take some time. In this case, you may want to consider using a Sample node upstream.
See the topic Chapter 12, “Exploring Text Link Analysis,” on page 147 for more information.
v Analyzing co-word clusters. This option launches in the Clusters view and updates any outdated
extraction results. In this view, you can perform co-word cluster analysis, which produces a set of
clusters. Co-word clustering is a process that begins by assessing the strength of the link value between
two concepts based on their co-occurrence in a given record or document and ends with the grouping
of strongly linked concepts into clusters. See the topic Chapter 8, “Interactive Workbench Mode,” on
page 71 for more information.
Generate Directly
In the Model tab of the text mining modeling node, you can choose a build mode for your model
nuggets. If you choose Generate directly, you can set the options in the node and then just execute your
stream. The output is a concept model nugget, which was placed directly in the Models palette. Unlike
the interactive workbench, no additional manipulation is needed from you at execution time besides the
frequency settings defined for this option in the node.
Chapter 3. Mining for Concepts and Categories
25
Maximum number of concepts to include in model. This option, which applies only when you build a
model automatically (non-interactive), indicates that you want to create a concept model. It also states
that this model should contain no more than the specified number of concepts.
Check concepts based on highest frequency. Top number of concepts. Starting with the concept with
the highest frequency, this is the number of concepts that will be checked. Here, frequency refers to the
number of times a concept (and all its underlying terms) appears in the entire set of the
documents/records. This number could be higher than the record count, since a concept can appear
multiple times in a record.
v Uncheck concepts that occur in too many records. Percentage of records. Unchecks concepts with a
record count percentage higher than the number you specified. This option is useful for excluding
concepts that occur frequently in your text or in every record but have no significance in your analysis.
v
Optimize for speed of scoring. Selected by default, this option ensures that the model created is compact
and scores at high speed. Deselecting this option creates a much larger model which scores more slowly.
However, the larger model ensures that scores displayed initially in the generated concept model are the
same as those obtained when scoring the same text with the model nugget.
Copying Resources From Templates and TAPs
When mining text, the extraction is based not only on the settings in the Expert tab but also on the
linguistic resources. These resources serve as the basis for how to handle and process the text during
extraction in order to get the concepts, types, and sometimes patterns. You can copy resources into this
node from a resource template, and if you are in the Text Mining node, you can also select a text analysis
package (TAP).
By default, resources are copied into the node from the basic template for licensed language for your
product when you add the node to the canvas. If you have licenses for multiple language, the first
language selected is used to determine the template to load automatically.
At the moment that you load, a copy of the selected resources is stored in the node. Only the contents of
the template or TAP are copied while the template or TAP itself is not linked to the node. This means
that if this template or TAP is later updated, these updates are not automatically available in the node. In
short, the resources loaded into the node are always used unless you either reload a copy of a template
or TAP, or unless you update a Text Mining node and select the Use session work option. For more
information on Use session work, see further in this topic.
When you select a template or TAP, choose one with the same language as your text data. You can only
use templates or TAPs in the languages for which you are licensed. If you want to perform text link
analysis, you must select a template that contains TLA patterns. If a template contains TLA patterns, an
icon will appear in the TLA column of the Load Resource Template dialog box.
Note: You cannot load TAPs into the Text Link Analysis node.
Resource Templates
A resource template is a predefined set of libraries and advanced linguistic and nonlinguistic resources
that have been fine-tuned for a particular domain or usage. In the text mining modeling node, a copy of
the resources from a basic template are already loaded in the node when you add the node to the stream,
but you can change templates or load a text analysis package by selecting either Resource template or
Text analysis package and then clicking Load. For templates, you can then select the template in the
Load Resource Template dialog box.
Note: If you do not see the template you want in the list but you have an exported copy on your
machine, you can import it now. You can also export from this dialog box to share with other users. See
the topic “Importing and Exporting Templates” on page 170 for more information.
Text Analysis Packages (TAPs)
26
IBM SPSS Modeler Text Analytics 16 User's Guide
A text analysis package (TAP) is a predefined set of libraries and advanced linguistic and nonlinguistic
resources bundled with one or more sets of predefined categories. IBM SPSS Modeler Text Analytics
offers several prebuilt TAPs for English language text and also for the Japanese language text, each of
which is fine-tuned for a specific domain. You cannot edit these TAPs but you can use them jump start
your category model building. You can also create your own TAPs in the interactive session. See the topic
“Loading Text Analysis Packages” on page 137 for more information. Note: Japanese text extraction is
available in IBM SPSS Modeler Premium.
Note: You cannot load TAPs into the Text Link Analysis node.
Using the "Use Session Work" option (Model tab)
While resources are copied into the node in the Model tab, you might also make changes later to the
resources in an interactive session and want to update the text mining modeling node with these latest
changes. In this case, you would select the Use session work option in the Model tab of the text mining
modeling node.
If you select Use session work, the Load button is disabled in the node to indicate that those resources
that came from the interactive workbench will be used instead of the resources that were loaded here
previously.
To make changes to resources once you've selected the Use session work option, you can edit or switch
your resources directly inside the interactive workbench session through the Resource Editor view. See
the topic “Updating Node Resources After Loading” on page 169 for more information.
Text Mining Node: Expert Tab
The Expert tab contains certain advanced parameters that impact how text is extracted and handled. The
parameters in this dialog box control the basic behavior, as well as a few advanced behaviors, of the
extraction process. However, they represent only a portion of the options available to you. There are also
a number of linguistic resources and options that impact the extraction results, which are controlled by
the resource template you select on the Model tab. See the topic “Text Mining Node: Model Tab” on page
23 for more information.
Note: This entire tab is disabled if you have selected the Build interactively mode using saved interactive
workbench information on the Model tab, in which case the extraction settings are taken from the last
saved workbench session.
For Dutch, English, French, German, Italian, Portuguese, and Spanish Text
You can set the following parameters whenever extracting for languages other than Japanese such as
English, Spanish, French, German, and so on:
Note: See further in this topic for information regarding the Expert settings for Japanese text. Japanese
text extraction is available in IBM SPSS Modeler Premium.
Limit extraction to concepts with a global frequency of at least [n]. Specifies the minimum number of
times a word or phrase must occur in the text in order for it to be extracted. In this way, a value of 5
limits the extraction to those words or phrases that occur at least five times in the entire set of records or
documents.
In some cases, changing this limit can make a big difference in the resulting extraction results, and
consequently, your categories. Let's say that you are working with some restaurant data and you do not
increase the limit above 1 for this option. In this case, you might find pizza (1), thin pizza (2), spinach pizza
(2), and favorite pizza (2) in your extraction results. However, if you were to limit the extraction to a global
frequency of 5 or more and re-extract, you would no longer get three of these concepts. Instead you
Chapter 3. Mining for Concepts and Categories
27
would get pizza (7), since pizza is the simplest form and also this word already existed as a possible
candidate. And depending on the rest of your text, you might actually have a frequency of more than
seven, depending on whether there are still other phrases with pizza in the text. Additionally, if spinach
pizza was already a category descriptor, you might need to add pizza as a descriptor instead to capture all
of the records. For this reason, change this limit with care whenever categories have already been created.
Note that this is an extraction-only feature; if your template contains terms (which they usually do), and
a term for the template is found in the text, then the term will be indexed regardless of its frequency.
For example, suppose you use a Basic Resources template that includes "los angeles" under the
<Location> type in the Core library; if your document contains Los Angeles only once, then Los Angeles
will be part of the list of concepts. To prevent this you will need to set a filter to display concepts
occurring at least the same number of times as the value entered in the Limit extraction to concepts with
a global frequency of at least [n] field.
Accommodate punctuation errors. This option temporarily normalizes text containing punctuation errors
(for example, improper usage) during extraction to improve the extractability of concepts. This option is
extremely useful when text is short and of poor quality (as, for example, in open-ended survey responses,
e-mail, and CRM data), or when the text contains many abbreviations.
Accommodate spelling errors for a minimum root character limit of [n]. This option applies a fuzzy
grouping technique that helps group commonly misspelled words or closely spelled words under one
concept. The fuzzy grouping algorithm temporarily strips all vowels (except the first one) and strips
double/triple consonants from extracted words and then compares them to see if they are the same so
that modeling and modelling would be grouped together. However, if each term is assigned to a different
type, excluding the <Unknown> type, the fuzzy grouping technique will not be applied.
You can also define the minimum number of root characters required before fuzzy grouping is used. The
number of root characters in a term is calculated by totaling all of the characters and subtracting any
characters that form inflection suffixes and, in the case of compound-word terms, determiners and
prepositions. For example, the term exercises would be counted as 8 root characters in the form
“exercise,” since the letter s at the end of the word is an inflection (plural form). Similarly, apple sauce
counts as 10 root characters (“apple sauce”) and manufacturing of cars counts as 16 root characters
(“manufacturing car”). This method of counting is only used to check whether the fuzzy grouping should
be applied but does not influence how the words are matched.
Note: If you find that certain words are later grouped incorrectly, you can exclude word pairs from this
technique by explicitly declaring them in the Fuzzy Grouping: Exceptions section in the Advanced
Resources tab. See the topic “Fuzzy Grouping” on page 196 for more information.
Extract uniterms. This option extracts single words (uniterms) as long as the word is not already part of a
compound word and if it is either a noun or an unrecognized part of speech.
Extract nonlinguistic entities. This option extracts nonlinguistic entities, such as phone numbers, social
security numbers, times, dates, currencies, digits, percentages, e-mail addresses, and HTTP addresses. You
can include or exclude certain types of nonlinguistic entities in the Nonlinguistic Entities: Configuration
section of the Advanced Resources tab. By disabling any unnecessary entities, the extraction engine won't
waste processing time. See the topic “Configuration” on page 200 for more information.
Uppercase algorithm. This option extracts simple and compound terms that are not in the built-in
dictionaries as long as the first letter of the term is in uppercase. This option offers a good way to extract
most proper nouns.
Group partial and full person names together when possible. This option groups names that appear
differently in the text together. This feature is helpful since names are often referred to in their full form
at the beginning of the text and then only by a shorter version. This option attempts to match any
28
IBM SPSS Modeler Text Analytics 16 User's Guide
uniterm with the <Unknown> type to the last word of any of the compound terms that is typed as
<Person>. For example, if doe is found and initially typed as <Unknown>, the extraction engine checks to
see if any compound terms in the <Person> type include doe as the last word, such as john doe. This
option does not apply to first names since most are never extracted as uniterms.
Maximum nonfunction word permutation. This option specifies the maximum number of nonfunction
words that can be present when applying the permutation technique. This permutation technique groups
similar phrases that differ from each other only by the nonfunction words (for example, of and the)
contained, regardless of inflection. For example, let's say that you set this value to at most two words and
both company officials and officials of the company were extracted. In this case, both extracted terms
would be grouped together in the final concept list since both terms are deemed to be the same when of
the is ignored.
Note: To enable the extraction of Text Link Analysis results, you must begin the session with the
Exploring text link analysis results option and also choose resources that contain TLA definitions. You
can always extract TLA results later during an interactive workbench session through the Extraction
Settings dialog. See the topic “Extracting Data” on page 86 for more information.
For Japanese Text
The dialog has different options for Japanese text since the extraction process has some differences. In
order to work with Japanese text, you must also select a template or text analysis package tuned for the
Japanese language in the Model tab of this node. See the topic “Copying Resources From Templates and
TAPs” on page 26 for more information.
Note: Japanese text extraction is available in IBM SPSS Modeler Premium.
Secondary Analysis. When an extraction is launched, basic keyword extraction takes place using the
default set of types. However, when you select a secondary analyzer, you can obtain many more or richer
concepts since the extractor will now include particles and auxiliary verbs as part of the concept. In the
case of sentiment analysis, a large number of additional types are also included. Furthermore, choosing a
secondary analyzer allows you to also generate text link analysis results.
Note: When a secondary analyzer is called, the extraction process takes longer to complete.
Dependency analysis. Choosing this option yields extended particles for the extraction concepts from
the basic type and keyword extraction. You can also obtain the richer pattern results from dependency
text link analysis (TLA).
v Sentiment analysis. Choosing this analyzer yields additional extracted concepts and, whenever
applicable, the extraction of TLA pattern results. In addition to the basic types, you also benefit from
more than 80 sentiment types. These types are used to uncover concepts and patterns in the text
through the expression of emotion, sentiments, and opinions. There are three options that dictate the
focus for the sentiment analysis: All sentiments, Representative sentiment only, and Conclusions
only.
v
v
No secondary analyzer. This options turns off all secondary analyzers. This option is hidden if the
option Exploring text link analysis (TLA) results was selected on the Model tab since a secondary
analyzer is required in order to obtain TLA results. If you select this option but later choose the option
Exploring text link analysis (TLA) results, an error will arise during stream execution.
Sampling Upstream to Save Time
When you have a large amount of data, the processing times can take minutes to hours, especially when
using the interactive workbench session. The greater the size of the data, the more time the extraction
and categorization processes will take. To work more efficiently, you can add one of IBM SPSS Modeler's
Sample nodes upstream from your Text Mining node. Use this Sample node to take a random sample
using a smaller subset of documents or records to do the first few passes.
Chapter 3. Mining for Concepts and Categories
29
A smaller sample is often perfectly adequate to decide how to edit your resources and even create most if
not all of your categories. And once you have run on the smaller dataset and are satisfied with the
results, you can apply the same technique for creating categories to the entire set of data. Then you can
look for documents or records that do not fit the categories you have created and make adjustments as
needed.
Note: The Sample node is a standard IBM SPSS Modeler node.
Using the Text Mining Node in a Stream
The Text Mining modeling node is used to access data and extract concepts in a stream. You can use any
source node to access data, such as a Database node, Var. File node, Web Feed node, or Fixed File node.
For text that resides in external documents, a File List node can be used.
Example 1: File List node and Text Mining node to build a concept model nugget directly
The following example shows how to use the File list node along with the Text Mining modeling node to
generate the concept model nugget. For more information on using the File List node, see “File List
Node” on page 11.
1. File List node (Settings tab). First, we added this node to the stream to specify where the text
documents are stored. We selected the directory containing all of the documents on which we want to
perform text mining.
2. Text Mining node (Fields tab). Next, we added and connected a Text Mining node to the File List
node. In this node, we defined our input format, resource template, and output format. We selected
the field name produced from the File List node and selected the option where the text field
represents pathnames to documents as well as other settings. See the topic “Using the Text Mining
Node in a Stream” for more information.
3.
Text Mining node (Model tab). Next, on the Model tab, we selected the build mode to generate a
concept model nugget directly from this node. You can select a different resource template, or keep
the basic resources.
Example 2: Excel File and Text Mining nodes to build a category model interactively
This example shows how the Text Mining node can also launch an interactive workbench session. For
more information on the interactive workbench, see Chapter 8, “Interactive Workbench Mode,” on page
71.
1. Excel source node (Data tab). First, we added this node to the stream to specify where the text is
stored.
Text Mining node (Fields tab). Next, we added and connected a Text Mining node. On this first tab,
we defined our input format. We selected a field name from the source node and selected the option
Text field represents Actual text since the data comes from directly from the Excel source node.
3. Text Mining node (Model tab). Next, on the Model tab, we selected to build a category model
nugget interactively and to use the extraction results to build categories automatically. In this
example, we loaded a copy of resources and a set of categories from a text analysis package.
2.
4.
Interactive Workbench session. Next, we executed the stream, and the interactive workbench
interface opened. After an extraction was performed, we began exploring our data and improving our
categories.
Text Mining Nugget: Concept Model
A Text Mining concept model nugget is created whenever you successfully execute a Text Mining model
node where you've selected the option to Generate a model directly in the Model tab. A text mining
concept model nugget is used for the real-time discovery of key concepts in other text data, such as
scratch-pad data from a call center.
30
IBM SPSS Modeler Text Analytics 16 User's Guide
The concept model nugget itself comprises a list of concepts, which have been assigned to types. You can
select any or all of the concepts in that model for scoring against other data. When you execute a stream
containing a Text Mining model nugget, new fields are added to the data according to the build mode
selected on the Model tab of the Text Mining modeling node prior to building the model. See the topic
“Concept Model: Model Tab” for more information.
If the model nugget was generated using translated documents, the scoring will be performed in the
translated language. Similarly, if the model nugget was generated using English as the language, you can
specify a translation language in the model nugget, since the documents will then be translated into
English.
Text Mining model nuggets are placed in the model nugget palette (located on the Models tab in the
upper right side of the IBM SPSS Modeler window) when they are generated.
Viewing Results
To see information about the model nugget, right-click the node in the model nuggets palette and choose
Browse from the context menu (or Edit for nodes in a stream).
Adding Models to Streams
To add the model nugget to your stream, click the icon in the model nuggets palette and then click the
stream canvas where you want to place the node. Or right-click the icon and choose Add to Stream from
the context menu. Then connect your stream to the node, and you are ready to pass data to generate
predictions.
Concept Model: Model Tab
In concept models, the Model tab displays the set of concepts that were extracted. The concepts are
presented in a table format with one row for each concept. The objective on this tab is to select which of
the concepts will be used for scoring.
Note: If you generated a category model nugget instead, this tab will present different information. See
the topic “Category Model Nugget: Model Tab” on page 40 for more information.
All concepts are selected for scoring by default, as shown in the check boxes in the leftmost column. A
checked box means that the concept will be used for scoring. An unchecked box means that the concept
will be excluded from scoring. You can check multiple rows by selecting them and clicking one of the
check boxes in your selection.
To learn more about each concept, you can look at the additional information provided in each of the
following columns:
Concept. This is the lead word or phrase that was extracted. In some cases, this concept represents the
concept name as well as some other underlying terms associated with this concept. To see which
underlying terms are part of a concept, display the Underlying Terms pane inside this tab and select the
concept to see the corresponding terms at the bottom of the dialog box. See the topic “Underlying Terms
in Concept Models” on page 33 for more information.
Global. Here, global (frequency) refers to the number of times a concept (and all its underlying terms)
appears in the entire set of the documents/records.
v Bar chart. The global frequency of this concept in the text data presented as a bar chart. The bar takes
the color of the type to which the concept is assigned in order to visually distinguish the types.
v %. The global frequency of this concept in the text data presented as a percentage.
v N. The actual number of occurrences of this concept in the text data.
Chapter 3. Mining for Concepts and Categories
31
Docs. Here, Docs refers to the document count, meaning number of documents or records in which the
concept (and all its underlying terms) appears.
v Bar chart. The document count for this concept presented as a bar chart. The bar takes the color of the
type to which the concept is assigned in order to visually distinguish the types.
v %. The document count for this concept presented as a percentage.
v N. The actual number of documents or records containing this concept.
Type. The type to which the concept is assigned. For each concept, the Global and Docs columns appear
in a color to denote the type to which this concept is assigned. A type is a semantic groupings of
concepts. See the topic “Type Dictionaries” on page 181 for more information.
Working with Concepts
By right-clicking a cell in the table, you can display a context menu in which you can:
v
v
v
v
v
v
v
v
Select All. All rows in the table will be selected.
Copy. The selected concept(s) are copied to the clipboard.
Copy With Fields The selected concept(s) are copied to the clipboard along with the column heading.
Check Selected. Checks all check boxes for the selected rows in the table thereby including those
concepts for scoring.
Uncheck Selected. Unchecks all check boxes for the selected rows in the table.
Check All. Checks all check boxes in the table. This results in all concepts being used in the final
output.
Uncheck All. Unchecks all check boxes in the table. Unchecking a concept means that it will not be
used in the final output.
Include Concepts. Displays the Include Concepts dialog box. See the topic “Options for Including
Concepts for Scoring” for more information.
Options for Including Concepts for Scoring
To quickly check or uncheck those concepts that will be used for scoring, click the toolbar button for
Include Concepts..
Figure 1. Include Concepts toolbar button
Clicking this toolbar button will open the Include Concepts dialog box to allow you to select concepts
based on rules. All concepts that have a check mark on the Model tab will be included for scoring. Apply
a rule in this subdialog to change which concepts will be used for scoring.
You can choose from the following options:
Check concepts based on highest frequency. Top number of concepts. Starting with the concept with
the highest global frequency, this is the number of concepts that will be checked. Here, frequency refers
to the number of times a concept (and all its underlying terms) appears in the entire set of the
documents/records. This number could be higher than the record count, since a concept can appear
multiple times in a record.
Check concepts based on document count. Minimum count. This is the lowest document count needed
for the concepts to be checked. Here, document count refers to number of documents/records in which
the concept (and all its underlying terms) appears.
Check concepts assigned to the type. Select a type from the drop-down list to check all concepts that are
assigned to this type. Concepts are assigned to types automatically during the extraction process. A type
32
IBM SPSS Modeler Text Analytics 16 User's Guide
is a semantic grouping of concepts. Types include such things as higher-level concepts, positive and
negative words and qualifiers, contextual qualifiers, first names, places, organizations, and more. See the
topic “Type Dictionaries” on page 181 for more information.
Uncheck concepts that occur in too many records. Percentage of records. Unchecks concepts with a
record count percentage higher than the number you specified. This option is useful for excluding
concepts that occur frequently in your text or in every record but have no significance in your analysis.
Uncheck concepts assigned to the type. Unchecks concepts matching the type that you select from the
drop-down list.
Underlying Terms in Concept Models
You can see the underlying terms that are defined for the concepts that you have selected in the table. By
clicking the underlying terms toggle button on the toolbar, you can display the underlying terms table in
a split pane at the bottom of the dialog.
These underlying terms include the synonyms defined in the linguistic resources (regardless of whether
they were found in the text or not) as well as any extracted plural/singular forms found in the text used
to generate the model nugget, permuted terms, terms from fuzzy grouping, and so on.
Figure 2. Display Underlying Terms toolbar button
Note: You cannot edit the list of underlying terms. This list is generated through substitutions, synonym
definitions (in the substitution dictionary), fuzzy grouping, and more—all of which are defined in the
linguistic resources. In order to make changes to how terms are grouped under a concept or how they are
handled, you must make changes directly in the resources (editable in the Resource Editor in the
interactive workbench or in the Template Editor and then reload in the node) and then reexecute the
stream to get a new model nugget with the updated results.
By right-clicking the cell containing an underlying term or concept, you can display a context menu in
which you can:
v Copy. The selected cell is copied to the clipboard.
v Copy With Fields. The selected cell is copied to the clipboard along with the column headings.
v Select All. All cells in the table will be selected.
Concept Model: Settings Tab
The Settings tab is used to define the text field value for the new input data, if necessary. It is also the
place where you define the data model for your output (scoring mode).
Note: This tab appears only when the model nugget is placed onto the canvas. It does not exist when
you are accessing this dialog box directly in the Models palette.
Scoring mode: Concepts as records
With this scoring mode, a new record is created for each concept/document pair. Typically, there are more
records in the output than there were in the input.
In addition to the input fields, the following new fields are added to the data:
Table 4. Output fields for "Concepts as records".
Field
Description
Concept
Contains the extracted concept name found in the text data field.
Chapter 3. Mining for Concepts and Categories
33
Table 4. Output fields for "Concepts as records" (continued).
Field
Description
Type
Stores the type of the concept as a full type name, such as Location or Person. A type is a semantic
grouping of concepts. See the topic “Type Dictionaries” on page 181 for more information.
Count
Displays the number of occurrences for that concept (and its underlying terms) in the text body
(record/document).
When you select this option, all other options except Accommodate punctuation errors are disabled.
Scoring mode: Concepts as fields
In concept models, for each input record, a new record is created for every concept found in a given
document. Therefore, there are just as many output records as there were in the input. However, each
record (row) now contains one new field (column) for each concept that was selected (using the check
mark) on the Model tab. The value for each concept field depends on whether you select Flags or Counts
as your field value on this tab.
Note: If you are using very large data sets, for example with a DB2 database, using Concepts as fields
may encounter processing problems due to the amount of data. In this case we recommend using
Concepts as records instead.
Field Values. Choose whether the new field for each concept will contain a count or a flag value.
v Flags. This option is used to obtain flags with two distinct values in the output, such as Yes/No,
True/False, T/F, or 1 and 2. The storage types are set automatically to reflect the values chosen. For
example, if you enter numeric values for the flags, they will be automatically handled as an integer
value. The storage types for flags can be string, integer, real number, or date/time. Enter a flag value
for True and for False.
v Counts. Used to obtain a count of how many times the concept occurred in a given record.
Field name extension. Specify an extension for the field name. Field names are generated by using the
concept name plus this extension.
v Add as. Specify where the extension should be added to the field name. Choose Prefix to add the
extension to the beginning of the string. Choose Suffix to add the extension to the end of the string.
Accommodate punctuation errors. This option temporarily normalizes text containing punctuation errors
(for example, improper usage) during extraction to improve the extractability of concepts. This option is
extremely useful when text is short and of poor quality (as, for example, in open-ended survey responses,
e-mail, and CRM data), or when the text contains many abbreviations.
Note: The Accommodate punctuation errors option does not apply when working with Japanese text.
Concept Model: Fields Tab
The Fields tab is used to define the text field value for the new input data, if necessary.
Note: This tab appears only when the model nugget is placed in the stream. It does not exist when you
are accessing this output directly in the Models palette.
Text field. Select the field containing the text to be mined, the document pathname, or the directory
pathname to documents. This field depends on the data source.
Text field represents. Indicate what the text field specified in the preceding setting contains. Choices are:
v Actual text. Select this option if the field contains the exact text from which concepts should be
extracted.
34
IBM SPSS Modeler Text Analytics 16 User's Guide
v Pathnames to documents. Select this option if the field contains one or more pathnames for the
location(s) of where the text documents reside.
Document type. This option is available only if you specified that the text field represents Pathnames to
documents. Document type specifies the structure of the text. Select one of the following types:
v Full text. Use for most documents or text sources. The entire set of text is scanned for extraction.
Unlike the other options, there are no additional settings for this option.
v Structured text. Use for bibliographic forms, patents, and any files that contain regular structures that
can be identified and analyzed. This document type is used to skip all or part of the extraction process.
It allows you to define term separators, assign types, and impose a minimum frequency value. If you
select this option, you must click the Settings button and enter text separators in the Structured Text
Formatting area of the Document Settings dialog box. See the topic “Document Settings for Fields Tab”
on page 22 for more information.
v XML text. Use to specify the XML tags that contain the text to be extracted. All other tags are ignored.
If you select this option, you must click the Settings button and explicitly specify the XML elements
containing the text to be read during the extraction process in the XML Text Formatting area of the
Document Settings dialog box. See the topic “Document Settings for Fields Tab” on page 22 for more
information.
Input encoding. This option is available only if you indicated that the text field represents Pathnames to
documents. It specifies the default text encoding. For all languages except Japanese, a conversion is done
from the specified or recognized encoding to ISO-8859-1. So even if you specify another encoding, the
extraction engine will convert it to ISO-8859-1 before it is processed. Any characters that do not fit into
the ISO-8859-1 encoding definition will be converted to spaces. For Japanese text, you can choose one of
several encoding options: SHIFT_JIS, EUC_JP, UTF-8, or ISO-2022-JP.
Text language. Identifies the language of the text being mined; this is the main language detected during
extraction. Contact your sales representative if you are interested in purchasing a license for a supported
language for which you do not currently have access.
Concept Model: Summary Tab
The Summary tab presents information about the model itself (Analysis folder), fields used in the model
(Fields folder), settings used when building the model (Build Settings folder), and model training (Training
Summary folder).
When you first browse a modeling node, the folders on the Summary tab are collapsed. To see the results
of interest, use the expander control to the left of the folder to show the results, or click the Expand All
button to show all results. To hide the results after viewing them, use the expander control to collapse the
specific folder that you want to hide, or click the Collapse All button to collapse all folders.
Using Concept Model Nuggets in a Stream
When using a Text Mining modeling node, you can generate either a concept model nugget or a category
model nugget (through an interactive workbench session). The following example shows how to use a
concept model in a simple stream.
Example: Statistics File node with the concept model nugget
The following example shows how to use the Text Mining concept model nugget.
Chapter 3. Mining for Concepts and Categories
35
Figure 3. Example stream: Statistics File node with a Text Mining concept model nugget
1.
Statistics File node (Data tab). First, we added this node to the stream to specify where the text
documents are stored.
Figure 4. Statistics File node dialog box: Data tab
2.
36
Text Mining concept model nugget (Model tab). Next, we added and connected a concept model
nugget to the Statistics File node. We selected the concepts we wanted to use to score our data.
IBM SPSS Modeler Text Analytics 16 User's Guide
Figure 5. Text Mining model nugget dialog box: Model tab
3.
Text Mining concept model nugget (Settings tab). Next, we defined the output format and selected
Concepts as fields. One new field will be created in the output for each concept selected in the Model
tab. Each field name will be made up of the concept name and the prefix "Concept_"
Chapter 3. Mining for Concepts and Categories
37
Figure 6. Text Mining concept model nugget dialog box: Settings tab
4.
Text Mining concept model nugget (Fields tab). Next, we selected the text field,
Q2_What_do_you_like_least_about_this_portable_music_player, which is the field name coming
from the Statistics File node. We also selected the option Text field represents: Actual text.
Figure 7. Text Mining concept model nugget dialog box: Fields tab
5.
38
Table node. Next, we attached a table node to see the results and executed the stream. The table
output opens on screen.
IBM SPSS Modeler Text Analytics 16 User's Guide
Figure 8. Table output scrolled to show the concept flags
Text Mining Nugget: Category Model
A Text Mining category model nugget is created whenever you generate a category model from within
the interactive workbench. This modeling nugget contains a set of categories, whose definition is made
up of concepts, types, TLA patterns, and/or category rules. The nugget is used to categorize survey
responses, blog entries, other Web feeds, and any other text data.
If you launch an interactive workbench session in the modeling node, you can explore the extraction
results, refine the resources, fine-tune your categories before you generate category models. When you
execute a stream containing a Text Mining model nugget, new fields are added to the data according to
the build mode selected on the Model tab of the Text Mining modeling node prior to building the model.
See the topic “Category Model Nugget: Model Tab” on page 40 for more information.
If the model nugget was generated using translated documents, the scoring will be performed in the
translated language. Similarly, if the model nugget was generated using English as the language, you can
specify a translation language in the model nugget, since the documents will then be translated into
English.
Text Mining model nuggets are placed in the model nugget palette (located on the Models tab in the
upper right side of the IBM SPSS Modeler window) when they are generated.
Viewing Results
To see information about the model nugget, right-click the node in the model nuggets palette and choose
Browse from the context menu (or Edit for nodes in a stream).
Adding Models to Streams
To add the model nugget to your stream, click the icon in the model nuggets palette and then click the
stream canvas where you want to place the node. Or right-click the icon and choose Add to Stream from
the context menu. Then connect your stream to the node, and you are ready to pass data to generate
predictions.
Chapter 3. Mining for Concepts and Categories
39
Category Model Nugget: Model Tab
For category models, the model tab displays the list of categories in the category model on the left and
the descriptors for a selected category on the right. Each category is made up of a number of descriptors.
For each category you select, the associated descriptors appear in the table. These descriptors can include
concepts, category rules, types, and TLA patterns. The type of each descriptor, as well as some examples
of what each descriptor represents, is also shown.
On this tab, the objective is to select the categories you want to use for scoring. For a category model,
documents and records are scored into categories. If a document or record contains one or more of the
descriptors in its text or any underlying terms, then that document or record is assigned to the category
to which the descriptor belongs. These underlying terms include the synonyms defined in the linguistic
resources (regardless of whether they were found in the text or not) as well as any extracted
plural/singular terms found in the text used to generate the model nugget, permuted terms, terms from
fuzzy grouping, and so on.
Note: If you generated a concept model nugget instead, this tab will contain different results. See the topic
“Concept Model: Model Tab” on page 31 for more information.
Category Tree
To learn more about each category, select that category and review the information that appears for the
descriptors in that category. For each descriptor, you can review the following information:
v Descriptor name. This field contains an icon representing what kind of descriptor it is, as well as the
descriptor name.
Table 5. Descriptor icons
Concepts
TLA Patterns
Types
Category Rules
v Type. This field contains the type name for the descriptor. Types are collections of similar concepts
(semantic groupings), such as organization names, products, or positive opinions. Rules are not
assigned to types.
v Details. This field contains a list of what is included in that descriptor. Depending on the number of
matches, you may not see the entire list for each descriptor due to size limitations in the dialog box.
Selecting and Copying Categories
All top categories are selected for scoring by default, as shown in the check boxes in the left pane. A
checked box means that the category will be used for scoring. An unchecked box means that the category
will be excluded from scoring. You can check multiple rows by selecting them and clicking one of the
check boxes in your selection. Also, if a category or subcategory is selected but one of its subcategories is
not selected, then the checkbox shows a blue background to indicate that there is only a partial selection
in the children of the selected category.
By right-clicking a category in the tree, you can display a context menu from which you can:
v Check Selected. Checks all check boxes for the selected rows in the table.
v Uncheck Selected. Unchecks all check boxes for the selected rows in the table.
v Check All. Checks all check boxes in the table. This results in all categories being used in the final
output. You can also use the corresponding checkbox icon on the toolbar.
v Uncheck All. Unchecks all check boxes in the table. Unchecking a category means that it will not be
used in the final output.You can also use the corresponding empty checkbox icon on the toolbar.
40
IBM SPSS Modeler Text Analytics 16 User's Guide
By right-clicking a cell in the descriptor table, you can display a context menu in which you can:
v Copy. The selected concept(s) are copied to the clipboard.
v Copy With Fields. The selected descriptor is copied to the clipboard along with the column headings.
v Select All. All rows in the table will be selected.
Category Model Nugget: Settings Tab
The Settings tab is used to define the text field value for the new input data, if necessary. It is also the
place where you define the data model for your output (scoring mode).
Note: This tab appears in the node dialog box only when the model nugget is placed on the canvas or in
a stream. It does not exist when you are accessing this nugget directly in the Models palette.
Scoring mode: Categories as fields
With this option, there are just as many output records as there were in the input. However, each record
now contains one new field for every category that was selected (using the check mark) on the Model
tab. For each field, enter a flag value for True and for False, such as Yes/No, True/False, T/F, or 1 and 2.
The storage types are set automatically to reflect the values chosen. For example, if you enter numeric
values for the flags, they will be automatically handled as an integer value. The storage types for flags
can be string, integer, real number, or date/time.
Note: If you are using very large data sets, for example with a DB2 database, using Categories as fields
may encounter processing problems due to the amount of data. In this case we recommend using
Categories as records instead.
Field name extension. You can choose to specify an extension prefix/suffix for the field name or you can
choose to use the category codes. Field names are generated by using the category name plus this
extension.
v Add as. Specify where the extension should be added to the field name. Choose Prefix to add the
extension to the beginning of the string. Choose Suffix to add the extension to the end of the string.
If a subcategory is unselected. This option allows you to specify how the descriptors belonging to
subcategories that were not selected for scoring will be handled. There are two options.
v The option Exclude its descriptors completely from scoring will cause the descriptors of subcategories
that do not have checkmarks (unselected) to be ignored and unused during scoring.
v The option Aggregate descriptors with those in parent category will cause the descriptors of
subcategories that do not have checkmarks (unselected) to be used as descriptors for the parent
category (the category above this subcategory). If several levels of subcategories and unselected, the
descriptors will be rolled up under the first available parent category.
Accommodate punctuation errors. This option temporarily normalizes text containing punctuation errors
(for example, improper usage) during extraction to improve the extractability of concepts. This option is
extremely useful when text is short and of poor quality (as, for example, in open-ended survey responses,
e-mail, and CRM data), or when the text contains many abbreviations.
Note: The Accommodate punctuation errors option does not apply when working with Japanese text.
Scoring mode: Categories as records
With this option, a new record is created for each category, documentpair. Typically, there are more
records in the output than there were in the input. In addition to the input fields, new fields are also
added to the data depending on what kind of model it is.
Chapter 3. Mining for Concepts and Categories
41
Table 6. Output fields for "Categories as records".
New Output Field
Description
Category
Contains the category name to which the text document was assigned. If the
categories is a subcategory of another, then the full path to the category name is
controlled by the value you chose in this dialog.
Values for hierarchical categories. This option controls how the names of subcategories are displayed in
the output.
v Full category path. This option will output the name of the category and the full path of parent
categories if applicable using slashes to separate category names from subcategory names.
v Short category path. This option will output only the name of the category but use ellipses to show
the number of parent categories for the category in question.
v
Bottom level category. This option will output only the name of the category without the full path or
parent categories shown.
If a subcategory is unselected. This option allows you to specify how the descriptors belonging to
subcategories that were not selected for scoring will be handled. There are two options.
v The option Exclude its descriptors completely from scoring will cause the descriptors of subcategories
that do not have checkmarks (unselected) to be ignored and unused during scoring.
v The option Aggregate descriptors with those in parent category will cause the descriptors of
subcategories that do not have checkmarks (unselected) to be used as descriptors for the parent
category (the category above this subcategory). If several levels of subcategories and unselected, the
descriptors will be rolled up under the first available parent category.
Accommodate punctuation errors. This option temporarily normalizes text containing punctuation errors
(for example, improper usage) during extraction to improve the extractability of concepts. This option is
extremely useful when text is short and of poor quality (as, for example, in open-ended survey responses,
e-mail, and CRM data), or when the text contains many abbreviations.
Note: The Accommodate punctuation errors option does not apply when working with Japanese text.
Category Model Nugget: Other Tabs
The Fields tab and Settings tab for the category model nugget are the same as for the concept model
nugget.
v Fields tab. See the topic “Concept Model: Fields Tab” on page 34 for more information.
v Summary tab. See the topic “Concept Model: Summary Tab” on page 35 for more information.
Using Category Model Nuggets in a Stream
The Text Mining category model nugget is generated from an interactive workbench session. You can use
this model nugget in a stream.
Example: Statistics File node with the category model nugget
The following example shows how to use the Text Mining model nugget.
42
IBM SPSS Modeler Text Analytics 16 User's Guide
Figure 9. Example stream: Statistics File node with a Text Mining category model nugget
1. Statistics File node (Data tab). First, we added this node to the stream to specify where the text
documents are stored.
Figure 10. Statistics File node dialog box: Data tab
2. Text Mining category model nugget (Model tab). Next, we added and connected a category model
nugget to the Statistics File node. We selected the categories we wanted to use to score our data.
Chapter 3. Mining for Concepts and Categories
43
Figure 11. Text Mining model nugget dialog box: Model tab
3. Text Mining model nugget (Settings tab). Next, we defined the output format Categories as fields.
44
IBM SPSS Modeler Text Analytics 16 User's Guide
Figure 12. Category model nugget dialog box: Settings tab
4. Text Mining category model nugget (Fields tab). Next, we selected the text field variable, which is
the field name coming from the Statistics File node, and selected the option Text field represents
Actual text, as well as other settings.
Figure 13. Text Mining model nugget dialog box: Fields tab
5. Table node. Next, we attached a table node to see the results and executed the stream.
Chapter 3. Mining for Concepts and Categories
45
Figure 14. Table output
46
IBM SPSS Modeler Text Analytics 16 User's Guide
Chapter 4. Mining for Text Links
Text Link Analysis Node
The Text Link Analysis (TLA) node adds a pattern-matching technology to text mining's concept
extraction in order to identify relationships between the concepts in the text data based on known
patterns. These relationships can describe how a customer feels about a product, which companies are
doing business together, or even the relationships between genes or pharmaceutical agents.
For example, extracting your competitor’s product name may not be interesting enough to you. Using
this node, you could also learn how people feel about this product, if such opinions exist in the data. The
relationships and associations are identified and extracted by matching known patterns to your text data.
You can use the TLA pattern rules inside certain resource templates shipped with IBM SPSS Modeler Text
Analytics or create/edit your own. Pattern rules are made up of macros, word lists, and word gaps to
form a Boolean query, or rule, that is compared to your input text. Whenever a TLA pattern rule matches
text, this text can be exacted as a TLA result and restructured as output data. See the topic Chapter 19,
“About Text Link Rules,” on page 205 for more information.
The Text Link Analysis node offers a more direct way to identify and extract TLA pattern results from
your text and then add the results to the dataset in the stream. But the Text Link Analysis node is not the
only way in which you can perform text link analysis. You can also use an interactive workbench session
in the Text Mining modeling node.
In the interactive workbench, you can explore the TLA pattern results and use them as category
descriptors and/or to learn more about the results using drilldown and graphs. See the topic Chapter 12,
“Exploring Text Link Analysis,” on page 147 for more information. In fact, using the Text Mining node to
extract TLA results is a great way to explore and fine-tune templates to your data for later use directly in
the TLA node.
The output can be represented in up to 6 slots, or parts. Japanese patterns are only output as one or two
slots. See the topic “TLA Node Output” on page 51 for more information.
You can find this node on the IBM SPSS Modeler Text Analytics tab of nodes palette at the bottom of the
IBM SPSS Modeler window. See the topic “IBM SPSS Modeler Text Analytics Nodes” on page 8 for more
information.
Requirements. The Text Link Analysis node accepts text data read into a field using any of the standard
source nodes (Database node, Flat File node, etc.) or read into a field listing paths to external documents
generated by a File List node or a Web Feed node.
Strengths. The Text Link Analysis node goes beyond basic concept extraction to provide information
about the relationships between concepts, as well as related opinions or qualifiers that may be revealed in
the data.
Text Link Analysis Node: Fields Tab
The Fields tab is used to specify the field settings for the data from which you will be extracting
concepts. You can set the following parameters:
ID field. Select the field containing the identifier for the text records. Identifiers must be integers. The ID
field serves as an index for the individual text records. Use an ID field if the text field represents the text
to be mined. Do not use an ID field if the text field represents Pathnames to documents.
47
Text field. Select the field containing the text to be mined, the document pathname, or the directory
pathname to documents. This field depends on the data source.
Text field represents. Indicate what the text field specified in the preceding setting contains. Choices are:
v Actual text. Select this option if the field contains the exact text from which concepts should be
extracted.
v Pathnames to documents. Select this option if the field contains one or more pathnames for the
location(s) of where the text documents reside.
Document type. This option is available only if you specified that the text field represents Pathnames to
documents. Document type specifies the structure of the text. Select one of the following types:
v Full text. Use for most documents or text sources. The entire set of text is scanned for extraction.
Unlike the other options, there are no additional settings for this option.
v Structured text. Use for bibliographic forms, patents, and any files that contain regular structures that
can be identified and analyzed. This document type is used to skip all or part of the extraction process.
It allows you to define term separators, assign types, and impose a minimum frequency value. If you
select this option, you must click the Settings button and enter text separators in the Structured Text
Formatting area of the Document Settings dialog box. See the topic “Document Settings for Fields Tab”
on page 22 for more information.
v XML text. Use to specify the XML tags that contain the text to be extracted. All other tags are ignored.
If you select this option, you must click the Settings button and explicitly specify the XML elements
containing the text to be read during the extraction process in the XML Text Formatting area of the
Document Settings dialog box. See the topic “Document Settings for Fields Tab” on page 22 for more
information.
Textual unity. This option is available only if you specified that the text field represents Pathnames to
documents and selected Full text as the document type. Select the extraction mode from the following:
v Document mode. Use for documents that are short and semantically homogenous, such as articles
from news agencies.
v Paragraph mode. Use for Web pages and nontagged documents. The extraction process semantically
divides the documents, taking advantage of characteristics such as internal tags and syntax. If this
mode is selected, scoring is applied paragraph by paragraph. Therefore, for example, the rule apple &
orange is true only if apple and orange are found in the same paragraph.
Paragraph mode settings. This option is available only if you specified that the text field represents
Pathnames to documents and set the textual unity option to Paragraph mode. Specify the character
thresholds to be used in any extraction. The actual size is rounded up or down to the nearest period. To
ensure that the word associations produced from the text of the document collection are representative,
avoid specifying an extraction size that is too small.
v Minimum. Specify the minimum number of characters to be used in any extraction.
v Maximum. Specify the maximum number of characters to be used in any extraction.
Input encoding. This option is available only if you indicated that the text field represents Pathnames to
documents. It specifies the default text encoding. For all languages except Japanese, a conversion is done
from the specified or recognized encoding to ISO-8859-1. So even if you specify another encoding, the
extraction engine will convert it to ISO-8859-1 before it is processed. Any characters that do not fit into
the ISO-8859-1 encoding definition will be converted to spaces. For Japanese text, you can choose one of
several encoding options: SHIFT_JIS, EUC_JP, UTF-8, or ISO-2022-JP.
Copy resources from. When mining text, the extraction is based not only on the settings in the Expert tab
but also on the linguistic resources. These resources serve as the basis for how to handle and process the
text during extraction to get the concepts, types, and TLA patterns. You can copy resources into this node
from a resource template.
48
IBM SPSS Modeler Text Analytics 16 User's Guide
A resource template is a predefined set of libraries and advanced linguistic and nonlinguistic resources
that have been fine-tuned for a particular domain or usage. These resources serve as the basis for how to
handle and process data during extraction. Click Load and selecting the template from which to copy
your resources.
Templates are loaded when you select them and not when the stream is executed. At the moment that
you load, a copy of the resources is stored into the node. Therefore, if you ever wanted to use an updated
template, you would have to reload it here. See the topic “Copying Resources From Templates and TAPs”
on page 26 for more information.
Text language. Identifies the language of the text being mined. The resources copied in the node control
the language options presented. You can select the language for which the resources were tuned or
choose the ALL option. We highly recommend that you specify the exact language for the text data;
however, if you are unsure, you can choose the ALL option. ALL is unavailable for Japanese text. This
ALL option lengthens execution time since automatic language recognition is used to scan all documents
and records in order to identify the text language first. With this option, all records or documents that are
in a supported and licensed language are read by the extraction engine using the language-appropriate
internal dictionaries. See the topic “Language Identifier” on page 202 for more information. Contact your
sales representative if you are interested in purchasing a license for a supported language for which you
do not currently have access.
Text Link Analysis Node: Model Tab
The Model tab contains a single option that affects the speed and accuracy of the extraction process.
Optimize for speed of scoring. Selected by default, this option ensures that the model created is compact
and scores at high speed. Deselecting this option creates a model which scores more slowly but which
ensures complete concept-type consistency, that is, it ensures that a given concept is never assigned more
than one Type.
Text Link Analysis Node: Expert Tab
In this node, the extraction of text link analysis (TLA) pattern results is automatically enabled. The Expert
tab contains certain additional parameters that impact how text is extracted and handled. The parameters
in this dialog box control the basic behavior, as well as a few advanced behaviors, of the extraction
process. There are also a number of linguistic resources and options that also impact the extraction
results, which are controlled by the resource template you select.
For Dutch, English, French, German, Italian, Portuguese, and Spanish Text
Accommodate punctuation errors. This option temporarily normalizes text containing punctuation errors
(for example, improper usage) during extraction to improve the extractability of concepts. This option is
extremely useful when text is short and of poor quality (as, for example, in open-ended survey responses,
e-mail, and CRM data), or when the text contains many abbreviations.
Accommodate spelling errors for a minimum root character limit of [n]. This option applies a fuzzy
grouping technique that helps group commonly misspelled words or closely spelled words under one
concept. The fuzzy grouping algorithm temporarily strips all vowels (except the first one) and strips
double/triple consonants from extracted words and then compares them to see if they are the same so
that modeling and modelling would be grouped together. However, if each term is assigned to a different
type, excluding the <Unknown> type, the fuzzy grouping technique will not be applied.
You can also define the minimum number of root characters required before fuzzy grouping is used. The
number of root characters in a term is calculated by totaling all of the characters and subtracting any
characters that form inflection suffixes and, in the case of compound-word terms, determiners and
prepositions. For example, the term exercises would be counted as 8 root characters in the form
“exercise,” since the letter s at the end of the word is an inflection (plural form). Similarly, apple sauce
Chapter 4. Mining for Text Links
49
counts as 10 root characters (“apple sauce”) and manufacturing of cars counts as 16 root characters
(“manufacturing car”). This method of counting is only used to check whether the fuzzy grouping should
be applied but does not influence how the words are matched.
Note: If you find that certain words are later grouped incorrectly, you can exclude word pairs from this
technique by explicitly declaring them in the Fuzzy Grouping: Exceptions section in the Advanced
Resources tab. See the topic “Fuzzy Grouping” on page 196 for more information.
Extract uniterms. This option extracts single words (uniterms) as long as the word is not already part of a
compound word and if it is either a noun or an unrecognized part of speech.
Extract nonlinguistic entities. This option extracts nonlinguistic entities, such as phone numbers, social
security numbers, times, dates, currencies, digits, percentages, e-mail addresses, and HTTP addresses. You
can include or exclude certain types of nonlinguistic entities in the Nonlinguistic Entities: Configuration
section of the Advanced Resources tab. By disabling any unnecessary entities, the extraction engine won't
waste processing time. See the topic “Configuration” on page 200 for more information.
Uppercase algorithm. This option extracts simple and compound terms that are not in the built-in
dictionaries as long as the first letter of the term is in uppercase. This option offers a good way to extract
most proper nouns.
Group partial and full person names together when possible. This option groups names that appear
differently in the text together. This feature is helpful since names are often referred to in their full form
at the beginning of the text and then only by a shorter version. This option attempts to match any
uniterm with the <Unknown> type to the last word of any of the compound terms that is typed as
<Person>. For example, if doe is found and initially typed as <Unknown>, the extraction engine checks to
see if any compound terms in the <Person> type include doe as the last word, such as john doe. This
option does not apply to first names since most are never extracted as uniterms.
Maximum nonfunction word permutation. This option specifies the maximum number of nonfunction
words that can be present when applying the permutation technique. This permutation technique groups
similar phrases that differ from each other only by the nonfunction words (for example, of and the)
contained, regardless of inflection. For example, let's say that you set this value to at most two words and
both company officials and officials of the company were extracted. In this case, both extracted terms
would be grouped together in the final concept list since both terms are deemed to be the same when of
the is ignored.
For Japanese Text
With Japanese text, you can choose which secondary analyzer to apply.
Note: Japanese text extraction is available in IBM SPSS Modeler Premium.
Secondary Analysis. When an extraction is launched, basic keyword extraction takes place using the
default set of types. However, when you select a secondary analyzer, you can obtain many more or richer
concepts since the extractor will now include particles and auxiliary verbs as part of the concept. In the
case of sentiment analysis, a large number of additional types are also included. Furthermore, choosing a
secondary analyzer allows you to also generate text link analysis results.
Note: When a secondary analyzer is called, the extraction process takes longer to complete.
v Dependency analysis. Choosing this option yields extended particles for the extraction concepts from
the basic type and keyword extraction. You can also obtain the richer pattern results from dependency
text link analysis (TLA).
v Sentiment analysis. Choosing this analyzer yields additional extracted concepts and, whenever
applicable, the extraction of TLA pattern results. In addition to the basic types, you also benefit from
50
IBM SPSS Modeler Text Analytics 16 User's Guide
more than 80 sentiment types. These types are used to uncover concepts and patterns in the text
through the expression of emotion, sentiments, and opinions. There are three options that dictate the
focus for the sentiment analysis: All sentiments, Representative sentiment only, and Conclusions
only.
TLA Node Output
After running the Text Link Analysis node, the data are restructured. It is important to understand the
way that text mining restructures your data. If you desire a different structure for data mining, you can
use nodes on the Field Operations palette to accomplish this. For example, if you were working with data
in which each row represented a text record, then one row is created for each pattern uncovered in the
source text data. For each row in the output, there are 15 fields:
v Six fields (Concept#, such as Concept1, Concept2, ..., and Concept6) represent any concepts found in
the pattern match.
v Six fields (Type#, such as Type1, Type2, ..., and Type6) represent the type for each concept.
v Rule Name represents the name of the text link rule used to match the text and produce the output.
v A field using the name of the ID field you specified in the node and representing the record or
document ID as it was in the input data
v Matched Text represents the portion of the text data in the original record or document that was
matched to the TLA pattern.
Note: Text link analysis pattern rules for Japanese text only produce one or two slot pattern results.
Note: Any preexisting streams containing a Text Link Analysis node from a release prior to 5.0 may not be
fully executable until you update the nodes. Certain improvements in later versions of IBM SPSS Modeler
require older nodes to be replaced with the newer versions, which are both more deployable and more
powerful.
It is also possible to perform an automatic translation of certain languages. This feature enables you to
mine documents in a language you may not speak or read. If you want to use the translation feature, you
must have access to the SDL Software as a Service (SaaS). See the topic “Translation Settings” on page 56
for more information.
Caching TLA Results
If you cache, the text link analysis results are in the stream. To avoid repeating the extraction of text link
analysis results each time the stream is executed, select the Text Link Analysis node and from the menus
choose, Edit > Node > Cache > Enable. The next time the stream is executed, the output is cached in the
node. The node icon displays a tiny "document" graphic that changes from white to green when the
cache is filled. The cache is preserved for the duration of the session. To preserve the cache for another
day (after the stream is closed and reopened), select the node and from the menus choose, Edit > Node >
Cache > Save Cache. The next time you open the stream, you can reload the saved cache rather than
running the translation again.
Alternatively, you can save or enable a node cache by right-clicking the node and choosing Cache from
the context menu.
Using the Text Link Analysis Node in a Stream
The Text Link Analysis node is used to access data and extract concepts in a stream. You can use any
source node to access data.
Example: Statistics File node with the Text Link Analysis node
Chapter 4. Mining for Text Links
51
The following example shows how to use the Text Link Analysis node.
Figure 15. Example: Statistics File node with the Text Link Analysis node
1. Statistics File node (Data tab). First, we added this node to the stream to specify where the text is
stored.
Figure 16. Statistics File node dialog box: Data tab
2. Text Link Analysis node (Fields tab). Next, we attached this node to the stream to extract concepts
for downstream modeling or viewing. We specified the ID field and the text field name containing the
data, as well as other settings.
52
IBM SPSS Modeler Text Analytics 16 User's Guide
Figure 17. Text Link Analysis node dialog box: Fields tab
3. Table node. Finally, we attached a Table node to view the concepts that were extracted from our text
documents. In the table output shown, you can see the TLA pattern results found in the data after
this stream was executed with a Text Link Analysis node. Some results show only one concept/type
was matched. In others, the results are more complex and contain several types and concepts.
Additionally, as a result of running data through the Text Link Analysis node and extracting concepts,
several aspects of the data are changed. The original data in our example contained 8 fields and 405
records. After executing the Text Link Analysis node, there are now 15 fields and 640 records. There is
now one row for each TLA pattern result found. For example, ID 7 became three rows from the
original because three TLA pattern results were extracted. You can use a Merge node if you want to
merge this output data back into your original data.
Chapter 4. Mining for Text Links
53
54
IBM SPSS Modeler Text Analytics 16 User's Guide
Figure 18. Table output node
Chapter 5. Translating Text for Extraction
Translate Node
The Translate node can be used to translate text from supported languages, such as Arabic, Chinese, and
Persian, into English for analysis using IBM SPSS Modeler Text Analytics. This makes it possible to mine
documents in double-byte languages that would not otherwise be supported and allows analysts to
extract concepts from foreign-language documents even if they are unable to comprehend the language in
question. Note that you must be able to connect to SDL's Software as a Service (SaaS) to be able to use
the Translate node.
When mining text in any of these languages, simply add a Translate node prior to the Text Mining
modeling node in your stream. You can also enable caching in the Translate node to avoid repeating the
translation each time the stream is executed.
You can find this node on the IBM SPSS Modeler Text Analytics tab of nodes palette at the bottom of the
IBM SPSS Modeler window. See the topic “IBM SPSS Modeler Text Analytics Nodes” on page 8 for more
information.
Caching the translation. If you cache the translation, the translated text is stored in the stream rather
than in external files. To avoid repeating the translation each time the stream is executed, select the
Translate node and from the menus choose, Edit > Node > Cache > Enable. The next time the stream is
executed, the output from the translation is cached in the node. The node icon displays a tiny "document"
graphic that changes from white to green when the cache is filled. The cache is preserved for the duration
of the session. To preserve the cache for another day (after the stream is closed and reopened), select the
node and from the menus choose, Edit > Node > Cache > Save Cache. The next time you open the
stream, you can reload the saved cache rather than running the translation again.
Alternatively, you can save or enable a node cache by right-clicking the node and choosing Cache from
the context menu.
Important! If you are trying to retrieve information over the web through a proxy server, you must
enable the proxy server in the net.properties file for both the IBM SPSS Modeler Text Analytics Client
and Server. Follow the instructions detailed inside this file. This applies when accessing the web through
the Web Feed node or retrieving an SDL Software as a Service (SaaS) license since these connections go
through Java. This file is located in C:\Program Files\IBM\SPSS\Modeler\16\jre\lib\net.properties by
default.
55
Translate Node: Translation Tab
Text field. Select the field containing the text to be mined, the document pathname, or the directory
pathname to documents. This field depends on the data source. You can specify any string field, even
those with Direction=None or Type=Typeless.
Text field represents. Indicate what the text field specified in the preceding setting contains. Choices are:
v Actual text. Select this option if the field contains the exact text from which concepts should be
extracted.
v Pathnames to documents. Select this option if the field contains one or more pathnames to where
external documents, which contain the text for extraction, reside. For example, if a File List node is
used to read in a list of documents, this option should be selected. See the topic “File List Node” on
page 11 for more information.
Input encoding. Select the encoding of the source text. You can begin by selecting the Automatic option
but if you notice that some files are not being processed properly, we recommend that you select the
actual encoding from the list here. The Automatic option may incorrectly identify the encoding when
dealing with short text such as short database records. The text output from this node is encoded as
UTF-8.
Settings. Specifies the translation settings for the stream.
v Language pair connection. Select the language pair you want to use; available language pairs are
automatically displayed in this list after you set up the link to the SDL service in the Translation
Settings dialog. See the topic “Translation Settings” for more information.
v Translation accuracy. Specify the desired accuracy by choosing a value of 1 to 3 indicating the level of
speed versus accuracy you want. A lower value produces faster translation results but with diminished
accuracy. A higher value produces results with greater accuracy but increased processing time. To
optimize time, we recommend beginning with a lower level and increasing it only if you feel you need
more accuracy after reviewing the results.
v Use custom dictionary. If you have previously created custom dictionaries, held by SDL, you can use
them in connection with the translation. To choose a custom dictionary, select the Use custom
dictionary checkbox and enter the Dictionary name. To use more than one dictionary, separate the
names with a comma.
v Save and reuse previously translated text when possible. Specifies that the translation results should
be saved and if the same number of records/documents are present the next time the stream is
executed, the content is assumed to be the same and the translation results are reused to save
processing time. If this option is selected at run time and the number of records does not match what
was saved last time, the text is fully translated and then saved under the label name for the next
execution. This option is available only if you selected an SDL translation language.
Note: If the text is stored in the stream, you can also enable caching in a Translate node. In this case,
not only is the translation results reused but anything upstream is also ignored whenever the cache is
available.
v Label. If you select Save and reuse previously translated text when possible, you must specify a label
name for the results. This label is used to identify the previously translated text. If no label is specified,
a warning will be added to the Stream Properties when you execute the stream and no reuse will be
possible.
Translation Settings
In this dialog box, you can define and manage the SDL Software as a Service (SaaS) translation
connection that you can reuse anytime you translate. Once you define a connection here, you can quickly
choose a language pair connection at translation time without having to reenter all of the connection
settings.
56
IBM SPSS Modeler Text Analytics 16 User's Guide
A language pair connection identifies the source and translation languages as well as the URL connection
details to the server. For example, Chinese - English means that the source text is in Chinese and the
resulting translation will be in English. You have to manually define each connection that you will access
through the SDL online services.
Important! If you are trying to retrieve information over the web through a proxy server, you must
enable the proxy server in the net.properties file for both the IBM SPSS Modeler Text Analytics Client
and Server. Follow the instructions detailed inside this file. This applies when accessing the web through
the Web Feed node or retrieving an SDL Software as a Service (SaaS) license since these connections go
through Java. This file is located in C:\Program Files\IBM\SPSS\Modeler\16\jre\lib\net.properties by
default.
Connection URL. Enter the URL for the SDL Software as a Service connection.
User ID. Enter the unique ID provided to you by SDL.
API Key. Enter the key provided to you by SDL.
Test. Click Test to verify that the connection is properly configured and to see the language pair(s) that
are found on that connection.
Using the Translate Node
To extract concepts from supported translation languages, such as Arabic, Chinese, or Persian, add a
Translate node prior to any Text Mining node in your stream.
If the text to be translated is contained in one or more external files, a File List node can be used to read
in a list of names. In this case, the Translate node would be added between the File List node and any
subsequent text mining nodes, and the output would be the location where the translated text resides.
Chapter 5. Translating Text for Extraction
57
58
IBM SPSS Modeler Text Analytics 16 User's Guide
Chapter 6. Browsing External Source Text
File Viewer Node
When you are mining a collection of documents, you can specify the full path names of files directly into
your Text Mining modeling and Translate nodes. However, when outputting to a Table node, you will
only see the full path name of a document rather than the text within it. The File Viewer node can be
used as an analog of the Table node and it enables you to access the actual text within each of the
documents without having to merge them all together into a single file.
The File Viewer node can help you better understand the results from text extraction by providing you
access to the source, or untranslated, text from which concepts were extracted since it is otherwise
inaccessible in the stream. This node is added to the stream after a File List node to obtain a list of links
to all the files.
The result of this node is a window showing all of the document elements that were read and used to
extract concepts. From this window, you can click a toolbar icon to launch the report in an external
browser listing document names as hyperlinks. You can click a link to open the corresponding document
in the collection. See the topic “Using the File Viewer Node” for more information.
You can find this node on the IBM SPSS Modeler Text Analytics tab of nodes palette at the bottom of the
IBM SPSS Modeler window. See the topic “IBM SPSS Modeler Text Analytics Nodes” on page 8 for more
information.
Note: When you are working in client-server mode and File Viewer nodes are part of the stream,
document collections must be stored in a Web server directory on the server. Since the Text Mining
output node produces a list of documents stored in the Web server directory, the Web server's security
settings manage the permissions to these documents.
File Viewer Node Settings
You can specify the following settings for the File Viewer node.
Document field. Select the field from your data that contains the full name and path of the documents to
be displayed.
Title for generated HTML page. Create a title to appear at the top of the page that contains the list of
documents.
Using the File Viewer Node
The following example shows how to use the File Viewer node.
Example: File List node and a File Viewer node
Figure 19. Stream illustrating the use of a File Viewer node
1. File List node (Settings tab). First, we added this node to specify where the documents are located.
© Copyright IBM Corporation 2003, 2013
59
Figure 20. File List node dialog box: Settings tab
2. File Viewer node (Settings tab). Next, we attached the File Viewer node to produce an HTML list of
documents.
Figure 21. File Viewer node dialog box: Settings tab
3. File Viewer Output dialog. Next, we executed the stream which outputs the list of documents in a
new window.
60
IBM SPSS Modeler Text Analytics 16 User's Guide
Figure 22. File Viewer Output
4. To see the documents, we clicked the toolbar button showing a globe with a red arrow. This opened a
list of document hyperlinks in our browser.
Chapter 6. Browsing External Source Text
61
62
IBM SPSS Modeler Text Analytics 16 User's Guide
Chapter 7. Node Properties for Scripting
IBM SPSS Modeler has a scripting language to allow you to execute streams from the command line.
Here, you can learn about the node properties that are specific to each of the nodes delivered with IBM
SPSS Modeler Text Analytics. For more information on the standard set of nodes delivered with IBM
SPSS Modeler, please refer to the Scripting and Automation Guide.
File List Node: filelistnode
You can use the properties in the following table for scripting. The node itself is called filelistnode.
Table 7. File List node scripting properties
Scripting properties
Data type
path
string
recurse
flag
word_processing
flag
excel_file
flag
powerpoint_file
flag
text_file
flag
web_page
flag
xml_file
flag
pdf_file
flag
no_extension
flag
Note: 'Create list' parameter is no longer available and any scripts containing that option will be
automatically converted into a 'Files' output.
Web Feed Node: webfeednode
You can use the properties in the following table for scripting. The node itself is called webfeednode.
Table 8. Web Feed node scripting properties
Scripting properties
Data type
Property description
urls
string1 string2 ...stringn
Each URL is specified in the list structure. URL list
separated by “\n”
recent_entries
flag
limit_entries
integer
Number of most recent entries to read per URL.
use_previous
flag
To save and reuse Web feed cache.
use_previous_label
string
Name for the saved Web cache.
start_record
string
Non-RSS start tag.
url n .title
string
For each URL in the list, you must define one here too.
The first one will be url1.title, where the number
matches its position in the URL list. This is the start tag
containing the title of the content.
url n .short_description
string
Same as for url n .title.
url n .description
string
Same as for url n .title.
63
Table 8. Web Feed node scripting properties (continued)
Scripting properties
Data type
Property description
url n .authors
string
Same as for url n .title.
url n .contributors
string
Same as for url n .title.
url n .published_date
string
Same as for url n .title.
url n .modified_date
string
Same as for url n .title.
html_alg
None
HTMLCleaner
Content filtering method.
discard_lines
flag
Discard short lines. Used with min_words
min_words
integer
Minimum number of words.
discard_words
flag
Discard short lines. Used with min_avg_len
min_avg_len
integer
discard_scw
flag
Discard lines with many single character words. Used
with max_scw
max_scw
integer
Maximum proportion 0-100 percentage of single
characters words in a line
discard_tags
flag
Discard lines containing certain tags.
tags
string
Special characters must be escaped with a backslash
character \.
discard_spec_words
flag
Discard lines containing specific strings
words
string
Special characters must be escaped with a backslash
character \.
Text Mining Node: TextMiningWorkbench
You can use the following parameters to define or update a node through scripting. The node itself is
called TextMiningWorkbench.
Important! It is not possible to specify a different resource template via scripting. If you think you need a
template, you must select it in the node dialog box.
Table 9. Text Mining modeling node scripting properties
Scripting properties
Data type
text
field
method
ReadText
ReadPath
docType
integer
With possible values (0,1,2) where 0 = Full Text,
1 = Structured Text, and 2 = XML
encoding
Automatic
"UTF-8"
"UTF-16"
"ISO-8859-1"
"US-ASCII"
"CP850"
"EUC-JP"
"SHIFT-JIS"
"ISO2022-JP"
Note that values with special characters, such as
"UTF-8", should be quoted to avoid confusion
with a mathematical operator.
unity
integer
With possible values (0,1) where 0 = Paragraph
and 1 = Document
64
IBM SPSS Modeler Text Analytics 16 User's Guide
Property description
Table 9. Text Mining modeling node scripting properties (continued)
Scripting properties
Data type
Property description
para_min
integer
para_max
integer
mtag
string
Contains all the mtag settings (from Settings
dialog box for XML files)
mclef
string
Contains all the mclef settings (from Settings
dialog box for Structured Text files)
partition
field
custom_field
flag
use_model_name
flag
model_name
string
use_partitioned_data
flag
If a partition field is defined, only the training
data are used for model building.
model_output_type
Interactive
Model
Interactive results in a category model. Model
results in a concept model.
use_interactive_info
flag
For building interactively in a workbench session
only.
reuse_extraction_results
flag
For building interactively in a workbench session
only.
interactive_view
Categories
TLA
Clusters
For building interactively in a workbench session
only.
extract_top
integer
This parameter is used when model_type =
Concept
use_check_top
flag
check_top
integer
use_uncheck_top
flag
uncheck_top
integer
language
de
en
es
fr
it
ja
nl
pt
frequency_limit
integer
Deprecated in 14.0.
concept_count_limit
integer
Limit extraction to concepts with a global
frequency of at least this value. Unavailable for
Japanese text
fix_punctuation
flag
Unavailable for Japanese text
fix_spelling
flag
Unavailable for Japanese text
spelling_limit
integer
Unavailable for Japanese text
extract_uniterm
flag
Unavailable for Japanese text
Indicates whether or not a partition field will be
specified.
Chapter 7. Node Properties for Scripting
65
Table 9. Text Mining modeling node scripting properties (continued)
Scripting properties
Data type
Property description
extract_nonlinguistic
flag
Unavailable for Japanese text
upper_case
flag
Unavailable for Japanese text
group_names
flag
Unavailable for Japanese text
permutation
integer
Maximum nonfunction word permutation (the
default is 3). Unavailable for Japanese text.
jp_algorithmset conclusions only
Representative only All Sentiments
0
1
2
For Japanese text extraction only.
0
1
2
For Japanese text extraction only.
jp_algorithm_sense_mode
Note: Available in IBM SPSS Modeler Premium.
0 = Sentiment secondary extraction
1 = Dependency extraction
2 = No secondary analyzer set.
Note: Available in IBM SPSS Modeler Premium.
0 = Conclusions only
2 = Representative only
3 = All sentiments.
Text Mining Model Nugget: TMWBModelApplier
You can use the properties in the following table for scripting. The nugget itself is called
TMWBModelApplier.
Table 10. Text Mining Model Nugget Properties
Scripting properties
Data type
scoring_mode
Fields
Records
field_values
Flags
Counts
This option is not available in the Category model
nugget. For Flags, set to TRUE or FALSE
true_value
string
With Flags, define the value for true.
false_value
string
With Flags, define the value for false.
extension_concept
string
Specify an extension for the field name. Field
names are generated by using the concept name
plus this extension. Specify where to put this
extension using the add_as value.
extension_category
string
Field name extension. You can choose to specify
an extension prefix/suffix for the field name or
you can choose to use the category codes. Field
names are generated by using the category name
plus this extension. Specify where to put this
extension using the add_as value.
add_as
Suffix
Prefix
fix_punctuation
flag
66
IBM SPSS Modeler Text Analytics 16 User's Guide
Property description
Table 10. Text Mining Model Nugget Properties (continued)
Scripting properties
Data type
Property description
excluded_subcategories_descriptors
RollUpToParent
Ignore
For category models only. If a subcategory is
unselected. This option allows you to specify how
the descriptors belonging to subcategories that
were not selected for scoring will be handled.
There are two options.
v Ignore. The option Exclude its descriptors
completely from scoring will cause the
descriptors of subcategories that do not have
checkmarks (unselected) to be ignored and
unused during scoring.
v RollUpToParent. The option Aggregate
descriptors with those in parent category will
cause the descriptors of subcategories that do
not have checkmarks (unselected) to be used as
descriptors for the parent category (the category
above this subcategory). If several levels of
subcategories and unselected, the descriptors
will be rolled up under the first available
parent category
check_model
flag
Deprecated in version 14
text
field
method
ReadText
ReadPath
docType
integer
With possible values (0,1,2) where 0 = Full Text,
1 = Structured Text, and 2 = XML
encoding
Automatic
"UTF-8"
"UTF-16"
"ISO-8859-1"
"US-ASCII"
"CP850"
"EUC-JP"
"SHIFT-JIS"
"ISO2022-JP"
Note that values with special characters, such as
"UTF-8", should be quoted to avoid confusion
with a mathematical operator.
language
de
en
es
fr
it
ja
nl
pt
Text Link Analysis Node: textlinkanalysis
You can use the parameters in the following table to define or update a node through scripting. The node
itself is called textlinkanalysis.
Important! It is not possible to specify a resource template via scripting. To select a template, you must
do so from within the node dialog box.
Chapter 7. Node Properties for Scripting
67
Table 11. Text Link Analysis (TLA) node scripting properties
Scripting properties
Data type
id_field
field
text
field
method
ReadText
ReadPath
docType
integer
With possible values (0,1,2) where 0 = Full Text, 1
= Structured Text, and 2 = XML
encoding
Automatic
"UTF-8"
"UTF-16"
"ISO-8859-1"
"US-ASCII"
"CP850"
"EUC-JP"
"SHIFT-JIS"
"ISO2022-JP"
Note that values with special characters, such as
"UTF-8", should be quoted to avoid confusion with
a mathematical operator.
unity
integer
With possible values (0,1) where 0 = Paragraph
and 1 = Document
para_min
integer
para_max
integer
mtag
string
Contains all the mtag settings (from Settings
dialog box for XML files)
mclef
string
Contains all the mclef settings (from Settings
dialog box for Structured Text files)
language
de
en
es
fr
it
ja
nl
pt
concept_count_limit
integer
Limit extraction to concepts with a global
frequency of at least this value. Unavailable for
Japanese text
fix_punctuation
flag
Unavailable for Japanese text
fix_spelling
flag
Unavailable for Japanese text
spelling_limit
integer
Unavailable for Japanese text
extract_uniterm
flag
Unavailable for Japanese text
extract_nonlinguistic
flag
Unavailable for Japanese text
upper_case
flag
Unavailable for Japanese text
group_names
flag
Unavailable for Japanese text
permutation
integer
Maximum nonfunction word permutation (the
default is 3). Unavailable for Japanese text.
jp_algorithmset conclusions only
Representative only All Sentiments
0
1
2
For Japanese text extraction only.
68
IBM SPSS Modeler Text Analytics 16 User's Guide
Property description
Note: Available in IBM SPSS Modeler Premium.
0 = Sentiment secondary extraction
1 = Dependency extraction
2 = No secondary analyzer set.
Table 11. Text Link Analysis (TLA) node scripting properties (continued)
Scripting properties
Data type
Property description
jp_algorithm_sense_mode
0
1
2
For Japanese text extraction only.
Note: Available in IBM SPSS Modeler Premium.
0 = Conclusions only
2 = Representative only
3 = All sentiments.
Translate Node: translatenode
You can use the properties in the following table for scripting. The node itself is called translatenode.
Table 12. Translate node properties
Scripting properties
Data type
text
field
method
ReadText
ReadPath
encoding
Automatic
"Big5", "Big5-HKSCS" ,
"UTF-8", "UTF-16",
"US-ASCII", "Latin1",
"CP850", "CP874",
"CP1250", "CP1251",
"CP1252", "CP1253",
"CP1254","CP1255",
"CP1256","CP1257",
"CP1258","GB18030",
"GB2312","GBK",
"eucJP","JIS7",
“SHIFT_JIS”, "eucKR","TSCII",
"ucs2","KOI8-R",
"KOI8-U","ISO8859-1",
"ISO8859-2","ISO8859-3",
"ISO8859-4","ISO8859-5",
"ISO8859-6","ISO8859-7",
"ISO8859-8", "ISO8859-8-i",
"ISO8859-9","ISO8859-10",
"ISO8859-13","ISO8859-14",
"ISO8859-15","IBM 850",
"IBM 866","Apple Roman",
"TIS-620"
lw_server_type
LOC
WAN
HTTP
lw_hostname
string
lw_port
integer
url
string
apiKey
string
user_id
string
lpid
integer
Property description
Note that values with special characters,
such as "UTF-8", should be quoted to avoid
confusion with a mathematical operator
url of the translation server
Not used if language_from or
language_from_id is set.
Chapter 7. Node Properties for Scripting
69
Table 12. Translate node properties (continued)
Scripting properties
Data type
translate_from
Arabic, Chinese,
Traditional Chinese, Czech,
Danish,Dutch,
English,French,
German, Greek,
Hindi, Hungarian,
Italian, Japanese,
Korean, Persian,
Polish, Portuguese,
Romanian, Russian,
Spanish, Somali,
Swedish
translate_from_id
ara,
cht,
dan,
eng,
ger,
hin,
ita,
kor,
pol,
rum,
som,
swe
translate_to
English
translate_to_id
eng
translation_accuracy
integer
Specifies the accuracy level you desire for
the translation process—choose a value of 1
to 3
use_previous_translation
flag
Specifies that the translation results already
exist from a previous execution and can be
reused
translation_label
string
Enter a label to identify the translation
results for reuse
70
Property description
chi,
cze,
dut,
fra,
gre,
hun,
jpn,
per,
por,
rus,
spa,
IBM SPSS Modeler Text Analytics 16 User's Guide
Chapter 8. Interactive Workbench Mode
From a text mining modeling node, you can choose to launch an interactive workbench session during
stream execution. In this workbench, you can extract key concepts from your text data, build categories,
and explore text link analysis patterns and clusters, and generate category models. In this chapter, we
discuss the workbench interface from a high-level perspective along with the major elements with which
you will work, including:
v Extraction results. After an extraction is performed, these are the key words and phrases identified and
extracted from your text data, also referred to as concepts. These concepts are grouped into types. Using
these concepts and types, you can explore your data as well as create your categories. These are
managed in the Categories and Concepts view.
v Categories. Using descriptors (such as extraction results, patterns, and rules) as a definition, you can
manually or automatically create a set of categories to which documents and records are assigned
based on whether or not they contain a part of the category definition. These are managed in the
Categories and Concepts view.
v Clusters. Clusters are a grouping of concepts between which links have been discovered that indicate a
relationship among them. The concepts are grouped using a complex algorithm that uses, among other
factors, how often two concepts appear together compared to how often they appear separately. These
are managed in the Clusters view. You can also add the concepts that make up a cluster to categories.
v Text link analysis patterns. If you have text link analysis (TLA) pattern rules in your linguistic
resources or are using a resource template that already has some TLA rules, you can extract patterns
from your text data. These patterns can help you uncover interesting relationships between concepts in
your data. You can also use these patterns as descriptors in your categories. These are managed in the
Text Link Analysis view. For Japanese text, you must select a secondary analyzer and turn on TLA
extraction. Note: Japanese text extraction is available in IBM SPSS Modeler Premium.
v Linguistic resources. The extraction process relies on a set of parameters and linguistic definitions to
govern how text is extracted and handled. These are managed in the form of templates and libraries in
the Resource Editor view.
The Categories and Concepts View
The application interface is made up of several views. The Categories and Concepts view is the window
in which you can create and explore categories as well as explore and tweak the extraction results.
Categories refers to a group of closely related ideas and patterns to which documents and records are
assigned through a scoring process. While concepts refer to the most basic level of extraction results
available to use as building blocks, called descriptors, for your categories.
71
Figure 23. Categories and Concepts view
The Categories and Concepts view is organized into four panes, each of which can be hidden or shown
by selecting its name from the View menu. See the topic Chapter 10, “Categorizing Text Data,” on page
99 for more information.
Categories Pane
Located in the upper left corner, this area presents a table in which you can manage any categories you
build. After extracting the concepts and types from your text data, you can begin building categories by
using techniques such as semantic networks and concept inclusion, or by creating them manually. If you
double-click a category name, the Category Definitions dialog box opens and displays all of the
descriptors that make up its definition, such as concepts, types, and rules. See the topic Chapter 10,
“Categorizing Text Data,” on page 99 for more information. Not all automatic techniques are available for
all languages.
When you select a row in the pane, you can then display information about corresponding
documents/records or descriptors in the Data and Visualization panes.
Extraction Results Pane
Located in the lower left corner, this area presents the extraction results. When you run an extraction, the
extraction engine reads through the text data, identifies the relevant concepts, and assigns a type to each.
Concepts are words or phrases extracted from your text data. Types are semantic groupings of concepts
72
IBM SPSS Modeler Text Analytics 16 User's Guide
stored in the form of type dictionaries. When the extraction is complete, concepts and types appear with
color coding in the Extraction Results pane. See the topic “Extraction Results: Concepts and Types” on
page 85 for more information.
You can see the set of underlying terms for a concept by hovering your mouse over the concept name.
Doing so will display a tooltip showing the concept name and up to several lines of terms that are
grouped under that concept. These underlying terms include the synonyms defined in the linguistic
resources (regardless of whether they were found in the text or not) as well as the any extracted
plural/singular terms, permuted terms, terms from fuzzy grouping, and so on. You can copy these terms
or see the full set of underlying terms by right-clicking the concept name and choosing the context menu
option.
Text mining is an iterative process in which extraction results are reviewed according to the context of the
text data, fine-tuned to produce new results, and then reevaluated. Extraction results can be refined by
modifying the linguistic resources. This fine-tuning can be done in part directly from the Extraction
Results or Data pane but also directly in the Resource Editor view. See the topic “The Resource Editor
View” on page 78 for more information.
Visualization Pane
Located in the upper right corner, this area presents multiple perspectives on the commonalities in
document/record categorization. Each graph or chart provides similar information but presents it in a
different manner or with a different level of detail. These charts and graphs can be used to analyze your
categorization results and aid in fine-tuning categories or reporting. For example, in a graph you might
uncover categories that are too similar (for example, they share more that 75% of their records) or too
distinct. The contents in a graph or chart correspond to the selection in the other panes. See the topic
“Category Graphs and Charts” on page 153 for more information.
Data Pane
The Data pane is located in the lower right corner. This pane presents a table containing the documents
or records corresponding to a selection in another area of the view. Depending on what is selected, only
the corresponding text appears in the Data pane. Once you make a selection, click a Display button to
populate the Data pane with the corresponding text.
If you have a selection in another pane, the corresponding documents or records show the concepts
highlighted in color to help you easily identify them in the text. You can also hover your mouse over
color-coded items to display a tooltip showing name of the concept under which it was extracted and the
type to which it was assigned. See the topic “The Data Pane” on page 107 for more information.
Searching and Finding in the Categories and Concepts view
In some cases, you may need to locate information quickly in a particular section. Using the Find toolbar,
you can enter the string you want to search for and define other search criteria such as case sensitivity or
search direction. Then you can choose the pane in which you want to search.
To use the Find feature
1. In the Categories and Concepts view, choose Edit > Find from the menus. The Find toolbar appears
above the Categories pane and Visualization panes.
2. Enter the word string that you want to search for in the text box. You can use the toolbar buttons to
control the case sensitivity, partial matching, and direction of the search.
3. In the toolbar, click the name of the pane in which you want to search. If a match is found, the text is
highlighted in the window.
4. To look for the next match, click the name of the pane again.
Chapter 8. Interactive Workbench Mode
73
The Clusters View
In the Clusters view, you can build and explore cluster results found in your text data. Clusters are
groupings of concepts generated by clustering algorithms based on how often concepts occur and how
often they appear together. The goal of clusters is to group concepts that co-occur together while the goal
of categories is to group documents or records based on how the text they contain matches the
descriptors (concepts, rules, patterns) for each category.
The more often the concepts within a cluster occur together coupled with the less frequently they occur
with other concepts, the better the cluster is at identifying interesting concept relationships. Two concepts
co-occur when they both appear (or one of their synonyms or terms appear) in the same document or
record. See the topic Chapter 11, “Analyzing Clusters,” on page 141 for more information.
You can build clusters and explore them in a set of charts and graphs that could help you uncover
relationships among concepts that would otherwise be too time-consuming to find. While you cannot add
entire clusters to your categories, you can add the concepts in a cluster to a category through the Cluster
Definitions dialog box. See the topic “Cluster Definitions” on page 145 for more information.
You can make changes to the settings for clustering to influence the results. See the topic “Building
Clusters” on page 142 for more information.
74
IBM SPSS Modeler Text Analytics 16 User's Guide
Figure 24. Clusters view
The Clusters view is organized into three panes, each of which can be hidden or shown by selecting its
name from the View menu. Typically, only the Clusters pane and the Visualization pane are visible.
Clusters Pane
Located on the left side, this pane presents the clusters that were discovered in the text data. You can
create clustering results by clicking the Build button. Clusters are formed by a clustering algorithm,
which attempts to identify concepts that occur together frequently.
Whenever a new extraction takes place, the cluster results are cleared, and you have to rebuild the
clusters to get the latest results. When building the clusters, you can change some settings, such as the
maximum number of clusters to create, the maximum number of concepts it can contain, or the
maximum number of links with external concepts it can have. See the topic “Exploring Clusters” on page
144 for more information.
Visualization Pane
Chapter 8. Interactive Workbench Mode
75
Located in the upper right corner, this pane offers two perspectives on clustering: a Concept Web graph
and a Cluster Web graph. If not visible, you can access this pane from the View menu (View >
Visualization). Depending on what is selected in the clusters pane, you can view the corresponding
interactions between or within clusters. The results are presented in multiple formats:
v Concept Web. Web graph showing all of the concepts within the selected cluster(s), as well as linked
concepts outside the cluster.
v Cluster Web. Web graph showing the links from the selected cluster(s) to other clusters, as well as any
links between those other clusters.
Note: In order to display a Cluster Web graph, you must have already built clusters with external links.
External links are links between concept pairs in separate clusters (a concept within one cluster and a
concept outside in another cluster). See the topic “Cluster Graphs” on page 154 for more information.
Data Pane
The Data pane is located in the lower right corner and is hidden by default. You cannot display any Data
pane results from the Clusters pane since these clusters span multiple documents/records, making the
data results uninteresting. However, you can see the data corresponding to a selection within the Cluster
Definitions dialog box. Depending on what is selected in that dialog box, only the corresponding text
appears in the Data pane. Once you make a selection, click the Display & button to populate the Data
pane with the documents or records that contain all of the concepts together.
The corresponding documents or records show the concepts highlighted in color to help you easily
identify them in the text. You can also hover your mouse over color-coded items to display the concept
under which it was extracted and the type to which it was assigned. The Data pane can contain multiple
columns but the text field column is always shown. It carries the name of the text field that was used
during extraction or a document name if the text data is in many different files. Other columns are
available. See the topic “The Data Pane” on page 107 for more information.
The Text Link Analysis View
In the Text Link Analysis view, you can build and explore text link analysis patterns found in your text
data. Text link analysis (TLA) is a pattern-matching technology that enables you to define TLA rules and
compare them to actual extracted concepts and relationships found in your text.
Patterns are most useful when you are attempting to discover relationships between concepts or opinions
about a particular subject. Some examples include wanting to extract opinions on products from survey
data, genomic relationships from within medical research papers, or relationships between people or
places from intelligence data.
Once you've extracted some TLA patterns, you can explore them in the Data or Visualization panes and
even add them to categories in the Categories and Concepts view. There must be some TLA rules defined
in the resource template or libraries you are using in order to extract TLA results. See the topic
Chapter 19, “About Text Link Rules,” on page 205 for more information.
If you chose to extract TLA pattern results, the results are presented in this view. If you have not chosen
to do so, you will have to use the Extract button and choose the option to enable the extraction of
patterns .
76
IBM SPSS Modeler Text Analytics 16 User's Guide
Figure 25. Text Link Analysis view
The Text Link Analysis view is organized into four panes, each of which can be hidden or shown by
selecting its name from the View menu. See the topic Chapter 12, “Exploring Text Link Analysis,” on
page 147 for more information.
Type and Concept Patterns Panes
Located on the left side, the Type and Concept Pattern panes are two interconnected panes in which you
can explore and select your TLA pattern results. Patterns are made up of a series of up to either six types
or six concepts. Please note that for Japanese text, the patterns are series of only up to either one or two
types or concepts. The TLA pattern rule as it is defined in the linguistic resources dictates the complexity
of the pattern results. See the topic Chapter 19, “About Text Link Rules,” on page 205 for more
information. Note: Japanese text extraction is available in IBM SPSS Modeler Premium.
Pattern results are first grouped at the type level and then divided into concept patterns. For this reason,
there are two different result panes: Type Patterns (upper left) and Concept Patterns (lower left).
v Type Patterns. The Type Patterns pane presents extracted patterns consisting of two or more related
types matching a TLA pattern rule. Type patterns are shown as <Organization> + <Location> +
<Positive>, which might provide positive feedback about an organization in a specific location.
v Concept Patterns. The Concept Patterns pane presents the extracted patterns at the concept level for all
of the type pattern(s) currently selected in the Type Patterns pane above it. Concept patterns follow a
structure such as hotel + paris + wonderful.
Chapter 8. Interactive Workbench Mode
77
Just as with the extraction results in the Categories and Concepts view, you can review the results here. If
you see any refinements you would like to make to the types and concepts that make up these patterns,
you make those in the Extraction Results pane in the Categories and Concepts view, or directly in the
Resource Editor, and reextract your patterns.
Visualization Pane
Located in the upper right corner of the Text Link Analysis view, this pane presents a web graph of the
selected patterns as either type patterns or concept patterns. If not visible, you can access this pane from
the View menu (View > Visualization). Depending on what is selected in the other panes, you can view
the corresponding interactions between documents/records and the patterns.
The results are presented in multiple formats:
v Concept Graph. This graph presents all the concepts in the selected pattern(s). The line width and
node sizes (if type icons are not shown) in a concept graph show the number of global occurrences in
the selected table.
v Type Graph. This graph presents all the types in the selected pattern(s). The line width and node sizes
(if type icons are not shown) in the graph show the number of global occurrences in the selected table.
Nodes are represented by either a type color or by an icon.
See the topic “Text Link Analysis Graphs” on page 156 for more information.
Data Pane
The Data pane is located in the lower right corner. This pane presents a table containing the documents
or records corresponding to a selection in another area of the view. Depending on what is selected, only
the corresponding text appears in the Data pane. Once you make a selection, click a Display button to
populate the Data pane with the corresponding text.
If you have a selection in another pane, the corresponding documents or records show the concepts
highlighted in color to help you easily identify them in the text. You can also hover your mouse over
color-coded items to display a tooltip showing name of the concept under which it was extracted and the
type to which it was assigned. See the topic “The Data Pane” on page 107 for more information.
The Resource Editor View
IBM SPSS Modeler Text Analytics rapidly and accurately captures key concepts from text data using a
robust extraction engine. This engine relies heavily on linguistic resources to dictate how large amounts
of unstructured, textual data should be analyzed and interpreted.
The Resource Editor view is where you can view and fine-tune the linguistic resources used to extract
concepts, group them under types, discover patterns in the text data, and much more. IBM SPSS Modeler
Text Analytics offers several preconfigured resource templates. Also, in some languages, you can also use
the resources in a text analysis packages. See the topic “Using Text Analysis Packages” on page 136 for
more information.
Since these resources may not always be perfectly adapted to the context of your data, you can create,
edit, and manage your own resources for a particular context or domain in the Resource Editor. See the
topic Chapter 16, “Working with Libraries,” on page 173 for more information.
To simplify the process of fine-tuning your linguistic resources, you can perform common dictionary
tasks directly from the Categories and Concepts view through context menus in the Extraction Results
and Data panes. See the topic “Refining Extraction Results” on page 93 for more information.
78
IBM SPSS Modeler Text Analytics 16 User's Guide
Note: The interface for resources tuned to Japanese text differs slightly. Japanese text extraction is
available in IBM SPSS Modeler Premium.
Figure 26. Resource Editor view
The operations that you perform in the Resource Editor view revolve around the management and
fine-tuning of the linguistic resources. These resources are stored in the form of templates and libraries.
The Resource Editor view is organized into four parts: Library Tree pane, Type Dictionary pane,
Substitution Dictionary pane, and Exclude Dictionary pane.
Note: See the topic “The Editor Interface” on page 164 for more information.
Setting Options
You can set general options for IBM SPSS Modeler Text Analytics in the Options dialog box. This dialog
box contains the following tabs:
v Session. This tab contains general options and delimiters.
v Display. This tab contains options for the colors used in the interface.
v Sounds. This tab contains options for sound cues.
To
1.
2.
3.
Edit Options
From the menus, choose Tools > Options. The Options dialog box opens.
Select the tab containing the information you want to change.
Change any of the options.
Chapter 8. Interactive Workbench Mode
79
4. Click OK to save the changes.
Options: Session Tab
On this tab, you can define some of the basic settings.
Data Pane and Category Graph Display. These options affect how data are presented in the Data pane
and in the Visualization pane in the Categories and Concepts view.
v Display limit for Data pane and Category Web. This option sets the maximum number of documents
to show or use to populate the Data panes or graphs and charts in the Categories and Concepts view.
v Show categories for documents/records at Display time. If selected, the documents or records are
scored whenever you click Display so that any categories to which they belong can be displayed in the
Categories column in the Data pane as well as in the category graphs. In some cases, especially with
larger datasets, you may want to turn off this option so that data and graphs are displayed much
faster.
Add to Category from Data Pane. These options affect what is added to categories when documents and
records are added from the Data pane.
v In Categories and Concepts view, copy. Adding a document or record from the Data pane in this view
will copy over either Concepts only or both Concepts and Patterns.
v In Text Link Analysis view, copy. Adding a document or record from the Data pane in this view will
copy over either Patterns only or both Concepts and Patterns.
Resource Editor delimiter. Select the character to be used as a delimiter when entering elements, such as
concepts, synonyms, and optional elements, in the Resource Editor view.
Options: Display Tab
On this tab, you can edit options affecting the overall look and feel of the application and the colors used
to distinguish elements.
Note: To switch the look and feel of the product to a classic look or one from a previous release, open the
User Options dialog in the Tools menu in the main IBM SPSS Modeler window.
Custom Colors. Edit the colors for elements appearing onscreen. For each of the elements in the table,
you can change the color. To specify a custom color, click the color area to the right of the element you
want to change and choose a color from the drop-down color list.
v Non-extracted text. Text data that was not extracted yet visible in the Data pane.
v Highlight background. Text selection background color when selecting elements in the panes or text in
the Data pane.
v Extraction needed background. Background color of the Extraction Results, Patterns, and Clusters
panes indicating that changes have been made to the libraries and an extraction is needed.
v Category feedback background. Category background color that appears after an operation.
v Default type. Default color for types and concepts appearing in the Data pane and Extraction Results
pane. This color will apply to any custom types that you create in the Resource Editor. You can
override this default color for your custom type dictionaries by editing the properties for these type
dictionaries in the Resource Editor. See the topic “Creating Types” on page 183 for more information.
v Striped table 1. First of the two colors used in an alternating manner in the table in the Edit Forced
concepts dialog box in order to differentiate each set of lines.
v Striped table 2. Second of the two colors used in an alternating manner in the table in the Edit Forced
concepts dialog box in order to differentiate each set of lines.
Note: If you click the Reset to Defaults button, all options in this dialog box are reset to the values they
had when you first installed this product.
80
IBM SPSS Modeler Text Analytics 16 User's Guide
Options: Sounds Tab
On this tab, you can edit options affecting sounds. Under Sound Events, you can specify a sound to be
used to notify you when an event occurs. A number of sounds are available. Use the ellipsis button (...) to
browse for and select a sound. The .wav files used to create sounds for IBM SPSS Modeler Text Analytics
are stored in the media subdirectory of the installation directory. If you do not want sounds to be played,
select Mute All Sounds. Sounds are muted by default.
Note: If you click the Reset to Defaults button, all options in this dialog box are reset to the values they
had when you first installed this product.
Microsoft Internet Explorer Settings for Help
Microsoft Internet Explorer Settings
Most Help features in this application use technology based on Microsoft Internet Explorer. Some
versions of Internet Explorer (including the version provided with Microsoft Windows XP, Service Pack 2)
will by default block what it considers to be "active content" in Internet Explorer windows on your local
computer. This default setting may result in some blocked content in Help features. To see all Help
content, you can change the default behavior of Internet Explorer.
1. From the Internet Explorer menus choose:
Tools > Internet Options...
2. Click the Advanced tab.
3. Scroll down to the Security section.
4. Select (check) Allow active content to run in files on My Computer.
Generating Model Nuggets and Modeling Nodes
When you are in an interactive session, you may want to use the work you have done to generate either:
v A text mining modeling node. A modeling node generated from an interactive workbench session is a
Text Mining node whose settings and options reflect those stored in the open interactive session. This
can be useful when you no longer have the original Text Mining node or when you want to make a
new version. See the topic Chapter 3, “Mining for Concepts and Categories,” on page 19 for more
information.
v A category model nugget. A model nugget generated from an interactive workbench session is a
category model nugget. You must have at least one category in the Categories and Concepts view in
order to generate a category model nugget. See the topic “Text Mining Nugget: Category Model” on
page 39 for more information.
To Generate a Text Mining Modeling Node
1. From the menus, choose Generate > Generate Modeling Node. A Text Mining modeling node is
added to the working canvas using all of the settings currently in the workbench session. The node is
named after the text field.
To Generate a Category Model Nugget
1. From the menus, choose Generate > Generate Model. A model nugget is generated directly onto the
Model palette with the default name.
Chapter 8. Interactive Workbench Mode
81
Updating Modeling Nodes and Saving
While you are working in an interactive session, we recommend that you update the modeling node from
time to time to save your changes. You should also update your modeling node whenever you are
finished working in the interactive workbench session and want to save your work. When you update
the modeling node, the workbench session content is saved back to the Text Mining node that originated
the interactive workbench session. This does not close the output window.
Important! This update will not save your stream. To save your stream, do so in the main IBM SPSS
Modeler window after updating the modeling node.
To Update a Modeling Node
1. From the menus, choose File > Update Modeling Node. The modeling node is updated with the
build and extraction settings, along with any options and categories you have.
Closing and Ending Sessions
When you are finished working in your session, you can leave the session in three different ways:
v Save. This option allows you to first save your work back into the originating modeling node for
future sessions, as well as to publish any libraries for reuse in other sessions. See the topic “Sharing
Libraries” on page 177 for more information. After you have saved, the session window is closed, and
the session is deleted from the Output manager in the IBM SPSS Modeler window.
v Exit. This option will discard any unsaved work, close the session window, and delete the session from
the Output manager in the IBM SPSS Modeler window. To free up memory, we recommend saving any
important work and exiting the session.
v Close. This option will not save or discard any work. This option closes the session window but the
session will continue to run. You can open the session window again by selecting this session in the
Output manager in the IBM SPSS Modeler window.
To Close a Workbench Session
1. From the menus, choose File > Close.
Keyboard Accessibility
The interactive workbench interface offers keyboard shortcuts to make the product's functionality more
accessible. At the most basic level, you can press the Alt key plus the appropriate key to activate window
menus (for example, Alt+F to access the File menu) or press the Tab key to scroll through dialog box
controls. This section will cover the keyboard shortcuts for alternative navigation. There are other
keyboard shortcuts for the IBM SPSS Modeler interface.
Table 13. Generic keyboard shortcuts
Shortcut key
Function
Ctrl+1
Display the first tab in a pane with tabs.
Ctrl+2
Display the second tab in a pane with tabs.
Ctrl+A
Select all elements for the pane that has focus.
Ctrl+C
Copy selected text to the clipboard.
Ctrl+E
Launch extraction in Categories and Concepts and Text Link Analysis views.
Ctrl+F
Display the Find toolbar in the Resource Editor/Template Editor, if not already visible, and
put focus there.
Ctrl+I
In the Categories and Concepts view, launch the Category Definitions dialog box for the
selected category. In the Cluster view, launch the Cluster Definitions dialog box for the
selected cluster.
82
IBM SPSS Modeler Text Analytics 16 User's Guide
Table 13. Generic keyboard shortcuts (continued)
Shortcut key
Function
Ctrl+R
Open the Add Terms dialog box in the Resource Editor/Template Editor.
Ctrl+T
Open the Type Properties dialog box to create a new type in the Resource Editor/Template
Editor.
Ctrl+V
Paste clipboard contents.
Ctrl+X
Cut selected items from the Resource Editor/Template Editor.
Ctrl+Y
Redo the last action in the view.
Ctrl+Z
Undo the last action in the view.
F1
Display Help, or when in a dialog box, display context Help for an item.
F2
Toggle in and out of edit mode in table cells.
F6
Move the focus between the main panes in the active view.
F8
Move the focus to pane splitter bars for resizing.
F10
Expand the main File menu.
up arrow, down
arrow
Resize the pane vertically when the splitter bar is selected.
left arrow, right
arrow
Resize the pane horizontally when the splitter bar is selected.
Home, End
Resize panes to minimum or maximum size when the splitter bar is selected.
Tab
Move forward through items in the window, pane, or dialog box.
Shift+F10
Display the context menu for an item.
Shift+Tab
Move back through items in the window or dialog box.
Shift+arrow
Select characters in the edit field when in edit mode (F2).
Ctrl+Tab
Move the focus forward to the next main area in the window.
Shift+Ctrl+Tab
Move the focus backward to the previous main area in the window.
Shortcuts for Dialog Boxes
Several shortcut and screen reader keys are helpful when you are working with dialog boxes. Upon
entering a dialog box, you may need to press the Tab key to put the focus on the first control and to
initiate the screen reader. A complete list of special keyboard and screen reader shortcuts is provided in
the following table.
Table 14. Dialog box shortcuts
Shortcut key
Function
Tab
Move forward through the items in the window or dialog box.
Ctrl+Tab
Move forward from a text box to the next item.
Shift+Tab
Move back through items in the window or dialog box.
Shift+Ctrl+Tab
Move back from a text box to the previous item.
space bar
Select the control or button that has focus.
Esc
Cancel changes and close the dialog box.
Enter
Validate changes and close the dialog box (equivalent to the OK button). If you are in a text
box, you must first press Ctrl+Tab to exit the text box.
Chapter 8. Interactive Workbench Mode
83
84
IBM SPSS Modeler Text Analytics 16 User's Guide
Chapter 9. Extracting Concepts and Types
Whenever you execute a stream that launches the interactive workbench, an extraction is automatically
performed on the text data in the stream. The end result of this extraction is a set of concepts, types, and,
in the case where TLA patterns exist in the linguistic resources, patterns. You can view and work with
concepts and types in the Extraction Results pane. See the topic “How Extraction Works” on page 5 for
more information.
If you want to fine-tune the extraction results, you can modify the linguistic resources and reextract. See
the topic “Refining Extraction Results” on page 93 for more information. The extraction process relies on
the resources and any parameters in the Extract dialog box to dictate how to extract and organize the
results. You can use the extraction results to define the better part, if not all, of your category definitions.
Extraction Results: Concepts and Types
During the extraction process, all of the text data is scanned and the relevant concepts are identified,
extracted, and assigned to types. When the extraction is complete, the results appear in the Extraction
Results pane located in the lower left corner of the Categories and Concepts view. The first time you
launch the session, the linguistic resource template you selected in the node is used to extract and
organize these concepts and types.
The concepts, types, and TLA patterns that are extracted are collectively referred to as extraction results,
and they serve as the descriptors, or building blocks, for your categories. You can also use concepts,
types, and patterns in your category rules. Additionally, the automatic techniques use concepts and types
to build the categories.
Text mining is an iterative process in which extraction results are reviewed according to the context of the
text data, fine-tuned to produce new results, and then reevaluated. After extracting, you should review
the results and make any changes that you find necessary by modifying the linguistic resources. You can
fine-tune the resources, in part, directly from the Extraction Results pane, Data pane, Category Definitions
dialog box, or Cluster Definitions dialog box. See the topic “Refining Extraction Results” on page 93 for
more information. You can also do so directly in the Resource Editor view. See the topic “The Resource
Editor View” on page 78 for more information.
After fine-tuning, you can then reextract to see the new results. By fine-tuning your extraction results
from the start, you can be assured that each time you reextract, you will get identical results in your
category definitions, perfectly adapted to the context of the data. In this way, documents/records will be
assigned to your category definitions in a more accurate, repeatable manner.
Concepts
During the extraction process, the text data is scanned and analyzed in order to identify interesting or
relevant single words (such as election or peace) and word phrases (such as presidential election,
election of the president, or peace treaties) in the text. These words and phrases are collectively
referred to as terms. Using the linguistic resources, the relevant terms are extracted and then similar terms
are grouped together under a lead term called a concept.
You can see the set of underlying terms for a concept by hovering your mouse over the concept name.
Doing so will display a tooltip showing the concept name and up to several lines of terms that are
grouped under that concept. These underlying terms include the synonyms defined in the linguistic
resources (regardless of whether they were found in the text or not) as well as the any extracted
85
plural/singular terms, permuted terms, terms from fuzzy grouping, and so on. You can copy these terms
or see the full set of underlying terms by right-clicking the concept name and choosing the context menu
option.
By default, the concepts are shown in lowercase and sorted in descending order according to the
document count (Doc. column) . When concepts are extracted, they are assigned a type to help group
similar concepts. They are color coded according to this type. Colors are defined in the type properties
within the Resource Editor. See the topic “Type Dictionaries” on page 181 for more information.
Whenever a concept, type, or pattern is being used in a category definition, an icon appears in the
sortable In column .
Types
Types are semantic groupings of concepts. When concepts are extracted, they are assigned a type to help
group similar concepts. Several built-in types are delivered with IBM SPSS Modeler Text Analytics, such
as <Location>, <Organization>, <Person>, <Positive>, <Negative> and so on. For example, the <Location>
type groups geographical keywords and places. This type would be assigned to concepts such as chicago,
paris, and tokyo. For most languages, concepts that are not found in any type dictionary but are
extracted from the text are automatically typed as <Unknown> See the topic “Built-in Types” on page 182
for more information.
When you select the Type view, the extracted types appear by default in descending order by global
frequency. You can also see that types are color coded to help distinguish them. Colors are part of the
type properties. See the topic “Creating Types” on page 183 for more information. You can also create
your own types.
Patterns
Patterns can also be extracted from your text data. However, you must have a library that contains some
Text Link Analysis (TLA) pattern rules in the Resource Editor. You also have to choose to extract these
patterns in the IBM SPSS Modeler Text Analytics node setting or in the Extract dialog box using the
option Enable Text Link Analysis pattern extraction. See the topic Chapter 12, “Exploring Text Link
Analysis,” on page 147 for more information.
Extracting Data
Whenever an extraction is needed, the Extraction Results pane becomes yellow in color and the message
Press Extract Button to Extract Concepts appears below the toolbar in this pane.
You may need to extract if you do not have any extraction results yet, have made changes to the
linguistic resources and need to update the extraction results, or have reopened a session in which you
did not save the extraction results (Tools > Options).
Note: If you change the source node for your stream after extraction results have been cached with the
Use session work... option, you will need to run a new extraction once the interactive workbench session
is launched if you want to get updated extraction results.
When you run an extraction, a progress indicator appears to provide feedback on the status of the
extraction. During this time, the extraction engine reads through all of the text data and identifies the
relevant terms and patterns and extracts them and assigns them to a type. Then, the engine attempts
groups synonyms terms under one lead term, called a concept. When the process is complete, the
resulting concepts, types, and patterns appear in the Extraction Results pane.
86
IBM SPSS Modeler Text Analytics 16 User's Guide
The extraction process results in a set of concepts and types, as well as Text Link Analysis (TLA) patterns,
if enabled. You can view and work with these concepts and types in the Extraction Results pane in the
Categories and Concepts view. If you extracted TLA patterns, you can see those in the Text Link Analysis
view.
Note: There is a relationship between the size of your dataset and the time it takes to complete the
extraction process. You can always consider inserting a Sample node upstream or optimizing your
machine's configuration.
To Extract Data
1. From the menus, choose Tools > Extract. Alternatively, click the Extract toolbar button.
2. If you chose to always display the Extraction Settings dialog, it appears so that you can make any
changes. See further in this topic for descriptors of each settings.
3. Click Extract to begin the extraction process. Once the extraction begins, the progress dialog box
opens. After extraction, the results appear in the Extraction Results pane. By default, the concepts are
shown in lowercase and sorted in descending order according to the document count (Doc. column) .
You can review the results using the toolbar options to sort the results differently, to filter the results, or
to switch to a different view (concepts or types). You can also refine your extraction results by working
with the linguistic resources. See the topic “Refining Extraction Results” on page 93 for more information.
For Dutch, English, French, German, Italian, Portuguese, and Spanish Text
The Extraction Settings dialog box contains some basic extraction options.
Enable Text Link Analysis pattern extraction. Specifies that you want to extract TLA patterns from your
text data. It also assumes you have TLA pattern rules in one of your libraries in the Resource Editor. This
option may significantly lengthen the extraction time. See the topic Chapter 12, “Exploring Text Link
Analysis,” on page 147 for more information.
Accommodate punctuation errors. This option temporarily normalizes text containing punctuation errors
(for example, improper usage) during extraction to improve the extractability of concepts. This option is
extremely useful when text is short and of poor quality (as, for example, in open-ended survey responses,
e-mail, and CRM data), or when the text contains many abbreviations.
Accommodate spelling errors for a minimum root character limit of [n]. This option applies a fuzzy
grouping technique that helps group commonly misspelled words or closely spelled words under one
concept. The fuzzy grouping algorithm temporarily strips all vowels (except the first one) and strips
double/triple consonants from extracted words and then compares them to see if they are the same so
that modeling and modelling would be grouped together. However, if each term is assigned to a different
type, excluding the <Unknown> type, the fuzzy grouping technique will not be applied.
You can also define the minimum number of root characters required before fuzzy grouping is used. The
number of root characters in a term is calculated by totaling all of the characters and subtracting any
characters that form inflection suffixes and, in the case of compound-word terms, determiners and
prepositions. For example, the term exercises would be counted as 8 root characters in the form
“exercise,” since the letter s at the end of the word is an inflection (plural form). Similarly, apple sauce
counts as 10 root characters (“apple sauce”) and manufacturing of cars counts as 16 root characters
(“manufacturing car”). This method of counting is only used to check whether the fuzzy grouping should
be applied but does not influence how the words are matched.
Note: If you find that certain words are later grouped incorrectly, you can exclude word pairs from this
technique by explicitly declaring them in the Fuzzy Grouping: Exceptions section in the Advanced
Resources tab. See the topic “Fuzzy Grouping” on page 196 for more information.
Chapter 9. Extracting Concepts and Types
87
Extract uniterms. This option extracts single words (uniterms) as long as the word is not already part of a
compound word and if it is either a noun or an unrecognized part of speech.
Extract nonlinguistic entities. This option extracts nonlinguistic entities, such as phone numbers, social
security numbers, times, dates, currencies, digits, percentages, e-mail addresses, and HTTP addresses. You
can include or exclude certain types of nonlinguistic entities in the Nonlinguistic Entities: Configuration
section of the Advanced Resources tab. By disabling any unnecessary entities, the extraction engine won't
waste processing time. See the topic “Configuration” on page 200 for more information.
Uppercase algorithm. This option extracts simple and compound terms that are not in the built-in
dictionaries as long as the first letter of the term is in uppercase. This option offers a good way to extract
most proper nouns.
Group partial and full person names together when possible. This option groups names that appear
differently in the text together. This feature is helpful since names are often referred to in their full form
at the beginning of the text and then only by a shorter version. This option attempts to match any
uniterm with the <Unknown> type to the last word of any of the compound terms that is typed as
<Person>. For example, if doe is found and initially typed as <Unknown>, the extraction engine checks to
see if any compound terms in the <Person> type include doe as the last word, such as john doe. This
option does not apply to first names since most are never extracted as uniterms.
Maximum nonfunction word permutation. This option specifies the maximum number of nonfunction
words that can be present when applying the permutation technique. This permutation technique groups
similar phrases that differ from each other only by the nonfunction words (for example, of and the)
contained, regardless of inflection. For example, let's say that you set this value to at most two words and
both company officials and officials of the company were extracted. In this case, both extracted terms
would be grouped together in the final concept list since both terms are deemed to be the same when of
the is ignored.
Index Option for Concept Map Specifies that you want to build the map index at extraction time so that
concept maps can be drawn quickly later. To edit the index settings, click Settings. See the topic
“Building Concept Map Indexes” on page 92 for more information.
Always show this dialog before starting an extraction. Specify whether you want to see the Extraction
Settings dialog each time you extract, if you never want to see it unless you go to the Tools menu, or
whether you want to be asked each time you extract if you want to edit any extraction settings.
For Japanese Text
The Extraction Settings dialog box contains some basic extraction options for the Japanese text language.
By default, the settings selected in the dialog are the same as those selected on the Expert tab of the Text
Mining modeling node. In order to work with Japanese text, you must use the text as input as well as
choose a Japanese language template or text analysis package in the Model tab of the Text Mining node.
See the topic “Copying Resources From Templates and TAPs” on page 26 for more information.
Note: Japanese text extraction is available in IBM SPSS Modeler Premium.
Secondary Analysis. When an extraction is launched, basic keyword extraction takes place using the
default set of types. However, when you select a secondary analyzer, you can obtain many more or richer
concepts since the extractor will now include particles and auxiliary verbs as part of the concept. In the
case of sentiment analysis, a large number of additional types are also included. Furthermore, choosing a
secondary analyzer allows you to also generate text link analysis results.
Note: When a secondary analyzer is called, the extraction process takes longer to complete.
88
IBM SPSS Modeler Text Analytics 16 User's Guide
v
Dependency analysis. Choosing this option yields extended particles for the extraction concepts from
the basic type and keyword extraction. You can also obtain the richer pattern results from dependency
text link analysis (TLA).
Sentiment analysis. Choosing this analyzer yields additional extracted concepts and, whenever
applicable, the extraction of TLA pattern results. In addition to the basic types, you also benefit from
more than 80 sentiment types. These types are used to uncover concepts and patterns in the text
through the expression of emotion, sentiments, and opinions. There are three options that dictate the
focus for the sentiment analysis: All sentiments, Representative sentiment only, and Conclusions
only.
v No secondary analyzer. This options turns off all secondary analyzers. This option cannot be selected
if the option Enable Text Link Analysis pattern extraction was selected since a secondary analyzer is
required in order to obtain TLA results.
v
Enable Text Link Analysis pattern extraction. Specifies that you want to extract TLA patterns from your
text data. It also assumes you have TLA pattern rules in one of your libraries in the Resource Editor. This
option may significantly lengthen the extraction time. Additionally, a secondary analyzer must be selected
in order to extract TLA pattern results. See the topic Chapter 12, “Exploring Text Link Analysis,” on page
147 for more information.
Filtering Extraction Results
When you are working with very large datasets, the extraction process could produce millions of results.
For many users, this amount can make it more difficult to review the results effectively. Therefore, in
order to zoom in on those that are most interesting, you can filter these results through the Filter dialog
available in the Extraction Results pane.
Keep in mind that all of the settings in this Filter dialog are used together to filter the extraction results
that are available for categories.
Filter by Frequency. You can filter to display only those results with a certain global or document
frequency value.
v Global frequency is the total number of times a concept appears in the entire set of documents or
records and is shown in the Global column.
v Document frequency is the total number of documents or records in which a concept appears and is
shown in the Docs column.
For example, if the concept nato appeared 800 times in 500 records, we would say that this concept has a
global frequency of 800 and a document frequency of 500.
And by Type. You can filter to display only those results belonging to certain types. You can choose all
types or only specific types.
And by Match Text. You can also filter to display only those results that match the rule you define here.
Enter the set of characters to be matched in the Match text field and then select the condition in which to
apply the match.
Table 15. Match text conditions
Condition
Description
Contains
The text is matched if the string occurs anywhere. (Default choice)
Starts with
Text is matched only if the concept or type starts with the specified text.
Ends with
Text is matched only if the concept or type ends with the specified text.
Exact match
The entire string must match the concept or type name.
Chapter 9. Extracting Concepts and Types
89
And by Rank. You can also filter to display only a top number of concepts according to global frequency
(Global) or document frequency (Docs) in either ascending or descending order.
Results Displayed in Extraction Result Pane
Here are some examples of how the results might be displayed, in English, in the Extraction Results pane
toolbar based on the filters.
Table 16. Examples of filter feedback
Filter feedback
Description
The toolbar shows the number of results. Since there was no text matching filter
and the maximum was not met, no additional icons are shown.
The toolbar shows results were limited to the maximum specified in the filter,
which in this case was 300. If a purple icon is present, this means that the
maximum number of concepts was met. Hover over the icon for more
information.
The toolbar shows results were limited using a match text filter. This is shown
by the magnifying glass icon.
To Filter the Results
1. From the menus, choose Tools > Filter. The Filter dialog box opens.
2. Select and refine the filters you want to use.
3. Click OK to apply the filters and see the new results in the Extraction Results pane.
Exploring Concept Maps
You can create a concept map to explore how concepts are interrelated. By selecting a single concept and
clicking Map, a concept map window opens so that you can explore the set of concepts that are related to
the selected concept. You can filter out which concepts are displayed by editing the settings such as
which types to include, what kinds of relationship to look for and so on.
Important! Before a map can be created, an index must be generated. This may take several minutes.
However, once you have generated the index, you do not have regenerate it again until you re-extract. If
you want the index to be generated automatically each time you extract, select that option in the
extraction settings. See the topic “Extracting Data” on page 86 for more information.
90
IBM SPSS Modeler Text Analytics 16 User's Guide
Figure 27. A concept map for the selected concept
To View a Concept Map
1. In the Extraction Results pane, select a single concept.
2. In the toolbar of this pane, click the Map button. If the map index was already generated the concept
map opens in a separate dialog. If the map index was not generated or was out of date, the index
must be rebuilt. This process may take several minutes.
3. Click around the map to explore. If you double-click a linked concept, the map will redraw itself and
show you the linked concepts for the concept you just double-clicked.
4. The top toolbar offers some basic map tools such as moving back to a previous map, filtering links
according to relationship strengths, and also opening the filter dialog to control the types of concepts
that appear as well as the kinds of relationships to represent. A second toolbar line contains graph
editing tools. See the topic “Using Graph Toolbars and Palettes” on page 156 for more information.
5. If you are unsatisfied with the kinds of links being found, review the settings for this map show on
the right side of the map.
Map Settings: Include Concepts from Selected Types
Only those concepts belonging to the selected types in the table are shown in the map. To hide concepts
from a certain type, deselect that type in the table.
Chapter 9. Extracting Concepts and Types
91
Map Settings: Relationships to Display
Show co-occurrence links. If you want to show co-occurrence links, choose the mode. The mode affects
how the link strength was calculated.
v Discover (similarity metric). With this metric, the strength of the link is calculated using more complex
calculation that takes into account how often two concepts appear apart as well as how often they
appear together. A high strength value means that a pair of concepts tend to appear more frequently
together than to appear apart. With the following formula, any floating point values are converted to
integers.
Figure 28. Similarity coefficient formula
In this formula, CI is the number of documents or records in which the concept I occurs.
CJ is the number of documents or records in which the concept J occurs.
CIJ is the number of documents or records in which concept pair I and J co-occurs in the set of
documents.
v Organize (document metric). The strength of the links with this metric is determined by the raw count of
co-occurrences. In general, the more frequent two concepts are, the more likely they are to occur
together at times. A high strength value means that a pair of concepts appear together frequently.
Show other links (confidence metric). You can choose other links to display; these may be semantic,
derivation (morphological), or inclusion (syntactical) and are related to how many steps removed a
concept is from the concept to which it is linked. These can help you tune resources, particularly
synonymy or to disambiguate.For short descriptions of each of these grouping techniques, see “Advanced
Linguistic Settings” on page 111
Note: Keep in mind that if these were not selected when the index was built or if no relationships were
found, then none will be displayed. See the topic “Building Concept Map Indexes” for more information.
Map Settings: Map Display Limits
Apply extraction results filter. If you do not want to use all of the concepts, you can use the filter in the
extraction results pane to limit what is shown. Then select this option and IBM SPSS Modeler Text
Analytics will look for related concepts using this filtered set. See the topic “Filtering Extraction Results”
on page 89 for more information.
Minimum strength. Set the minimum link strength here. Any related concepts with a relationship
strength lower than this limit will be hidden from the map.
Maximum concepts on map. Specify the maximum number of relationships to show on the map.
Building Concept Map Indexes
Before a map can be created, an index of concept relationships must be generated. Whenever you create a
concept map, IBM SPSS Modeler Text Analytics refers to this index. You can choose which relationships
to index by selecting the techniques in this dialog.
Grouping techniques. Choose one or more technique. For short descriptions of each of these techniques,
see “About Linguistic Techniques” on page 113 Not all techniques are available for all text languages.
92
IBM SPSS Modeler Text Analytics 16 User's Guide
Prevent pairing of specific concepts. Select this checkbox to stop the process from grouping or pairing
two concepts together in the output. To create or manage concept pairs, click Manage Pairs. See the topic
“Managing Link Exception Pairs” on page 113 for more information.
Building the index may take several minutes. However, once you have generated the index, you do not
have regenerate it again until you re-extract or unless you want to change the settings to include more
relationships. If you want to generate an index whenever you extract, you can select that option in the
extraction settings. See the topic “Extracting Data” on page 86 for more information.
Refining Extraction Results
Extraction is an iterative process whereby you can extract, review the results, make changes to them, and
then reextract to update the results. Since accuracy and continuity are essential to successful text mining
and categorization, fine-tuning your extraction results from the start ensures that each time you reextract,
you will get precisely the same results in your category definitions. In this way, records and documents
will be assigned to your categories in a more accurate, repeatable manner.
The extraction results serve as the building blocks for categories. When you create categories using these
extraction results, records and documents are automatically assigned to categories if they contain text that
matches one or more category descriptors. Although you can begin categorizing before making any
refinements to the linguistic resources, it is useful to review your extraction results at least once before
beginning.
As you review your results, you may find elements that you want the extraction engine to handle
differently. Consider the following examples:
v Unrecognized synonyms. Suppose you find several concepts you consider to be synonymous, such as
smart, intelligent, bright, and knowledgeable, and they all appear as individual concepts in the
extraction results. You could create a synonym definition in which intelligent, bright, and
knowledgeable are all grouped under the target concept smart. Doing so would group all of these
together with smart, and the global frequency count would be higher as well. See the topic “Adding
Synonyms” on page 94 for more information.
v Mistyped concepts. Suppose that the concepts in your extraction results appear in one type and you
would like them to be assigned to another. In another example, imagine that you find 15 vegetable
concepts in your extraction results and you want them all to be added to a new type called
<Vegetable>. For most languages, concepts that are not found in any type dictionary but are extracted
from the text are automatically typed as <Unknown> You can add concepts to types. See the topic
“Adding Concepts to Types” on page 95 for more information.
v Insignificant concepts. Suppose that you find a concept that was extracted and has a very high
frequency count—that is, it is found in many records or documents. However, you consider this
concept to be insignificant to your analysis. You can exclude it from extraction. See the topic
“Excluding Concepts from Extraction” on page 96 for more information.
v Incorrect matches. Suppose that in reviewing the records or documents that contain a certain concept,
you discover that two words were incorrectly grouped together, such as faculty and facility. This
match may be due to an internal algorithm, referred to as fuzzy grouping, that temporarily ignores
double or triple consonants and vowels in order to group common misspellings. You can add these
words to a list of word pairs that should not be grouped. See the topic “Fuzzy Grouping” on page 196
for more information. Fuzzy grouping is not available for Japanese text.
v Unextracted concepts. Suppose that you expect to find certain concepts extracted but notice that a few
words or phrases were not extracted when you review the record or document text. Often these words
are verbs or adjectives that you are not interested in. However, sometimes you do want to use a word
or phrase that was not extracted as part of a category definition. To extract the concept, you can force a
term into a type dictionary. See the topic “Forcing Words into Extraction” on page 97 for more
information.
Chapter 9. Extracting Concepts and Types
93
Many of these changes can be performed directly from the Extraction Results pane , Data pane, Category
Definitions dialog box, or Cluster Definitions dialog box by selecting one or more elements and
right-clicking your mouse to access the context menus.
After making your changes, the pane background color changes to show that you need to reextract to
view your changes. See the topic “Extracting Data” on page 86 for more information. If you are working
with larger datasets, it may be more efficient to reextract after making several changes rather than after
each change.
Note: You can view the entire set of editable linguistic resources used to produce the extraction results in
the Resource Editor view (View > Resource Editor). These resources appear in the form of libraries and
dictionaries in this view. You can customize the concepts and types directly within the libraries and
dictionaries. See the topic Chapter 16, “Working with Libraries,” on page 173 for more information.
Adding Synonyms
Synonyms associate two or more words that have the same meaning. Synonyms are often also used to
group terms with their abbreviations or to group commonly misspelled words with the correct spelling.
By using synonyms, the frequency for the target concept is greater, which makes it far easier to discover
similar information that is presented in different ways in your text data.
The linguistic resource templates and libraries delivered with the product contain many predefined
synonyms. However, if you discover unrecognized synonyms, you can define them so that they will be
recognized the next time you extract.
The first step is to decide what the target, or lead, concept will be. The target concept is the word or
phrase under which you want to group all synonym terms in the final results. During extraction, the
synonyms are grouped under this target concept. The second step is to identify all of the synonyms for
this concept. The target concept is substituted for all synonyms in the final extraction. A term must be
extracted to be a synonym. However, the target concept does not need to be extracted for the substitution
to occur. For example, if you want intelligent to be replaced by smart, then intelligent is the synonym
and smart is the target concept.
If you create a new synonym definition, a new target concept is added to the dictionary. You must then
add synonyms to that target concept. Whenever you create or edit synonyms, these changes are recorded
in synonym dictionaries in the Resource Editor. If you want to view the entire contents of these synonym
dictionaries or if you want to make a substantial number of changes, you may prefer to work directly in
the Resource Editor. See the topic “Substitution/Synonym Dictionaries” on page 187 for more
information.
Any new synonyms will automatically be stored in the first library listed in the library tree in the
Resource Editor view—by default, this is the Local Library.
Note: If you look for a synonym definition and cannot find it through the context menus or directly in the
Resource Editor, a match may have resulted from an internal fuzzy grouping technique. See the topic
“Fuzzy Grouping” on page 196 for more information.
To Create a New Synonym
1. In either the Extraction Results pane, Data pane, Category Definitions dialog box, or Cluster
Definitions dialog box, select the concept(s) for which you want to create a new synonym.
2. From the menus, choose Edit > Add to Synonym > New. The Create Synonym dialog box opens.
3. Enter a target concept in the Target text box. This is the concept under which all of the synonyms will
be grouped.
4. If you want to add more synonyms, enter them in the Synonyms list box. Use the global separator to
separate each synonym term. See the topic “Options: Session Tab” on page 80 for more information.
94
IBM SPSS Modeler Text Analytics 16 User's Guide
5. If working with Japanese text, designate a type for these synonyms by selecting the type name in the
Synonyms from type field. The target, however, takes the type assigned during extraction. However,
if the target was not extracted as a concept, then the type listed in this column is assigned to the
target in the extraction results.
Note: Japanese text extraction is available in IBM SPSS Modeler Premium.
6. Click OK to apply your changes. The dialog box closes and the Extraction Results pane background
color changes, indicating that you need to reextract to see your changes. If you have several changes,
make them before you reextract.
To Add to a Synonym
1. In either the Extraction Results pane, Data pane, Category Definitions dialog box, or Cluster
Definitions dialog box, select the concept(s) that you want to add to an existing synonym definition.
2. From the menus, choose Edit > Add to Synonym > . The menu displays a set of the synonyms with
the most recently created at the top of the list. Select the name of the synonym to which you want to
add the selected concept(s). If you see the synonym that you are looking for, select it, and the
concept(s) selected are added to that synonym definition. If you do not see it, select More to display
the All Synonyms dialog box.
3. In the All Synonyms dialog box, you can sort the list by natural sort order (order of creation) or in
ascending or descending order. Select the name of the synonym to which you want to add the
selected concept(s) and click OK. The dialog box closes, and the concepts are added to the synonym
definition.
Adding Concepts to Types
Whenever an extraction is run, the extracted concepts are assigned to types in an effort to group terms
that have something in common. IBM SPSS Modeler Text Analytics is delivered with many built-in types.
See the topic “Built-in Types” on page 182 for more information. For most languages, concepts that are
not found in any type dictionary but are extracted from the text are automatically typed as <Unknown>
When reviewing your results, you may find some concepts that appear in one type that you want
assigned to another, or you may find that a group of words really belongs in a new type by itself. In
these cases, you would want to reassign the concepts to another type or create a new type altogether. You
cannot create new types for Japanese text.
For example, suppose that you are working with survey data relating to automobiles and you are
interested in categorizing by focusing on different areas of the vehicles. You could create a type called
<Dashboard> to group all of the concepts relating to gauges and knobs found on the dashboard of the
vehicles. Then you could assign concepts such as gas gauge, heater, radio, and odometer to that new
type.
In another example, suppose that you are working with survey data relating to universities and colleges
and the extraction typed Johns Hopkins (the university) as a <Person> type rather than as an
<Organization> type. In this case, you could add this concept to the <Organization> type.
Whenever you create a type or add concepts to a type's term list, these changes are recorded in type
dictionaries within your linguistic resource libraries in the Resource Editor. If you want to view the
contents of these libraries or make a substantial number of changes, you may prefer to work directly in
the Resource Editor. See the topic “Adding Terms” on page 184 for more information.
To Add a Concept to a Type
1. In either the Extraction Results pane, Data pane, Category Definitions dialog box, or Cluster
Definitions dialog box, select the concept(s) that you want to add to an existing type.
2. Right-click to open the context menu.
Chapter 9. Extracting Concepts and Types
95
3. From the menus, choose Edit > Add to Type >. The menu displays a set of the types with the most
recently created at the top of the list. Select the type name to which you want to add the selected
concept(s). If you see the type name that you are looking for, select it, and the concept(s) selected are
added to that type. If you do not see it, select More to display the All Types dialog box.
4. In the All Types dialog box, you can sort the list by natural sort (order of creation) or in ascending or
descending order. Select the name of the type to which you want to add the selected concept(s) and
click OK. The dialog box closes, and they are added as terms to the type.
Note: With Japanese text, there some instances where changing the type of a term will not change the
type to which it will be assigned ultimately in the final extraction list. This is due to internal dictionaries
that take precedence during extraction for some basic terms.
Note: Japanese text extraction is available in IBM SPSS Modeler Premium.
To Create a New Type
1. In either the Extraction Results pane, Data pane, Category Definitions dialog box, or Cluster
Definitions dialog box, select the concepts for which you want to create a new type.
2. From the menus, choose Edit > Add to Type > New. The Type Properties dialog box opens.
3. Enter a new name for this type in the Name text box and make any changes to the other fields. See
the topic “Creating Types” on page 183 for more information.
4. Click OK to apply your changes. The dialog box closes and the Extraction Results pane background
color changes, indicating that you need to reextract to see your changes. If you have several changes,
make them before you reextract.
Excluding Concepts from Extraction
When reviewing your results, you may occasionally find concepts that you did not want extracted or
used by any automated category building techniques. In some cases, these concepts have a very high
frequency count and are completely insignificant to your analysis. In this case, you can mark a concept to
be excluded from the final extraction. Typically, the concepts you add to this list are fill-in words or
phrases used in the text for continuity but that do not add anything important and may clutter the
extraction results. By adding concepts to the exclude dictionary, you can make sure that they are never
extracted.
By excluding concepts, all variations of the excluded concept disappear from your extraction results the
next time that you extract. If this concept already appears as a descriptor in a category, it will remain in
the category with a zero count after reextraction.
When you exclude, these changes are recorded in an exclude dictionary in the Resource Editor. If you
want to view all of the exclude definitions and edit them directly, you may prefer to work directly in the
Resource Editor. See the topic “Exclude Dictionaries” on page 191 for more information.
Note: With Japanese text, there some instances where excluding a term or type will not result in excluding
it. This is due to internal dictionaries that take precedence during extraction for some basic terms for
Japanese resources.
Note: Japanese text extraction is available in IBM SPSS Modeler Premium.
To Exclude Concepts
1. In either the Extraction Results pane, Data pane, Category Definitions dialog box, or Cluster
Definitions dialog box, select the concept(s) that you want to exclude from the extraction.
2. Right-click to open the context menu.
96
IBM SPSS Modeler Text Analytics 16 User's Guide
3. Select Exclude from Extraction. The concept is added to the exclude dictionary in the Resource Editor
and the Extraction Results pane background color changes, indicating that you need to reextract to see
your changes. If you have several changes, make them before you reextract.
Note. Any words that you exclude will automatically be stored in the first library listed in the library tree
in the Resource Editor—by default, this is the Local Library.
Forcing Words into Extraction
When reviewing the text data in the Data pane after extraction, you may discover that some words or
phrases were not extracted. Often, these words are verbs or adjectives that you are not interested in.
However, sometimes you do want to use a word or phrase that was not extracted as part of a category
definition.
If you would like to have these words and phrases extracted, you can force a term into a type library. See
the topic “Forcing Terms” on page 186 for more information.
Important! Marking a term in a dictionary as forced is not foolproof. By this, we mean that even though
you have explicitly added a term to a dictionary, there are times when it may not be present in the
Extraction Results pane after you have reextracted or it does appear but not exactly as you have declared
it. Although this occurrence is rare, it can happen when a word or phrase was already extracted as part
of a longer phrase. To prevent this, apply the Entire (no compounds) match option to this term in the
type dictionary. See the topic “Adding Terms” on page 184 for more information.
Chapter 9. Extracting Concepts and Types
97
98
IBM SPSS Modeler Text Analytics 16 User's Guide
Chapter 10. Categorizing Text Data
In the Categories and Concepts view, you can create categories that represent, in essence, higher-level
concepts, or topics, that will capture the key ideas, knowledge, and attitudes expressed in the text.
As of the release of IBM SPSS Modeler Text Analytics 14, categories can also have a hierarchical structure,
meaning they can contain subcategories and those subcategories can also have subcategories of their own
and so on. You can import predefined category structures, formerly called code frames, with hierarchical
categories as well as build these hierarchical categories inside the product.
In effect, hierarchical categories enable you to build a tree structure with one or more subcategories to
group items such as different concept or topic areas more accurately. A simple example can be related to
leisure activities; answering a question such as What activity would you like to do if you had more time? you
may have top categories such as sports, art and craft, fishing, and so on; down a level, below sports, you
may have subcategories to see if this is ball games, water-related, and so on.
Categories are made up of a set of descriptors, such as concepts, types, patterns and category rules. Together,
these descriptors are used to identify whether or not a document or record belongs to a given category.
The text within a document or record can be scanned to see whether any text matches a descriptor. If a
match is found, the document/record is assigned to that category. This process is called categorization.
You can work with, build, and visually explore your categories using the data presented in the four
panes of the Categories and Concepts view, each of which can be hidden or shown by selecting its name
from the View menu.
v Categories pane. Build and manage your categories in this pane. See the topic “The Categories Pane”
on page 100 for more information.
v Extraction Results pane. Explore and work with the extracted concepts and types in this pane. See the
topic “Extraction Results: Concepts and Types” on page 85 for more information.
v Visualization pane. Visually explore your categories and how they interact in this pane. See the topic
“Category Graphs and Charts” on page 153 for more information.
v Data pane. Explore and review the text contained within documents and records that correspond to
selections in this pane. See the topic “The Data Pane” on page 107 for more information.
© Copyright IBM Corporation 2003, 2013
99
Figure 29. Categories and Concepts view
While you might start with a set of categories from a text analysis package (TAP) or import from a
predefined category file, you might also need to create your own. Categories can be created automatically
using the product's robust set of automated techniques, which use extraction results (concepts, types, and
patterns) to generate categories and their descriptors. Categories can also be created manually using
additional insight you may have regarding the data. However, you can only create categories manually or
fine-tune them through the interactive workbench. See the topic “Text Mining Node: Model Tab” on page
23 for more information. You can create category definitions manually by dragging and dropping
extraction results into the categories. You can enrich these categories or any empty category by adding
category rules to a category, using your own predefined categories, or a combination.
Each of the techniques and methods is well suited for certain types of data and situations, but often it
will be helpful to combine techniques in the same analysis to capture the full range of documents or
records. And in the course of categorization, you may see other changes to make to the linguistic
resources.
The Categories Pane
The Categories pane is the area in which you can build and manage your categories. This pane is located
in the upper left corner of the Categories and Concepts view. After extracting the concepts and types
from your text data, you can begin building categories automatically using techniques such as concept
inclusion, co-occurrence, and so on or manually. See the topic “Building Categories” on page 109 for
more information.
100
IBM SPSS Modeler Text Analytics 16 User's Guide
Each time a category is created or updated, the documents or records can be scored by clicking the Score
button to see whether any text matches a descriptor in a given category. If a match is found, the
document or record is assigned to that category. The end result is that most, if not all, of the documents
or records are assigned to categories based on the descriptors in the categories.
Category Tree Table
The tree table in this pane presents the set of categories, subcategories, and descriptors. The tree also has
several columns presenting information for each tree item. The following columns may be available for
display:
v Code. Lists the code value for each category. This column is hidden by default. You can display this
column through the menus: View > Categories Pane.
v Category. Contains the category tree showing the name of the category and subcategories.
Additionally if the descriptors toolbar icon is clicked, the set of descriptors will also be displayed.
v Descriptors. Provides the number of descriptors that make up its definition. This count does not
include the number of descriptors in the subcategories. No count is given when a descriptor name is
shown in the Categories column. You can display or hide the descriptors themselves in the tree
through the menus: View > Categories Pane > All Descriptors.
v Docs. After scoring, this column provides the number of documents or records that are categorized
into a category and all of its subcategories. So if 5 records match your top category based on its
descriptors, and 7 different records match a subcategory based on its descriptors, the total doc count
for the top category is a sum of the two-- in this case it would be 12. However, if the same record
matched the top category and its subcategory, then the count would be 11.
When no categories exist, the table still contains two rows. The top row, called All Documents, is the
total number of documents or records. A second row, called Uncategorized, shows the number of
documents/records that have yet to be categorized.
For each category in the pane, a small yellow bucket icon precedes the category name. If you double-click
a category , or choose View > Category Definitions in the menus, the Category Definitions dialog box
opens and presents all of the elements, called descriptors, that make up its definition, such as concepts,
types, patterns, and category rules. See the topic “About Categories” on page 106 for more information.
By default, the category tree table does not show the descriptors in the categories. If you want to see the
descriptors directly in the tree rather than in the Category Definitions dialog box, click the toggle button
with the pencil icon in the toolbar. When this toggle button is selected, you can expand your tree to see
the descriptors as well.
Scoring Categories
The Docs. column in the category tree table displays the number of documents or records that are
categorized into that specific category. If the numbers are out of date or are not calculated, an icon
appears in that column. You can click Score on the pane toolbar to recalculate the number of documents.
Keep in mind that the scoring process can take some time when you are working with larger datasets.
Selecting Categories in the Tree
When making selections in the tree, you can only select sibling categories -- that is to say, if you select
top level categories, you can not also select a subcategory. Or if you select 2 subcategories of a given
category, you cannot simultaneously select a subcategory of another category. Selecting a discontiguous
category will result in the loss of the previous selection.
Displaying in Data and Visualization Panes
Chapter 10. Categorizing Text Data
101
When you select a row in the table, you can click the Display button to refresh the Visualization and
Data panes with information corresponding to your selection. If a pane is not visible, clicking Display
will cause the pane to appear.
Refining Your Categories
Categorization may not yield perfect results for your data on the first try, and there may well be
categories that you want to delete or combine with other categories. You may also find, through a review
of the extraction results, that there are some categories that were not created that you would find useful.
If so, you can make manual changes to the results to fine-tune them for your particular context. See the
topic “Editing and Refining Categories” on page 138 for more information.
Methods and Strategies for Creating Categories
If you have not yet extracted or your extraction results are out of date, the use of one of the category
building or extending techniques will prompt you for an extraction automatically. After you have applied
a technique, the concepts and types that were grouped into a category are still available for category
building with other techniques. This means that you may see a concept in multiple categories unless you
choose not to reuse them.
In order to help you create the best categories, please review the following:
v Methods for creating categories
v Strategies for creating categories
v Tips for creating categories
Methods for Creating Categories
Because every dataset is unique, the number of category creation methods and the order in which you
apply them may change over time. Additionally, since your text mining goals may be different from one
set of data to the next, you may need to experiment with the different methods to see which one
produces the best results for the given text data. None of the automatic techniques will perfectly
categorize your data; therefore we recommend finding and applying one or more automatic techniques
that work well with your data.
Besides using text analysis packages (TAPs, *.tap) with prebuilt category sets, you can also categorize
your responses using any combination of the following methods:
v Automatic building techniques. Several linguistic-based and frequency-based category options are
available to automatically build categories for you. See the topic “Building Categories” on page 109 for
more information.
v Automatic extending techniques. Several linguistic techniques are available to extend existing
categories by adding and enhancing descriptors so that they capture more records. See the topic
“Extending Categories” on page 119 for more information.
v Manual techniques. There are several manual methods, such as drag-and-drop. See the topic “Creating
Categories Manually” on page 121 for more information.
Strategies for Creating Categories
The following list of strategies is by no means exhaustive but it can provide you with some ideas on how
to approach the building of your categories.
v When you define the Text Mining node, select a category set from a text analysis package (TAP) so that
you begin your analysis with some prebuilt categories. These categories may sufficiently categorize
your text right from the start. However, if you want to add more categories, you can edit the Build
Categories settings (Categories > Build Settings). Open the Advanced Settings: Linguistics dialog and
choose the Category input option Unused extraction results and build the additional categories.
102
IBM SPSS Modeler Text Analytics 16 User's Guide
v When you define the node, select a category set from a TAPin the Categories and Concepts view in the
Interactive Workbench. Next, drag and drop unused concepts or patterns into the categories as you
deem appropriate. Then, extend the existing categories you've just edited (Categories > Extend
Categories) to obtain more descriptors that are related to the existing category descriptors.
v Build categories automatically using the advanced linguistic settings (Categories > Build Categories).
Then, refine the categories manually by deleting descriptors, deleting categories, or merging similar
categories until you are satisfied with the resulting categories. Additionally, if you originally built
categories without using the Generalize with wildcards where possible option, you can also try to
simplify the categories automatically using the Extend Categories using the Generalize option.
v Import a predefined category file with very descriptive category names and/or annotations.
Additionally, if you originally imported without choosing the option to import or generate descriptors
from category names, you can later use the Extend Categories dialog and choose the Extend empty
categories with descriptors generated from the category name. option. Then, extend those categories a
second time but use the grouping techniques this time.
v Manually create a first set of categories by sorting concepts or concept patterns by frequency and then
dragging and dropping the most interesting ones to the Categories pane. Once you have that initial set
of categories, use the Extend feature (Categories > Extend Categories) to expand and refine all of the
selected categories so they'll include other related descriptors and thereby match more records.
After applying these techniques, we recommend that you review the resulting categories and use manual
techniques to make minor adjustments, remove any misclassifications, or add records or words that may
have been missed. Additionally, since using different techniques may produce redundant categories, you
could also merge or delete categories as needed. See the topic “Editing and Refining Categories” on page
138 for more information.
Tips for Creating Categories
In order to help you create better categories, you can review some tips that can help you make decisions
on your approach.
Tips on Category-to-Document Ratio
The categories into which the documents and records are assigned are not often mutually exclusive in
qualitative text analysis for at least two reasons:
v First, a general rule of thumb says that the longer the text document or record, the more distinct the
ideas and opinions expressed. Thus, the chances that a document or record can be assigned multiple
categories is greatly increased.
v Second, often there are various ways to group and interpret text documents or records that are not
logically separate. In the case of a survey with an open-ended question about the respondent's political
beliefs, we could create categories, such as Liberal and Conservative, or Republican and Democrat, as well
as more specific categories, such as Socially Liberal, Fiscally Conservative, and so forth. These categories
do not have to be mutually exclusive and exhaustive.
Tips on Number of Categories to Create
Category creation should flow directly from the data—as you see something interesting with respect to
your data, you can create a category to represent that information. In general, there is no recommended
upper limit on the number of categories that you create. However, it is certainly possible to create too
many categories to be manageable. Two principles apply:
v Category frequency. For a category to be useful, it has to contain a minimum number of documents or
records. One or two documents may include something quite intriguing, but if they are one or two out
of 1,000 documents, the information they contain may not be frequent enough in the population to be
practically useful.
Chapter 10. Categorizing Text Data
103
v Complexity. The more categories you create, the more information you have to review and summarize
after completing the analysis. However, too many categories, while adding complexity, may not add
useful detail.
Unfortunately, there are no rules for determining how many categories are too many or for determining
the minimum number of records per category. You will have to make such determinations based on the
demands of your particular situation.
We can, however, offer advice about where to start. Although the number of categories should not be
excessive, in the early stages of the analysis it is better to have too many rather than too few categories. It
is easier to group categories that are relatively similar than to split off cases into new categories, so a
strategy of working from more to fewer categories is usually the best practice. Given the iterative nature
of text mining and the ease with which it can be accomplished with this software program, building
more categories is acceptable at the start.
Choosing the Best Descriptors
The following information contains some guidelines for choosing or making the best descriptors
(concepts, types, TLA patterns, and category rules) for your categories. Descriptors are the building
blocks of categories. When some or all of the text in a document or record matches a descriptor, the
document or record is matched to the category.
Unless a descriptor contains or corresponds to an extracted concept or pattern, it will not be matched to
any documents or records. Therefore, use concepts, types, patterns, and category rules as described in the
following paragraphs.
Since concepts represent not only themselves but also a set of underlying terms that can range from
plural/singular forms, to synonyms, to spelling variations, only the concept itself should be used as a
descriptor or as part of a descriptor. To learn more about the underlying terms for any given concept,
click on the concept name in the Extraction Results pane of the Categories and Concepts view. When you
hover over the concept name, a tooltip appears and displays any of the underlying terms found in your
text during the last extraction. Not all concepts have underlying terms. For example, if car and vehicle
were synonyms but car was extracted as the concept with vehicle as an underlying term, then you only
want to use car in a descriptor since it will automatically match document or records with vehicle.
Concepts and Types as Descriptors
Use a concept as a descriptor when you want to find all documents or records containing that concept (or
any of its underlying terms). In this case, the use of a more complex category rule is not needed since the
exact concept name is sufficient. Keep in mind that when you use resources that extract opinions,
sometimes concepts can change during TLA pattern extraction to capture the truer sense of the sentence
(refer to the example in the next section on TLA).
For example, a survey response indicating each person’s favorite fruits such as “Apple and pineapple are the
best” could result in the extraction of apple and pineapple. By adding the concept apple as a descriptor to
your category, all responses containing the concept apple (or any of its underlying terms) are matched to
that category.
However, if you are interested in simply knowing which responses mention apple in any way, you can
write a category rule such as * apple * and you will also capture responses that contain concepts such as
apple, apple sauce, or french apple tart.
You can also capture all the documents or records that contain concepts that were typed the same way by
using a type as a descriptor directly such as <Fruit>. Please note that you cannot use * with types.
See the topic “Extraction Results: Concepts and Types” on page 85 for more information.
104
IBM SPSS Modeler Text Analytics 16 User's Guide
Text Link Analysis (TLA) Patterns as Descriptors
Use a TLA pattern result as a descriptor when you want to capture finer, nuanced ideas. When text is
analyzed during TLA extraction, the text is processed one sentence, or clause, at a time rather than
looking at the entire text (the document or record). By considering all of the parts of a single sentence
together, TLA can identify opinions, relationships between two elements, or a negation, for example, and
understand the truer sense. You can use concept patterns or type patterns as descriptors. See the topic
“Type and Concept Patterns” on page 149 for more information.
For example, if we had the text "the room was not that clean", the following concepts could be extracted:
room and clean. However, if TLA extraction was enabled in the extraction setting, TLA could detect that
clean was used in a negative way and actually corresponds to not clean, which is a synonym of the
concept dirty. Here, you can see that using the concept clean as a descriptor on its own would match
this text but could also capture other document or or records mentioning cleanliness. Therefore, it might
be better to use the TLA concept pattern with dirty as output concept since it would match this text and
likely be a more appropriate descriptor.
Category Business Rules as Descriptors
Category rules are statements that automatically classify documents or records into a category based on a
logical expression using extracted concepts, types, and patterns as well as Boolean operators. For
example, you could write an expression that means include all records that contain the extracted concept
embassy but not argentina in this category.
You can write and use category rules as descriptors in your categories to express several different ideas
using &, |, and !() Booleans. For detailed information on the syntax of these rules and how to write and
edit them, see “Using Category Rules” on page 123.
v Use a category rule with the & (AND) Boolean operator to help you find documents or records in
which 2 or more concepts occur. The 2 or more concepts connected by & operators do not need to
occur in the same sentence or phrase, but can occur anywhere in the same document or record to be
considered a match to the category. For example, if you create the category rule food & cheap as a
descriptor, it would match a record containing the text, "the food was pretty expensive, but the rooms were
cheap" despite the fact that food was not the noun being called cheap since the text contained both food
and cheap.
v Use a category rule with the !() (NOT) Boolean operator as a descriptor to help you find documents
or records in which some things occur but others do not. This can help avoid grouping information
that may seem related based on words but not on context. For example, if you create the category rule
<Organization> & !(ibm) as a descriptor, it would match the following text SPSS Inc. was a company
founded in 1967 and not match the following text the software company was acquired by IBM..
v Use a category rule with the | (OR) Boolean operator as a descriptor to help you find documents or
records containing one of several concepts or types. For example, if you create the category rule
(personnel|staff|team|coworkers) & bad as a descriptor, it would match any documents or records in
which any of those nouns are found with the concept bad.
v Use types in category rules to make them more generic and possibly more deployable. For example, if
you were working with hotel data, you might be very interested in learning what customers think
about hotel personnel. Related terms might include words such as receptionist, waiter, waitress,
reception desk, front desk and so on. You could, in this case, create a new type called <HotelStaff>
and add all of the preceding terms to that type. While it is possible to create one category rule for
every kind of staff such as [* waitress * & nice], [* desk * & friendly], [* receptionist * &
accommodating], you could create a single, more generic category rule using the <HotelStaff> type to
capture all responses that have favorable opinions of the hotel staff in the form of [<HotelStaff> &
<Positive>].
Note: You can use both + and & in category rules when including TLA patterns in those rules. See the
topic “Using TLA Patterns in Category Rules” on page 125 for more information.
Chapter 10. Categorizing Text Data
105
Example of how concepts, TLA, or category rules as descriptors match differently
The following example demonstrates how using a concept as a descriptor, category rule as a descriptor,
or using a TLA pattern as a descriptor affects how documents or records are categorized. Let’s say you
had the following 5 records.
v A: "awesome restaurant staff, excellent food and rooms comfortable and clean."
v B: "restaurant personnel was awful, but rooms were clean."
v C: "Comfortable, clean rooms."
v D: "My room was not that clean."
v E: "Clean."
Since the records include the word clean and you want to capture this information, you could create one
of the descriptors shown in the following table. Based on the essence you are trying to capture, you can
see how using one kind of descriptor over another can produce different results.
Table 17. How Example Records Matched Descriptors.
Descriptor
clean
clean + .
[clean]
A
B
C
D
E
Explanation
match
match
match
match
match
Descriptor is an extracted concept.
Every record contained the concept
clean, even record D since without
TLA, it is not known automatically
that “not clean” means dirty by the
TLA rules.
-
-
-
-
match
Descriptor is a TLA pattern that
represents clean by itself. Matched
only the record where clean was
extracted with no associated concept
during TLA extraction.
match
match
match
-
match
Descriptor is a category rule that
looks for a TLA rule that contains
clean on its own or with something
else. Matched all records where a
TLA output containing clean was
found regardless of whether clean
was linked to another concept such as
room and in any slot position.
About Categories
Categories refer to a group of closely related concepts, opinions, or attitudes. To be useful, a category
should also be easily described by a short phrase or label that captures its essential meaning.
For example, if you are analyzing survey responses from consumers about a new laundry soap, you can
create a category labeled odor that contains all of the responses describing the smell of the product.
However, such a category would not differentiate between those who found the smell pleasant and those
who found it offensive. Since IBM SPSS Modeler Text Analytics is capable of extracting opinions when
using the appropriate resources, you could then create two other categories to identify respondents who
enjoyed the odor and respondents who disliked the odor.
You can create and work with your categories in the Categories pane in the upper left pane of the
Categories and Concepts view window. Each category is defined by one or more descriptors. Descriptors
are concepts, types, and patterns, as well as category rules that have been used to define a category.
106
IBM SPSS Modeler Text Analytics 16 User's Guide
If you want to see the descriptors that make up a given category, you can click the pencil icon in the
Categories pane toolbar and then expand the tree to see the descriptors. Alternatively, select the category
and open the Category Definitions dialog box (View > Category Definitions).
When you build categories automatically using category building techniques such as concept inclusion,
the techniques will use concepts and types as the descriptors to create your categories. If you extract TLA
patterns, y ou can also add patterns or parts of those patterns as category descriptors. See the topic
Chapter 12, “Exploring Text Link Analysis,” on page 147 for more information. And if you build clusters,
you can add the concepts in a cluster to new or existing categories. Lastly, you can manually create
category rules to use as descriptors in your categories. See the topic “Using Category Rules” on page 123
for more information.
Category Properties
In addition to descriptors, categories also have properties you can edit in order to rename categories, add
a label, or add an annotation.
The following properties exist:
v Name. This name appears in the tree by default. When a category is created using an automated
technique, it is given a name automatically.
v Label. Using labels is helpful in creating more meaningful category descriptions for use in other
products or in other tables or graphs. If you choose the option to display the label, then the label is
used in the interface to identify the category.
v Code. The code number corresponds to the code value for this category. .
v Annotation. You can add a short description for each category in this field. When a category is
generated by the Build Categories dialog, a note is added to this annotation automatically. You can also
add sample text to an annotation directly from the Data pane by selecting the text and choosing
Categories > Add to Annotation from the menus.
The Data Pane
As you create categories, there may be times when you might want to review some of the text data you
are working with. For example, if you create a category in which 640 documents are categorized, you
might want to look at some or all of those documents to see what text was actually written. You can
review records or documents in the Data pane, which is located in the lower right. If not visible by
default, choose View > Panes > Data from the menus.
The Data pane presents one row per document or record corresponding to the selection in the Categories
pane, Extraction Results pane, or the Category Definitions dialog box up to a certain display limit. By
default, the number of documents or records shown in the Data pane is limited in order to allow you to
see your data more quickly. However, you can adjust this in the Options dialog box. See the topic
“Options: Session Tab” on page 80 for more information.
Displaying and Refreshing the Data Pane
The Data pane does not refresh its display automatically because with larger datasets automatic data
refreshing could take some time to complete. Therefore, whenever you make a selection in another pane
in this view or the Category Definitions dialog box, click Display to refresh the contents of the Data
pane.
Text Documents or Records
If your text data is in the form of records and the text is relatively short in length, the text field in the
Data pane displays the text data in its entirety. However, when working with records and larger datasets,
the text field column shows a short piece of the text and opens a Text Preview pane to the right to
Chapter 10. Categorizing Text Data
107
display more or all of the text of the record you have selected in the table. If your text data is in the form
of individual documents, the Data pane shows the document's filename. When you select a document,
the Text Preview pane opens with the selected document's text.
Colors and Highlighting
Whenever you display the data, concepts and descriptors found in those documents or records are
highlighted in color to help you easily identify them in the text. The color coding corresponds to the
types to which the concepts belong. You can also hover your mouse over color-coded items to display the
concept under which it was extracted and the type to which it was assigned. Any text that was not
extracted appears in black. Typically, these unextracted words are often connectors (and or with),
pronouns (me or they), and verbs (is, have, or take).
Data Pane Columns
While the text field column is always visible, you can also display other columns. To display other
columns, choose View > Data Pane from the menus, and then select the column that you want to display
in the Data pane. The following columns may be available for display:
v "Text field name" (#)/Documents. Adds a column for the text data from which concepts and type were
extracted. If your data is in documents, the column is called Documents and only the document
filename or full path is visible. To see the text for those documents you must look in the Text Preview
pane. The number of rows in the Data pane is shown in parentheses after this column name. There
may be times when not all documents or records are shown due to a limit in the Options dialog used
to increase the speed of loading. If the maximum is reached, the number will be followed by - Max.
See the topic “Options: Session Tab” on page 80 for more information.
v Categories. Lists each of the categories to which a record belongs. Whenever this column is shown,
refreshing the Data pane may take a bit longer so as to show the most up-to-date information.
v Relevance Rank. Provides a rank for each record in a single category. This rank shows how well the
record fits into the category compared to the other records in that category. Select a category in the
Categories pane (upper left pane) to see the rank. See the topic “Category Relevance” for more
information.
v Category Count. Lists the number of the categories to which a record belongs.
Category Relevance
To help you build better categories, you can review the relevance of the documents or records in each
category as well as the relevance of all categories to which a document or record belongs.
Relevance of a Category to a Record
Whenever a document or record appears in the Data pane, all categories to which it belongs are listed in
the Categories column. When a document or record belongs to multiple categories, the categories in this
column appear in order from the most to the least relevant match. The category listed first is thought to
correspond best to this document or record. See the topic “The Data Pane” on page 107 for more
information.
Relevance of a Record to a Category
When you select a category, you can review the relevance of each of its records in the Relevance Rank
column in the Data pane. This relevance rank indicates how well the document or record fits into the
selected category compared to the other records in that category. To see the rank of the records for a
single category, select this category in the Categories pane (upper left pane) and the rank for document or
record appears in the column. This column is not visible by default but you can choose to display it. See
the topic “The Data Pane” on page 107 for more information.
108
IBM SPSS Modeler Text Analytics 16 User's Guide
The lower the number for the record’s rank, the better the fit or the more relevant this record is to the
selected category such that 1 is the best fit. If more than one record has the same relevance, each appears
with the same rank followed by an equal sign (=) to denote they have equal relevance. For example, you
might have the following ranks 1=, 1=, 3, 4, and so on, which means that there are two records that are
equally considered as best matches for this category.
Tip: You could add the text of the most relevant record to the category annotation to help provide a
better description of the category. Add the text directly from the Data pane by selecting the text and
choosing Categories > Add to Annotation from the menus.
Building Categories
While you may have categories from a text analysis package, you can also build categories automatically
using a number of linguistic and frequency techniques. Through the Build Categories Settings dialog box,
you can apply the automated linguistic and frequency techniques to produce categories from either
concepts or from concept patterns.
In general, categories can be made up of different kinds of descriptors (types, concepts, TLA patterns,
category rules). When you build categories using the automated category building techniques, the
resulting categories are named after a concept or concept pattern (depending on the input you select) and
each contains a set of descriptors. These descriptors may be in the form of category rules or concepts and
include all the related concepts discovered by the techniques.
After building categories, you can learn a lot about the categories by reviewing them in the Categories
pane or exploring them through the graphs and charts. You can then use manual techniques to make
minor adjustments, remove any misclassifications, or add records or words that may have been missed.
After you have applied a technique, the concepts, types, and patterns that were grouped into a category
are still available for other techniques. Also, since using different techniques may also produce redundant
or inappropriate categories, you can also merge or delete categories. See the topic “Editing and Refining
Categories” on page 138 for more information.
Important! In earlier releases, co-occurrence and synonym rules were surrounded by square brackets. In
this release, square brackets now indicate a text link analysis pattern result. Instead, co-occurrence and
synonym rules will be encapsulated by parentheses such as (speaker systems|speakers).
To Build Categories
1. From the menus, choose Categories > Build Categories. Unless you have chosen to never prompt, a
message box is displayed.
2. Choose whether you want to build now or edit the settings first.
v Click Build Now to begin building categories using the current settings. The settings selected by
default are often sufficient to begin the categorization process. The category building process begins
and a progress dialog appears.
v Click Edit to review and modify the build settings.
Note: The maximum number of categories that can be displayed is 10,000. A warning is displayed if this
number is reached or exceeded. If this happens you should change your Build or Extend Categories
options to reduce the number of categories built.
Inputs
The categories are built from descriptors derived from either type patterns or types. In the table, you can
select the individual types or patterns to include in the category building process.
Type patterns. If you select type patterns, categories are built from patterns rather than types and
concepts on their own. In that way, any records or documents containing a concept pattern belonging to
Chapter 10. Categorizing Text Data
109
the selected type pattern are categorized. So, if you select the <Budget> and <Positive> type pattern in
the table, categories such as cost & <Positive> or rates & excellent could be produced.
When using type patterns as input for automated category building, there are times when the techniques
identify multiple ways to form the category structure. Technically, there is no single right way to produce
the categories; however you might find one structure more suited to your analysis than another. To help
customize the output in this case, you can designate a type as the preferred focus. All the top-level
categories produced will come from a concept of the type you select here (and no other type). Every
subcategory will contain a text link pattern from this type. Choose this type in the Structure categories
by pattern type: field and the table will be updated to show only the applicable patterns containing the
selected type. More often than not, <Unknown> will be preselected for you. This results in all of the
patterns containing the type <Unknown> (for non-Japanese text) being selected. . The table displays the
types in descending order starting with the one with the greatest number of records or documents (Doc.
count).
Types. If you select types, the categories will be built from the concepts belonging to the selected types.
So if you select the <Budget> type in the table, categories such as cost or price could be produced since
cost and price are concepts assigned to the <Budget> type.
By default, only the types that capture the most records or documents are selected. This pre-selection
allows you to quickly focus in on the most interesting types and avoid building uninteresting categories.
The table displays the types in descending order starting with the one with the greatest number of
records or documents (Doc. count). Types from the Opinions library are deselected by default in the types
table.
The input you choose affects the categories you obtain. When you choose to use Types as input, you can
see the clearly related concepts more easily. For example, if you build categories using Types as input,
you could obtain a category Fruit with concepts such as apple, pear, citrus fruits, orange and so on. If
you choose Type Patterns as input instead and select the pattern <Unknown> + <Positive>, for example,
then you might get a category fruit + <Positive> with one or two kinds of fruit such as fruit + tasty
and apple + good. This second result only shows 2 concept patterns because the other occurrences of fruit
are not necessarily positively qualified. And while this might be good enough for your current text data,
in longitudinal studies where you use different document sets, you may want to manually add in other
descriptors such as citrus fruit + positive or use types. Using types alone as input will help you to
find all possible fruit.
Techniques
Because every dataset is unique, the number of methods and the order in which you apply them may
change over time. Since your text mining goals may be different from one set of data to the next, you
may need to experiment with the different techniques to see which one produces the best results for the
given text data.
You do not need to be an expert in these settings to use them. By default, the most common and average
settings are already selected. Therefore, you can bypass the advanced setting dialogs and go straight to
building your categories. Likewise, if you make changes here, you do not have to come back to the
settings dialog each time since the latest settings are always retained.
Select either the linguistic or frequency techniques and click the Advanced Settings button to display the
settings for the techniques selected. None of the automatic techniques will perfectly categorize your data;
therefore we recommend finding and applying one or more automatic techniques that work well with
your data.You cannot build using linguistic and frequency techniques simultaneously.
v Advanced linguistic techniques. For more information, see “Advanced Linguistic Settings” on page
111.
110
IBM SPSS Modeler Text Analytics 16 User's Guide
v
Advanced frequency techniques. For more information, see “Advanced Frequency Settings” on page
118.
Advanced Linguistic Settings
When you build categories, you can select from a number of advanced linguistic category building
techniques including concept root derivation (not available for Japanese), concept inclusion, semantic networks
(English text only), and co-occurrence rules. These techniques can be used individually or in combination
with each other to create categories.
Keep in mind that because every dataset is unique, the number of methods and the order in which you
apply them may change over time. Since your text mining goals may be different from one set of data to
the next, you may need to experiment with the different techniques to see which one produces the best
results for the given text data. None of the automatic techniques will perfectly categorize your data;
therefore we recommend finding and applying one or more automatic techniques that work well with
your data.
The following areas and fields are available within the Advanced Settings: Linguistics dialog box:
Input and Output
Category input. Select from what the categories will be built:
v Unused extraction results. This option enables categories to be built from extraction results that are not
used in any existing categories. This minimizes the tendency for records to match multiple categories
and limits the number of categories produced.
v All extraction results. This option enables categories to be built using any of the extraction results.
This is most useful when no or few categories already exist.
Category output. Select the general structure for the categories that will be built:
v Hierarchical with subcategories. This option enables the creation of subcategories and
sub-subcategories. You can set the depth of your categories by choosing the maximum number of
levels (Maximum levels created field) that can be created. If you choose 3, categories could contain
subcategories and those subcategories could also have subcategories.
v Flat categories (single level only). This option enables only one level of categories to be built,
meaning that no subcategories will be generated.
Grouping Techniques
Each of the techniques available is well suited to certain types of data and situations, but often it is
helpful to combine techniques in the same analysis to capture the full range of documents or records. You
may see a concept in multiple categories or find redundant categories.
Concept Root Derivation. This technique creates categories by taking a concept and finding other
concepts that are related to it by analyzing whether any of the concept components are morphologically
related, or share roots. This technique is very useful for identifying synonymous compound word
concepts, since the concepts in each category generated are synonyms or closely related in meaning. It
works with data of varying lengths and generates a smaller number of compact categories. For example,
the concept opportunities to advance would be grouped with the concepts opportunity for
advancement and advancement opportunity. See the topic “Concept Root Derivation” on page 114 for
more information. This option is not available for Japanese text.
Semantic Network. This technique begins by identifying the possible senses of each concept from its
extensive index of word relationships and then creates categories by grouping related concepts. This
technique is best when the concepts are known to the semantic network and are not too ambiguous. It is
less helpful when text contains specialized terminology or jargon unknown to the network. In one
Chapter 10. Categorizing Text Data
111
example, the concept granny smith apple could be grouped with gala apple and winesap apple since
they are siblings of the granny smith. In another example, the concept animal might be grouped with cat
and kangaroo since they are hyponyms of animal. This technique is available for English text only in this
release. See the topic “Semantic Networks” on page 115 for more information.
Concept Inclusion. This technique builds categories by grouping multiterm concepts (compound words)
based on whether they contain words that are subsets or supersets of a word in the other. For example,
the concept seat would be grouped with safety seat, seat belt, and seat belt buckle. See the topic
“Concept Inclusion” on page 115 for more information.
Co-occurrence. This technique creates categories from co-occurrences found in the text. The idea is that
when concepts or concept patterns are often found together in documents and records, that co-occurrence
reflects an underlying relationship that is probably of value in your category definitions. When words
co-occur significantly, a co-occurrence rule is created and can be used as a category descriptor for a new
subcategory. For example, if many records contain the words price and availability (but few records
contain one without the other), then these concepts could be grouped into a co-occurrence rule, (price &
available) and assigned to a subcategory of the category price for instance. See the topic
“Co-occurrence Rules” on page 117 for more information.
Minimum number of documents. To help determine how interesting co-occurrences are, define the
minimum number of documents or records that must contain a given co-occurrence for it to be used as a
descriptor in a category.
Maximum search distance. Select how far you want the techniques to search before producing categories.
The lower the value, the fewer results you will get—however, these results will be less noisy and are
more likely to be significantly linked or associated with each other. The higher the value, the more results
you might get—however, these results may be less reliable or relevant. While this option is globally
applied to all techniques, its effect is greatest on co-occurrences and semantic networks.
Prevent pairing of specific concepts. Select this checkbox to stop the process from grouping or pairing
two concepts together in the output. To create or manage concept pairs, click Manage Pairs... See the
topic “Managing Link Exception Pairs” on page 113 for more information.
Generalize with wildcards where possible. Select this option to allow the product to generate generic
rules in categories using the asterisk wildcard. For example, instead of producing multiple descriptors
such as [apple tart + .] and [apple sauce + .], using wildcards might produce [apple * + .]. If you
generalize with wildcards, you will often get exactly the same number of records or documents as you
did before. However, this option has the advantage of reducing the number and simplifying category
descriptors. Additionally, this option increases the ability to categorize more records or documents using
these categories on new text data (for example, in longitudinal/wave studies).
Other Options for Building Categories
In addition to selecting the grouping techniques to apply, you can edit several other build options as
follow:
Maximum number of top level categories created. Use this option to limit the number of categories that
can be generated when you click the Build Categories button next. In some cases, you might get better
results if you set this value high and then delete any of the uninteresting categories.
Minimum number of descriptors and/or subcategories per category. Use this option to define the
minimum number of descriptors and subcategories a category must contain in order to be created. This
option helps limit the creation of categories that do not capture a significant number of records or
documents.
112
IBM SPSS Modeler Text Analytics 16 User's Guide
Allow descriptors to appear in more than one category. When selected, this option allows descriptors to
be used in more than one of the categories that will be built next. This option is generally selected since
items commonly or "naturally" fall into two or more categories and allowing them to do so usually leads
to higher quality categories. If you do not select this option, you reduce the overlap of records in multiple
categories and depending on the type of data you have, this might be desirable. However, with most
types of data, restricting descriptors to a single category usually results in a loss of quality or category
coverage. For example, let's say you had the concept car seat manufacturer. With this option, this
concept could appear in one category based on the text car seat and in another one based on
manufacturer. But if this option is not selected, although you may still get both categories, the concept
car seat manufacturer will only appear as a descriptor in the category it best matches based on several
factors including the number of records in which car seat and manufacturer each occur.
Resolve duplicate category names by. Select how to handle any new categories or subcategories whose
names would be the same as existing categories. You can either merge the new ones (and their
descriptors) with the existing categories with the same name. Alternatively, you can choose to skip the
creation of any categories if a duplicate name is found in the existing categories.
Managing Link Exception Pairs
During category building, clustering, and concept mapping, the internal algorithms group words by
known associations. To prevent two concepts from being paired, or linked together, you can turn on this
feature in Build Categories Advanced Settings dialog, Build Clusters dialog, and Concept Map Index
Settings dialog and click the Manage Pairs button.
In the resulting Manage Link Exceptions dialog, you can add, edit, or delete concept pairs. Enter one
pair per line. Entering pairs here will prevent the pairing from occurring when building or extending
categories, clustering, and concept mapping. Enter words exactly as you want them, for example the
accented version of word is not equal to the unaccented version of the word.
For example, if you wanted to make sure that hot dog and dog are not grouped, you could add the pair
as a separate line in the table.
About Linguistic Techniques
When you build or extend you categories, you can select from a number of advanced linguistic category
building techniques including concept root derivation (not available for Japanese), concept inclusion, semantic
networks (English only), and co-occurrence rules. These techniques can be used individually or in
combination with each other to create categories.
You do not need to be an expert in these settings to use them. By default, the most common and average
settings are already selected. If you want, you can bypass this advanced setting dialog and go straight to
building or extending your categories. Likewise, if you make changes here, you do not have to come back
to the settings dialog each time since it will remember what you last used.
However, keep in mind that because every dataset is unique, the number of methods and the order in
which you apply them may change over time. Since your text mining goals may be different from one set
of data to the next, you may need to experiment with the different techniques to see which one produces
the best results for the given text data. None of the automatic techniques will perfectly categorize your
data; therefore we recommend finding and applying one or more automatic techniques that work well
with your data.
The main automated linguistic techniques for category building are:
v Concept root derivation. This technique creates categories by taking a concept and finding other
concepts that are related to it through analyzing whether any of the concept components are
morphologically related. See the topic “Concept Root Derivation” on page 114 for more information.
This option is not available for Japanese text.
Chapter 10. Categorizing Text Data
113
v Concept inclusion. This technique creates categories by taking a concept and finding other concepts
that include it. See the topic “Concept Inclusion” on page 115 for more information.
v Semantic network. This technique begins by identifying the possible senses of each concept from its
extensive index of word relationships and then creates categories by grouping related concepts. See the
topic “Semantic Networks” on page 115 for more information. This option is only available for English
text.
v Co-occurrence. This technique creates co-occurrence rules that can be used to create a new category,
extend a category, or as input to another category technique. See the topic “Co-occurrence Rules” on
page 117 for more information.
Concept Root Derivation
Note: This technique is not available for Japanese text.
The concept root derivation technique creates categories by taking a concept and finding other concepts
that are related to it through analyzing whether any of the concept components are morphologically
related. A component is a word. The technique attempts to group concepts by looking at the endings
(suffixes) of each component in a concept and finding other concepts that could be derived from them.
The idea is that when words are derived from each other, they are likely to share or be close in meaning.
In order to identify the endings, internal language-specific rules are used. For example, the concept
opportunities to advance would be grouped with the concepts opportunity for advancement and
advancement opportunity.
You can use concept root derivation on any sort of text. By itself, it produces fairly few categories, and
each category tends to contain few concepts. The concepts in each category are either synonyms or
situationally related. You may find it helpful to use this algorithm even if you are building categories
manually; the synonyms it finds may be synonyms of those concepts you are particularly interested in.
Note: You can prevent concepts from being grouped together by specifying them explicitly. See the topic
“Managing Link Exception Pairs” on page 113 for more information.
Term Componentization and De-inflecting
When the concept root derivation or the concept inclusion techniques are applied, the terms are first
broken down into components (words) and then the components are de-inflected. When a technique is
applied, the concepts and their associated terms are loaded and split into components based on
separators, such as spaces, hyphens, and apostrophes. For example, the term system administrator is
split into components such as {administrator, system}.
However, some parts of the original term may not be used and are referred to as stop words. In English,
some of these ignorable components might include a, and, as, by, for, from, in, of, on, or, the, to, and
with.
For example, the term examination of the data has the component set {data, examination}, and both
of and the are considered ignorable. Additionally, component order is not in a component set. In this
way, the following three terms could be equivalent: cough relief for child, child relief from a cough,
and relief of child cough since they all have the same component set {child, cough, relief}. Each
time a pair of terms are identified as being equivalent, the corresponding concepts are merged to form a
new concept that references all of the terms.
Additionally, since the components of a term may be inflected, language-specific rules are applied
internally to identify equivalent terms regardless of inflectional variation, such as plural forms. In this
way, the terms level of support and support levels can be identified as equivalent since the
de-inflected singular form would be level.
How Concept Root Derivation Works
114
IBM SPSS Modeler Text Analytics 16 User's Guide
After terms have been componentized and de-inflected (see previous section), the concept root derivation
algorithm analyzes the component endings, or suffixes, to find the component root and then groups the
concepts with other concepts that have the same or similar roots. The endings are identified using a set of
linguistic derivation rules specific to the text language. For example, there is a derivation rule for English
language text that states that a concept component ending with the suffix ical might be derived from a
concept having the same root stem and ending with the suffix ic. Using this rule (and the de-inflection),
the algorithm would be able to group the concepts epidemiologic study and epidemiological studies.
Since terms are already componentized and the ignorable components (for example, in and of) have been
identified, the concept root derivation algorithm would also be able to group the concept studies in
epidemiology with epidemiological studies.
The set of component derivation rules has been chosen so that most of the concepts grouped by this
algorithm are synonyms: the concepts epidemiologic studies, epidemiological studies, studies in
epidemiology are all equivalent terms. To increase completeness, there are some derivation rules that
allow the algorithm to group concepts that are situationally related. For example, the algorithm can group
concepts such as empire builder and empire building.
Concept Inclusion
The concept inclusion technique builds categories by taking a concept and, using lexical series algorithms,
identifies concepts included in other concepts. The idea is that when words in a concept are a subset of
another concept, it reflects an underlying semantic relationship. Inclusion is a powerful technique that
can be used with any type of text.
This technique works well in combination with semantic networks but can be used separately. Concept
inclusion may also give better results when the documents or records contain lots of domain-specific
terminology or jargon. This is especially true if you have tuned the dictionaries beforehand so that the
special terms are extracted and grouped appropriately (with synonyms).
How Concept Inclusion Works
Before the concept inclusion algorithm is applied, the terms are componentized and de-inflected. See the
topic “Concept Root Derivation” on page 114 for more information. Next, the concept inclusion algorithm
analyzes the component sets. For each component set, the algorithm looks for another component set that
is a subset of the first component set.
For example, if you have the concept continental breakfast, which has the component set {breakfast,
continental}, and you have the concept breakfast, which has the component set {breakfast}, the
algorithm would conclude that continental breakfast is a kind of breakfast and group these together.
In a larger example, if you have the concept seat in the Extraction Results pane and you apply this
algorithm, then concepts such as safety seat, leather seat, seat belt, seat belt buckle, infant seat
carrier, and car seat laws would also be grouped in that category.
Since terms are already componentized and the ignorable components (for example, in and of) have been
identified, the concept inclusion algorithm would recognize that the concept advanced spanish course
includes the concept course in spanish.
Note: You can prevent concepts from being grouped together by specifying them explicitly. See the topic
“Managing Link Exception Pairs” on page 113 for more information.
Semantic Networks
In this release, the semantic networks technique is only available for English language text.
This technique builds categories using a built-in network of word relationships. For this reason, this
technique can produce very good results when the terms are concrete and are not too ambiguous.
Chapter 10. Categorizing Text Data
115
However, you should not expect the technique to find many links between highly technical/specialized
concepts. When dealing with such concepts, you may find the concept inclusion and concept root
derivation techniques to be more useful.
How Semantic Network Works
The idea behind the semantic network technique is to leverage known word relationships to create
categories of synonyms or hyponyms. A hyponym is when one concept is a sort of second concept such
that there is a hierarchical relationship, also known as an ISA relationship. For example, if animal is a
concept, then cat and kangaroo are hyponyms of animal since they are sorts of animals.
In addition to synonym and hyponym relationships, the semantic network technique also examines part
and whole links between any concepts from the <Location> type. For example, the technique will group
the concepts normandy, provence, and france into one category because Normandy and Provence are parts
of France.
Semantic networks begin by identifying the possible senses of each concept in the semantic network.
When concepts are identified as synonyms or hyponyms, they are grouped into a single category. For
example, the technique would create a single category containing these three concepts: eating apple,
dessert apple, and granny smith since the semantic network contains the information that: 1) dessert
apple is a synonym of an eating apple, and 2) granny smith is a sort of eating apple (meaning it is a
hyponym of eating apple).
Taken individually, many concepts, especially uniterms, are ambiguous. For example, the concept buffet
can denote a sort of meal or a piece of furniture. If the set of concepts includes meal, furniture and
buffet, then the algorithm is forced to choose between grouping buffet with meal or with furniture. Be
aware that in some cases the choices made by the algorithm may not be appropriate in the context of a
particular set of records or documents.
The semantic network technique can outperform concept inclusion with certain types of data. While both
the semantic network and concept inclusion recognize that apple pie is a sort of pie, only the semantic
network recognizes that tart is also a sort of pie.
Semantic networks will work in conjunction with the other techniques. For example, suppose that you
have selected both the semantic network and inclusion techniques and that the semantic network has
grouped the concept teacher with the concept tutor (because a tutor is a kind of teacher). The inclusion
algorithm can group the concept graduate tutor with tutor and, as a result, the two algorithms
collaborate to produce an output category containing all three concepts: tutor, graduate tutor, and
teacher.
Options for Semantic Network
There are a number of additional settings that might be of interest with this technique.
v Change the Maximum search distance. Select how far you want the techniques to search before
producing categories. The lower the value, the fewer results produced—however, these results will be
less noisy and are more likely to be significantly linked or associated with each other. The higher the
value, the more results you will get—however, these results may be less reliable or relevant.
For example, depending on the distance, the algorithm searches from Danish pastry up to coffee roll
(its parent), then bun (grand parent) and on upwards to bread.
By reducing the search distance, this technique produces smaller categories that might be easier to work
with if you feel that the categories being produced are too large or group too many things together.
116
IBM SPSS Modeler Text Analytics 16 User's Guide
Important! Additionally, we recommend that you do not apply the option Accommodate spelling errors
for a minimum root character limit of (defined on the Expert tab of the node or in the Extract dialog
box) for fuzzy grouping when using this technique since some false groupings can have a largely
negative impact on the results.
Co-occurrence Rules
Co-occurrence rules enable you to discover and group concepts that are strongly related within the set of
documents or records. The idea is that when concepts are often found together in documents and records,
that co-occurrence reflects an underlying relationship that is probably of value in your category
definitions. This technique creates co-occurrence rules that can be used to create a new category, extend a
category, or as input to another category technique. Two concepts strongly co-occur if they frequently
appear together in a set of records and rarely separately in any of the other records. This technique can
produce good results with larger datasets with at least several hundred documents or records.
For example, if many records contain the words price and availability, these concepts could be
grouped into a co-occurrence rule, (price & available). In another example, if the concepts peanut
butter, jelly, sandwich and appear more often together than apart, they would be grouped into a
concept co-occurrence rule (peanut butter & jelly & sandwich).
Important! In earlier releases, co-occurrence and synonym rules were surrounded by square brackets. In
this release, square brackets now indicate a text link analysis pattern result. Instead, co-occurrence and
synonym rules will be encapsulated by parentheses such as (speaker systems|speakers).
How Co-occurrence Rules Works
This technique scans the documents or records looking for two or more concepts that tend to appear
together. Two or more concepts strongly co-occur if they frequently appear together in a set of documents
or records and if they seldom appear separately in any of the other documents or records.
When co-occurring concepts are found, a category rule is formed. These rules consist of two or more
concepts connected using the & Boolean operator. These rules are logical statements that will
automatically classify a document or record into a category if the set of concepts in the rule all co-occur
in that document or record.
Options for Co-occurrence Rules
If you are using the co-occurrence rule technique, you can fine-tune several settings that influence the
resulting rules:
v Change the Maximum search distance. Select how far you want the technique to search for
co-occurrences. As you increase the search distance, the minimum similarity value required for each
co-occurrence is lowered; as a result, many co-occurrence rules may be produced, but those which have
a low similarity value will often be of little significance. As you reduce the search distance, the
minimum required similarity value increases; as a result, fewer co-occurrence rules are produced, but
they will tend to be more significant (stronger).
v Minimum number of documents. The minimum number of records or documents that must contain a
given pair of concepts for it to be considered as a co-occurrence; the lower you set this option, the
easier it is to find co-occurrences. Increasing the value results in fewer, but more significant,
co-occurrences. As an example, suppose that the concepts "apple" and "pear" are found together in 2
records (and that neither of the two concepts occurs in any other records). With Minimum number of
documents. set to 2 (the default), the co-occurrence technique will create a category rule (apple and
pear). If the value is raised to 3, the rule will no longer be created.
Note: With small datasets (< 1000 responses) you may not find any co-occurrences with the default
settings. If so, try increasing the search distance value.
Chapter 10. Categorizing Text Data
117
Note: You can prevent concepts from being grouped together by specifying them explicitly. See the topic
“Managing Link Exception Pairs” on page 113 for more information.
Advanced Frequency Settings
You can build categories based on a straightforward and mechanical frequency technique. With this
technique, you can build one category for each item (type, concept, or pattern) that was found above a
given record or document count. Additionally, you can build a single category for all of the less
frequently occurring items. By count, we refer to the number of records or documents containing the
extracted concept (and any of its synonyms), type, or pattern in question as opposed to the total number
of occurrences in the entire text.
Grouping frequently occurring items can yield interesting results, since it may indicate a common or
significant response. The technique is very useful on the unused extraction results after other techniques
have been applied. Another application is to run this technique immediately after extraction when no
other categories exist, edit the results to delete uninteresting categories, and then extend those categories
so that they match even more records or documents. See the topic “Extending Categories” on page 119
for more information.
Instead of using this technique, you could sort the concepts or concept patterns by descending number of
records or documents in the Extraction Results pane and then drag and drop the top ones into the
Categories pane to create the corresponding categories.
The following fields are available within the Advanced Settings: Frequencies dialog box:
Generate category descriptors at. Select the kind of input for descriptors. See the topic “Building
Categories” on page 109 for more information.
v Concepts level. Selecting this option means that concepts or concept patterns frequencies will be used.
Concepts will be used if types were selected as input for category building and concept patterns are
used, if type patterns were selected. In general, applying this technique to the concept level will
produce more specific results, since concepts and concept patterns represent a lower level of
measurement.
v Types level. Selecting this option means that type or type patterns frequencies will be used. Types will
be used if types were selected as input for category building and type patterns are used, if type
patterns were selected. Applying this technique to the type level allows you to obtain a quick view
regarding the kind of information present given.
Minimum doc. count for items to have their own category. This option allows you to build categories
from frequently occurring items. This option restricts the output to only those categories containing a
descriptor that occurred in at least X number of records or documents, where X is the value to enter for
this option.
Group all remaining items into a category called. This option allows you to group all concepts or types
occurring infrequently into a single 'catch-all' category with the name of your choice. By default, this
category is named Other.
Category input. Select the group to which to apply the techniques:
v Unused extraction results. This option enables categories to be built from extraction results that are not
used in any existing categories. This minimizes the tendency for records to match multiple categories
and limits the number of categories produced.
v All extraction results. This option enables categories to be built using any of the extraction results.
This is most useful when no or few categories already exist.
Resolve duplicate category names by. Select how to handle any new categories or subcategories whose
names would be the same as existing categories. You can either merge the new ones (and their
118
IBM SPSS Modeler Text Analytics 16 User's Guide
descriptors) with the existing categories with the same name. Alternatively, you can choose to skip the
creation of any categories if a duplicate name is found in the existing categories.
Extending Categories
Extending is a process through which descriptors are added or enhanced automatically to 'grow' existing
categories. The objective is to produce a better category that captures related records or documents that
were not originally assigned to that category.
The automatic grouping techniques you select will attempt to identify concepts, TLA patterns, and
category rules related to existing category descriptors. These new concepts, patterns, and category rules
are then added as new descriptors or added to existing descriptors. The grouping techniques for
extending include concept root derivation (not available for Japanese), concept inclusion, semantic networks
(English only), and co-occurrence rules. The Extend empty categories with descriptors generated from the
category name method generates descriptors using the words in the category names, therefore, the more
descriptive the category names, the better the results.
Note: The frequency techniques are not available when extending categories.
Extending is a great way to interactively improve your categories. Here are some examples of when you
might extend a category:
v After dragging/dropping concept patterns to create categories in the Categories pane
v After creating categories by hand and adding simple category rules and descriptors
v After importing a predefined category file in which the categories had very descriptive names
v After refining the categories that came from the TAP you chose
You can extend a category multiple times. For example, if you imported a predefined category file with
very descriptive names, you could extend using the Extend empty categories with descriptors generated
from the category name option to obtain a first set of descriptors, and then extend those categories again.
However, in other cases, extending multiple times may result in too generic a category if the descriptors
are extended wider and wider. Since the build and extend grouping techniques use similar underlying
algorithms, extending directly after building categories is unlikely to produce more interesting results.
Tips:
v If you attempt to extend and do not want to use the results, you can always undo the operation (Edit
> Undo) immediately after having extended.
v Extending can produce two or more category rules in a category that match exactly the same set of
documents since rules are built independently during the process. If desired, you can review the
categories and remove redundancies by manually editing the category description. See the topic
“Editing Category Descriptors” on page 139 for more information.
To Extend Categories
1. In the Categories pane, select the categories you want to extend.
2. From the menus, choose Categories > Extend Categories. Unless you have chosen the option to never
prompt, a message box appears.
3. Choose whether you want to build now or edit the settings first.
v Click Extend Now to begin extending categories using the current settings. The process begins and a
progress dialog appears.
v Click Edit to review and modify the settings.
After attempting to extend, any categories for which new descriptors were found are flagged by the word
Extended in the Categories pane so that you can quickly identify them. The Extended text remains until
you either extend again, edit the category in another way, or clear these through the context menu.
Chapter 10. Categorizing Text Data
119
Note: The maximum number of categories that can be displayed is 10,000. A warning is displayed if this
number is reached or exceeded. If this happens you should change your Build or Extend Categories
options to reduce the number of categories built.
Each of the techniques available when building or extending categories is well suited to certain types of
data and situations, but often it is helpful to combine techniques in the same analysis to capture the full
range of documents or records. In the interactive workbench, the concepts and types that were grouped
into a category are still available the next time you build categories. This means that you may see a
concept in multiple categories or find redundant categories.
The following areas and fields are available within the Extend Categories: Settings dialog box:
Extend with. Select what input will be used to extend the categories:
v Unused extraction results. This option enables categories to be built from extraction results that are not
used in any existing categories. This minimizes the tendency for records to match multiple categories
and limits the number of categories produced.
v All extraction results. This option enables categories to be built using any of the extraction results.
This is most useful when no or few categories already exist.
Grouping Techniques
For short descriptions of each of these techniques, see “Advanced Linguistic Settings” on page 111. These
techniques include:
v Concept root derivation (not available for Japanese)
v Semantic network (English text only, and not used if the Generalize only option is selected.)
v Concept inclusion
v Co-occurrence and Minimum number of docs. suboption.
A number of types are permanently excluded from the semantic networks technique since those types
will not produce relevant results. They include <Positive>, <Negative>, <IP>, other non linguistic types,
etc.
Maximum search distance. Select how far you want the techniques to search before producing categories.
The lower the value, the fewer results you will get—however, these results will be less noisy and are
more likely to be significantly linked or associated with each other. The higher the value, the more results
you might get—however, these results may be less reliable or relevant. While this option is globally
applied to all techniques, its effect is greatest on co-occurrences and semantic networks.
Prevent pairing of specific concepts. Select this checkbox to stop the process from grouping or pairing
two concepts together in the output. To create or manage concept pairs, click Manage Pairs... See the
topic “Managing Link Exception Pairs” on page 113 for more information.
Where possible: Choose whether to simply extend, generalize the descriptors using wildcards, or both.
v Extend and generalize. This option will extend the selected categories and then generalize the
descriptors. When you choose to generalize, the product will create generic category rules in categories
using the asterisk wildcard. For example, instead of producing multiple descriptors such as [apple
tart + .] and [apple sauce + .], using wildcards might produce [apple * + .]. If you generalize
with wildcards, you will often get exactly the same number of records or documents as you did before.
However, this option has the advantage of reducing the number and simplifying category descriptors.
Additionally, this option increases the ability to categorize more records or documents using these
categories on new text data (for example, in longitudinal/wave studies).
v Extend only. This option will extend your categories without generalizing. It can be helpful to first
choose the Extend only option for manually-created categories and then extend the same categories
again using the Extend and generalize option.
120
IBM SPSS Modeler Text Analytics 16 User's Guide
v Generalize only. This option will generalize the descriptors without extending your categories in any
other way.
Note: Selecting this option disables the Semantic network option; this is because the Semantic network
option is only available when a description is to be extended.
Other Options for Extending Categories
In addition to selecting the techniques to apply, you can edit any of the following options:
Maximum number of items to extend a descriptor by. When extending a descriptor with items
(concepts, types, and other expressions), define the maximum number of items that can be added to a
single descriptor. If you set this limit to 10, then no more than 10 additional items can be added to an
existing descriptor. If there are more than 10 items to be added, the techniques stop adding new items
after the tenth is added. Doing so can make a descriptor list shorter but doesn't guarantee that the most
interesting items were used first. You may prefer to cut down the size of the extension without penalizing
quality by using the Generalize with wildcards where possible option. This option only applies to
descriptors that contain the Booleans & (AND) or ! (NOT).
Also extend subcategories. This option will also extend any subcategories below the selected categories.
Extend empty categories with descriptors generated from the category name. This method applies only
to empty categories, which have 0 descriptors. If a category already contains descriptors, it will not be
extended in this way. This option attempts to automatically create descriptors for each category based on
the words that make up the name of the category. The category name is scanned to see if words in the
name match any extracted concepts. If a concept is recognized, it is used to find matching concept
patterns and these both are used to form descriptors for the category. This option produces the best
results when the category names are both long and descriptive. This is a quick method for generating
category descriptors, which in turn enable the category to capture records that contain those descriptors.
This option is most useful when you import categories from somewhere else or when you create
categories manually with long descriptive names.
Generate descriptors as. This option only applies if the preceding option is selected.
v Concepts. Choose this option to produce the resulting descriptors in the form of concepts, regardless of
whether they have been extracted from the source text.
v Patterns. Choose this option to produce the resulting descriptors in the form of patterns, regardless of
whether the resulting patterns or any patterns have been extracted.
Creating Categories Manually
In addition to creating categories using the automated category building techniques and the rule editor,
you can also create categories manually. The following manual methods exist:
v Creating an empty category into which you will add elements one by one. See the topic “Creating New
or Renaming Categories” for more information.
v Dragging terms, types, and patterns into the categories pane. See the topic “Creating Categories by
Drag-and-Drop” on page 122 for more information.
Creating New or Renaming Categories
You can create empty categories in order to add concepts and types into them. You can also rename your
categories.
To Create a New Empty Category
1. Go to the Categories pane.
2. From the menus, choose Categories > Create Empty Category. The Category Properties dialog box
opens.
Chapter 10. Categorizing Text Data
121
3. Enter a name for this category in the Name field.
4. Click OK to accept the name and close the dialog box. The dialog box closes and a new category
name appears in the pane.
You can now begin adding to this category. See the topic “Adding Descriptors to Categories” on page 139
for more information.
To Rename a Category
1. Select a category and choose Categories > Rename Category. The Category Properties dialog box
opens.
2. Enter a new name for this category in the Name field.
3. Click OK to accept the name and close the dialog box. The dialog box closes and a new category
name appears in the pane.
Creating Categories by Drag-and-Drop
The drag-and-drop technique is manual and is not based on algorithms. You can create categories in the
Categories pane by dragging:
v Extracted concepts, types, or patterns from the Extraction Results pane into the Categories pane.
v Extracted concepts from the Data pane into the Categories pane.
v Entire rows from the Data pane into the Categories pane. This will create a category made up of all of
the extracted concepts and patterns contained in that row.
Note: The Extraction Results pane supports multiple selection to facilitate the dragging and dropping of
multiple elements.
Important! You cannot drag and drop concepts from the Data pane that were not extracted from the text.
If you want to force the extraction of a concept that you found in your data, you must add this concept
to a type. Then run the extraction again. The new extraction results will contain the concept that you just
added. You can then use it in your category. See the topic “Adding Concepts to Types” on page 95 for
more information.
To create categories using drag-and-drop:
1. From the Extraction Results pane or the Data pane, select one or more concepts, patterns, types,
records, or partial records.
2. While holding the mouse button down, drag the element to an existing category or to the pane area
to create a new category.
3. When you have reached the area where you would like to drop the element, release the mouse
button. The element is added to the Categories pane. The categories that were modified appear with a
special background color. This color is called the category feedback background. See the topic
“Setting Options” on page 79 for more information.
Note: The resulting category was automatically named. If you want to change a name, you can rename it.
See the topic “Creating New or Renaming Categories” on page 121 for more information.
If you want to see which records are assigned to a category, select that category in the Categories pane.
The data pane is automatically refreshed and displays all of the records for that category.
122
IBM SPSS Modeler Text Analytics 16 User's Guide
Using Category Rules
You can create categories in many ways. One of these ways is to define category rules to express ideas.
Category rules are statements that automatically classify documents or records into a category based on a
logical expression using extracted concepts, types, and patterns as well as Boolean operators. For
example, you could write an expression that means include all records that contain the extracted concept
embassy but not argentina in this category.
While some category rules are produced automatically when building categories using grouping
techniques such as co-occurrence and concept root derivation (Categories > Build Settings > Advanced
Settings: Linguistics), you can also create category rules manually in the rule editor using your category
understanding of the data and context. Each rule is attached to a single category so that each document
or record matching the rule is then scored into that category.
Category rules help enhance the quality and productivity of your text mining results and further
quantitative analysis by allowing you to categorize responses with greater specificity. Your experience and
business knowledge might provide you with a specific understanding of your data and context. You can
leverage this understanding to translate that knowledge into category rules to categorize your documents
or records even more efficiently and accurately by combining extracted elements with Boolean logic.
The ability to create these rules enhances coding precision, efficiency, and productivity by allowing you to
layer your business knowledge onto the product's extraction technology.
Note: For examples of how rules match text, see “Category Rule Examples” on page 128
Category Rule Syntax
While some category rules are produced automatically when building categories using grouping
techniques such as co-occurrence and concept root derivation (Categories > Build Settings > Advanced
Settings: Linguistics), you can also create category rules manually in the rule editor. Each rule is a
descriptor of a single category; therefore, each document or record matching the rule is automatically
scored into that category.
Note: For examples of how rules match text, see “Category Rule Examples” on page 128
When you are creating or editing a rule, you must have it open in the rule editor. You can add concepts,
types, or patterns as well as use wildcards to extend the matches. When you use extracted concepts,
types and patterns, you can benefit from finding all related concepts.
Important! To avoid common errors, we recommend dragging and dropping concepts directly from the
Extraction Results pane, Text Link Analysis panes, or the Data pane into the rule editor or adding them
via the context menus whenever possible.
When concepts, types, and patterns are recognized, an icon appears next to the text.
Table 18. Extraction icons
Icon
Description
Extracted concept
Extracted type
Extracted pattern
Chapter 10. Categorizing Text Data
123
Rule Syntax and Operators
The following table contains the characters with which you'll define your rule syntax. Use these
characters along with the concepts, types, and patterns to create your rule.
Table 19. Supported syntax
Character
Description
&
The "and" boolean. For example, a & b contains both a and b such as:
- invasion & united states
- 2016 & olympics
- good & apple
|
The "or" boolean is inclusive, which means that if any or all of the elements are found, a match is
made. For example, a | b contains either a or b such as:
- attack | france
- condominium | apartment
!()
The "not" boolean. For example, !(a) does not contain a. such as,
!(good & hotel), assassination & !(austria), or !(gold) & !(copper)
*
A wildcard representing anything from a single character to a whole word depending how it is
used. See the topic “Using Wildcards in Category Rules” on page 127 for more information.
()
An expression delimiter. Any expression within the parenthesis is evaluated first.
+
The pattern connector used to form an order-specific pattern. When present, the square brackets
must be used. See the topic “Using TLA Patterns in Category Rules” on page 125 for more
information.
[]
The pattern delimiter is required if you are looking to match based on an extracted TLA pattern
inside of a category rule. The content within the brackets refers to TLA patterns and will never
match concepts or types based on simple co-occurrence. If you did not extract this TLA pattern, then
no match will be possible. See the topic “Using TLA Patterns in Category Rules” on page 125 for
more information. Do not use square brackets if you are looking to match concepts and types
instead of patterns.
Note: In older versions, co-occurrence and synonym rules generated by the category building
techniques used to be surrounded by square brackets. In all new versions, square brackets now
indicate the presence of a TLA pattern. Instead, rules produced by the co-occurrence technique and
synonyms will be encapsulated in parentheses, such as (speaker systems|speakers).
The & and | operators are commutative such that a & b = b & a and a | b = b | a.
Escaping Characters with Backslash
If you have a concept that contains any character that is also a syntax character you must place a
backslash in front of that character so that the rule is properly interpreted. The backslash (\) character is
used to escape characters that otherwise have a special meaning. When you drag and drop into the
editor, backslashing is done for you automatically.
The following rule syntax characters must be preceded by a backslash if you want it treated as it is rather
than as rule syntax:
& ! | + < > ( ) [ ] *
For example, since the concept r&d contains the "and" operator (&), the backslash is required when it is
typed into the rule editor, such as: r\&d.
124
IBM SPSS Modeler Text Analytics 16 User's Guide
Using TLA Patterns in Category Rules
Text link analysis patterns can be explicitly defined in category rules to allow you to obtain even more
specific and contextual results. When you define a pattern in a category rule, you are bypassing the more
simple concept extraction results and only matching documents and records based on extracted text link
analysis pattern results.
Important! In order to match documents using TLA patterns in your category rules, you must have run
an extraction with text link analysis enabled. The category rule will look for the matches found during
that process. If you did not choose to explore TLA results in the Model tab of your Text Mining node,
you can choose to enable TLA extraction in the extraction settings within the interactive session and then
re-extract. See the topic “Extracting Data” on page 86 for more information.
Delimiting with square brackets. A TLA pattern must be surrounded by square brackets [ ] if you are
using it inside of a category rule. The pattern delimiter is required if you are looking to match based on
an extracted TLA pattern. Since category rules can contain, types, concepts, or patterns, the brackets
clarify to the rule that the contents within the brackets refers to extracted TLA pattern. If you did not
extract this TLA pattern, then no match will be possible. If you see a pattern without brackets such as
apple + good in the Categories pane, this likely means that the pattern was added directly to the category
outside of the category rule editor. For example, if you add a concept pattern directly to category from
the text link analysis view, it will not appear with square brackets. However, when using a pattern within
a category rule, you must encapsulate the pattern within the square brackets inside the category rule such
as [banana + !(good)].
Using the + sign in patterns. In IBM SPSS Modeler Text Analytics, you can have up to a 6-part, or -slot,
pattern. To indicate that the order is important, use the + sign to connect each element, such as [company1
+ acquired + company2]. Here the order is important since it would change the meaning of which
company was acquiring. Order is not determined by the sentence structure but rather by how the TLA
pattern output is structured. For example, if you have the text "I love Paris" and you want to extract this
idea, the TLA pattern is likely to be [paris + like] or [<Location> + <Positive>] rather than
[<Positive> + <Location>] since the default opinion resources generally place opinions in the second
position in 2 part patterns. So it can be helpful to use the pattern directly as a descriptor in your category
to avoid issues. However, if you need to use a pattern as part of a more complex statement, pay
particular attention to order of the elements within the patterns presented in the Text Link Analysis view
since order plays a big role in whether a match can be found.
For example, let's say you had the two following sample texts the expression: "I like pineapple" and "I hate
pineapple. However, I like strawberries". The expression like & pineapple would match both texts as it is
a concept expression and not a text link rule (not enclosed in brackets). The expression pineapple + like
matches only "I like pineapple" since in the second text, the word like is associated to strawberries instead.
Grouping with patterns. You can simplify your rules with your own patterns. Let's say you want to
capture the following three expressions, cayenne peppers + like, chili peppers + like, and peppers +
like. You can group them into a single category rule such as [* peppers & like]. If you had another
expression hot peppers + good, you can group those four with a rule such as [* peppers + <Positive>].
Order in patterns. In order to better organize output, the text link analysis rules supplied in the
templates you installed with your product attempt to output basic patterns in the same order regardless
of word order in the sentence. For example, if you had a record containing the text, "Good presentations."
and another record containing "the presentations were good", both text are matched by the same rule and
output in the same order as presentation + good in the concept pattern results rather than presentation
+ good and also good + presentation. And in two-slot pattern such as those in the example, the
concepts assigned to types in the Opinions library will be presented last in the output by default such as
apple + bad.
Chapter 10. Categorizing Text Data
125
Table 20. Pattern syntax and boolean usage
Expression
[]
Matches a document or record that
Contains any TLA pattern. The pattern delimiter is required in category rules if you are
looking to match based on an extracted TLA pattern. The content within the brackets refers
to TLA patterns not simple concepts and types. If you did not extract this TLA pattern, then
no match will be possible.
If you wanted to create a rule that did not include any patterns, you could use !([ ]).
[a]
[a + b]
Contains a pattern of which at least one element is a regardless of its position in the pattern.
For example, [deal] can match [deal + good] or just [deal + .]
Contains a concept pattern. For example, [deal + good].
Note: If you only want to capture this pattern without adding any other elements, we
recommend adding the pattern directly to your category rather than making a rule with it.
[a + b + c]
Contains a concept pattern. The + sign denotes that the order of the matching elements is
important. For example, [company1 + acquired + company2].
[<A> + <B>]
Contains any pattern with type <A> in the first slot and type <B> in the second slot, and
there are exactly two slots. The + sign denotes that the order of the matching elements is
important. For example, [<Budget> + <Negative>].
Note: If you only want to capture this pattern without adding any other elements, we
recommend adding the pattern directly to your category rather than making a rule with it.
[<A> & <B>]
Contains any type pattern with type <A> and type <B>. For example, [<Budget> &
<Negative>]. This TLA pattern will never be extracted; however, when written as such it is
really equal to [<Budget> + <Negative>]|[<Negative> + <Budget>]. The order of the
matching elements is unimportant. Additionally, other elements might be in the pattern but
it must have at least <Budget> and <Negative>.
[a + .]
Contains a pattern where a is the only concept and there is nothing in any other slots for
that pattern. For example,
[deal + .] matches the concept pattern where the only output is the concept deal. If you
added the concept deal as a category descriptor, you would get all records with deal as a
concept including positive statements about a deal. However, using [deal + .] will match
only those records pattern results representing deal and no other relationships or opinions
and would not match deal + fantastic.
Note: If you only want to capture this pattern without adding any other elements, we
recommend adding the pattern directly to your category rather than making a rule with it.
[<A> + <>]
Contains a pattern where <A> is the only type. For example, [<Budget> + <>] matches the
pattern where the only output is a concept of the type <Budget>.
Note: You can use the <> to denote an empty type only when putting it after the pattern +
symbol in type pattern such as [<Budget> + <>] but not [price + <>].
Note: If you only want to capture this pattern without adding any other elements, we
recommend adding the pattern directly to your category rather than making a rule with it.
[a + !(b)]
Contains at least one pattern that includes the concept a but does not include the concept b.
Must include at least one pattern.
For example, [price + !(high)]
or for types, [!(<Fruit>|<Vegetable>) + <Positive>]
!([<A> & <B>])
Does not contain a specific pattern. For example, !([<Budget> & <Negative>]).
Note: For examples of how rules match text, see “Category Rule Examples” on page 128
126
IBM SPSS Modeler Text Analytics 16 User's Guide
Using Wildcards in Category Rules
Wildcards can be added to concepts in rules in order to extend the matching capabilities. The asterisk *
wildcard can be placed before and/or after a word to indicate how concepts can be matched. There are
two types of wildcard uses:
v Affix wildcards. These wildcards immediately prefix or suffix without any space separating the string
and the asterisk. For example, operat* could match operat, operate, operates, operations, operational, and so
on.
v Word wildcards. These wildcards prefix or suffix a concept with a space between the concept and the
asterisk. For example, * operation could match operation, surgical operation, post operation, and so on.
Additionally, a word wildcard can be used along side an affix wildcard such as, * operat* *, which
could match operation, surgical operation, telephone operator, operatic aria, and so on. As you can see in this
last example, we recommend that wildcards be used with care so as not to cast the net too widely and
capture unwanted matches.
Exceptions!
v A wildcard can never stand on its own. For example, (apple | * ) would not be accepted.
v A wildcard can never be used to match type names. <Negative*> will not match any type names at all.
v You cannot filter out certain types from being matched to concepts found through wildcards. The type
to which the concept is assigned is used automatically.
v A wildcard can never be in the middle of a word sequence, whether it is end or beginning of a word
(open* account) or a standalone component (open * account). You cannot use wildcards in type names
either. For example, word* word, such as apple* recipe, will not match applesauce recipe or anything
else at all. However, apple* * would match applesauce recipe, apple pie, apple and so on. In another
example, word * word, such as apple * toast, will not match apple cinnamon toast or anything else at
all since the asterisk appears between two other words. However, apple * would match apple cinnamon
toast, apple, apple pie and so on.
Table 21. Wildcard usage
Expression
Matches a document or record that
*apple
Contains a concept that ends with letter written but may have any number of letters as a prefix.
For example: *apple ends with the letters apple but can take a prefix such as:
- apple
- pineapple
- crabapple
apple*
Contains a concept that starts with letters written but may have any number of letters as a
suffix. For example: apple* starts with the letters apple but can take a suffix or no suffix such as:
- apple
- applesauce
- applejack
For example, apple* & !(pear* | quince), which contains a concept that starts with the letters
apple but not a concept starting with the letters pear or the concept quince, would NOT match:
apple & quince
but could match:
- applesauce
- apple & orange
Chapter 10. Categorizing Text Data
127
Table 21. Wildcard usage (continued)
Expression
Matches a document or record that
*product*
Contains a concept that contains the letters written product, but may have any number of letters
as either a prefix or suffix or both.
For example: *product* could match:
- product
- byproduct
- unproductive
* loan
Contains a concept that contains the word loan but may be a compound with another word
placed before it. For example, * loan could match:
- loan
- car loan
- home equity loan
For example, [* delivery + <Negative>] contains a concept that ends in the word delivery in
the first position and contains a type <Negative> in the second position could match the
following concept patterns:
- package delivery + slow
- overnight delivery + late
event *
Contains a concept that contains the word event but may be a compound followed by another
word. For example, event * could match:
- event
- event location
- event planning committee
* apple *
Contains a concept that might start with any word followed by the word apple possibly
followed by another word. * means 0 or n, so it also matches apple. For example, * apple *
could match:
- gala applesauce
- granny smith apple crumble
- famous apple pie
- apple
For example, [* reservation* * + <Positive>], which contains a concept with the word
reservation (regardless of where it is in the concept) in the first position and contains a type
<Positive> in the second position could match the concept patterns:
- reservation system + good
- online reservation + good
Note: For examples of how rules match text, see “Category Rule Examples”
Category Rule Examples
To help demonstrate how rules are matched to records differently based on the syntax used to express
them, consider the following example.
Example Records
Imagine you had two records:
v Record A: “when I checked my wallet, I saw I was missing 5 dollars.”
v Record B: “$5 was found at the picnic area, but the blanket was missing.”
The following two tables show what might be extracted for concepts and types as well as concept
patterns and type patterns.
128
IBM SPSS Modeler Text Analytics 16 User's Guide
Concepts and Types Extracted From Example
Table 22. Example Extracted Concepts and Types
Extracted Concept
Concepts Typed As
wallet
<Unknown>
missing
<Negative>
USD5
<Currency>
blanket
<Unknown>
picnic area
<Unknown>
TLA Patterns Extracted From Example
Table 23. Example Extracted TLA Pattern Output
Extracted Concept Patterns
Extracted Type Patterns
From Record
picnic area + .
<Unknown> + <>
Record B
wallet + .
<Unknown> + <>
Record A
blanket + missing
<Unknown> + <Negative>
Record B
USD5 + .
<Currency> + <>
Record B
USD5 + missing
<Currency> + <Negative>
Record A
How Possible Category Rules Match
The following table contains some syntax that could be entered in the category rule editor. Not all rules
here work and not all match the same records. See how the different syntax affects the records matched.
Table 24. Sample Rules
Rule Syntax
Result
USD5 & missing
Matches both records A and B since they both contain the extracted
concept missing and the extracted concept USD5. This is equivalent to:
(USD5 & missing)
missing & USD5
Matches both records A and B since they both contain the extracted
concept missing and the extracted concept USD5. This is equivalent to:
(missing & USD5)
missing & <Currency>
Matches both records A and B since they both contain the extracted
concept missing and a concept matching the type <Currency>. This is
equivalent to:
(missing & <Currency>)
<Currency> & missing
Matches both records A and B since they both contain the extracted
concept missing and a concept matching the type <Currency>. This is
equivalent to:
(<Currency> & missing)
[USD5 + missing]
Matches A but not B since record B did not produce any TLA pattern
output containing USD5 + missing (see previous table). This is equivalent
to the TLA pattern output:
USD5 + missing
[missing + USD5]
Matches neither record A nor B since no extracted TLA pattern (see
previous table) match the order expressed here with missing in the first
position. This is equivalent to the TLA pattern output:
USD5 + missing
Chapter 10. Categorizing Text Data
129
Table 24. Sample Rules (continued)
Rule Syntax
[missing & USD5]
[missing + <Currency>]
Result
Matches A but not B since no such TLA pattern was extracted from
record B. Using the character & indicates that order is unimportant when
matching; therefore, this rule looks for a pattern match to either [missing
+ USD5] or [USD5 + missing]. Only [USD5 + missing] from record A
has a match.
Matches neither record A nor B since no extracted TLA pattern matched
this order. This has no equivalent, since a TLA output is only based on
terms (USD5 + missing) or on types (<Currency> + <Negative>), but
does not mix concepts and types.
[<Currency> + <Negative>]
Matches record A but not B since no TLA pattern was extracted from
record B. This is equivalent to the TLA output:
<Currency> + <Negative>
[<Negative> + <Currency>]
Matches neither record A nor B since no extracted TLA pattern matched
this order. In the Opinions template, by default, when a topic is found
with an opinion, the topic (<Currency>) occupies the first slot position and
opinion (<Negative>) occupies the second slot position.
Creating Category Rules
When you are creating or editing a rule, you must have the rule open in the rule editor. You can add
concepts, types, or patterns as well as use wildcards to extend the matches. When you use recognized
concepts, types and patterns, you benefit since it will find all related concepts. For example, when you
use a concept, all of its associated terms, plural forms, and synonyms are also matched to the rule.
Likewise, when you use a type, all of its concepts are also captured by the rule.
You can open the rule editor by editing an existing rule or by right-clicking the category name and
choosing Create Rule.
You can use context menus, drag-and-drop, or manually enter concepts, types, and patterns into the
editor. Then combine these with Boolean operators (&, !(), |) and brackets to form your rule expressions.
To avoid common errors, we recommend dragging and dropping concepts directly from the Extraction
Results pane or the Data pane into the rule editor. Pay close attention to the syntax of the rules to avoid
errors. See the topic “Category Rule Syntax” on page 123 for more information.
Note: For examples of how rules match text, see “Category Rule Examples” on page 128.
To Create a Rule
1. If you have not yet extracted any data or your extraction is out of date, do so now. See the topic
“Extracting Data” on page 86 for more information.
Note: If you filter an extraction in such a way that there are no longer any concepts visible, an error
message is displayed when you attempt to create or edit a category rule. To prevent this, modify your
extraction filter so that concepts are available.
2. In the Categories pane, select the category in which you want to add your rule.
3. From the menus choose Categories > Create Rule. The category rule editor pane opens in the
window.
4. In the Rule Name field, enter a name for your rule. If you do not provide a name, the expression will
be used as the name automatically. You can rename this rule later.
5. In the larger expression text field, you can:
v Enter text directly in the field or drag-and-drop from another pane. Use only extracted concepts,
types, and patterns. For example, if you enter the word cats but only the singular form, cat,
130
IBM SPSS Modeler Text Analytics 16 User's Guide
appears in your Extraction Results pane, the editor will not be able to recognize cats. In this last
case, the singular form might automatically include the plural, otherwise you could use a wildcard.
See the topic “Category Rule Syntax” on page 123 for more information.
v Select the concepts, types, or patterns you want to add to rules and use the menus.
v Add Boolean operators to link elements in your rule together. Use the toolbar buttons to add the
"and" Boolean &, the "or" Boolean |, the "not" Boolean !(), parentheses (), and brackets for patterns [
] to your rule.
6. Click the Test Rule button to verify that your rule is well-formed. See the topic “Category Rule
Syntax” on page 123 for more information. The number of documents or records found appears in
parentheses next to the text Test result. To the right of this text, you can see the elements in your rule
that were recognized or any error messages. If the graphic next to the type, pattern, or concept
appears with a red question mark, this indicates that the element does not match any known
extractions. If it does not match, then the rule will not find any records.
7. To test a part of your rule, select that part and click Test Selection.
8. Make any necessary changes and retest your rule if you found problems.
9. When finished, click Save & Close to save your rule again and close the editor. The new rule name
appears in the category.
Editing and Deleting Rules
After you have created and saved a rule, you can edit that rule at any time. See the topic “Category Rule
Syntax” on page 123 for more information.
If you no longer want a rule, you can delete it.
To Edit Rules
1. In the Descriptors table in Category Definitions dialog box, select the rule.
2. From the menus choose Categories > Edit Rule or double-click the rule name. The editor opens with
the selected rule.
3. Make any changes to the rule using extraction results and the toolbar buttons.
4. Retest your rule to make sure that it returns the expected results.
5. Click Save & Close to save your rule again and close the editor.
To Delete a Rule
1. In the Descriptors table in Category Definitions dialog box, select the rule.
2. From the menus, choose Edit > Delete. The rule is deleted from the category.
Importing and Exporting Predefined Categories
If you have your own categories stored in an Microsoft Excel (*.xls, *.xlsx) file, you can import them into
IBM SPSS Modeler Text Analytics .
You can also export the categories you have in an open interactive workbench session out to an Microsoft
Excel (*.xls, *.xlsx) file. When you export your categories, you can choose to include or exclude some
additional information such as descriptors and scores. See the topic “Exporting Categories” on page 135
for more information.
If your predefined categories do not have codes or you want new codes, you can automatically generate
a new set of codes for the set of categories in the categories pane by choosing Categories > Manage
Categories > Autogenerate Codes from the menus. This will remove any existing codes and renumber
them all automatically.
Chapter 10. Categorizing Text Data
131
Importing Predefined Categories
You can import your predefined categories into IBM SPSS Modeler Text Analytics . Before importing,
make sure the predefined category file is in an Microsoft Excel (*.xls, *.xlsx) file and is structured in one
of the supportive formats. You can also choose to have the product automatically detect the format for
you. The following formats are supported:
v Flat list format: See the topic “Flat List Format” on page 133 for more information.
v Compact format: See the topic “Compact Format” on page 133 for more information.
v Indented format: See the topic “Indented Format” on page 134 for more information.
To Import Predefined Categories
1. From the interactive workbench menus, choose Categories > Manage Categories > Import
Predefined Categories. An Import Predefined Categories wizard is displayed.
2. From the Look In drop-down list, select the drive and folder in which the file is located.
3. Select the file from the list. The name of the file appears in the File Name text box.
4. Select the worksheet containing the predefined categories from the list. The worksheet name appears
in the Worksheet field.
5. To begin choosing the data format, click Next.
6. Choose the format for your file or choose the option to allow the product to attempt to automatically
detect the format. The autodetection works best on the most common formats.
v Flat list format: See the topic “Flat List Format” on page 133 for more information.
v Compact format: See the topic “Compact Format” on page 133 for more information.
v Indented format: See the topic “Indented Format” on page 134 for more information.
7. To define the additional import options, click Next. If you choose to have the format automatically
detected, you are directed to the final step.
8. If one or more rows contain column headers or other extraneous information, select the row number
from which you want to start importing in the Start import at row option. For example, if your
category names begin on row 7, you must enter the number 7 for this option in order to import the
file correctly.
9. If your file contains category codes, choose the option Contains category codes. Doing so helps the
wizard properly recognize your data.
10. Review the color-coded cells and legend to make sure that the data has been correctly identified.
Any errors detected in the file are shown in red and referenced below the format preview table. If
the wrong format was selected, go back and choose another one. If you need to make corrections to
your file, make those changes and restart the wizard by selecting the file again. You must correct all
errors before you can finish the wizard.
11. To review the set of categories and subcategories that will be imported and to define how to create
descriptors for these categories, click Next.
12. Review the set of categories that will be imported in the table. If you do not see the keywords you
expected to see as descriptors, it may be that they were not recognized during the import. Make sure
they are properly prefixed and appear in the correct cell.
13. Choose how you want to handle any pre-existing categories in your session.
v Replace all existing categories. This option purges all existing categories and then the newly
imported categories are used alone in their place.
v Append to existing categories. This option will import the categories and merge any common
categories with the existing categories. When adding to existing categories, you need to determine
how you want any duplicates handled. One choice (option: Merge) is to merge any categories
being imported with existing categories if they share a category name. Another choice (option:
Exclude from import) is to prohibit the import of categories if one with the same name exists.
14. Import keywords as descriptors is an option to import the keywords identified in your data as
descriptors for the associated category.
132
IBM SPSS Modeler Text Analytics 16 User's Guide
15. Extend categories by deriving descriptors is an option that will generate descriptors from the words
that represent the name of the category, or subcategory, and/or the words that make up the
annotation. If the words match extracted results, then those are added as descriptors to the category.
This option produces the best results when the category names or annotations are both long and
descriptive. This is a quick method for generating the category descriptors that enable the category
to capture records that contain those descriptors.
v From field allows you to select from what text the descriptors will be derived, the names or
categories and subcategories, the words in the annotations, or both.
v As field allows you to choose to create these descriptors in the form of concepts or TLA patterns.
If TLA extraction has not taken place, the options of patterns are disabled in this wizard.
16. To import the predefined categories into the Categories pane, click Finish.
Flat List Format
In the flat list format, there is only one top level of categories without any hierarchy, meaning no
subcategories or subnets. Category names are in a single column.
The following information can be contained in a file of this format:
v Optional codes column contains numerical values that uniquely identify each category. If you specify
that the data file does contain codes (Contains category codes option in the Content Settings step),
then a column containing unique codes for each category must exist in the cell directly to the left of
category name. If your data does not contain codes, but you want to create some codes later, you can
always generate codes later (Categories > Manage Categories > Autogenerate Codes).
v A required category names column contains all of the names of the categories. This column is required
to import using this format.
v Optional annotations in the cell immediately to the right of the category name. This annotation
consists of text that describes your categories/subcategories.
v Optional keywords can be imported as descriptors for categories. In order to be recognized, these
keywords must exist in the cell directly below the associated category/subcategory name and the list
of keywords must be prefixed by the underscore (_) character such as _firearms, weapons / guns. The
keyword cell can contain one or more words used to describe each category. These words will be
imported as descriptors or ignored depending on what you specify in the last step of the wizard. Later,
descriptors are compared to the extracted results from the text. If a match is found, then that record or
document is scored into the category containing this descriptor.
Table 25. Flat list format with codes, keywords, and annotations
Column A
Column B
Column C
Category code (optional)
Category name
Annotation
_Descriptor/keyword list (optional)
Compact Format
The compact format is structured similarly to the flat list format except that the compact format is used
with hierarchical categories. Therefore, a code level column is required to define the hierarchical level of
each category and subcategory.
The following information can be contained in a file of this format:
v A required code level column contains numbers that indicate the hierarchical position for the
subsequent information in that row. For example, if values 1, 2 or 3 are specified and you have both
categories and subcategories, then 1 is for categories, 2 is for subcategories, and 3 is for
sub-subcategories. If you have only categories and subcategories, then 1 is for categories and 2 is for
subcategories. And so on, until the desired category depth.
v Optional codes column contains values that uniquely identify each category. If you specify that the
data file does contain codes (Contains category codes option in the Content Settings step), then a
Chapter 10. Categorizing Text Data
133
column containing unique codes for each category must exist in the cell directly to the left of category
name. If your data does not contain codes, but you want to create some codes later, you can always
generate codes later (Categories > Manage Categories > Autogenerate Codes).
v A required category names column contains all of the names of the categories and subcategories. This
column is required to import using this format.
v Optional annotations in the cell immediately to the right of the category name. This annotation
consists of text that describes your categories/subcategories.
v Optional keywords can be imported as descriptors for categories. In order to be recognized, these
keywords must exist in the cell directly below the associated category/subcategory name and the list
of keywords must be prefixed by the underscore (_) character such as _firearms, weapons / guns. The
keyword cell can contain one or more words used to describe each category. These words will be
imported as descriptors or ignored depending on what you specify in the last step of the wizard. Later,
descriptors are compared to the extracted results from the text. If a match is found, then that record or
document is scored into the category containing this descriptor.
Table 26. Compact format example with codes
Column A
Column B
Column C
Hierarchical code level
Category code (optional)
Category name
Hierarchical code level
Subcategory code (optional)
Subcategory name
Table 27. Compact format example without codes
Column A
Column B
Hierarchical code level
Category name
Hierarchical code level
Subcategory name
Indented Format
In the Indented file format, the content is hierarchical, which means it contains categories and one or
more levels of subcategories. Furthermore, its structure is indented to denote this hierarchy. Each row in
the file contains either a category or subcategory, but subcategories are indented from the categories and
any sub-subcategories are indented from the subcategories, and so on. You can manually create this
structure in Microsoft Excel or use one that was exported from another product and saved into an
Microsoft Excel format.
v Top level category codes and category names occupy the columns A and B, respectively. Or, if no
codes are present, then the category name is in column A.
v Subcategory codes and subcategory names occupy the columns B and C, respectively. Or, if no codes
are present, then the subcategory name is in column B. The subcategory is a member of a category. You
cannot have subcategories if you do not have top level categories.
Table 28. Indented structure with codes
Column A
Column B
Column C
Column D
Category code (optional) Category name
Subcategory code (optional)
Subcategory name
Sub-subcategory code
(optional)
Table 29. Indented structure without codes
Column A
Column B
Category name
Subcategory name
134
IBM SPSS Modeler Text Analytics 16 User's Guide
Column C
Sub-subcategory name
Table 29. Indented structure without codes (continued)
Column A
Column B
Column C
Sub-subcategory name
The following information can be contained in a file of this format:
v Optional codes must be values that uniquely identify each category or subcategory. If you specify that
the data file does contain codes (Contains category codes option in the Content Settings step), then a
unique code for each category or subcategory must exist in the cell directly to the left of
category/subcategory name. If your data does not contain codes, but you want to create some codes
later, you can always generate codes later (Categories > Manage Categories > Autogenerate Codes).
v A required name for each category and subcategory. Subcategories must be indented from categories by
one cell to the right in a separate row.
v Optional annotations in the cell immediately to the right of the category name. This annotation
consists of text that describes your categories/subcategories.
v Optional keywords can be imported as descriptors for categories. In order to be recognized, these
keywords must exist in the cell directly below the associated category/subcategory name and the list
of keywords must be prefixed by the underscore (_) character such as _firearms, weapons / guns. The
keyword cell can contain one or more words used to describe each category. These words will be
imported as descriptors or ignored depending on what you specify in the last step of the wizard. Later,
descriptors are compared to the extracted results from the text. If a match is found, then that record or
document is scored into the category containing this descriptor.
Important! If you use a code at one level, you must include a code for each category and subcategory.
Otherwise, the import process will fail.
Exporting Categories
You can also export the categories you have in an open interactive workbench session into an Microsoft
Excel (*.xls, *.xlsx) file format. The data that will be exported comes largely from the current contents of
the Categories pane or from the category properties. Therefore, we recommend that you score again if
you plan to also export the Docs. score value.
Table 30. Category export options
Always gets exported...
Exported optionally...
v Category codes, if present
v Docs. scores
v Category (and subcategory) names
v Category annotations
v Code levels, if present (Flat/Compact format)
v Descriptor names
v Column headings (Flat/Compact format)
v Descriptors counts
Important! When you export descriptors, they are converted to text strings and prefixed by an
underscore. If you re-import into this product, the ability to distinguish between descriptors that are
patterns, those that are category rules, and those that are plain concepts is lost. If you intend to reuse
these categories in this product, we highly recommend making a text analysis package (TAP) file instead
since the TAP format will preserve all descriptors as they are currently defined as well as all your
categories, codes, and also the linguistic resources used. TAP files can be used in both IBM SPSS Modeler
Text Analytics and IBM SPSS Text Analytics for Surveys . See the topic “Using Text Analysis Packages”
on page 136 for more information.
To Export Predefined Categories
1. From the interactive workbench menus, choose Categories > Manage Categories > Export Categories.
An Export Categories wizard is displayed.
Chapter 10. Categorizing Text Data
135
Choose the location and enter the name of the file that will be exported.
Enter a name for the output file in the File Name text box.
To choose the format into which you will export your category data, click Next.
Choose the format from the following:
v Flat or Compact list format: See the topic “Flat List Format” on page 133 for more information. Flat
list contains no subcategories. See the topic “Compact Format” on page 133 for more information.
Compact list format contains hierarchical categories.
v Indented format: See the topic “Indented Format” on page 134 for more information.
6. To begin choosing the content to be exported and to review the proposed data, click Next.
7. Review the content for the exported file.
8. Select or unselect the additional content settings to be exported such as Annotations or Descriptor
names.
2.
3.
4.
5.
9. To export the categories, click Finish.
Using Text Analysis Packages
A text analysis package, also called a TAP, serves as a template for text response categorization. Using a
TAP is an easy way for you to categorize your text data with minimal intervention since it contains the
prebuilt category sets and the linguistic resources needed to code a vast number of records quickly and
automatically. Using the linguistic resources, text data is analyzed and mined in order to extract key
concepts. Based on key concepts and patterns found in the text, the records can be categorized into the
category set you selected in the TAP. You can make your own TAP or update one.
A TAP is made up of the following elements:
v Category Set(s). A category set is essentially made up of a predefined categories, category codes,
descriptors for each category, and lastly, a name for the whole category set. Descriptors are linguistic
elements (concepts, types, patterns, and rules) such as the term cheap or the pattern good price.
Descriptors are used to define a category so that when the text matches any category descriptor, the
document or record is put into the category.
v Linguistic Resources. Linguistic resources are a set of libraries and advanced resources that are tuned
to extract key concepts and patterns. These extraction concepts and patterns, in turn, are used as the
descriptors that enable records to be placed into a category in the category set.
You can make your own TAP, update one, or load text analysis packages.
After selecting the TAP and choosing a category set, IBM SPSS Modeler Text Analytics can extract and
categorize your records.
Note: TAPs can be created and used interchangeably between IBM SPSS Text Analytics for Surveys and
IBM SPSS Modeler Text Analytics.
Making Text Analysis Packages
Whenever you have a session with at least one category and some resources, you can make a text
analysis package (TAP) from the contents of the open interactive workbench session. The set of categories
and descriptors (concepts, types, rules or TLA pattern outputs) can be made into a TAP along with all of
the linguistic resources open in the resource editor.
You can see the language for which the resources were created. The language is set in the Advanced
Resources tab of the Template Editor or Resource Editor.
To Make a Text Analysis Package
136
IBM SPSS Modeler Text Analytics 16 User's Guide
1. From the menus, choose File > Text Analysis Packages > Make Package. The Make Package dialog
appears.
2. Browse to the directory in which you will save the TAP. By default, TAPs are saved into the \TAP
subdirectory of the product installation directory.
3. Enter a name for the TAP in the File Name field.
4. Enter a label in the Package Label field. When you enter a file name, this name automatically appears
as the label but you can change this label.
5. To exclude a category set from the TAP, unselect the Include checkbox. Doing so will ensure that it is
not added to your package. By default, one category set per question is included in the TAP. There
must always be at least one category set in the TAP.
6. Rename any category sets. The New Category Set column contains generic names by default, which
are generated by adding the Cat_ prefix to the text variable name. A single click in the cell makes the
name editable. Enter or a click elsewhere applies the rename. If you rename a category set, the name
changes in the TAP only and does not change the variable name in the open session.
7. Reorder the category sets if desired using the arrow keys to the right of the category set table.
8. Click Save to make the text analysis package. The dialog box closes.
Loading Text Analysis Packages
When configuring a text mining modeling node, you must specify the resources that will be used during
extraction. Instead to choosing a resource template, you can select a text analysis package (TAP) in order
to copy not only its resources but also a category set into the node.
TAPs are most interesting when creating a category model interactively since you can use the category set
as a starting point for categorization. When you execute the stream, the interactive workbench session is
launched and this set of categories appears in the Categories pane. In this way, you score your
documents and records immediately using these categories and then continue to refine, build, and extend
these categories until they satisfy your needs. See the topic “Methods and Strategies for Creating
Categories” on page 102 for more information.
Beginning in version 14, you can also see the language for which the resources in this TAP were defined
when you click Load and choose the TAP.
To Load a Text Analysis Package
1. Edit the Text Mining modeling node.
2. In the Models tab, choose Text analysis package in the Copy Resources From section.
3. Click Load. The Load Text Analysis Package dialog opens.
4. Browse to the location of the TAP containing the resources and category set you want to copy into the
node. By default, TAPs are saved into the \TAP subdirectory of the product installation directory.
5. Enter a name for the TAP in the File Name field. The label is automatically displayed.
6. Select the category set you want to use. This is the set of categories that will appear in the interactive
workbench session. You can then tweak and improve these categories manually or using the Build or
Extend categories options.
7. Click Load to copy the contents of the text analysis package into the node. The dialog box closes.
When a TAP is loaded, a copy of the TAP is copied into the node; therefore, any changes you make to
resources and categories will not be reflected into the TAP unless you explicitly update it and reload
it.
Updating Text Analysis Packages
If you make improvements to a category set, linguistic resources, or make a whole new category set, you
can update a text analysis package (TAP) to make it easier to reuse these improvements later. To do so,
Chapter 10. Categorizing Text Data
137
you must be in the open session containing the information you want to put in the TAP. When you
update, you can choose to append category sets, replace resources, change the package label, or
rename/reorder category sets.
To Update a Text Analysis Package
1. From the menus, choose File > Text Analysis Packages > Update Package. The Update Package
dialog appears.
2. Browse to the directory containing the text analysis package you want to update.
3. Enter a name for the TAP in the File Name field.
4. To replace the linguistic resources inside the TAP with those in the current session, select the
Replace the resources in this package with those in the open session option. It generally make
sense to update the linguistic resources since they were used to extract the key concepts and patterns
used to create the category definitions. Having the most recent linguistic resources ensures that you
get the best results in categorizing your records. If you do not select this option, the linguistic
resources that were already in the package are kept unchanged.
5. To update only the linguistic resources, make sure that you select the Replace the resources in this
package with those in the open session option and select only the current category sets that were
already in the TAP.
6. To include the new category set from the open session into the TAP, select the checkbox for each
category set to be added. You can add one, multiple or none of the category sets.
7. To remove category sets from the TAP, unselect the corresponding Include checkbox. You might
choose to remove a category set that was already in the TAP since you are adding an improved one.
To do so, unselect the Include checkbox for the corresponding category set in the Current Category
Set column. There must always be at least one category set in the TAP.
8. Rename category sets if needed. A single click in the cell makes the name editable. Enter or a click
elsewhere applies the rename. If you rename a category set, the name changes in the TAP only and
does not change the variable name in the open session. If two category sets have the same name, the
names will appear in red until you correct the duplicate.
9. To create a new package with the session contents merged with the contents of the selected TAP,
click Save As New. The Save As Text Analysis Package dialog appears. See following instructions.
10. Click Update to save the changes you made to the selected TAP.
To Save a Text Analysis Package
1. Browse to the directory in which you will save the TAP file. By default, TAP files are saved into the
TAP subdirectory of the installation directory.
2. Enter a name for the TAP file in the File name field.
3. Enter a label in the Package label field. When you enter a file name, this name is automatically used
as the label. However, you can rename this label. You must have a label.
4. Click Save to create the new package.
Editing and Refining Categories
Once you create some categories, you will invariably want to examine them and make some adjustments.
In addition to refining the linguistic resources, you should review your categories by looking for ways to
combine or clean up their definitions as well as checking some of the categorized documents or records.
You can also review the documents or records in a category and make adjustments so that categories are
defined in such a way that nuances and distinctions are captured.
You can use the built-in, automated, category-building techniques to create your categories; however, you
are likely to want to perform a few tweaks to these categories. After using one or more technique, a
138
IBM SPSS Modeler Text Analytics 16 User's Guide
number of new categories appear in the window. You can then review the data in a category and make
adjustments until you are comfortable with your category definitions. See the topic “About Categories”
on page 106 for more information.
Here are some options for refining your categories, most of which are described in the following pages:
Adding Descriptors to Categories
After using automated techniques, you will most likely still have extraction results that were not used in
any of the category definitions. You should review this list in the Extraction Results pane. If you find
elements that you would like to move into a category, you can add them to an existing or new category.
To Add a Concept or Type to a Category
1. From within the Extraction Results and Data panes, select the elements that you want to add to a new
or existing category.
2. From the menus, choose Categories > Add to Category. The All Categories dialog box displays the
set of categories. Select the category to which you want to add the selected elements. If you want to
add the elements to a new category, select New Category. A new category appears in the Categories
pane using the name of the first selected element.
Editing Category Descriptors
Once you have created some categories, you can open each category to see all of the descriptors that
make up its definition. Inside the Category Definitions dialog box, you can make a number of edits to
your category descriptors. Also, if categories are shown in the category tree, you can also work with them
there.
To Edit a Category
1. Select the category you want to edit in the Categories pane.
2. From the menus, choose View > Category Definitions. The Category Definitions dialog box opens.
3. Select the descriptor you want to edit and click the corresponding toolbar button.
The following table describes each toolbar button that you can use to edit your category definitions.
Table 31. Toolbar buttons and descriptions.
Icons
Description
Deletes the selected descriptors from the category.
Moves the selected descriptors to a new or existing category.
Moves the selected descriptors in the form of an & category rule to a category. See the topic
“Using Category Rules” on page 123 for more information.
Moves each of the selected descriptors as its own new category
Updates what is displayed in the Data pane and the Visualization pane according to the selected
descriptors
Display
Moving Categories
If you want to place a category into another existing category or move descriptors into another category,
you can move it.
To Move a Category
Chapter 10. Categorizing Text Data
139
1. In the Categories pane, select the categories that you would like to move into another category.
2. From the menus, choose Categories > Move to Category. The menu presents a set of categories with
the most recently created category at the top of the list. Select the name of the category to which you
want to move the selected concepts.
v If you see the name you are looking for, select it, and the selected elements are added to that category.
v If you do not see it, select More to display the All Categories dialog box, and select the category from
the list.
Flattening Categories
When you have a hierarchical category structure with categories and subcategories, you can flatten your
structure. When you flatten a category, all of the descriptors in the subcategories of that category are
moved into the selected category and the now empty subcategories are deleted. In this way, all of the
documents that used to match the subcategories are now categorized into the selected category.
To Flatten a Category
1. In the Categories pane, select a category (top level or subcategory) that you would like to flatten.
2. From the menus, choose Categories > Flatten Categories. The subcategories are removed and the
descriptors are merged into the selected category.
Merging or Combining Categories
If you want to combine two or more existing categories into a new category, you can merge them. When
you merge categories, a new category is created with a generic name. All of the concepts, types, and
patterns used in the category descriptors are moved into this new category. You can later rename this
category by editing the category properties.
To Merge a Category or Part of a Category
1. In the Categories pane, select the elements you would like to merge together.
2. From the menus, choose Categories > Merge Categories. The Category Properties dialog box is
displayed in which you enter a name for the newly created category. The selected categories are
merged into the new category as subcategories.
Deleting Categories
If you no longer want to keep a category, you can delete it.
To Delete a Category
1. In the Categories pane, select the category or categories that you would like to delete.
2. From the menus, choose Edit > Delete.
140
IBM SPSS Modeler Text Analytics 16 User's Guide
Chapter 11. Analyzing Clusters
You can build and explore concept clusters in the Clusters view (View > Clusters). A cluster is a
grouping of related concepts generated by clustering algorithms based on how often these concepts occur
in the document/record set and how often they appear together in the same document, also known as
cooccurrence. Each concept in a cluster cooccurs with at least one other concept in the cluster. The goal of
clusters is to group concepts that co-occur together while the goal of categories is to group documents or
records based on how the text they contain matches the descriptors (concepts, rules, patterns) for each
category.
A good cluster is one with concepts that are strongly linked and cooccur frequently and with few links to
concepts in other clusters. When working with larger datasets, this technique may result in significantly
longer processing times.
Note: Use the Maximum number of docs to use for calculating clusters option in the Build Clusters
dialog box in order to build with only a subset of all documents or records.
Clustering is a process that begins by analyzing a set of concepts and looking for concepts that cooccur
often in documents. Two concepts that cooccur in a document are considered to be a concept pair. Next,
the clustering process assesses the similarity value of each concept pair by comparing the number of
documents in which the pair occur together to the number of documents in which each concept occurs.
See the topic “Calculating Similarity Link Values” on page 144 for more information.
Lastly, the clustering process groups similar concepts into clusters by aggregation and takes into account
their link values and the settings defined in the Build Clusters dialog box. By aggregation, we mean that
concepts are added or smaller clusters are merged into a larger cluster until the cluster is saturated. A
cluster is saturated when additional merging of concepts or smaller clusters would cause the cluster to
exceed the settings in the Build Clusters dialog box (number of concepts, internal links, or external links).
A cluster takes the name of the concept within the cluster that has the highest overall number of links to
other concepts within the cluster.
In the end, not all concept pairs end up together in the same cluster since there may be a stronger link in
another cluster or saturation may prevent the merging of the clusters in which they occur. For this
reason, there are both internal and external links.
v Internal links are links between concept pairs within a cluster. Not all concepts are linked to each
other in a cluster. However, each concept is linked to at least one other concept inside the cluster.
v External links are links between concept pairs in separate clusters (a concept within one cluster and a
concept outside in another cluster).
141
Figure 30. Clusters view
The Clusters view is organized into three panes, each of which can be hidden or shown by selecting its
name from the View menu:
v Clusters pane. You can build and manage your clusters in this pane. See the topic “Exploring Clusters”
on page 144 for more information.
v Visualization pane. You can visually explore your clusters and how they interact in this pane. See the
topic “Cluster Graphs” on page 154 for more information.
v Data pane. You can explore and review the text contained within documents and records that
correspond to selections in the Cluster Definitions dialog box. See the topic “Cluster Definitions” on
page 145 for more information.
Building Clusters
When you first access the Clusters view, no clusters are visible. You can build the clusters through the
menus (Tools > Build Clusters) or by clicking the Build... button on the toolbar. This action opens the
Build Clusters dialog box in which you can define the settings and limits for building your clusters.
142
IBM SPSS Modeler Text Analytics 16 User's Guide
Note: Whenever the extraction results no longer match the resources, this pane becomes yellow as does
the Extraction Results pane. You can reextract to get the latest extraction results and the yellow coloring
will disappear. However, each time an extraction is performed the Clusters pane is cleared, and you will
have to rebuild your clusters. Likewise clusters are not saved from one session to another.
The following areas and fields are available within the Build Clusters dialog box:
Inputs
Inputs table. Clusters are built from descriptors derived from certain types. In the table, you can select
the types to include in the building process. The types that capture the most records or documents are
preselected by default.
Concepts to cluster: Select the method of selecting the concepts you want to use for clustering. By
reducing the number of concepts, you can speed up the clustering process. You can cluster using a
number of top concepts, a percentage of top concepts, or using all the concepts:
v Number based on doc. count. When you select Top number of concepts, enter the number of concepts
to be considered for clustering. The concepts are chosen based on those that have the highest doc count
value. Doc count is the number of documents or records in which the concept appears.
v Percentage based on doc. count.When you select Top percentage of concepts, enter the percentage of
concepts to be considered for clustering. The concepts are chosen based on this percentage of concepts
with the highest doc count value.
Maximum number of docs to use for calculating clusters. By default, link values are calculated using
the entire set of documents or records. However, in some cases, you may want to speed up the clustering
process by limiting the number of documents or records used to calculate the links. Limiting documents
may decrease the quality of the clusters. To use this option, select the check box to its left and enter the
maximum number of documents or records to use.
Output Limits
Maximum number of clusters to create. This value is the maximum number of clusters to generate and
display in the Clusters pane. During the clustering process, saturated clusters are presented before
unsaturated ones, and therefore, many of the resulting clusters will be saturated. In order to see more
unsaturated clusters, you can change this setting to a value greater than the number of saturated clusters.
Maximum concepts in a cluster. This value is the maximum number of concepts a cluster can contain.
Minimum concepts in a cluster. This value is the minimum number of concepts that must be linked in
order to create a cluster.
Maximum number of internal links. This value is the maximum number of internal links a cluster can
contain. Internal links are links between concept pairs within a cluster.
Maximum number of external links. This value is the maximum number of links to concepts outside of
the cluster. External links are links between concept pairs in separate clusters.
Minimum link value. This value is the smallest link value accepted for a concept pair to be considered
for clustering. Link value is calculated using a similarity formula. See the topic “Calculating Similarity
Link Values” on page 144 for more information.
Prevent pairing of specific concepts. Select this checkbox to stop the process from grouping or pairing
two concepts together in the output. To create or manage concept pairs, click Manage Pairs. See the topic
“Managing Link Exception Pairs” on page 113 for more information.
Chapter 11. Analyzing Clusters
143
Calculating Similarity Link Values
Knowing only the number of documents in which a concept pair cooccurs does not in itself tell you how
similar the two concepts are. In these cases, the similarity value can be helpful. The similarity link value
is measured using the cooccurrence document count compared to the individual document counts for
each concept in the relationship. When calculating similarity, the unit of measurement is the number of
documents (doc count) in which a concept or concept pair is found. A concept or concept pair is "found"
in a document if it occurs at least once in the document. You can choose to have the line thickness in the
Concept graph represent the similarity link value in the graphs.
The algorithm reveals those relationships that are strongest, meaning that the tendency for the concepts
to appear together in the text data is much higher than their tendency to occur independently. Internally,
the algorithm yields a similarity coefficient ranging from 0 to 1, where a value of 1 means that the two
concepts always appear together and never separately. The similarity coefficient result is then multiplied
by 100 and rounded to the nearest whole number. The similarity coefficient is calculated using the
formula shown in the following figure.
Figure 31. Similarity coefficient formula
Where:
v CI is the number of documents or records in which the concept I occurs.
v CJ is the number of documents or records in which the concept J occurs.
v CIJ is the number of documents or records in which concept pair I and J cooccurs in the set of
documents.
For example, suppose that you have 5,000 documents. Let I and J be extracted concepts and let IJ be a
concept pair cooccurrence of I and J. The following table proposes two scenarios to demonstrate how the
coefficient and link value are calculated.
Table 32. Concept frequencies example
Concept/Pair
Scenario A
Scenario B
Concept: I
Occurs in 20 docs
Occurs in 30 docs
Concept: J
Occurs in 20 docs
Occurs in 60 docs
Concept Pair: IJ
Cooccurs in 20 docs
Cooccurs in 20 docs
Similarity coefficient
1
0.22222
Similarity link value
100
22
In scenario A, the concepts I and J as well as the pair IJ occur in 20 documents, yielding a similarity
coefficient of 1, meaning that the concepts always occur together. The similarity link value for this pair
would be 100.
In scenario B, concept I occurs in 30 documents and concept J occurs in 60 documents, but the pair IJ
occurs in only 20 documents. As a result, the similarity coefficient is 0.22222. The similarity link value for
this pair would be rounded down to 22.
Exploring Clusters
After you build clusters, you can see a set of results in the Clusters pane. For each cluster, the following
information is available in the table:
144
IBM SPSS Modeler Text Analytics 16 User's Guide
v Cluster. This is the name of the cluster. Clusters are named after the concept with the highest number
of internal links.
v Concepts. This is the number of concepts in the cluster. See the topic “Cluster Definitions” for more
information.
v Internal. This is the number of internal links in the cluster. Internal links are links between concept
pairs within a cluster.
v External. This is the number of external links in the cluster. External links are links between concept
pairs when one concept is in one cluster and the other concept is in another cluster.
v Sat. If a symbol is present, this indicates that this cluster could have been larger but one or more limits
would have been exceeded, and therefore, the clustering process ended for that cluster and is
considered to be saturated. At the end of the clustering process, saturated clusters are presented before
unsaturated ones and therefore, many of the resulting clusters will be saturated. In order to see more
unsaturated clusters, you can change the Maximum number of clusters to create setting to a value
greater than the number of saturated clusters or decrease the Minimum link value. See the topic
“Building Clusters” on page 142 for more information.
v Threshold. For all of the cooccurring concept pairs in the cluster, this is the lowest similarity link value
of all in the cluster. See the topic “Calculating Similarity Link Values” on page 144 for more
information. A cluster with a high threshold value signifies that the concepts in that cluster have a
higher overall similarity and are more closely related than those in a cluster whose threshold value is
lower.
To learn more about a given cluster, you can select it and the visualization pane on the right will show
two graphs to help you explore the cluster(s). See the topic “Cluster Graphs” on page 154 for more
information. You can also cut and paste the contents of the table into another application.
Whenever the extraction results no longer match the resources, this pane becomes yellow as does the
Extraction Results pane. You can reextract to get the latest extraction results and the yellow coloring will
disappear. However, each time an extraction is performed, the Clusters pane is cleared and you will have
to rebuild your clusters. Likewise clusters are not saved from one session to another.
Cluster Definitions
You can see all of the concepts inside a cluster by selecting it in the Clusters pane and opening the
Cluster Definitions dialog box (View > Cluster Definitions).
All of the concepts in the selected cluster appear in the Cluster Definitions dialog box. If you select one
or more concepts in the Cluster Definitions dialog box and click Display &, the Data pane will display all
of the records or documents in which all of the selected concepts appear together. However, the Data pane
does not display any text records or documents when you select a cluster in the Clusters pane. For
general information on the Data pane, see in.
Selecting concepts in this dialog box also changes the concept web graph. See the topic “Cluster Graphs”
on page 154 for more information. Similarly, when you select one or more concepts in the Cluster
Definitions dialog box, the Visualization pane will show all of the external and internal links from those
concepts.
Column Descriptions
Icons are shown so that you can easily identify each descriptor.
Table 33. Columns and Descriptor Icons
Columns
Description
Descriptors
The name of the concept.
Chapter 11. Analyzing Clusters
145
Table 33. Columns and Descriptor Icons (continued)
Columns
Description
Shows the number of times this descriptor appears in the entire dataset, also known as the global
frequency.
Global
Shows the number of documents or records in which this descriptor appears, also known as the
document frequency.
Docs
Shows the type or types to which the descriptor belongs. If the descriptor is a category rule, no
type name is shown in this column.
Type
Toolbar Actions
From this dialog box, you can also select one or more concepts to use in a category. There are several
ways to do this but it is most interesting to select concepts that cooccur in a cluster and add them as a
category rule. See the topic “Co-occurrence Rules” on page 117 for more information. You can use the
toolbar buttons to add the concepts to categories.
Table 34. Toolbar buttons to add concepts to categories
Icons
Description
Add the selected concepts to a new or existing category
Add the selected concepts in the form of an & category rule to a new or existing category. See the
topic “Using Category Rules” on page 123 for more information.
Add each of the selected concepts as its own new category
Updates what is displayed in the Data pane and the Visualization pane according to the selected
descriptors
Note: You can also add concepts to a type, as synonyms, or as exclude items using the context menus.
146
IBM SPSS Modeler Text Analytics 16 User's Guide
Chapter 12. Exploring Text Link Analysis
In the Text Link Analysis (TLA) view, you can explore text link analysis pattern results. Text link analysis
is a pattern-matching technology that enables you to define pattern rules and compare these to actual
extracted concepts and relationships found in your text.
For example, extracting ideas about an organization may not be interesting enough to you. Using TLA,
you could also learn about the links between this organization and other organizations or the people
within an organization. You can also use TLA to extract opinions on products or, for some languages, the
relationships between genes.
Once you've extracted some TLA pattern results, you can review them in the Type and Concept Patterns
panes of the Text Link Analysis view. See the topic “Type and Concept Patterns” on page 149 for more
information. You can further explore them in the Data or Visualization panes in this view. Possibly most
importantly, you can add them to categories.
If you have not already chosen to do so, you can click Extract and choose Enable Text Link Analysis
pattern extraction in the Extract Settings dialog box. See the topic “Extracting TLA Pattern Results” on
page 148 for more information.
There must be some TLA pattern rules defined in the resource template or libraries you are using in
order to extract TLA pattern results. You can use the TLA patterns in certain resource templates shipped
with IBM SPSS Modeler Text Analytics. The kind of relationships and patterns you can extract depend
entirely on the TLA rules defined in your resources. You can define your own TLA rules for all text
languages except Japanese. Patterns are made up of macros, word lists, and word gaps to form a Boolean
query, or rule, that is compared to your input text. See the topic Chapter 19, “About Text Link Rules,” on
page 205 for more information.
Whenever a TLA pattern rule matches text, this text can be extracted as a pattern and restructured as
output data. The results are then visible in the Text Link Analysis view panes. Each pane can be hidden
or shown by selecting its name from the View menu:
v Type and Concept Patterns Panes. You can build and explore your patterns in these two panes. See
the topic “Type and Concept Patterns” on page 149 for more information.
v Visualization pane. You can visually explore how the concepts and types in your patterns interact in
this pane. See the topic “Text Link Analysis Graphs” on page 156 for more information.
v Data pane. You can explore and review text contained within documents and records that correspond
to selections in another pane. See the topic “Data Pane” on page 151 for more information.
© Copyright IBM Corporation 2003, 2013
147
Figure 32. Text Link Analysis view
Extracting TLA Pattern Results
The extraction process results in a set of concepts and types, as well as Text Link Analysis (TLA) patterns,
if enabled. If you extracted TLA patterns you can see those in the Text Link Analysis view. Whenever the
extraction results are not in sync with the resources, the Patterns panes become yellow in color indicating
that a reextraction would produce different results.
You have to choose to extract these patterns in the node setting or in the Extract dialog box using the
option Enable Text Link Analysis pattern extraction. See the topic “Extracting Data” on page 86 for
more information.
Note: There is a relationship between the size of your dataset and the time it takes to complete the
extraction process. See the installation instructions for performance statistics and recommendations. You
can always consider inserting a Sample node upstream or optimizing your machine's configuration.
To Extract Data
1. From the menus, choose Tools > Extract. Alternatively, click the Extract toolbar button.
2. Change any of the options you want to use. Keep in mind that the option Enable Text Link Analysis
pattern extraction must be selected on this tab as well as having TLA rules in your template in order
to extract TLA pattern results. See the topic “Extracting Data” on page 86 for more information.
148
IBM SPSS Modeler Text Analytics 16 User's Guide
3. Click Extract to begin the extraction process.
Once the extraction begins, the progress dialog box opens. If you want to abort the extraction, click
Cancel. When the extraction is complete, the dialog box closes and the results appear in the pane. See the
topic “Type and Concept Patterns” for more information.
Type and Concept Patterns
Patterns are made up of two parts, a combination of concepts and types. Patterns are most useful when
you are attempting to discover opinions about a particular subject or relationships between concepts. For
example, extracting your competitor's product name may not be interesting enough to you. In this case,
you can look at the extracted patterns to see if you can find examples where a document or record
contains text expressing that the product is good, bad, or expensive.
Patterns can consist of up to six types or six concepts. For this reason, the rows in both patterns panes
contain up to six slots, or positions. Each slot corresponds to an element's specific position in the TLA
pattern rule as it is defined in the linguistic resources. In the interactive workbench, if a slot contains no
values, it is not shown in the table. For example, if the longest pattern results contain no more than four
slots, the last two are not shown. See the topic Chapter 19, “About Text Link Rules,” on page 205 for
more information.
When you extract pattern results, they are first grouped at the type level and then divided into concept
patterns. For this reason, there are two different result panes: Type Patterns (upper left) and Concept
Patterns (lower left). To see all concept patterns returned, select all of the type patterns. The bottom
concept patterns pane will then display all concept patterns up to the maximum rank value (as defined in
the Filter dialog box).
Type Patterns. This pane presents pattern results consisting of one or more related types matching a TLA
pattern rule. Type patterns are shown as <Organization> + <Location> + <Positive>, which might
provide positive feedback about an organization in a specific location. The syntax is as follows:
<Type1> + <Type2> + <Type3> + <Type4> + <Type5> + <Type6>
Concept Patterns. This pane presents the pattern results at the concept level for all of the type pattern(s)
currently selected in the Type Patterns pane above it. Concept patterns follow a structure such as hotel +
paris + wonderful. The syntax is as follows:
concept1 + concept2 + concept3 + concept4 + concept5 + concept6
When pattern results use less than the six maximum slots, only the necessary number of slots (or
columns) are displayed. Any empty slots found between two filled slots are discarded such that the
pattern <Type1>+<>+<Type2>+<>+<>+<> can be represented by <Type1>+<Type3>. For a concept pattern, this
would be concept1+.+concept2 (where . represents a null value).
Just as with the extraction results in the Categories and Concepts view, you can review the results here. If
you see any refinements you would like to make to the types and concepts that make up these patterns,
you make those in the Extraction Results pane in the Categories and Concepts view or directly in the
Resource Editor and reextract your patterns. Whenever a concept, type, or pattern is used in a category
definition as is or as part of a rule, a category or rule icon appears in the In column in the Pattern or
Extraction Results table.
Filtering TLA Results
When you are working with very large datasets, the extraction process could produce millions of results.
For many users, this amount can make it more difficult to review the results effectively. You can,
however, filter these results in order to zoom in on those that are most interesting. You can change the
settings in the Filter dialog box to limit what patterns are shown. All of these settings are used together.
Chapter 12. Exploring Text Link Analysis
149
In the TLA view, the Filter dialog box contains the following areas and fields.
Filter by Frequency. You can filter to display only those results with a certain global or document
frequency value.
v Global frequency is the total number of times a pattern appears in the entire set of documents or
records and is shown in the Global column.
v Document frequency is the total number of documents or records in which a pattern appears and is
shown in the Docs column.
For example, if a pattern appeared 300 times in 500 records, we would say that this pattern has a global
frequency of 300 and a document frequency of 500.
And by Match Text. You can also filter to display only those results that match the rule you define here.
Enter the set of characters to be matched in the Match text field, and select whether to look for this text
within concept or type names by identifying the slot number or all of them. Then select the condition in
which to apply the match (you do not need to use angled brackets to denote the beginning or end of a
type name). Select either And or Or from the drop-down list so that the rule matches both statements or
just one of them, and define the second text matching statement in the same manner as the first.
Table 35. Match text conditions
Condition
Description
Contains
Text is matched if the string occurs anywhere. (Default choice)
Starts with
Text is matched only if the concept or type starts with the specified text.
Ends with
Text is matched only if the concept or type ends with the specified text.
Exact Match
The entire string must match the concept or type name.
And by Rank. You can also filter to display only a top number of patterns according to global frequency
(Global) or document frequency (Docs) in either ascending or descending order. This maximum rank
value limits the total number of patterns returned for display.
When the filter is applied, the product adds type patterns until the maximum total number of concept
patterns (rank maximum) would be exceeded. It begins by looking at the type pattern with the top rank
and then takes the sum of the corresponding concept patterns. If this sum does not exceed the rank
maximum, the patterns are displayed in the view. Then, the number of concept patterns for the next type
pattern is summed. If that number plus the total number of concept patterns in the previous type pattern
is less than the rank maximum, those patterns are also displayed in the view. This continues until as
many patterns as possible, without exceeding the rank maximum, are displayed.
Results Displayed in Patterns Pane
Suppose you are using an English version of the software; here are some examples of how the results
might be displayed on the Patterns pane toolbar based on the filters.
Figure 33. Filter results example 1
In this example, the toolbar shows that the number of patterns returned was limited because of the rank
maximum specified in the filter. If a purple icon is present, this means that the maximum number of
patterns was met. Hover over the icon for more information. See the preceding explanation of the And
by Rank filter.
150
IBM SPSS Modeler Text Analytics 16 User's Guide
Figure 34. Filter results example 2
In this example, the toolbar shows results were limited using a match text filter (see magnifying glass
icon). You can hover over the icon to see what the match text is.
To
1.
2.
3.
Filter the Results
From the menus, choose Tools > Filter. The Filter dialog box opens.
Select and refine the filters you want to use.
Click OK to apply the filters and see the new results.
Data Pane
As you extract and explore text link analysis patterns, you may want to review some of the data you are
working with. For example, you may want to see the actual records in which a group of patterns were
discovered. You can review records or documents in the Data pane, which is located in the lower right. If
not visible by default, choose View > Panes > Data from the menus.
The Data pane presents one row per document or record corresponding to a selection in the view, up to a
certain display limit. By default, the number of documents or records shown in the Data pane is limited
in order to make it faster for you to see your data. However, you can adjust this in the Options dialog
box. See the topic “Options: Session Tab” on page 80 for more information.
Displaying and Refreshing the Data Pane
The Data pane does not refresh its display automatically, because with larger datasets automatic data
refreshing could take some time to complete. Therefore, whenever you select type or concept patterns in
this view, you can click Display to refresh the contents of the Data pane.
Text Documents or Records
If your text data is in the form of records and the text is relatively short in length, the text field in the
Data pane displays the text data in its entirety. However, when working with records and larger datasets,
the text field column shows a short piece of the text and opens a Text Preview pane to the right to
display more or all of the text of the record you have selected in the table. If your text data is in the form
of individual documents, the Data pane shows the document's filename. When you select a document,
the Text Preview pane opens with the selected document's text.
Colors and Highlighting
Whenever you display the data, concepts and descriptors found in those documents or records are
highlighted in color to help you easily identify them in the text. The color coding corresponds to the
types to which the concepts belong. You can also hover your mouse over color-coded items to display the
concept under which it was extracted and the type to which it was assigned. Any text that was not
extracted appears in black. Typically, these unextracted words are often connectors (and or with),
pronouns (me or they), and verbs (is, have, or take).
Data Pane Columns
While the text field column is always visible, you can also display other columns. To display other
columns, choose View > Data Pane from the menus, and then select the column that you want to display
in the Data pane. The following columns may be available for display:
Chapter 12. Exploring Text Link Analysis
151
v "Text field name" (#)/Documents. Adds a column for the text data from which concepts and type were
extracted. If your data is in documents, the column is called Documents and only the document
filename or full path is visible. To see the text for those documents you must look in the Text Preview
pane. The number of rows in the Data pane is shown in parentheses after this column name. There
may be times when not all documents or records are shown due to a limit in the Options dialog used
to increase the speed of loading. If the maximum is reached, the number will be followed by - Max.
See the topic “Options: Session Tab” on page 80 for more information.
v Categories. Lists each of the categories to which a record belongs. Whenever this column is shown,
refreshing the Data pane may take a bit longer so as to show the most up-to-date information.
v Relevance Rank. Provides a rank for each record in a single category. This rank shows how well the
record fits into the category compared to the other records in that category. Select a category in the
Categories pane (upper left pane) to see the rank. See the topic “Category Relevance” on page 108 for
more information.
v Category Count. Lists the number of the categories to which a record belongs.
152
IBM SPSS Modeler Text Analytics 16 User's Guide
Chapter 13. Visualizing Graphs
The Categories and Concepts view, Clusters view, and Text Link Analysis view all have a visualization
pane in the upper right corner of the window. You can use this pane to visually explore your data. The
following graphs and charts are available.
Categories and Concepts view. This view has three graphs and charts: Category Bar, Category Web, and
Category Web Table. In this view, the graphs are only updated when you click Display. See the topic
“Category Graphs and Charts” for more information.
v Clusters view. This view has two web graphs: Concept Web Graph and Cluster Web Graph. See the topic
“Cluster Graphs” on page 154 for more information.
v Text Link Analysis view. This view has two web graphs: Concept Web Graph and Type Web Graph. See
the topic “Text Link Analysis Graphs” on page 156 for more information.
v
For more information on all of the general toolbars and palettes used for editing graphs, see the section
on Editing Graphs in the online help or in the file modeler_nodes_general_book.pdf, available from the
\Documentation\en folder on the IBM SPSS Modeler DVD.
Category Graphs and Charts
When building your categories, it is important to take the time to review the category definitions, the
documents or records they contain, and how the categories overlap. The visualization pane offers several
perspectives on your categories. The Visualization pane is located in the upper right corner of the
Categories and Concepts view . If it is not already visible, you can access this pane from the View menu
(View > Panes > Visualization).
In this view, the visualization pane offers three perspectives on the commonalities in document or record
categorization. The charts and graphs in this pane can be used to analyze your categorization results and
aid in fine-tuning categories or reporting. When refining categories, you can use this pane to review your
category definitions to uncover categories that are too similar (for example, they share more than 75% of
their documents or records ) or too distinct. If two categories are too similar, it might help you decide to
combine the two categories. Alternatively, you might decide to refine the category definitions by
removing certain descriptors from one category or the other.
Depending on what is selected in the Extraction Results pane, Categories pane, or in the Category
Definitions dialog box, you can view the corresponding interactions between documents/records and
categories on each of the tabs in this pane. Each presents similar information but in a different manner or
with a different level of detail. However, in order to refresh a graph for the current selection, click
Display on the toolbar of the pane or dialog box in which you have made your selection.
The Visualization pane in the Categories and Concepts view offers the following graphs and charts:
v Category Bar Chart. A table and bar chart present the overlap between the documents/records
corresponding to your selection and the associated categories. The bar chart also presents ratios of the
documents/records in categories to the total number of documents/records. See the topic “Category
Bar Chart” on page 154 for more information.
v Category Web Graph. This graph presents the document/record overlap for the categories to which
the documents/records belong according to the selection in the other panes. See the topic “Category
Web Graph” on page 154 for more information.
v Category Web Table. This table presents the same information as the Category Web tab but in a table
format. The table contains three columns that can be sorted by clicking the column headers. See the
topic “Category Web Table” on page 154 for more information.
153
See the topic Chapter 10, “Categorizing Text Data,” on page 99 for more information.
Category Bar Chart
This tab displays a table and bar chart showing the overlap between the documents/records
corresponding to your selection and the associated categories. The bar chart also presents ratios of the
documents/records in categories to the total number of documents or records . You cannot edit the layout
of this chart. You can, however, sort the columns by clicking the column headers.
The chart contains the following columns:
v Category. This column presents the name of the categories in your selection. By default, the most
common category in your selection is listed first.
v Bar. This column presents, in a visual manner, the ratio of the documents or records in a given
category to the total number of documents or records.
v Selection %. This column presents a percentage based on the ratio of the total number of documents or
records for a category to the total number of documents or records represented in the selection.
v Docs. This column presents the number of documents or records in a selection for the given category.
Category Web Graph
This tab displays a category web graph. The web presents the documents or records overlap for the
categories to which the documents or records belong according to the selection in the other panes. If
category labels exist, these labels appear in the graph. You can choose a graph layout (network, circle,
directed, or grid) using the toolbar buttons in this pane.
In the web, each node represents a category. Using your mouse, you can select and move the nodes
within the pane. The size of the node represents the relative size based on the number of documents or
records for that category in your selection. The thickness and color of the line between two categories
denotes the number of common documents or records they have. If you hover your mouse over a node
in Explore mode, a ToolTip displays the name (or label) of the category and the overall number of
documents or records in the category.
Note: By default, the Explore mode in enabled for the graphs on which you can move nodes. However,
you can switch to Edit mode to edit your graph layouts including colors, fonts, legends, and more. See
the topic “Using Graph Toolbars and Palettes” on page 156 for more information.
Category Web Table
This tab displays the same information as the Category Web tab but in a table format. The table contains
three columns that can be sorted by clicking the column headers:
v Count. This column presents the number of shared, or common, documents or records between the
two categories.
v Category 1. This column presents the name of the first category followed by the total number of
documents or records it contains, shown in parentheses.
v Category 2. This column presents the name of the second category followed by the total number of
documents or records it contains, shown in parentheses.
Cluster Graphs
After building your clusters, you can explore them visually in the web graphs in the Visualization pane.
The visualization pane offers two perspectives on clustering: a Concept Web graph and a Cluster Web
graph. The web graphs in this pane can be used to analyze your clustering results and aid in uncovering
some concepts and rules you may want to add to your categories. The Visualization pane is located in
the upper right corner of the Clusters view. If it isn't already visible, you can access this pane from the
View menu (View > Panes > Visualization). By selecting a cluster in the Clusters pane, you can
automatically display the corresponding graphs in the Visualization pane.
154
IBM SPSS Modeler Text Analytics 16 User's Guide
Note: By default, the graphs are in the interactive/selection mode in which you can move nodes.
However, you can edit your graph layouts in Edit mode, including colors and fonts, legends, and more.
See the topic “Using Graph Toolbars and Palettes” on page 156 for more information.
The Clusters view has two web graphs.
v Concept Web Graph. This graph presents all of the concepts within the selected cluster(s) as well as
linked concepts outside the cluster. This graph can help you see how the concepts within a cluster are
linked and any external links. See the topic “Concept Web Graph” for more information.
v Cluster Web Graph. This graph presents the selected cluster(s) with all of the external links between
the selected clusters shown as dotted lines. See the topic “Cluster Web Graph” for more information.
See the topic Chapter 11, “Analyzing Clusters,” on page 141 for more information.
Concept Web Graph
This tab displays a web graph showing all of the concepts within the selected cluster(s) as well as linked
concepts outside the cluster. This graph can help you see how the concepts within a cluster are linked
and any external links. Each concept in a cluster is represented as a node, which is color coded according
to the type color. See the topic “Creating Types” on page 183 for more information.
The internal links between the concepts within a cluster are drawn and the line thickness of each link is
directly related to either the doc count for each concept pair's co-occurrence or the similarity link value,
depending on your choice on the graph toolbar. The external links between a cluster's concepts and those
concepts outside the cluster are also shown.
If concepts are selected in the Cluster Definitions dialog box, the Concept Web graph will display those
concepts and any associated internal and external links to those concepts. Any links between other
concepts that do not include one of the selected concepts do not appear on the graph.
Note: By default, the graphs are in the interactive/selection mode in which you can move nodes.
However, you can edit your graph layouts in Edit mode including colors and fonts, legends, and more.
See the topic “Using Graph Toolbars and Palettes” on page 156 for more information.
Cluster Web Graph
This tab displays a web graph showing the selected cluster(s). The external links between the selected
clusters as well as any links between other clusters are all shown as dotted lines. In a Cluster Web graph,
each node represents an entire cluster and the thickness of lines drawn between them represents the
number of external links between two clusters.
Important! In order to display a Cluster Web graph, you must have already built clusters with external
links. External links are links between concept pairs in separate clusters (a concept within one cluster and
a concept outside in another cluster).
For example, let's say we have two clusters. Cluster A has three concepts: A1, A2, and A3. Cluster B has
two concepts: B1 and B2. The following concepts are linked: A1-A2, A1-A3, A2-B1 (External), A2-B2
(External), A1-B2 (External), and B1-B2. This means that in the Cluster Web graph, the line thickness
would represent the three external links.
Note: By default, the graphs are in the interactive/selection mode in which you can move nodes.
However, you can edit your graph layouts in Edit mode including colors and fonts, legends, and more.
See the topic “Using Graph Toolbars and Palettes” on page 156 for more information.
Chapter 13. Visualizing Graphs
155
Text Link Analysis Graphs
After extracting your Text Link Analysis (TLA) patterns, you can explore them visually in the web graphs
in the Visualization pane. The visualization pane offers two perspectives on TLA patterns: a concept
(pattern) web graph and a type (pattern) web graph. The web graphs in this pane can be used to visually
represent patterns. The Visualization pane is located in the upper right corner of the Text Link Analysis.
If it isn't already visible, you can access this pane from the View menu (View > Panes > Visualization). If
there is no selection, then the graph area is empty.
Note: By default, the graphs are in the interactive/selection mode in which you can move nodes.
However, you can edit your graph layouts in Edit mode including colors and fonts, legends, and more.
See the topic “Using Graph Toolbars and Palettes” for more information.
The Text Link Analysis view has two web graphs.
v Concept Web Graph. This graph presents all the concepts in the selected pattern(s). The line width and
node sizes (if type icons are not shown) in a concept graph show the number of global occurrences in
the selected table. See the topic “Concept Web Graph” for more information.
v Type Web Graph. This graph presents all the types in the selected pattern(s). The line width and node
sizes (if type icons are not shown) in the graph show the number of global occurrences in the selected
table. Nodes are represented by either a type color or by an icon. See the topic “Type Web Graph” for
more information.
See the topic Chapter 12, “Exploring Text Link Analysis,” on page 147 for more information.
Concept Web Graph
This web graph presents all of the concepts represented in the current selection. For example, if you
selected a type pattern that had three matching concept patterns, this graph would show three sets of
linked concepts. The line width and node sizes in a concept graph represent the global frequency counts.
The graph visually represents the same information as what is selected in the patterns panes. The types
of each concept are presented either by a color or by an icon depending on what you select on the graph
toolbar. See the topic “Using Graph Toolbars and Palettes” for more information.
Type Web Graph
This web graph presents each type pattern for the current selection. For example, if you selected two
concept patterns, this graph would show one node per type in the selected patterns and the links
between those it found in the same pattern. The line width and node sizes represent the global frequency
counts for the set. The graph visually represents the same information as what is selected in the patterns
panes. In addition to the type names appearing in the graph, the types are also identified either by their
color or by a type icon, depending on what you select on the graph toolbar. See the topic “Using Graph
Toolbars and Palettes” for more information.
Using Graph Toolbars and Palettes
For each graph, there is a toolbar that provides you with quick access to some common palettes from
which you can perform a number of actions with your graphs. Each view (Categories and Concepts,
Clusters, and Text Link Analysis) has a slightly different toolbar. You can choose between the Explore
view mode or the Edit view mode.
While Explore mode allows you to analytically explore the data and values represented by the
visualization, Edit mode allows you to change the visualization's layout and look. For example, you can
change the fonts and colors to match your organization's style guide. To select this mode, choose View >
Visualization Pane > Edit Mode from the menus (or click the toolbar icon).
156
IBM SPSS Modeler Text Analytics 16 User's Guide
In Edit mode, there are several toolbars that affect different aspects of the visualization's layout. If you
find that there are any you don't use, you can hide them to increase the amount of space in the dialog
box in which the graph is displayed. To select or deselect toolbars, click on the relevant toolbar or palette
name on the View menu.
For more information on all of the general toolbars and palettes used for editing graphs, see the section
on Editing Graphs in the online help or in the file modeler_nodes_general_book.pdf, available under the
\Documentation\en folder on the IBM SPSS Modeler DVD.
Table 36. Text Analytics Toolbar buttons.
Button/List
Description
Enables Edit mode. Switch to the Edit mode to change the look of the graph, such as enlarging
the font, changing the colors to match your corporate style guide, or removing labels and
legends.
Enables Explore mode. By default, the Explore mode is turned on, which means that you can
move and drag nodes around the graph as well as hover over graph objects to reveal
additional ToolTip information.
Select a type of web display for the graphsin the Categories and Concepts view as well as the
Text Link Analysis view.
v
Circle Layout. A general layout that can be applied to any graph. It lays out a graph
assuming that links are undirected and treats all nodes the same. Nodes are only placed
around the perimeter of a circle.
v
Network Layout. A general layout that can be applied to any graph. It lays out a graph
assuming that links are undirected and treats all nodes the same. Nodes are placed freely
within the layout.
v
Directed Layout. A layout that should only be used for directed graphs. This layout
produces treelike structures from root nodes down to leaf nodes and organizes by colors.
Hierarchical data tends to display nicely with this layout.
v
Grid Layout. A general layout that can be applied to any graph. It lays out a graph
assuming that links are undirected and treats all nodes the same. Nodes are only placed at
grid points within the space.
Link size representation. Choose what the thickness of the line represents in the graph. This
only applies to the Clusters view. The Clusters web graph only shows the number of external
links between clusters. You can choose between:
v
v
Similarity. Thickness indicates the number of external links between two clusters
Co-occurrence. Thickness indicates the number of documents in which a co-occurrence of
descriptors takes place.
A toggle button that, when pressed, displays the legend. When the button is not pushed, the
legend is not shown.
A toggle button that, when pressed, displays the type icons in the graph rather than type
colors. This only applies to Text Link Analysis view.
A toggle button that, when pressed, displays the Links Slider beneath the graph. You can filter
the results by sliding the arrow.
Will display the graph for highest level of categories selected rather than for their
subcategories.
Will display the graph for lowest level of categories selected.
Chapter 13. Visualizing Graphs
157
Table 36. Text Analytics Toolbar buttons (continued).
Button/List
Description
This option controls how the names of subcategories are displayed in the output.
158
v
Full category path. This option will output the name of the category and the full path of
parent categories if applicable using slashes to separate category names from subcategory
names.
v
Short category path. This option will output only the name of the category but use ellipses
to show the number of parent categories for the category in question.
v
Bottom level category. This option will output only the name of the category without the
full path or parent categories shown.
IBM SPSS Modeler Text Analytics 16 User's Guide
Chapter 14. Session Resource Editor
IBM SPSS Modeler Text Analytics rapidly and accurately captures and extracts key concepts from text
data. This extraction process relies heavily on linguistic resources to dictate how to extract information
from text data. By default, these resources come from resource templates.
IBM SPSS Modeler Text Analytics is shipped with a set of specialized resource templates that contain a
set of linguistic and nonlinguistic resources, in the form of libraries and advanced resources, to help
define how your data will be handled and extracted. See the topic Chapter 15, “Templates and
Resources,” on page 163 for more information.
In the node dialog box, you can load a copy of the template's resources into the node. Once inside an
interactive workbench session, you can customize these resources specifically for this node's data, if you
wish. During an interactive workbench session, you can work with your resources in the Resource Editor
view. Whenever an interactive session is launched, an extraction is performed using the resources loaded
in the node dialog box, unless you have cached your data and extraction results in your node.
Editing Resources in the Resource Editor
The Resource Editor offers access to the set of resources used to produce the extraction results (concepts,
types, and patterns) for an interactive workbench session. This editor is very similar to the Template
Editor except that in the Resource Editor you are editing the resources for this session. When you are
finished working on your resources and any other work you've done, you can update the modeling node
to save this work so that it can be restored in a subsequent interactive workbench session. See the topic
“Updating Modeling Nodes and Saving” on page 82 for more information.
If you want to work directly on the templates used to load resources into nodes, we recommend you use
the Template Editor. Many of the tasks you can perform inside the Resource Editor are performed just
like they are in the Template Editor, such as:
v Working with libraries. See the topic Chapter 16, “Working with Libraries,” on page 173 for more
information.
Creating type dictionaries. See the topic “Creating Types” on page 183 for more information.
Adding terms to dictionaries. See the topic “Adding Terms” on page 184 for more information.
Creating synonyms. See the topic “Defining Synonyms” on page 188 for more information.
Importing and exporting templates. See the topic “Importing and Exporting Templates” on page 170
for more information.
v Publishing libraries. See the topic “Publishing Libraries” on page 178 for more information.
v
v
v
v
For Dutch, English, French, German, Italian, Portuguese, and Spanish Text
159
Figure 35. Resource Editor view for Non-Japanese Languages
For Japanese Text
The editor interface for the Japanese text language is different from other text languages.
160
IBM SPSS Modeler Text Analytics 16 User's Guide
Figure 36. Resource Editor view for Japanese Text
Making and Updating Templates
Whenever you make changes to your resources and want to reuse them in the future, you can save the
resources as a template. When doing so, you can choose to save using an existing template name or by
providing a new name. Then, whenever you load this template in the future, you'll be able to obtain the
same resources. See the topic “Copying Resources From Templates and TAPs” on page 26 for more
information.
Note: You can also publish and share your libraries. See the topic “Sharing Libraries” on page 177 for
more information.
To Make (or Update) a Template
1. From the menus in the Resource Editor view, choose Resources > Make Resource Template. The
Make Resource Template dialog box opens.
2. Enter a new name in the Template Name field, if you want to make a new template. Select a template
in the table, if you want to overwrite an existing template with the currently loaded resources.
3. Click Save to make the template.
Chapter 14. Session Resource Editor
161
Important! Since templates are loaded when you select them in the node and not when the stream is
executed, please make sure to reload the resource template in any other nodes in which it is used if you
want to get the latest changes. See the topic “Updating Node Resources After Loading” on page 169 for
more information.
Switching Resource Templates
If you want to replace the resources currently loaded in the session with a copy of those from another
template, you can switch to those resources. Doing so will overwrite any resources currently loadedin the
session. If you are switching resources in order to have some predefined Text Link Analysis (TLA) pattern
rules, make sure to select a template that has them marked in the TLA column.
Important! You cannot switch from Japanese template to a non-Japanese template or vice versa.
Switching resources is particularly useful when you want to restore the session work (categories, patterns,
and resources) but want to load an updated copy of the resources from a template without losing your
other session work.You can select the template whose contents you want copy into the Resource Editor
and click OK. This replaces the resources you have in this session. Make sure you update the modeling
node at the end of your session if you want to keep these changes next time you launch the interactive
workbench session.
Note: If you switch to the contents of another template during an interactive session, the name of the
template listed in the node will still be the name of the last template loaded and copied. In order to
benefit from these resources or other session work, update your modeling node before exiting the session
and select the Use session work option in the node. See the topic “Updating Modeling Nodes and
Saving” on page 82 for more information.
To Switch Resources
1. From the menus in the Resource Editor view, choose Resources > Switch Resource Templates. The
Switch Resources dialog box opens.
2. Select the template you want to use from those shown in the table.
3. Click OK to abandon those resources currently loaded and load a copy of those in the selected
template in their place. If you have made changes to your resources and want to save your libraries
for a future use, you can publish, update, and share them before switching. See the topic “Sharing
Libraries” on page 177 for more information.
162
IBM SPSS Modeler Text Analytics 16 User's Guide
Chapter 15. Templates and Resources
IBM SPSS Modeler Text Analytics rapidly and accurately captures and extracts key concepts from text
data. This extraction process relies heavily on linguistic resources to dictate how to extract information
from text data. See the topic “How Extraction Works” on page 5 for more information. You can fine-tune
these resources in the Resource Editor view.
When you install the software, you also get a set of specialized resources. These shipped resources allow
you to benefit from years of research and fine-tuning for specific languages and specific applications.
Since the shipped resources may not always be perfectly adapted to the context of your data, you can
edit these resource templates or even create and use custom libraries uniquely fine-tuned to your
organization's data. These resources come in various forms and each can be used in your session.
Resources can be found in the following:
v Resource templates. Templates are made up of a set of libraries, types, and some advanced resources
which together form a specialized set of resources adapted to a particular domain or context such as
product opinions.
v
Text analysis packages (TAP). In addition to the resources stored in a template, TAPs also bundle
together one or more specialized category sets generated using those resources so that both the
categories and the resources are stored together and reusable. See the topic “Using Text Analysis
Packages” on page 136 for more information.
v
Libraries. Libraries are used as building blocks for both TAPs and templates. They can also be added
individually to resources in your session. Each library is made up of several dictionaries used to define
and manage types, synonyms, and exclude lists. While libraries are also delivered individually, they are
prepackaged together in templates and TAPs. See the topic Chapter 16, “Working with Libraries,” on
page 173 for more information.
Note: During extraction, some compiled internal resources are also used. These compiled resources
contain a large number of definitions complementing the types in the Core library. These compiled
resources cannot be edited.
The Resource Editor offers access to the set of resources used to produce the extraction results (concepts,
types, and patterns). There are a number of tasks you might perform in the Resource Editor and they
include:
Working with libraries. See the topic Chapter 16, “Working with Libraries,” on page 173 for more
information.
v Creating type dictionaries. See the topic “Creating Types” on page 183 for more information.
v
Adding terms to dictionaries. See the topic “Adding Terms” on page 184 for more information.
Creating synonyms. See the topic “Defining Synonyms” on page 188 for more information.
Updating the resources in TAPs. See the topic “Updating Text Analysis Packages” on page 137 for
more information.
v Making templates. See the topic “Making and Updating Templates” on page 161 for more
information.
v Importing and exporting templates. See the topic “Importing and Exporting Templates” on page 170
for more information.
v Publishing libraries. See the topic “Publishing Libraries” on page 178 for more information.
v
v
v
163
Template Editor vs. Resource Editor
There are two main methods for working with and editing your templates, libraries, and their resources.
You can work on linguistic resources in the Template Editor or the Resource Editor.
Template Editor
The Template Editor allows you to create and edit resource templates without an interactive workbench
session and independent of a specific node or stream. You can use this editor to create or edit resource
templates before loading them into the Text Link Analysis node and the Text Mining modeling node.
The Template Editor is accessible through the main IBM SPSS Modeler toolbar from the Tools > Text
Analytics Template Editor menu.
Resource Editor
The Resource Editor, which is accessible within an interactive workbench session, allows you to work
with the resources in the context of a specific node and dataset. When you add a Text Mining modeling
node to a stream, you can load a copy of a resource template's content or a copy of a text analysis
package (category sets and resources) to control how text is extracted for text mining. When you launch
an interactive workbench session, in addition to creating categories, extracting text link analysis patterns,
and creating category models, you can also fine-tune the resources for that session's data in the integrated
Resource Editor view. See the topic “Editing Resources in the Resource Editor” on page 159 for more
information.
Whenever you work on the resources in an interactive workbench session, those changes apply only to
that session. If you want to save your work (resources, categories, patterns, etc.) so you can continue in a
subsequent session, you must update the modeling node. See the topic “Updating Modeling Nodes and
Saving” on page 82 for more information.
If you want to save your changes back to the original template, whose contents were copied into the
modeling node, so that this updated template can be loaded into other nodes, you can make a template
from the resources. See the topic “Making and Updating Templates” on page 161 for more information.
The Editor Interface
The operations that you perform in the Template Editor or Resource Editor revolve around the
management and fine-tuning of the linguistic resources. These resources are stored in the form of
templates and libraries. See the topic “Type Dictionaries” on page 181 for more information.
Library Resources tab
164
IBM SPSS Modeler Text Analytics 16 User's Guide
Figure 37. Text Mining Template Editor
The interface is organized into four parts, as follows:
1. Library Tree pane. Located in the upper left corner, this plan displays a tree of the libraries. You can
enable and disable libraries in this tree as well as filter the views in the other panes by selecting a library
in the tree. You can perform many operations in this tree using the context menus. If you expand a
library in the tree, you can see the set of types it contains. You can also filter this list through the View
menu if you want to focus on a particular library only.
2. Term Lists from Type Dictionaries pane. Located to the right of the library tree, this pane displays the
term lists of the type dictionaries for the libraries selected in the tree. A type dictionary is a collection of
terms to be grouped under one label, or type, name. When the extraction engine reads your text data, it
compares words found in the text to the terms in the type dictionaries. If an extracted concept appears as
a term in a type dictionary, then that type name is assigned. You can think of the type dictionary as a
distinct dictionary of terms that have something in common. For example, the <Location> type in the
Core library contains concepts such as new orleans, great britain, and new york. These terms all
represent geographical locations. A library can contain one or more type dictionaries. See the topic “Type
Dictionaries” on page 181 for more information.
3. Exclude Dictionary pane. Located on the right side, this pane displays the collection of terms that will
be excluded from the final extraction results. The terms appearing in this exclude dictionary do not
appear in the Extraction Results pane. Excluded terms can be stored in the library of your choosing.
However, the Exclude Dictionary pane displays all of the excluded terms for all libraries visible in the
library tree.See the topic “Exclude Dictionaries” on page 191 for more information.
Chapter 15. Templates and Resources
165
4. Substitution Dictionary pane. Located in the lower left, this pane displays synonyms and optional
elements, each in their own tab. Synonyms and optional elements help group similar terms under one
lead, or target, concept in the final extraction results. This dictionary can contain known synonyms and
user-defined synonyms and elements, as well as common misspellings paired with the correct spelling.
Synonym definitions and optional elements can be stored in the library of your choosing. However, the
substitution dictionary pane displays all of the contents for all libraries visible in the library tree. While
this pane displays all synonyms or optional elements from all libraries, The substitutions for all of the
libraries in the tree are shown together in this pane. A library can contain only one substitution
dictionary. See the topic “Substitution/Synonym Dictionaries” on page 187 for more information. Please
note that the Optional Elements tab does not apply to Japanese text language resources.
Notes:
v If you want to filter so that you see only the information pertaining to a single library, you can change
the library view using the drop-down list on the toolbar. It contains a top-level entry called All
Libraries as well as an additional entry for each individual library. See the topic “Viewing Libraries”
on page 175 for more information.
v The editor interface for the Japanese text language is different from other text languages.
Advanced Resources tab
The advanced resources are available from the second tab of the editor view. You can review and edit the
advanced resources in this tab. See the topic Chapter 18, “About Advanced Resources,” on page 193 for
more information.
Important! This tab is not available for resources tuned for Japanese text.
166
IBM SPSS Modeler Text Analytics 16 User's Guide
Figure 38. Text Mining Template Editor - Advanced Resources tab
Text Link Rules tab
Since version 14, the text link analysis rules are editable in their own tab of the editor view. You can work
in the rule editor, create your own rules, and even run simulations to see how your rules impact the TLA
results. See the topic Chapter 19, “About Text Link Rules,” on page 205 for more information.
Important! This tab is not available for resources tuned for Japanese text.
Chapter 15. Templates and Resources
167
Figure 39. Text Mining Template Editor - Text Link Rules tab
Opening Templates
When you launch the Template Editor, you are prompted to open a template. Likewise, you can open a
template from the File menu. If you want a template that contains some Text Link Analysis (TLA) rules,
make sure to select a template that has an icon in the TLA column. The language for which a template
was created is shown in the Language column.
If you want to import a template that isn't shown in the table or if you want to export a template, you
can use the buttons in the Open Template dialog box. See the topic “Importing and Exporting Templates”
on page 170 for more information.
To Open a Template
1. From the menus in the Template Editor, choose File > Open Resource Template. The Open Resource
Template dialog box opens.
2. Select the template you want to use from those shown in the table.
3. Click OK to open this template. If you currently have another template open in the editor, clicking
OK will abandon that template and display the template you selected here. If you have made changes
to your resources and want to save your libraries for a future use, you can publish, update, and share
them before opening another. See the topic “Sharing Libraries” on page 177 for more information.
168
IBM SPSS Modeler Text Analytics 16 User's Guide
Saving Templates
In the Template Editor, you can save the changes you made to a template. You can choose to save using
an existing template name or by providing a new name.
If you make changes to a template that you've already loaded into a node at a previous time, you will
have to reload the template contents into the node to get the latest changes. See the topic “Copying
Resources From Templates and TAPs” on page 26 for more information.
Or, if you are using the option Use saved interactive work in the Model tab of the Text Mining node,
meaning you are using resources from a previous interactive workbench session, you'll need to switch to
this template's resources from within the interactive workbench session. See the topic “Switching
Resource Templates” on page 162 for more information.
Note: You can also publish and share your libraries. See the topic “Sharing Libraries” on page 177 for
more information.
To Save a Template
1. From the menus in the Template Editor, choose File > Save Resource Template. The Save Resource
Template dialog box opens.
2. Enter a new name in the Template name field, if you want to save this template as a new template.
Select a template in the table, if you want to overwrite an existing template with the currently loaded
resources.
3. If desired, enter a description to display a comment or annotation in the table.
4. Click Save to save the template.
Important! Since resources from templates or TAPs are loaded/copied into the node, you must update
the resources by reloading them if you make changes to a template and want to benefit from these
changes in an existing stream. See the topic “Updating Node Resources After Loading” for more
information.
Updating Node Resources After Loading
By default, when you add a node to a stream, a set of resources from a default template are loaded and
embedded into your node. And if you change templates or use a TAP, when you load them, a copy of
those resources then overwrites the resources. Since templates and TAPs are not linked to the node
directly, any changes you make changes to a template or TAP are not automatically available in a
preexisting node. In order to benefit from those changes, you would have to update the resources in that
node. The resources can be updated in one of two ways.
Method 1: Reloading Resources in Model Tab
If you want to update the resources in the node using a new or updated template or TAP, you can reload
it in the Model tab of the node. By reloading, you will replace the copy of the resources in the node with
a more current copy. For your convenience, the updated time and date will appear on the Model tab
along with the originating template's name. See the topic “Copying Resources From Templates and TAPs”
on page 26 for more information.
However, if you are working with interactive session data in a Text Mining modeling node and you have
selected the Use session work option on the Model tab, the saved session work and resources will be
used and the Load button is disabled. It is disabled because, at one time during an interactive workbench
session, you chose the Update Modeling Node option and kept the categories, resources, and other
session work. In that case, if you want to change or update those resources, you can try the next method
of switching the resources in the Resource Editor.
Chapter 15. Templates and Resources
169
Method 2: Switching Resources in the Resource Editor
Anytime you want to use different resources during an interactive session, you can exchange those
resources using the Switch Resources dialog box. This is especially useful when you want to reuse
existing category work but replace the resources. In this case, you can select the Use session work option
on the Model tab of a Text Mining modeling node. Doing so will disable the ability to reload a template
through the node dialog box and instead keep the settings and changes you made during your session.
Then you can launch the interactive workbench session by executing the stream and switch the resources
in the Resource Editor. See the topic “Switching Resource Templates” on page 162 for more information.
In order to keep session work for subsequent sessions, including the resources, you need to update the
modeling node from within the interactive workbench session so that the resources (and other data) are
saved back to the node. See the topic “Updating Modeling Nodes and Saving” on page 82 for more
information.
Note: If you switch to the contents of another template during an interactive session, the name of the
template listed in the node will still be the name of the last template loaded and copied. In order to
benefit from these resources or other session work, update your modeling node before exiting the session.
Managing Templates
There are also some basic management tasks you might want to perform from time to time on your
templates, such as renaming your templates, importing and exporting templates, or deleting obsolete
templates. These tasks are performed in the Manage Templates dialog box. Importing and exporting
templates enables you to share templates with other users. See the topic “Importing and Exporting
Templates” for more information.
Note: You cannot rename or delete the templates that are installed (or shipped) with this product. Instead,
if you want to rename, you can open the installed template and make a new one with the name of your
choice. You can delete your custom templates; however, if you try to delete a shipped template, it will be
reset to the version originally installed.
To Rename a Template
1. From the menus, choose Resources > Manage Resource Templates. The Manage Templates dialog
box opens.
2. Select the template you want to rename and click Rename. The name box becomes an editable field in
the table.
3. Type a new name and press the Enter key. A confirmation dialog box opens.
4. If you are satisfied with the name change, click Yes. If not, click No.
To Delete a Template
1. From the menus, choose Resources > Manage Resource Templates. The Manage Templates dialog
box opens.
2. In the Manage Templates dialog box, select the template you want to delete.
3. Click Delete. A confirmation dialog box opens.
4. Click Yes to delete or click No to cancel the request. If you click Yes, the template is deleted.
Importing and Exporting Templates
You can share templates with other users or machines by importing and exporting them. Templates are
stored in an internal database but can exported as *.lrt files to your hard drive.
Since there are circumstances under which you might want to import or export templates, there are
several dialog boxes that offer those capabilities.
170
IBM SPSS Modeler Text Analytics 16 User's Guide
v Open Template dialog box in the Template Editor
v Load Resources dialog box in the Text Mining modeling node and Text Link Analysis node.
v Manage Templates dialog box in the Template Editor and the Resource Editor.
To Import a Template
1. In the dialog box, click Import. The Import Template dialog box opens.
2. Select the resource template file (*.lrt) to import and click Import. You can save the template you are
importing with another name or overwrite the existing one. The dialog box closes, and the template
now appears in the table.
To Export a Template
1. In the dialog box, select the template you want export and click Export. The Select Directory dialog
box opens.
2. Select the directory to which you want to export and click Export. This dialog box closes, and the
template is exported and carries the file extension (*.lrt)
Exiting the Template Editor
When you are finished working in the Template Editor, you can save your work and exit the editor.
To Exit the Template Editor
1. From the menus, choose File > Close. The Save and Close dialog box opens.
2. Select Save changes to template in order to save the open template before closing the editor.
3. Select Publish libraries if you want to publish any of the libraries in the open template before closing
the editor. If you select this option, you will be prompted to select the libraries to publish. See the
topic “Publishing Libraries” on page 178 for more information.
Backing Up Resources
You may want to back up your resources from time to time as a security measure.
Important! When you restore, the entire contents of your resources will be wiped clean and only the
contents of the backup file will be accessible in the product. This includes any open work.
Note: You can only backup and restore to the same major version of your software. For example, if you
backup from version 15, you cannot restore that backup to version 16.
To Back Up the Resources
1. From the menus, choose Resources > Backup Tools > Backup Resources. The Backup dialog box
opens.
2. Enter a name for your backup file and click Save. The dialog box closes, and the backup file is
created.
To Restore the Resources
1. From the menus, choose Resources > Backup Tools > Restore Resources. An alert warns you that
restoring will overwrite the current contents of your database.
2. Click Yes to proceed. The dialog box opens.
3. Select the backup file you want to restore and click Open. The dialog box closes, and resources are
restored in the application.
Chapter 15. Templates and Resources
171
Importing Resource Files
If you have made changes directly in resource files outside of this product, you can import them into a
selected library by selecting that library and proceeding with the import. When you import a directory,
you can import all of supported files into a specific open library as well. You can only import *.txt files.
Important! For Japanese language files, the .txt files you want to import must be encoded in UTF8.
Additionally, you cannot import exclude lists for Japanese.
Each imported file must contain only one entry per line, and if the contents are structured as:
v A list words or phrases (one per line). The file is imported as a term list for a type dictionary, where
the type dictionary takes the name of the file minus the extension.
v A list of entries such as term1 <TAB> term2, then it is imported as a list of synonyms, where term1 is the
set of the underlying term and term2 is the target term.
To Import a Single Resource File
1. From the menus, choose Resources > Import Files > Import Single File. The Import File dialog box
opens.
2. Select the file you want to import and click Import. The file contents are transformed into an internal
format and added to your library.
To Import All of the Files in a Directory
1. From the menus, choose Resources > Import Files > Import Entire Directory. The Import Directory
dialog box opens.
2. Select the library in which you want all of the resource files imported from the Import list. If you
select the Default option, a new library will be created using the name of the directory as its name.
3. Select the directory from which to import the files. Subdirectories will not be read.
4. Click Import. The dialog box closes and the content from those imported resource files now appears
in the editor in the form of dictionaries and advanced resource files.
172
IBM SPSS Modeler Text Analytics 16 User's Guide
Chapter 16. Working with Libraries
The resources used by the extraction engine to extract and group terms from your text data always
contain one or more libraries. You can see the set of libraries in the library tree located in the upper left
part of the Template Editor and Resource Editor. The libraries are composed of three kinds of
dictionaries: Type, Substitution, and Exclude. See the topic Chapter 17, “About Library Dictionaries,” on
page 181 for more information.
The resource template or the resources from the TAP you chose includes several libraries to enable you to
immediately begin extracting concepts from your text data. However, you can create your own libraries
as well and also publish them so you can reuse them. See the topic “Publishing Libraries” on page 178
for more information.
For example, suppose that you frequently work with text data related to the automotive industry. After
analyzing your data, you decide that you would like to create some customized resources to handle
industry-specific vocabulary or jargon. Using the Template Editor, you can create a new template, and in
it a library to extract and group automotive terms. Since you will need the information in this library
again, you publish your library to a central repository, accessible in the Manage Libraries dialog box, so
that it can be reused independently in different stream sessions .
Suppose that you are also interested in grouping terms that are specific to different subindustries, such as
electronic devices, engines, cooling systems, or even a particular manufacturer or market. You can create
a library for each group and then publish the libraries so that they can be used with multiple sets of text
data. In this way, you can add the libraries that best correspond to the context of your text data.
Note: Additional resources can be configured and managed in the Advanced Resources tab. Some apply
to all of the libraries and manage nonlinguistic entities, fuzzy grouping exceptions, and so on.
Additionally, you can edit the text link analysis pattern rules, which are library-specific, in the Text Link
Rules tab as well. See the topic Chapter 18, “About Advanced Resources,” on page 193 for more
information.
Shipped Libraries
By default, several libraries are installed with IBM SPSS Modeler Text Analytics. You can use these
preformatted libraries to access thousands of predefined terms and synonyms as well as many different
types. These shipped libraries are fine-tuned to several different domains and are available in several
different languages.
There are a number of libraries but the most commonly used are as follows:
Local library. Used to store user-defined dictionaries. It is an empty library added by default to all
resources. It contains an empty type dictionary too. It is most useful when making changes or
refinements to the resources directly (such as adding a word to a type) from the Categories and
Concepts view, Clusters view, and the Text Link Analysis view . In this case, those changes and
refinements are automatically stored in the first library listed in the library tree in the Resource Editor;
by default, this is the Local Library. You cannot publish this library because it is specific to the session
data. If you want to publish its contents, you must rename the library first.
v Core library. Used in most cases, since it comprises the basic five built-in types representing people,
locations, organizations, products, and unknown. While you may see only a few terms listed in one of
its type dictionaries, the types represented in the Core library are actually complements to the robust
types found in the internal, compiled resources delivered with your text-mining product. These
internal, compiled resources contain thousands of terms for each type. For this reason, while you may
not see a term in the type dictionary term list, it can still be extracted and typed with a Core type. This
v
173
explains how names such as George can be extracted and typed as <Person> when only John appears in
the <Person> type dictionary in the Core library. Similarly, if you do not include the Core library, you
may still see these types in your extraction results, since the compiled resources containing these types
will still be used by the extraction engine.
v Opinions library. Used most commonly to extract opinions and sentiments from text data. This library
includes thousands of words representing attitudes, qualifiers, and preferences that—when used in
conjunction with other terms—indicate an opinion about a subject. This library includes a number of
built-in types, synonyms, and excludes. It also includes a large set of pattern rules used for text link
analysis. To benefit from the text link analysis rules in this library and the pattern results they produce,
this library must be specified in the Text Link Rules tab. See the topic Chapter 19, “About Text Link
Rules,” on page 205 for more information.
v Budget library. Used to extract terms referring to the cost of something. This library includes many
words and phrases that represent adjectives, qualifiers, and judgments regarding the price or quality of
something.
v Variations library. Used to include cases where certain language variations require synonym
definitions to properly group them. This library includes only synonym definitions.
Although some of the libraries shipped outside the templates resemble the contents in some templates,
the templates have been specifically tuned to particular applications and contain additional advanced
resources. We recommend that you try to use a template that was designed for the kind of text data you
are working with and make your changes to those resources rather than just adding individual libraries
to a more generic template.
Compiled resources are also delivered with IBM SPSS Modeler Text Analytics. They are always used
during the extraction process and contain a large number of complementary definitions to the built-in
type dictionaries in the default libraries. Since these resources are compiled, they cannot be viewed or
edited. You can, however, force a term that was typed by these compiled resources into any other
dictionary. See the topic “Forcing Terms” on page 186 for more information.
Creating Libraries
You can create any number of libraries. After creating a new library, you can begin to create type
dictionaries in this library and enter terms, synonyms, and excludes.
To Create a Library
1. From the menus, choose Resources > New Library. The Library Properties dialog opens.
2. Enter a name for the library in the Name text box.
3. If desired, enter a comment in the Annotation text box.
4. Click Publish if you want to publish this library now before entering anything in the library. See the
topic “Sharing Libraries” on page 177 for more information. You can also publish later at any time.
5. Click OK to create the library. The dialog box closes and the library appears in the tree view. If you
expand the libraries in the tree, you will see that an empty type dictionary has been automatically
included in the library. In it, you can immediately begin adding terms. See the topic “Adding Terms”
on page 184 for more information.
Adding Public Libraries
If you want to reuse a library from another session data, you can add it to your current resources as long
as it is a public library. A public library is a library that has been published. See the topic “Publishing
Libraries” on page 178 for more information.
Important! You cannot add a Japanese library to non-Japanese resources or vice versa.
174
IBM SPSS Modeler Text Analytics 16 User's Guide
When you add a public library, a local copy is embedded into your session data. You can make changes
to this library; however, you must republish the public version of the library if you want to share the
changes.
When adding a public library, a Resolve Conflicts dialog box may appear if any conflicts are discovered
between the terms and types in one library and the other local libraries. You must resolve these conflicts
or accept the proposed resolutions in order to complete this operation. See the topic “Resolving Conflicts”
on page 179 for more information.
Note: If you always update your libraries when you launch an interactive workbench session or publish
when you close one , you are less likely to have libraries that are out of sync. See the topic “Sharing
Libraries” on page 177 for more information.
To Add a Library
1. From the menus, choose Resources > Add Library. The Add Library dialog box opens.
2. Select the library or libraries in the list.
3. Click Add. If any conflicts occur between the newly added libraries and any libraries that were
already there, you will be asked to verify the conflict resolutions or change them before completing
the operation. See the topic “Resolving Conflicts” on page 179 for more information.
Finding Terms and Types
You can search in the various panes in the editor using the Find feature. In the editor, you can choose
Edit > Find from the menus and the Find toolbar appears. You can use this toolbar to find one
occurrence at a time. By clicking Find again, you can find subsequent occurrences of your search term.
When searching, the editor searches only the library or libraries listed in the drop-down list on the Find
toolbar. If All Libraries is selected, the program will search everything in the editor.
When you start a search, it begins in the area that has the focus. The search continues through each
section, looping back around until it returns to the active cell. You can reverse the order of the search
using the directional arrows. You can also choose whether or not your search is case sensitive.
To
1.
2.
3.
4.
Find Strings in the View
From the menus, choose Edit > Find. The Find toolbar appears.
Enter the string for which you want to search.
Click the Find button to begin the search. The next occurrence of the term or type is then highlighted.
Click the button again to move from occurrence to occurrence.
Viewing Libraries
You can display the contents of one particular library or all libraries. This can be helpful when dealing
with many libraries or when you want to review the contents of a specific library before publishing it.
Changing the view only impacts what you see in this Library Resources tab but does not disable any
libraries from being used during extraction. See the topic “Disabling Local Libraries” on page 176 for
more information.
The default view is All Libraries, which shows all libraries in the tree and their contents in other panes.
You can change this selection using the drop-down list on the toolbar or through a menu selection (View
> Libraries) When a single library is being viewed, all items in other libraries disappear from view but
are still read during the extraction.
To Change the Library View
Chapter 16. Working with Libraries
175
1. From the menus in the Library Resources tab, choose View > Libraries. A menu with all of the local
libraries opens.
2. Select the library that you want to see or select the All Libraries option to see the contents of all
libraries. The contents of the view are filtered according to your selection.
Managing Local Libraries
Local libraries are the libraries inside your interactive workbench session or inside a template, as opposed
to public libraries. See the topic “Managing Public Libraries” on page 177 for more information. There are
also some basic local library management tasks that you might want to perform, including: renaming,
disabling, or deleting a local library.
Renaming Local Libraries
You can rename local libraries. If you rename a local library, you will disassociate it from the public
version, if a public version exists. This means that subsequent changes can no longer be shared with the
public version. You can republish this local library under its new name. This also means that you will not
be able to update the original public version with any changes that you make to this local version.
Note: You cannot rename a public library.
1. From the menus, choose Edit > Library Properties. The Library Properties dialog box opens.
To Rename a Local Library
1. In the tree view, select the library that you want to rename.
2. Enter a new name for the library in the Name text box.
3. Click OK to accept the new name for the library. The dialog box closes and the library name is
updated in the tree view.
Disabling Local Libraries
If you want to temporarily exclude a library from the extraction process, you can deselect the check box
to the left of the library name in the tree view. This signals that you want to keep the library but want
the contents ignored when checking for conflicts and during extraction.
To Disable a Library
1. In the library tree pane, select the library you want to disable.
2. Click the spacebar. The check box to the left of the name is cleared.
Deleting Local Libraries
You can remove a library without deleting the public version of the library and vice versa. Deleting a
local library will delete the library and all of its content from session only. Deleting a local version of a
library does not remove that library from other sessions or the public version. See the topic “Managing
Public Libraries” on page 177 for more information.
To Delete a Local Library
1. In the tree view, select the library you want to delete.
2. From the menus, choose Edit > Delete to delete the library. The library is removed.
3. If you have never published this library before, a message asking whether you would like to delete or
keep this library opens. Click Delete to continue or Keep if you would like to keep this library.
Note: One library must always remain.
176
IBM SPSS Modeler Text Analytics 16 User's Guide
Managing Public Libraries
In order to reuse local libraries, you can publish them and then work with them and see them through
the Manage Libraries dialog box (Resources > Manage Libraries). See the topic “Sharing Libraries” for
more information. Some basic public library management tasks that you might want to perform include
importing, exporting, or deleting a public library. You cannot rename a public library.
Importing Public Libraries
1. In the Manage Libraries dialog box, click Import.... The Import Library dialog box opens.
2. Select the library file (*.lib) that you want to import and if you also want to add this library locally,
select Add library to current project.
3. Click Import. The dialog box closes. If a public library with the same name already exists, you will be
asked to rename the library that you are importing or to overwrite the current public library.
Exporting Public Libraries
You can export public libraries into the .lib format so that you can share them.
1. In the Manage Libraries dialog box, select the library that you want to export in the list.
2. Click Export. The Select Directory dialog box opens.
3. Select the directory to which you want to export and click Export. The dialog box closes and the
library file (*.lib) is exported.
Deleting Public Libraries
You can remove a local library without deleting the public version of the library and vice versa. However,
if the library is deleted from this dialog box, it can no longer be added to any session resources until a
local version is published again.
If you delete a library that was installed with the product, the originally installed version is restored.
1. In the Manage Libraries dialog box, select the library that you want to delete. You can sort the list by
clicking on the appropriate header.
2. Click Delete to delete the library. IBM SPSS Modeler Text Analytics verifies whether the local version
of the library is the same as the public library. If so, the library is removed with no alert. If the library
versions differ, an alert opens to ask you whether you want to keep or remove the public version is
issued.
Sharing Libraries
Libraries allow you to work with resources in a way that is easy to share among multiple interactive
workbench sessions . Libraries can exist in two states, or versions. Libraries that are editable in the editor
and part of an interactive workbench session are called local libraries. While working with in an
interactive workbench session , you may make a lot of changes in the Vegetables library, for example. If
your changes could be useful with other data, you can make these resources available by creating a
public library version of the Vegetables library. A public library, as the name implies, is available to any
other resources in any interactive workbench session.
You can see the public libraries in the Manage Libraries dialog box. Once this public library version
exists, you can add it to the resources in other contexts so that these custom linguistic resources can be
shared.
The shipped libraries are initially public libraries. It is possible to edit the resources in these libraries and
then create a new public version. Those new versions would then be accessible in other interactive
workbench sessions.
Chapter 16. Working with Libraries
177
As you continue to work with your libraries and make changes, your library versions will become
desynchronized. In some cases, a local version might be more recent than the public version, and in other
cases, the public version might be more recent than the local version. It is also possible for both the
public and local versions to contain changes that the other does not if the public version was updated
from within another interactive workbench session. If your library versions become desynchronized, you
can synchronize them again. Synchronizing library versions consists of republishing and/or updating
local libraries.
Whenever you launch an interactive workbench session or close one , you will be prompted to
synchronize any libraries that need updating or republishing. Additionally, you can easily identify the
synchronization state of your local library by the icon appearing beside the library name in the tree view
or by viewing the Library Properties dialog box. You can also choose to do so at any time through menu
selections. The following table describes the five possible states and their associated icons.
Table 37. Local library synchronization states.
Icon
Local library status description
Unpublished—The local library has never been published.
Synchronized—The local and public library versions are identical. This also applies to the Local Library,
which cannot be published because it is intended to contain only session -specific resources.
Out of date—The public library version is more recent than the local version. You can update your
local version with the changes.
Newer—The local library version is more recent than the public version. You can republish your local
version to the public version.
Out of sync—Both the local and public libraries contain changes that the other does not. You must
decide whether to update or publish your local library. If you update, you will lose the changes that
you made since the last time you updated or published. If you choose to publish, you will overwrite
the changes in the public version.
Note: If you always update your libraries when you launch an interactive workbench session or publish
when you close one, you are less likely to have libraries that are out of synchronization.
You can republish a library any time you think that the changes in the library would benefit other
streams that may also contain this library. Then, if your changes would benefit other streams, you can
update the local versions in those streams. In this way, you can create streams for each context or domain
that applies to your data by creating new libraries and/or adding any number of public libraries to your
resources.
If a public version of a library is shared, there is a greater chance that differences between local and
public versions will arise. Whenever you launch or close and publish from an interactive workbench
session or open or close a template from the Template Editor , a message is displayed to enable you to
publish and/or update any libraries whose versions are not in sync with those in the Manage Libraries
dialog box. If the public library version is more recent than the local version, a dialog box asking whether
you would like to update opens. You can choose whether to keep the local version as is instead of
updating with the public version or merge the updates into the local library.
Publishing Libraries
If you have never published a particular library, publishing entails creating a public copy of your local
library in the database. If you are republishing a library, the contents of the local library will replace the
existing public version's contents. After republishing, you can update this library in any other stream
sessions so that their local versions are in sync with the public version. Even though you can publish a
library, a local version is always stored in the session .
178
IBM SPSS Modeler Text Analytics 16 User's Guide
Important! If you make changes to your local library and, in the meantime, the public version of the
library was also changed, your library is considered to be out of sync. We recommend that you begin by
updating the local version with the public changes, make any changes that you want, and then publish
your local version again to make both versions identical. If you make changes and publish first, you will
overwrite any changes in the public version.
To Publish Local Libraries to the Database
1. From the menus, choose Resources > Publish Libraries. The Publish Libraries dialog box opens, with
all libraries in need of publishing selected by default.
2. Select the check box to the left of each library that you want to publish or republish.
3. Click Publish to publish the libraries to the Manage Libraries database.
Updating Libraries
Whenever you launch or close an interactive workbench session, you can update or publish any libraries
that are no longer in sync with the public versions. If the public library version is more recent than the
local version, a dialog box asking whether you would like to update the library opens. You can choose
whether to keep the local version instead of updating with the public version or replacing the local
version with the public one. If a public version of a library is more recent than your local version, you
can update the local version to synchronize its content with that of the public version. Updating means
incorporating the changes found in the public version into your local version.
Note: If you always update your libraries when you launch an interactive workbench session or publish
when you close one, you are less likely to have libraries that are out of sync. See the topic “Sharing
Libraries” on page 177 for more information.
To Update Local Libraries
1. From the menus, choose Resources > Update Libraries. The Update Libraries dialog box opens, with
all libraries in need of updating selected by default.
2. Select the check box to the left of each library that you want to publish or republish.
3. Click Update to update the local libraries.
Resolving Conflicts
Local versus Public Library Conflicts
Whenever you launch a stream session, IBM SPSS Modeler Text Analytics performs a comparison of the
local libraries and those listed in the Manage Libraries dialog box. If any local libraries in your session
are not in sync with the published versions, the Library Synchronization Warning dialog box opens. You
can choose from the following options to select the library versions that you want to use here:
v All libraries local to file. This option keeps all of your local libraries as they are. You can always
republish or update them later.
v All published libraries on this machine. This option will replace the shown local libraries with the
versions found in the database.
v All more recent libraries. This option will replace any older local libraries with the more recent public
versions from the database.
v Other. This option allows you to manually select the versions that you want by choosing them in the
table.
Forced Term Conflicts
Whenever you add a public library or update a local library, conflicts and duplicate entries may be
uncovered between the terms and types in this library and the terms and types in the other libraries in
Chapter 16. Working with Libraries
179
your resources. If this occurs, you will be asked to verify the proposed conflict resolutions or change
them before completing the operation in the Edit Forced Terms dialog box. See the topic “Forcing Terms”
on page 186 for more information.
The Edit Forced Terms dialog box contains each pair of conflicting terms or types. Alternating
background colors are used to visually distinguish each conflict pair. These colors can be changed in the
Options dialog box. See the topic “Options: Display Tab” on page 80 for more information. The Edit
Forced Terms dialog box contains two tabs:
v Duplicates. This tab contains the duplicated terms found in the libraries. If a pushpin icon appears
after a term, it means that this occurrence of the term has been forced. If a black X icon appears, it
means that this occurrence of the term will be ignored during extraction because it has been forced
elsewhere.
v User Defined. This tab contains a list of any terms that have been forced manually in the type
dictionary term pane and not through conflicts.
Note: The Edit Forced Terms dialog box opens after you add or update a library. If you cancel out of this
dialog box, you will not be canceling the update or addition of the library.
To Resolve Conflicts
1. In the Edit Forced Terms dialog box, select the radio button in the Use column for the term that you
want to force.
2. When you have finished, click OK to apply the forced terms and close the dialog box. If you click
Cancel, you will cancel the changes you made in this dialog box.
180
IBM SPSS Modeler Text Analytics 16 User's Guide
Chapter 17. About Library Dictionaries
The resources used to extract text data are stored in the form of templates and libraries. A library can be
made up of three dictionaries.
v The type dictionary contains a collection of terms grouped under one label, or type name. When the
extraction engine reads your text data, it compares the words found in the text to the terms defined in
your type dictionaries. During extraction, inflected forms of a type's terms and synonyms are grouped
under a target term called concept. Extracted concepts are assigned to the type dictionary in which
they appear as terms. You can manage your type dictionaries in the upper left and center panes of the
editor—the library tree and the term pane. See the topic “Type Dictionaries” for more information.
v The substitution dictionary contains a collection of words defined as synonyms or as optional
elements used to group similar terms under one target term, called a concept in the final extraction
results. You can manage your substitution dictionaries in the lower left pane of the editor using the
Synonyms tab and the Optional tab. See the topic “Substitution/Synonym Dictionaries” on page 187
for more information.
v The exclude dictionary contains a collection of terms and types that will be removed from the final
extraction results. You can manage your exclude dictionaries in the rightmost pane of the editor. See
the topic “Exclude Dictionaries” on page 191 for more information.
See the topic Chapter 16, “Working with Libraries,” on page 173 for more information.
Type Dictionaries
A type dictionary is made up of a type name, or label, and a list of terms. Type dictionaries are managed
in the upper left and center panes of Library Resources tab in the editor. You can access this view with
View > Resource Editor in the menus, if you are in an interactive workbench session. Otherwise, you can
edit dictionaries for a specific template in the Template Editor.
When the extraction engine reads your text data, it compares words found in the text to the terms
defined in your type dictionaries. Terms are words or phrases in the type dictionaries in your linguistic
resources.
When a word matches a term, it is assigned to the type name for that term. When the resources are read
during extraction, the terms that were found in the text then go through several processing steps before
they become concepts in the Extraction Results pane. If multiple terms belonging to the same type
dictionary are determined to be synonymous by the extraction engine, then they are grouped under the
most frequently occurring term and called a concept in the Extraction Results pane. For example, if the
terms question and query might appear under the concept name question in the end.
181
Figure 40. Library tree and term pane
The list of type dictionaries is shown in the library tree pane on the left. The content of each type
dictionary appears in the center pane. Type dictionaries consist of more than just a list of terms. The
manner in which words and word phrases in your text data are matched to the terms defined in the type
dictionaries is determined by the match option defined. A match option specifies how a term is anchored
with respect to a candidate word or phrase in the text data. See the topic “Adding Terms” on page 184
for more information.
Note: Not all options, such as the match option and inflected forms, apply to Japanese text.
Additionally, you can extend the terms in your type dictionary by specifying whether you want to
automatically generate and add inflected forms of the terms to the dictionary. By generating the inflected
forms, you automatically add plural forms of singular terms, singular forms of plural terms, and
adjectives to the type dictionary. See the topic “Adding Terms” on page 184 for more information.
Note: For most languages, concepts that are not found in any type dictionary but are extracted from the
text are automatically typed as <Unknown>
Built-in Types
IBM SPSS Modeler Text Analytics is delivered with a set of linguistic resources in the form of shipped
libraries and compiled resources. The shipped libraries contain a set of built-in type dictionaries such as
<Location>, <Organization>, <Person>, and <Product>.
Note: The set of default, built-in types is different for Japanese text.
These type dictionaries are used by the extraction engine to assign types to the concepts it extracts such
as assigned the type <Location> to the concept paris. Although a large number of terms have been
defined in the built-in type dictionaries, they do not cover every possibility. Therefore, you can add to
them or create your own. For a description of the contents of a particular shipped type dictionary, read
the annotation in the Type Properties dialog box. Select the type in the tree and choose Edit > Properties
from the context menu.
Note: In addition to the shipped libraries, the compiled resources (also used by the extraction engine)
contain a large number of definitions complementary to the built-in type dictionaries, but their content is
182
IBM SPSS Modeler Text Analytics 16 User's Guide
not visible in the product. You can, however, force a term that was typed by the compiled dictionaries
into any other dictionary. See the topic “Forcing Terms” on page 186 for more information.
Creating Types
You can create type dictionaries to help group similar terms. When terms appearing in this dictionary are
discovered during the extraction process, they will be assigned to this type name and extracted under a
concept name. Whenever you create a library, an empty type library is always included so that you can
begin entering terms immediately.
Important!: You cannot create new types for Japanese resources.
If you are analyzing text about food and want to group terms relating to vegetables, you could create
your own <Vegetables> type dictionary. You could then add terms such as carrot, broccoli, and spinach
if you feel that they are important terms that will appear in the text. Then, during extraction, if any of
these terms are found, they are extracted as concepts and assigned to the <Vegetables> type.
You do not have to define every form of a word or expression, because you can choose to generate the
inflected forms of terms. By choosing this option, the extraction engine will automatically recognize
singular or plural forms of the terms among other forms as belonging to this type. This option is
particularly useful when your type contains mostly nouns, since it is unlikely you would want inflected
forms of verbs or adjectives.
The Type Properties dialog box contains the following fields.
Name. The name you give to the type dictionary you are creating. We recommend that you do not use
spaces in type names, especially if two or more type names start with the same word.
Note: There are some constraints about type names and the use of symbols. For example, do not use
symbols such as "@" or "!" within the name.
Default match. The default match attribute instructs the extraction engine how to match this term to text
data. Whenever you add a term to this type dictionary, this is the match attribute automatically assigned
to it. You can always change the match choice manually in the term list. Options include: Entire Term,
Start, End, Any, Start or End, Entire and Start, Entire and End, Entire and (Start or End), and Entire
(no compounds). See the topic “Adding Terms” on page 184 for more information. This option does not
apply to Japanese resources.
Add to. This field indicates the library in which you will create your new type dictionary.
Generate inflected forms by default. This option tells the extraction engine to use grammatical
morphology to capture and group similar forms of the terms that you add to this dictionary, such as
singular or plural forms of the term. This option is particularly useful when your type contains mostly
nouns. When you select this option, all new terms added to this type will automatically have this option
although you can change it manually in the list. This option does not apply to Japanese resources.
Font color. This field allows you to distinguish the results from this type from others in the interface. If
you select Use parent color, the default type color is used for this type dictionary, as well. This default
color is set in the options dialog box. See the topic “Options: Display Tab” on page 80 for more
information. If you select Custom, select a color from the drop-down list.
Annotation. This field is optional and can be used for any comments or descriptions.
To Create a Type Dictionary
1. Select the library in which you would like to create a new type dictionary.
2. From the menus, choose Tools > New Type. The Type Properties dialog box opens.
Chapter 17. About Library Dictionaries
183
3. Enter the name of your type dictionary in the Name text box and choose the options you want.
4. Click OK to create the type dictionary. The new type is visible in the library tree pane and appears in
the center pane. You can begin adding terms immediately. For more information, see “Adding Terms.”
Note: These instructions show you how to make changes within the Resource Editor view or the Template
Editor. Keep in mind that you can also do this kind of fine-tuning directly from the Extraction Results
pane, Data pane, Categories pane, or Cluster Definitions dialog box in the other views. See the topic
“Refining Extraction Results” on page 93 for more information.
Adding Terms
The library tree pane displays libraries and can be expanded to show the type dictionaries that they
contain. In the center pane, a term list displays the terms in the selected library or type dictionary,
depending on the selection in the tree.
Important! Terms are defined differently for Japanese resources.
In the Resource Editor, you can add terms to a type dictionary directly in the term pane or through the
Add New Terms dialog box. The terms that you add can be single words or compound words. You will
always find a blank row at the top of the list to allow you to add a new term.
Note: These instructions show you how to make changes within the Resource Editor view or the Template
Editor. Keep in mind that you can also do this kind of fine-tuning directly from the Extraction Results
pane, Data pane, Categories pane, or Cluster Definitions dialog box in the other views. See the topic
“Refining Extraction Results” on page 93 for more information.
Term Column
In this column, enter single or compound words into the cell. The color in which the term appears
depends on the color for the type in which the term is stored or forced. You can change type colors in the
Type Properties dialog box. See the topic “Creating Types” on page 183 for more information.
Force Column
In this column, by putting a pushpin icon into this cell, the extraction engine knows to ignore any other
occurrences of this same term in other libraries. See the topic “Forcing Terms” on page 186 for more
information.
Match Column
In this column, select a match option to instruct the extraction engine how to match this term to text
data. See the table for examples. You can change the default value by editing the type properties. See the
topic “Creating Types” on page 183 for more information. From the menus, choose Edit > Change Match.
The following are the basic match options since combinations of these are also possible:
v Start. If the term in the dictionary matches the first word in a concept extracted from the text, this
type is assigned. For example, if you enter apple, apple tart will be matched.
End. If the term in the dictionary matches the last word in a concept extracted from the text, this type
is assigned. For example, if you enter apple, cider apple will be matched.
v Any. If the term in the dictionary matches any word of a concept extracted from the text, this type is
assigned. For example, if you enter apple, the Any option will type apple tart, cider apple, and
cider apple tart the same way.
v
v
Entire Term. If the entire concept extracted from the text matches the exact term in the dictionary, this
type is assigned. Adding a term as Entire term, Entire and Start, Entire and End, Entire and Any, or
Entire (no compounds) will force the extraction of a term.
184
IBM SPSS Modeler Text Analytics 16 User's Guide
Furthermore, since the <Person> type extracts only two part names, such as edith piaf or mohandas
gandhi, you may want to explicitly add the first names to this type dictionary if you are trying to
extract a first name when no last name is mentioned. For example, if you want to catch all instances of
edith as a name, you should add edith to the <Person> type using Entire term or Entire and Start.
v Entire (no compounds). If the entire concept extracted from the text matches the exact term in the
dictionary, this type is assigned and the extraction is stopped to prohibit the extraction from matching
the term to a longer compound. For example, if you enter apple, the Entire (no compound) option will
type apple and not extract the compound apple sauce unless it is forced in somewhere else.
In the following table, assume that the term apple is in a type dictionary. Depending on the match
option, this table shows which concepts would be extracted and typed if they were found in the text.
Table 38. Matching Examples.
Match options for
the term:
Extracted concepts
apple
apple
apple tart
ripe apple
homemade
apple tart
never extracted
never extracted
never extracted
Entire Term
Start
End
Start or End
Entire and Start
Entire and End
Entire and (Start or End)
Any
Entire and Any
Entire (no compounds)
Inflect Column
In this column, select whether the extraction engine should generate inflected forms of this term during
extraction so that they are all grouped together. The default value for this column is defined in the Type
Properties but you can change this option on a case-by-case basis directly in the column. From the
menus, choose Edit > Change Inflection.
Type Column
Chapter 17. About Library Dictionaries
185
In this column, select a type dictionary from the drop-down list. The list of types is filtered according to
your selection in the library tree pane. The first type in the list is always the default type selected in the
library tree pane. From the menus, choose Edit > Change Type.
Library Column
In this column, the library in which your term is stored appears. You can drag and drop a term into
another type in the library tree pane to change its library.
To Add a Single Term to a Type Dictionary
1. In the library tree pane, select the type dictionary to which you want to add the term.
2. In the term list in the center pane, type your term in the first available empty cell and set any options
you want for this term.
To Add Multiple Terms to a Type Dictionary
1. In the library tree pane, select the type dictionary to which you want to add terms.
2. From the menus, choose Tools > New Terms. The Add New Terms dialog box opens.
3. Enter the terms you want to add to the selected type dictionary by typing the terms or copying and
pasting a set of terms. If you enter multiple terms, you must separate them using the delimiter that is
defined in the Options dialog, or add each term on a new line. See the topic “Setting Options” on
page 79 for more information.
4. Click OK to add the terms to the dictionary. The match option is automatically set to the default
option for this type library. The dialog box closes and the new terms appear in the dictionary.
Forcing Terms
If you want a term to be assigned to a particular type, you can add it to the corresponding type
dictionary. However, if there are multiple terms with the same name, the extraction engine must know
which type should be used. Therefore, you will be prompted to select which type should be used. This is
called forcing a term into a type. This option is most useful when overriding the type assignment from a
compiled (internal, noneditable) dictionary. In general, we recommend avoiding duplicate terms
altogether.
Forcing will not remove the other occurrences of this term; rather, they will be ignored by the extraction
engine. You can later change which occurrence should be used by forcing or unforcing a term. You may
also need to force a term into a type dictionary when you add a public library or update a public library.
You can see which terms are forced or ignored in the Force column, the second column in the term pane.
If a pushpin icon appears, this means that this occurrence of the term has been forced. If a black X icon
appears, this means that this occurrence of the term will be ignored during extraction because it has been
forced elsewhere. Additionally, when you force a term, it will appear in the color for the type in which it
was forced. This means that if you forced a term that is in both Type 1 and Type 2 into Type 1, any time
you see this term in the window, it will appear in the font color defined for Type 1.
You can double-click the icon in order to change the status. If the term appears elsewhere, a Resolve
Conflicts dialog box opens to allow you to select which occurrence should be used.
Renaming Types
You can rename a type dictionary or change other dictionary settings by editing the type properties.
Important! We recommend that you do not use spaces in type names, especially if two or more type
names start with the same word. We also recommend that you do not rename the types in the Core or
Opinions libraries or change their default match attributes.
186
IBM SPSS Modeler Text Analytics 16 User's Guide
To Rename a Type
1. In the library tree pane, select the type dictionary you want to rename.
2. Right-click your mouse and choose Type Properties from the context menu. The Type Properties
dialog box opens.
3. Enter the new name for your type dictionary in the Name text box.
4. Click OK to accept the new name. The new type name is visible in the library tree pane.
Moving Types
You can drag a type dictionary to another location within a library or to another library in the tree.
To Reorder a Type within a Library
1. In the library tree pane, select the type dictionary you want to move.
2. From the menus, choose Edit > Move Up to move the type dictionary up one position in the library
tree pane or Edit > Move Down to move it down one position.
To Move a Type to Another Library
1. In the library tree pane, select the type dictionary you want to move.
2. Right-click your mouse and choose Type Properties from the context menu. The Type Properties
dialog box opens. (You can also drag and drop the type into another library).
3. In the Add To list box, select the library to which you want to move the type dictionary.
4. Click OK. The dialog box closes, and the type is now in the library you selected.
Disabling and Deleting Types
If you want to temporarily remove a type dictionary, you can disable it by deselecting the check box to
the left of the dictionary name in the library tree pane. This signals that you want to keep the dictionary
in your library but want the contents ignored during conflict checking and during the extraction process.
You can also permanently delete type dictionaries from a library.
To Disable a Type Dictionary
1. In the library tree pane, select the type dictionary you want to disable.
2. Click the spacebar. The check box to the left of the type name is cleared.
To Delete a Type Dictionary
1. In the library tree pane, select the type dictionary you want to delete.
2. From the menus, choose Edit > Delete to delete the type dictionary.
Substitution/Synonym Dictionaries
A substitution dictionary is a collection of terms that help to group similar terms under one target term.
Substitution dictionaries are managed in the bottom pane of the Library Resources tab. You can access
this view with View > Resource Editor in the menus, if you are in an interactive workbench session.
Otherwise, you can edit dictionaries for a specific template in the Template Editor.
You can define two forms of substitutions in this dictionary: synonyms and optional elements. You can
click the tabs in this pane to switch between them.
After you run an extraction on your text data, you may find several concepts that are synonyms or
inflected forms of other concepts. By identifying optional elements and synonyms, you can force the
extraction engine to map these to one single target term.
Chapter 17. About Library Dictionaries
187
Substituting using synonyms and optional elements reduces the number of concepts in the Extraction
Results pane by combining them together into more significant, representative concepts with higher
frequency Doc. counts.
Note: For Japanese resources, optional elements do not apply and are not available. Additionally,
synonyms are handled slightly differently for Japanese text.
Synonyms
Synonyms associate two or more words that have the same meaning. You can also use synonyms to
group terms with their abbreviations or to group commonly misspelled words with the correct spelling.
You can define these synonyms on the Synonyms tab.
A synonym definition is made up of two parts. The first is a Target term, which is the term under which
you want the extraction engine to group all synonym terms. Unless this target term is used as a synonym
of another target term or unless it is excluded, it is likely to become the concept that appears in the
Extraction Results pane. The second is the list of synonyms that will be grouped under the target term.
For example, if you want automobile to be replaced by vehicle, then automobile is the synonym and
vehicle is the target term.
You can enter any words into the Synonym column, but if the word is not found during extraction and
the term had a match option with Entire, then no substitution can take place. However, the target term
does not need to be extracted for the synonyms to be grouped under this term.
Optional Elements
Optional elements identify optional words in a compound term that can be ignored during extraction in
order to keep similar terms together even if they appear slightly different in the text. Optional elements
are single words that, if removed from a compound, could create a match with another term. These single
words can appear anywhere within the compound--at the beginning, middle, or end. You can define
optional elements on the Optional tab.
For example, to group the terms ibm and ibm corp together, you should declare corp to be treated as an
optional element in this case. In another example, if you designate the term access to be an optional
element and during extraction both internet access speed and internet speed are found, they will be
grouped together under the term that occurs most frequently.
Note: For Japanese text resources, there is no Optional Elements tab since optional elements do not apply.
Defining Synonyms
On the Synonyms tab, you can enter a synonym definition in the empty line at the top of the table. Begin
by defining the target term and its synonyms. You can also select the library in which you would like to
store this definition. During extraction, all occurrences of the synonyms will be grouped under the target
term in the final extraction. See the topic “Adding Terms” on page 184 for more information.
For example, if your text data includes a lot of telecommunications information, you may have these
terms: cellular phone, wireless phone, and mobile phone. In this example, you may want to define
cellular and mobile as synonyms of wireless. If you define these synonyms, then every extracted
occurrence of cellular phone and mobile phone will be treated as the same term as wireless phone and
will appear together in the term list.
When you are building your type dictionaries, you may enter a term and then think of three or four
synonyms for that term. In that case, you could enter all of the terms and then your target term into the
substitution dictionary and then drag the synonyms.
188
IBM SPSS Modeler Text Analytics 16 User's Guide
Note: Synonyms are handled slightly differently for Japanese text.
Synonym substitution is also applied to the inflected forms (such as the plural form) of the synonym.
Depending on the context, you may want to impose constraints on how terms are substituted. Certain
characters can be used to place limits on how far the synonym processing should go:
v Exclamation mark (!). When the exclamation mark directly precedes the synonym !synonym, this
indicates that no inflected forms of the synonym will be substituted by the target term. However, an
exclamation mark directly preceding the target term !target-term means that you do not want any
part of the compound target term or variants to receive any further substitutions.
v Asterisk (*). An asterisk placed directly after a synonym, such as synonym*, means that you want this
word to be replaced by the target term. For example, if you defined manage* as the synonym and
management as the target, then associate managers will be replaced by the target term associate
management. You can also add a space and an asterisk after the word (synonym *) such as internet *. If
you defined the target as internet and the synonyms as internet * * and web *, then internet
access card and web portal would be replaced with internet. You cannot begin a word or string with
the asterisk wildcard in this dictionary.
v Caret (^). A caret and a space preceding the synonym, such as ^ synonym, means that the synonym
grouping applies only when the term begins with the synonym. For example, if you define ^ wage as
the synonym and income as the target and both terms are extracted, then they will be grouped together
under the term income. However, if minimum wage and income are extracted, they will not be grouped
together, since minimum wage does not begin with wage. A space must be placed between this symbol
and the synonym.
v Dollar sign ($). A space and a dollar sign following the synonym, such as synonym $, means that the
synonym grouping applies only when the term ends with the synonym. For example, if you define
cash $ as the synonym and money as the target and both terms are extracted, then they will be grouped
together under the term money. However, if cash cow and money are extracted, they will not be grouped
together, since cash cow does not end with cash. A space must be placed between this symbol and the
synonym.
v Caret (^) and dollar sign ($). If the caret and dollar sign are used together, such as ^ synonym $, a
term matches the synonym only if it is an exact match. This means that no words can appear before or
after the synonym in the extracted term in order for the synonym grouping to take place. For example,
you may want to define ^ van $ as the synonym and truck as the target so that only van is grouped
with truck, while marie van guerin will be left unchanged. Additionally, whenever you define a
synonym using the caret and dollar signs and this word appears anywhere in the source text, the
synonym is automatically extracted.
Note: These special characters and wildcards are not supported for Japanese text.
To Add a Synonym Entry
1. With the substitution pane displayed, click the Synonyms tab in the lower left corner.
2. In the empty line at the top of the table, enter your target term in the Target column. The target term
you entered appears in color. This color represents the type in which the term appears or is forced, if
that is the case. If the term appears in black, this means that it does not appear in any type
dictionaries.
3. Click in the second cell to the right of the target and enter the set of synonyms. Separate each entry
using the global delimiter as defined in the Options dialog box. See the topic “Setting Options” on
page 79 for more information. The terms that you enter appear in color. This color represents the type
in which the term appears. If the term appears in black, this means that it does not appear in any
type dictionaries.
4. Click in the last cell to select the library in which you want to store this synonym definition.
Note: These instructions show you how to make changes within the Resource Editor view or the Template
Editor. Keep in mind that you can also do this kind of fine-tuning directly from the Extraction Results
Chapter 17. About Library Dictionaries
189
pane, Data pane, Categories pane, or Cluster Definitions dialog box in the other views. See the topic
“Refining Extraction Results” on page 93 for more information.
Defining Optional Elements
On the Optional tab, you can define optional elements for any library you want. These entries are
grouped together for each library. As soon as a library is added to the library tree pane, an empty
optional element line is added to the Optional tab.
All entries are transformed into lowercase words automatically. The extraction engine will match entries
to both lowercase and uppercase words in the text.
Note: For Japanese resources, optional elements do not apply and are not available.
Note: Terms are delimited using the delimiter defined in the Options dialog. See the topic “Setting
Options” on page 79 for more information. If the optional element that you are entering includes the
same delimiter as part of the term, a backslash must precede it.
To Add an Entry
1. With the substitution pane displayed, click the Optional tab in the lower left corner of the editor.
2. Click in the cell in the Optional Elements column for the library to which you want to add this entry.
3. Enter the optional element. Separate each entry using the global delimiter as defined in the Options
dialog box. See the topic “Setting Options” on page 79 for more information.
Disabling and Deleting Substitutions
You can remove an entry in a temporary manner by disabling it in your dictionary. By disabling an entry,
the entry will be ignored during extraction.
You can also delete any obsolete entries in your substitution dictionary.
To Disable an Entry
1. In your dictionary, select the entry you want to disable.
2. Click the spacebar. The check box to the left of the entry is cleared.
Note: You can also deselect the check box to the left of the entry to disable it.
To Delete a Synonym Entry
1. In your dictionary, select the entry you want to delete.
2. From the menus, choose Edit > Delete or press the Delete key on your keyboard. The entry is no
longer in the dictionary.
To
1.
2.
3.
Delete an Optional Element Entry
In your dictionary, double-click the entry you want to delete.
Manually delete the term.
Press Enter to apply the change.
190
IBM SPSS Modeler Text Analytics 16 User's Guide
Exclude Dictionaries
An exclude dictionary is a list of words, phrases, or partial strings. Any terms matching or containing an
entry in the exclude dictionary will be ignored or excluded from extraction. Exclude dictionaries are
managed in the right pane of the editor. Typically, the terms that you add to this list are fill-in words or
phrases that are used in the text for continuity but that do not really add anything important to the text
and may clutter the extraction results. By adding these terms to the exclude dictionary, you can make
sure that they are never extracted.
Exclude dictionaries are managed in the upper right pane of Library Resources tab in the editor. You can
access this view with View > Resource Editor in the menus, if you are in an interactive workbench
session. Otherwise, you can edit dictionaries for a specific template in the Template Editor.
In the exclude dictionary, you can enter a word, phrase, or partial string in the empty line at the top of
the table. You can add character strings to your exclude dictionary as one or more words or even partial
words using the asterisk as a wildcard. The entries declared in the exclude dictionary will be used to bar
concepts from extraction. If an entry is also declared somewhere else in the interface, such as in a type
dictionary, it is shown with a strike-through in the other dictionaries, indicating that it is currently
excluded. This string does not have to appear in the text data or be declared as part of any type
dictionary to be applied.
Note: If you add a concept to the exclude dictionary that also acts as the target in a synonym entry, then
the target and all of its synonyms will also be excluded. See the topic “Defining Synonyms” on page 188
for more information.
Using Wildcards (*)
For all text languages besides Japanese, you can use the asterisk wildcard to denote that you want the
exclude entry to be treated as a partial string. Any terms found by the extraction engine that contain a
word that begins or ends with a string entered in the exclude dictionary will be excluded from the final
extraction. However, there are two cases where the wildcard usage is not permitted:
v Dash character (-) preceded by an asterisk wildcard, such as *v Apostrophe (') preceded by an asterisk wildcard, such as *'s
Table 39. Examples of exclude entries.
Entry
Example
Results
word
next
No concepts (or its terms) will be extracted if they contain the word next.
phrase
for example
No concepts (or its terms) will be extracted if they contain the phrase for example.
partial
copyright*
Will exclude any concepts (or its terms) matching or containing the variations of
the word copyright, such as copyrighted, copyrighting, copyrights, or copyright
2010.
partial
*ware
Will exclude any concepts (or its terms) matching or containing the variations of
the word ware, such as freeware, shareware, software, hardware, beware, or
silverware.
To Add Entries
1. In the empty line at the top of the table, enter a term. The term that you enter appears in color. This
color represents the type in which the term appears. If the term appears in black, this means that it
does not appear in any type dictionaries.
To Disable Entries
Chapter 17. About Library Dictionaries
191
You can temporarily remove an entry by disabling it in your exclude dictionary. By disabling an entry,
the entry will be ignored during extraction.
1. In your exclude dictionary, select the entry that you want to disable.
2. Click the spacebar. The check box to the left of the entry is cleared.
Note: You can also deselect the check box to the left of the entry to disable it.
To Delete Entries
You can delete any unneeded entries in your exclude dictionary.
1. In your exclude dictionary, select the entry that you want to delete.
2. From the menus, choose Edit > Delete. The entry is no longer in the dictionary.
192
IBM SPSS Modeler Text Analytics 16 User's Guide
Chapter 18. About Advanced Resources
In addition to type, exclude and substitution dictionaries, you can also work with a variety of advanced
resource settings such as Fuzzy Grouping settings or nonlinguistic type definitions. You can work with
these resources in the Advanced Resources tab in the Template Editor or Resource Editor view.
Important! This tab is not available for resources tuned for Japanese text.
When you go to the Advanced Resources tab, you can edit the following information:
v Target language for resources. Used to select the language for which the resources will be created and
tuned. See the topic “Target Language for Resources” on page 195 for more information.
v Fuzzy Grouping (Exceptions). Used to exclude word pairs from the fuzzy grouping (spelling error
correction) algorithm. See the topic “Fuzzy Grouping” on page 196 for more information.
v Nonlinguistic Entities. Used to enable and disable which nonlinguistic entities can be extracted, as
well as the regular expressions and the normalization rules that are applied during their extraction. See
the topic “Nonlinguistic Entities” on page 196 for more information.
v Language Handling. Used to declare the special ways of structuring sentences (extraction patterns and
forced definitions) and using abbreviations for the selected language. See the topic “Language
Handling” on page 201 for more information.
v Language Identifier. Used to configure the automatic Language Identifier called when the language is
set to All. See the topic “Language Identifier” on page 202 for more information.
193
Figure 41. Text Mining Template Editor - Advanced Resources tab
Note: You can use the Find/Replace toolbar to find information quickly or to make uniform changes to a
section. See the topic “Replacing” on page 195 for more information.
To Edit Advanced Resources
1. Locate and select the resource section that you want to edit. The contents appear in the right pane.
2. Use the menu or the toolbar buttons to cut, copy, or paste content, if necessary.
3. Edit the file(s) that you want to change using the formatting rules in this section. Your changes are
saved as soon as you make them. Use the undo or redo arrows on the toolbar to revert to the
previous changes.
Finding
In some cases, you may need to locate information quickly in a particular section. For example, if you
perform text link analysis, you may have hundreds of macros and pattern definitions. Using the Find
feature, you can find a specific rule quickly. To search for information in a section, you can use the Find
toolbar.
To Use the Find Feature
1. Locate and select the resource section that you want to search. The contents appear in the right pane
of the editor.
194
IBM SPSS Modeler Text Analytics 16 User's Guide
2. From the menus, choose Edit > Find. The Find toolbar appears at the upper right of the Edit
Advanced Resources dialog box.
3. Enter the word string that you want to search for in the text box. You can use the toolbar buttons to
control the case sensitivity, partial matching, and direction of the search.
4. Click Find to start the search. If a match is found, the text is highlighted in the window.
5. Click Find again to look for the next match.
Note: When working in the Text Link Rules tab, the Find option is only available when you view the
source code.
Replacing
In some cases, you may need to make broader updates to your advanced resources. The Replace feature
can help you to make uniform updates to your content.
To Use the Replace Feature
1. Locate and select the resource section in which you want to search and replace. The contents appear
in the right pane of the editor.
2. From the menus, choose Edit > Replace. The Replace dialog box opens.
3. In the Find what text box, enter the word string that you want to search for.
4. In the Replace with text box, enter the string that you want to use in place of the text that was
found.
5. Select Match whole word only if you want to find or replace only complete words.
6. Select Match case if you want to find or replace only words that match the case exactly.
7. Click Find Next to find a match. If a match is found, the text is highlighted in the window. If you do
not want to replace this match, click Find Next again until you find a match that you want to
replace.
8. Click Replace to replace the selected match.
9. Click Replace to replace all matches in the section. A message opens with the number of
replacements made.
10. When you are finished making your replacements, click Close. The dialog box closes.
Note: If you made a replacement error, you can undo the replacement by closing the dialog box and
choosing Edit > Undo from the menus. You must perform this once for every change that you want to
undo.
Target Language for Resources
Resources are created for a particular text language. The language for which these resources are tuned is
defined in the Advanced Resources tab. You can switch to another language if necessary by selecting that
language in the Target language for resources combobox. Additionally, the language listed here will
appear as the language for any text analysis packages you create with these resources.
Important! You will rarely ever need to change the language in your resources. Doing so can cause issues
when your resources no longer match the extraction language. Though rarely employed, you might
change a language if you planned to use the ALL language option during extraction because you expected
to have text in more than one language. By changing the language, you can access, for example, the
language handling resources for extraction patterns, abbreviations and force definitions for the secondary
language you are interested in. However, keep in mind that before publishing or saving the resource
changes you've made or running another extraction, set the language back to the primary language you
are interested in extracting.
Chapter 18. About Advanced Resources
195
Fuzzy Grouping
In the Text Mining node and Extraction Settings, if you select Accommodate spelling for a minimum
root character limit of, you have enabled the fuzzy grouping algorithm.
Fuzzy grouping helps to group commonly misspelled words or closely spelled words by temporarily
stripping all vowels (except for the first vowel) and double or triple consonants from extracted words
and then comparing them to see if they are the same. During the extraction process, the fuzzy grouping
feature is applied to the extracted terms and the results are compared to determine whether any matches
are found. If so, the original terms are grouped together in the final extraction list. They are grouped
under the term that occurs most frequently in the data.
Note: If the two terms being compared are assigned to different types, excluding the <Unknown> type, then
the fuzzy grouping technique is not be applied to this pair. In other words, the terms must belong to the
same type or the <Unknown> type in order for the technique to be applied.
If you enabled this feature and found that two words with similar spelling were incorrectly grouped
together, you may want to exclude them from fuzzy grouping. You can do this by entering the incorrectly
matched pairs into the Exceptions section in the Advanced Resources tab. See the topic Chapter 18,
“About Advanced Resources,” on page 193 for more information.
The following example demonstrates how fuzzy grouping is performed. If fuzzy grouping is enabled,
these words appear to be the same and are matched in the following manner:
color -> colr
colour -> colr
mountain -> montn
montana -> montn
modeling -> modlng
modelling -> modlng
furniture -> furntr
furnature -> furntr
In the preceding example, you would most likely want to exclude mountain and montana from being
grouped together. Therefore, you could enter them in the Exceptions section in the following manner:
mountain
montana
Important! In some cases, fuzzy grouping exceptions do not stop 2 words from being paired because
certain synonym rules are being applied. In that case, you may want to try entering synonyms using the
exclamation mark wildcard (!) to prohibit the words from becoming synonymous in the output. See the
topic “Defining Synonyms” on page 188 for more information.
Formatting Rules for Fuzzy Grouping Exceptions
v Define only one exception pair per line.
v Use simple or compound words.
v Use only lowercase characters for the words. Uppercase words will be ignored.
v Use a TAB character to separate each word in a pair.
Nonlinguistic Entities
When working with certain kinds of data, you might be very interested in extracting dates, social security
numbers, percentages, or other nonlinguistic entities. These entities are explicitly declared in the
configuration file, in which you can enable or disable the entities. See the topic “Configuration” on page
200 for more information. In order to optimize the output from the extraction engine, the input from
nonlinguistic processing is normalized to group like entities according to predefined formats. See the
topic “Normalization” on page 199 for more information.
Note: You can turn on and off nonlinguistic entity extraction in the extraction settings.
196
IBM SPSS Modeler Text Analytics 16 User's Guide
Available Nonlinguistic Entities
The nonlinguistic entities in the following table can be extracted. The type name is in parentheses.
Table 40. Nonlinguistic entities that can be extracted
Addresses
(<Address>)
Amino acids
(<Aminoacid>)
Currencies
(<Currency>)
Dates
(<Date>)
Delay
(<Delay>)
Digits
(<Digit>)
E-mail addresses
(<email>)
HTTP/URL addresses
(<url>)
IP address
(<IP>
Organizations
(<Organization>)
Percentages
(<Percent>)
Products
(<Product>)
Proteins
(<Gene>)
Phone numbers
(<PhoneNumber>)
Times
(<Time>)
U.S. social security
(<SocialSecurityNumber>)
Weights and measures
(<Weights-Measures>)
Cleaning Text for Processing
Before nonlinguistic entities extraction occurs, the input text is cleaned. During this step, the following
temporary changes are made so that nonlinguistic entities can be identified and extracted as such:
v Any sequence of two or more spaces is replaced by a single space.
v Tabulations are replaced by space.
v Single end-of-line characters or sequence characters are replaced by a space, while multiple end-of-line
sequences are marked as end of a paragraph. End of line can be denoted by carriage returns (CR) and
line feed (LF) or even both together.
v HTML and XML tags are temporarily stripped and ignored.
Regular Expression Definitions
When extracting nonlinguistic entities, you may want to edit or add to the regular expression definitions
that are used to identify regular expressions. This is done in the Regular Expression Definitions section
in the Advanced Resources tab. See the topic Chapter 18, “About Advanced Resources,” on page 193 for
more information.
The file is broken up into distinct sections. The first section is called [macros]. In addition to that section,
an additional section can exist for each nonlinguistic entity. You can add sections to this file. Within each
section, rules are numbered (regexp1, regexp2, and so on). These rules must be numbered sequentially
from 1–n. Any break in numbering will cause the processing of this file to be suspended altogether.
In certain cases, an entity is language dependent. An entity is considered to be language dependent if it
takes a value other than 0 for the language parameter in the configuration file. See the topic
“Configuration” on page 200 for more information. When an entity is language dependent, the language
Chapter 18. About Advanced Resources
197
must be used to prefix the section name, such as [english/PhoneNumber]. That section would contain
rules that apply only to English phone numbers when the PhoneNumber entity is given a value of 2 for the
language.
Important! If you make changes to this file or any other in the editor and the extraction engine no longer
works as desired, use the Reset to Original option on the toolbar to reset the file to the original shipped
content. This file requires a certain level of familiarity with regular expressions. If you require additional
assistance in this area, please contact IBM Corp. for help.
Special Characters . [] {} () \ * + ? | ^ $
All characters match themselves except for the following special characters, which are used for a specific
purpose in expressions: .[{()\*+?|^$ To use these characters as such, they must be preceded by a
backslash (\) in the definition.
For example, if you were trying to extract Web addresses, the full stop character is very important to the
entity, therefore, you must backslash it such as:
www\.[a-z]+\.[a-z]+
Repetition Operators and Quantifiers ? + * {}
To enable the definitions to be more flexible, you can use several wildcards that are standard to regular
expressions. They are * ? +
v Asterisk * indicates that there are zero or more of the preceding string. For example, ab*c matches "ac",
"abc", "abbbc", and so on.
v Plus sign + indicates that there is one or more of the preceding string. For example, ab+c matches "abc",
"abbc", "abbbc", but not "ac".
v
Question mark ? indicates that there is zero or one of the preceding string. For example, modell?ing
matches both "modeling" and "modeling".
v
Limiting repetition with brackets {} indicates the bounds of the repetition. For example,
[0-9]{n} matches a digit repeated exactly n times. For example, [0-9]{4} will match “1998”, but
neither “33” nor “19983”.
[0-9]{n,} matches a digit repeated n or more times. For example, [0-9]{3,} will match “199” or
“1998”, but not “19”.
[0-9]{n,m} matches a digit repeated between n and m times inclusive . For example, [0-9]{3,5} will
match “199”, “1998” or “19983”, but not “19” nor “199835”.
Optional Spaces and Hyphens
In some cases, you want to include an optional space in a definition. For example, if you wanted to
extract currencies such as "uruguayan pesos", "uruguayan peso", "uruguay pesos", "uruguay peso", "pesos" or
"peso", you would need to deal with the fact that there may be two words separated by a space. In this
case, this definition should be written as (uruguayan |uruguay )?pesos?. Since uruguayan or uruguay are
followed by a space when used with pesos/peso, the optional space must be defined within the optional
sequence (uruguayan |uruguay ). If the space was not in the optional sequence such as
(uruguayan|uruguay)? pesos?, it would not match on “pesos” or “peso” since the space would be required.
If you are looking for a series of things including a hyphen characters (-) in a list, then the hyphen must
be defined last. For example, f you are looking for a comma (,) or a hyphen (-), use [,-] and never [-,].
Order of Strings in Lists and Macros
You should always define the longest sequence before a shorter one or else the longest will never be read
since the match will occur on the shorter one. For example, if you were looking for strings “billion” or
198
IBM SPSS Modeler Text Analytics 16 User's Guide
“bill”, then “billion” must be defined before “bill”. So for instance (billion|bill) and not
(bill|billion). This also applies to macros, since macros are lists of strings.
Order of Rules in the Definition Section
Define one rule per line. Within each section, rules are numbered (regexp1, regexp2, and so on). These
rules must be numbered sequentially from 1–n. Any break in numbering will cause the processing of this
file to be suspended altogether. To disable an entry, place a # symbol at the beginning of each line used to
define the regular expression. To enable an entry, remove the # character before that line.
In each section, the most specific rules must be defined before the most general ones to ensure proper
processing. For example, if you were looking for a date in the form “month year” and in the form
“month”, then the “month year” rule must be defined before the “month” rule. Here is how it should be
defined:
#@# January 1932
regexp1=$(MONTH),? [0-9]{4}
#@# January
regexp2=$(MONTH)
and not
#@# January
regexp1=$(MONTH)
#@# January 1932
regexp2=$(MONTH),? [0-9]{4}
Using Macros in Rules
Whenever a specific sequence is used in several rules, you can use a macro. Then, if you need to change
the definition of this sequence, you will need to change it only once, and not in all the rules referring to
it. For example, assuming you had the following macro:
MONTH=((january|february|march|april|june|july|august|september|october|
november|december)|(jan|feb|mar|apr|may|jun|jul|aug|sep|oct|nov|dec)(\.)?)
Whenever you refer to the name of the macro, it must be enclosed in $(), such as: regexp1=$(MONTH)
All macros must be defined in the [macros] section.
Normalization
When extracting nonlinguistic entities, the entities encountered are normalized to group like entities
according to predefined formats. For example, currency symbols and their equivalent in words are treated
as the same. The normalization entries are stored in the Normalization section in the Advanced
Resources tab. See the topic Chapter 18, “About Advanced Resources,” on page 193 for more information.
The file is broken up into distinct sections.
Important! This file is for advanced users only. It is highly unlikely that you would need to change this
file. If you require additional assistance in this area, please contact IBM Corp. for help.
Formatting Rules for Normalization
v Add only one normalization entry per line.
v Strictly respect the sections in this file. No new sections can be added.
v To disable an entry, place a # symbol at the beginning of that line. To enable an entry, remove the #
character before that line.
Chapter 18. About Advanced Resources
199
English Dates in Normalization
By default dates in an English template are recognized in the American style date format; that is: month,
date, year. If you need to change that to the day, month, year format, disable the "format:US" line (by
adding # at the beginning of the line) and enable "format:UK" (by removing the # from that line).
Configuration
You can enable and disable the nonlinguistic entity types that you want to extract in the nonlinguistic
entity configuration file. By disabling the entities that you do not need, you can decrease the processing
time required. This is done in the Configuration section in the Advanced Resources tab. See the topic
Chapter 18, “About Advanced Resources,” on page 193 for more information. If nonlinguistic extraction is
enabled, the extraction engine reads this configuration file during the extraction process to determine
which nonlinguistic entity types should be extracted.
The syntax for this file is as follows:
#name<TAB>Language<TAB>Code
Table 41. Syntax for configuration file.
Column label
Description
#name
The wording by which nonlinguistic entities will be referenced in the two other required
files for nonlinguistic entity extraction. The names used here are case sensitive.
Language
The language of the documents . It is best to select the specific language; however, an
Any option exists. Possible options are: 0 = Any which is used whenever a regexp is not
specific to a language and could be used in several templates with different languages,
for instance an IP/URL/email addresses; 1 = French; 2 = English; 4 = German; 5 =
Spanish; 6 = Dutch; 8 = Portuguese; 10 = Italian.
Code
Part-of-speech code. Most entities take a value of “s” except in a few cases. Possible
values are: s = stopword; a = adjective; n = noun. If enabled, nonlinguistic entities are
first extracted and the extraction patterns are applied to identify its role in a larger
context. For example, percentages are given a value of “a.” Suppose that 30% is extracted
as an nonlinguistic entity. It would be identified as an adjective. Then if your text
contained "30% salary increase," the “30%” nonlinguistic entity fits the part-of-speech
pattern “ann” (adjective noun noun).
Order in Defining Entities
The order in which the entities are declared in this file is important and affects how they are extracted.
They are applied in the order listed. Changing the order will change the results. The most specific
nonlinguistic entities must be defined before more general ones.
For example, the nonlinguistic entity “Aminoacid” is defined by:
regexp1=($(AA)-?$(NUM))
where $(AA) corresponds to “(ala|arg|asn|asp|cys|gln|glu|gly|his|ile|leu|lys|met|phe|pro|ser)”,
which are specific 3-letter sequences corresponding to particular amino acids.
On the other hand, the nonlinguistic entity "Gene" is more general and is defined by:
regexp1=p[0-9]{2,3}
regexp2=[a-z]{2,4}-?[0-9]{1,3}-?[r]
regexp3=[a-z]{2,4}-?[0-9]{1,3}-?p?
If "Gene" is defined before "Aminoacid" in the Configuration section, then "Aminoacid" will never be
matched, since regexp3 from "Gene" will always match first.
200
IBM SPSS Modeler Text Analytics 16 User's Guide
Formatting Rules for Configuration
v Use a TAB character to separate each entry in a column.
v Do not delete any lines.
v Respect the syntax shown in the preceding table.
v To disable an entry, place a # symbol at the beginning of that line. To enable an entity, remove the #
character before that line.
Language Handling
Every language used today has special ways of expressing ideas, structuring sentences, and using
abbreviations. In the Language Handling section, you can edit extraction patterns, force definitions for
those patterns, and declare abbreviations for the language that you have selected in the Language
drop-down list.
v Extraction patterns
v Forced definitions
v Abbreviations
Extraction Patterns
When extracting information from your documents, the extraction engine applies a set of parts-of-speech
extraction patterns to a "stack" of words in the text to identify candidate terms (words and phrases) for
extraction. You can add or modify the extraction patterns.
Parts of speech include grammatical elements, such as nouns, adjectives, past participles, determiners,
prepositions, coordinators, first names, initials, and particles. A series of these elements makes up a
part-of-speech extraction pattern. In IBM Corp. text mining products, each part of speech is represented
by a single character to make it easier to define your patterns. For instance, an adjective is represented by
the lowercase letter a. The set of supported codes appears by default at the top of each default extraction
patterns section along with a set of patterns and examples of each pattern to help you understand each
code that is used.
Formatting Rules for Extraction Patterns
v One pattern per line.
v Use # at the beginning of a line to disable a pattern.
The order in which you list the extraction patterns is very important because a given sequence of words
is read only once by the extraction engine and is assigned to the first extraction patterns for which the
engine finds a match.
Forced Definitions
When extracting information from your documents , the extraction engine scans the text and identifies
the part of speech for every word it encounters. In some cases, a word could fit several different roles
depending on the context. If you want to force a word to take a particular part-of-speech role or to
exclude the word completely from processing, you can do so in the Forced Definition section of the
Advanced Resources tab. See the topic Chapter 18, “About Advanced Resources,” on page 193 for more
information.
To force a part-of-speech role for a given word, you must add a line to this section using the following
syntax:
term:code
Chapter 18. About Advanced Resources
201
Table 42. Syntax description.
Entry
Description
term
A term name.
code
A single-character code representing the part-of-speech role. You can list up to six different
part-of-speech codes per uniterm. Additionally, you can stop a word from being extracted into
compound words/phrases by using the lowercase code s, such as additional:s.
Formatting Rules for Forced Definitions
v One line per word.
v Terms cannot contain a colon.
v Use the lowercase s as a part-of-speech code to stop a word from being extracted altogether.
v Use up to six part-of-speech codes per line. Supported part-of speech codes are shown in the Extraction
Patterns section. See the topic “Extraction Patterns” on page 201 for more information.
v Use the asterisk character (*) as a wildcard at the end of a string for partial matches. For example, if
you enter add*:s, words such as add, additional, additionally, addendum, and additive are never
extracted as a term or as part of a compound word term. However, if a word match is explicitly
declared as a term in a compiled dictionary or in the forced definitions, it will still be extracted. For
example, if you enter both add*:s and addendum:n, addendum will still be extracted if found in the text.
Abbreviations
When the extraction engine is processing text, it will generally consider any period it finds as an
indication that a sentence has ended. This is typically correct; however, this handling of period characters
does not apply when abbreviations are contained in the text.
If you extract terms from your text and find that certain abbreviations were mishandled, you should
explicitly declare that abbreviation in this section.
Note: If the abbreviation already appears in a synonym definition or is defined as a term in a type
dictionary, there is no need to add the abbreviation entry here.
Formatting Rules for Abbreviations
v Define one abbreviation per line.
Language Identifier
While it is always best to select the specific language for the text data that you are analyzing, but you can
also specify the All option when the text might be in several different or unknown languages. The All
language option uses a language autorecognition engine called the Language Identifier. The Language
Identifier scans the documents to identify those that are in a supported language and automatically
applies the best internal dictionaries for each file during extraction. The All option is governed by the
parameters in the Properties sections.
Properties
The Language Identifier is configured using the parameters in this section. The following table describes
the parameters that you can set in the Language Identifier - Properties section in the Advanced
Resources tab. See the topic Chapter 18, “About Advanced Resources,” on page 193 for more information.
202
IBM SPSS Modeler Text Analytics 16 User's Guide
Table 43. Parameter descriptions
Parameter
Description
NUM_CHARS
Specifies the number of characters that should be read by the extraction engine
in order to determine the language the text is in. The lower the number, the
faster the language is identified. The higher the number, the more accurately the
language is identified. If you set the value to 0, the entire text of the document
will be read.
USE_FIRST_SUPPORTED _LANGUAGE
Specifies whether the extraction engine should use the first supported language
found by the Language Identifier. If you set the value to 1, the first supported
language is used. If you set the value to 0, the fallback language value is used.
FALLBACK_LANGUAGE
Specifies the language to use if the language returned by the identifier is not
supported. Possible values are english, french, german, spanish, dutch, italian,
and ignore. If you set the value to ignore, the document with no supported
language will be ignored.
Languages
The Language Identifier supports many different languages. You can edit the list of languages in the
Language Identifier - Languages section in the Advanced Resources tab.
You may consider eliminating languages that are unlikely to be used from this list because the more
languages present, the higher the chance for false positives and slower performance. You cannot add new
languages to this file, however. Consider placing the most likely languages at the top of the list to help
the Language Identifier find a match to your documents faster.
Chapter 18. About Advanced Resources
203
204
IBM SPSS Modeler Text Analytics 16 User's Guide
Chapter 19. About Text Link Rules
Text link analysis (TLA) is a pattern matching technology that is used to extract relationships found in
your text using a set of rules. When text link analysis is enabled for extraction, the text data is compared
against these rules. When a match is found, the text link analysis pattern is extracted and presented.
These rules are defined in the Text Link Rules tab.
For example, extracting concepts representing simple ideas about an organization may not be interesting
enough to you, but by using TLA, you could also learn about the links between different organizations or
the people associated with the organization. TLA can also be used to extract opinions about topics such
as how people feel about a given product or experience.
To benefit from TLA, you must have resources that contain text link (TLA) rules. When you select a
template, you can see which templates have TLA rules by whether or not they have an icon in the TLA
column.
Text link analysis patterns are found in the text data during the pattern matching phase of the extraction
process. During this phase, rules are compared to the text data and when a match is found, this
information is extracted as a pattern. There are times when you might want to get more from text link
analysis or change how something is matched. In these cases, you can refine the rules to adapt them to
your particular needs. This is performed in the Text Link Rules tab.
Note: Support for variables was discontinued in version 13. Use macros instead. See the topic “Working
with Macros” on page 210 for more information.
Where to Work on Text Link Rules
You can edit and create rules directly in the Text Link Rules tab in the Template Editor or Resource Editor
view. To help you see how rules might match text, you can run a simulation in this tab. During
simulation, an extraction is run only on the sample simulation data and the text link rules are applied to
see if any patterns match. Any rules that match the text are then shown in the simulation pane. Based on
the matches, you can choose to edit rules and macros to change how the text is matched.
Unlike the other advanced resources, TLA rules are library-specific; therefore, you can only use the TLA
rules from one library at a time. From within the Template Editor or Resource Editor, go to the Text Link
Rules tab. In this tab, you can specify the library in your template that contains the TLA rules you want
to use or edit. For this reason, we strongly recommend that you store all your rules in one library unless
there is a very specific reason this isn't desired.
© Copyright IBM Corporation 2003, 2013
205
Figure 42. Text Link Rules tab
Important! This tab is not available for Japanese language resources.
Where to Begin
There are a number of ways to start working in the Text Link Rules tab editor:
v Start by simulating results with some sample text and edit or create matching rules based on how the
current set of rules extract patterns from the simulation data.
v Create a new rule from scratch or edit an existing rule.
v Work in source view directly.
When to Edit or Create Rules
While the text link analysis rules delivered with each template are often adequate for extracting many
simple or complex relationships from your text, there are times that you may want to make some changes
to these rules or create some rules of your own. For example:
v To capture an idea or relation that isn't being extracted with the existing rules by creating a new rule
or macro.
v To change the default behavior of a type you added to the resources. This usually requires you to edit
a macro such as mTopic or mNonLingEntities. See the topic “Special Macros: mTopic,
mNonLingEntities, SEP” on page 212 for more information.
206
IBM SPSS Modeler Text Analytics 16 User's Guide
v To add new types to existing text link analysis rules and macros. For example, if you think the type
<Organization> is too broad, you could create new types for organizations in several different business
sectors such as <Pharmaceuticals>, <Car Manufacturing>, <Finance>, and so on. In this case, you must
edit the text link analysis rules and/or create a macro to take these new types into account and process
them accordingly.
v To add types to an existing text link analysis rule. For example, let's say you have a rule that captures
the following text john doe called jane doe but you want this rule that captures phone
communications to also capture email exchanges. You could add the nonlinguistic entity type for email
to the rule so it would also capture text such as: [email protected] emailed [email protected].
v To slightly modify an existing rule, instead of creating a new one. For example, let's say you have a
rule that matches the following text xyz is very good but you want this rule to also capture xyz is
very, very good.
Simulating Text Link Analysis Results
In order to help define new text link rules or help understand how certain sentences are matched during
text link analysis, it is often useful to take a sample piece of text and run a simulation. During
simulation, an extraction is run only on the sample simulation data using the current set of linguistic
resources and the current extraction settings. The goal is to obtain the simulated results and use these
results to improve your rules, create new ones, or better understand how matching occurs. For each piece
of text (sentence, word, or clause depending on the context), a simulation output displays the collection
of tokens and any TLA rules that uncovered a pattern in that text. A token is defined as any word or
word phrase identified during the extraction process.
Unlike the other advanced resources, TLA rules are library-specific; therefore, you can only use the TLA
rules from one library at a time. From within the Template Editor or Resource Editor, go to the Text Link
Rules tab. In this tab, you can specify the library in your template that contains the TLA rules you want
to use or edit. For this reason, we strongly recommend that you store all your rules in one library unless
there is a very specific reason this isn't desired.
Important! We strongly recommend that if you use a data file, please ensure that the text it contains is
short in order to minimize processing time. The goal of simulation is to see how a piece of text is
interpreted and to understand how rules match this text. This information will help you write and edit
your rules. Use the text link analysis node or run a stream with interactive session with TLA extraction
enabled to obtain results for a more complete data set. This simulation is for testing and rule authoring
purposes only.
Defining Data for Simulation
To help you see how rules might match text, you can run a simulation using sample data. The first step
is to define the data.
Defining Data
1. Click Define Data in the simulation pane in bottom of the Text Link Rules tab. Alternatively, if no
data have been previously defined, choose Tools > Run Simulation from the menus. The Simulation
Data wizard opens.
2. Specify the data type by selecting one of the following:
v Paste or enter text directly. A text box is provided for you to paste some text from the clipboard or
to manually enter the desired text to be processed. You can enter one sentence per line or use
punctuation to break up the sentence such as periods or commas. Once you have entered your text,
you can begin the simulation by clicking Run Simulation.
v Specify a file data source. This option indicates that you want to process a file that contains text.
Click Next to proceed to the wizard step in which you can define the file to be processed. Once the
file has been selected, you can begin the simulation by clicking Run Simulation. The following file
types are supported: .rtf, .doc, .docx, .docm, .xls, .xlsx, .xlsm, .htm, .html, .txt and files with no
Chapter 19. About Text Link Rules
207
extensions. The data file you choose is read 'as-is' during the simulation. For example, if you select
an Microsoft Excel file, you cannot select a particular worksheet or column. Instead the whole
workbook is read much like using an Microsoft Excel source node in IBM SPSS Modeler. The entire
file is treated in the same manner as if you had connected a File List node to a Text Mining Node.
Important! We strongly recommend that if you use a data file, please ensure that the text it contains is
short in order to minimize processing time. The goal of simulation is to see how a piece of text is
interpreted and to understand how rules match this text. This information will help you write and
edit your rules. Use the text link analysis node or run a stream with interactive session with TLA
extraction enabled to obtain results for a more complete data set. This simulation is for testing and
rule authoring purposes only.
3. Click Run Simulation to begin the simulation process. A progress dialog appears. If you are in an
interactive session, the extraction settings used during simulation are those currently selected in the
interactive session (see Tools > Extraction Settings in the Concepts and Categories view). If you are in
the Template Editor, the extraction settings used during simulation are the default extraction settings,
which are the same as those shown in the Expert tab of a Text Link Analysis node. See the topic
“Understanding Simulation Results” for more information.
Understanding Simulation Results
To help you see how rules might match text, you can run a simulation using sample data and review the
results. From there you can change your set of rules to better fit your data. When the extraction and
simulation process has completed, you will be presented with the results of the simulation.
For each “sentence” identified during extraction, you are presented with several pieces of information
including the exact "sentence", the breakdown of the tokens found in this input text sentence, and finally
any rules that matched text in that sentence. By "sentence", we mean either a word, sentence, or clause
depending on how the extractor broke down the text into readable chunks.
A token is defined as any word or word phrase identified during the extraction process. For example, in
the sentence My uncle lives in New York, the following tokens might be found during extraction: my, uncle,
lives, in, and new york. Additionally, uncle could be extracted as a concept and typed as <Unknown>, and
new york could also be extracted as a concept and typed as <Location>. All concepts are tokens but not all
tokens are concepts. Tokens can also be other macros, literal strings, and word gaps. Only those words or
word phrases that are typed can be concepts.
When you are working in the interactive session or resource editor, you are working at the concept level.
TLA rules are more granular, and individual tokens in a sentence can be used in the definition of a rule
even if they are never extracted and typed. Being able to use tokens which are not concepts offers rules
even more flexibility in capturing complex relationships in your text.
If you have more than one sentence in your simulation data, you can move forward and backward
through the results by clicking Next and Previous.
In those cases where a sentence does not match any TLA rule in the selected library (see library name
above tree in this tab), the results are considered unmatched and the buttons Next Unmatched and
Previous Unmatched are enabled to let you know that there is text for which no rule found a match and
to allow you to navigate to these instances quickly.
After creating new rules, editing your rules, or changing your resources or extraction settings, you may
want to rerun a simulation. To re-run a simulation, click Run Simulation in the simulation pane and the
same input data will be used again.
The following fields and tables are shown in the simulation results:
208
IBM SPSS Modeler Text Analytics 16 User's Guide
Input text. The actual 'sentence' identified by the extraction process from the simulation data you defined
in the wizard. By sentence, we mean either a word, sentence, or clause depending on how the extractor
broken down the text into readable chunks.
System View. A collection of tokens that the extraction process has identified.
v Input Text Token. Each token found in the input text. Tokens were defined earlier in this topic.
v Typed As. If a token was identified as a concept and typed, then the associated type name (such as
<Unknown>, <Person>, <Location>) is shown in this column.
v Matching Macro. If a token matched an existing macro, then the associated macro name is displayed
in this column.
Rules Matched to Input Text. This table shows you any TLA rules that were matched against the input
text. For each matched rule, you will see the name of the rule in the Rule Output column and the
associated output values for that rule (Concept + Type pairs). You can double-click on the matched rule
name to open the rule in the editor pane above the simulation pane.
Generate Rule button. If you click this button in the simulation pane, a new rule will open in the rule
editor pane above the simulation pane. It will take the input text as its example. Likewise, any token that
was typed or matched to a macro during simulation is automatically inserted in the Elements column in
the Rule Values table. If a token was typed and matched a macro, the macro value is the one that will be
used in the rule so as to simplify the rule. For example, the sentence “I like pizza” could be typed during
simulation as <Unknown> and matched to macro mTopic if you were using the Basic English resources. In
this case mTopic will be used as the element in the generated rule. See the topic “Working with Text Link
Rules” on page 213 for more information.
Navigating Rules and Macros in the Tree
When text link analysis is performed during extraction, the text link rules stored in the library selected in
the Text Link Rules tab will be used.
Unlike the other advanced resources, TLA rules are library-specific; therefore, you can only use the TLA
rules from one library at a time. From within the Template Editor or Resource Editor, go to the Text Link
Rules tab. In this tab, you can specify the library in your template that contains the TLA rules you want
to use or edit. For this reason, we strongly recommend that you store all your rules in one library unless
there is a strong or specific reason this isn't desired.
You can specify in which library you want to work in the Text Link Rules tab by selecting that library in
the Use and store text link analysis rules in: dropdown list in this tab. When text link analysis is
performed during extraction, the text link rules stored in the library selected in the Text Link Rules tab
will be used. Therefore, if you defined text link rules (TLA rules) in more than one library, only the first
library in which TLA rules are found will be used for text link analysis. For this reason, we strongly
recommend that you store all your rules in one library unless there is a very specific reason this isn't
desired.
When you select a macro or rule in the tree, its contents are displayed in the editor pane to the right. If
you right-click on any item in the tree, a context menu will open to show you what other tasks are
possible, such as:
v Create a new macro in the tree and open it in the editor to the right.
v
v
v
v
v
Create a new rule in the tree and open it in the editor to the right.
Create a new rule set in the tree.
Cut, copy, and paste items to simplify editing.
Delete macros, rules, and rule sets to remove them from the resources.
Disable macros, rules, and rule sets to indicate that they should be ignored during processing.
Chapter 19. About Text Link Rules
209
v Move rules up or down to affect processing order.
Warnings in the tree
Warnings are displayed with a yellow triangle in the tree and are there to inform you that there may be a
problem. Hover the mouse pointer over the faulty macro or rule to display a pop-up explanation. In most
cases, you will see something such as: Warning: No example provided; Enter an example so you need to
enter an example.
If you're missing an example, or if the example doesn't match the rule, you will not be able to use the
Get Tokens feature so we recommend you enter just one example per rule.
When the rule is highlighted in yellow it means that a type or macro is unknown to the TLA editor. The
message will be similar to: Warning: Unknown type or macro. This is to inform you that an item that
would be defined by $something in the source view, for instance $myType, is not a legacy type in your
library, nor is it a macro.
To update the syntax checker you need to switch to another rule or macro; there is no need to recompile
anything. So, for example, if rule A displays a warning because the example is missing, you need to add
an example, click on either an upper or lower rule, and then go back to rule A to check that it is now
correct.
Working with Macros
Macros can simplify the appearance of text link analysis rules by allowing you to group types, other
macros, and literal (word) strings together with an OR operator (|). The advantage to using macros is that
not only can you reuse macros in multiple text link analysis rules to simplify them, but it also enables
you to make updates in one macro rather than having to make updates throughout all of your text link
analysis rules. Most shipped TLA rules contain predefined macros. Macros appear at the top of the tree in
the leftmost pane of the Text Link Rules tab.
The following fields and tables are shown in the simulation results:
Name. A unique name identifying this macro. We recommend that you prefix macro names with a
lowercase m to help you identify macros quickly in your rules. When you manually refer to macros in
your rules (by inline editing or in the source view) you have to use the $ character prefix so that the
extraction process knows to look for this special name. However, if you drag and drop the macro name
or add it through the context menus, the product will automatically recognize it as a macro and no $ will
be added.
Macro Value table.
v A number of rows representing all of the possible values this macro can represent. These values are
case-sensitive.
v These values can include one or a combination of types, literal strings, word gaps, or macros. See the
topic “Supported Elements for Rules and Macros” on page 219 for more information.
v To enter a value for an element in a macro, double-click the row you want to work in. An editable text
box appears in which you can enter a type reference, a macro reference, a literal string, or a word gap.
Alternatively, right-click in the cell to display a contextual menu offering lists of common macros, type
names, and nonlinguistic type names. To reference a type or a macro you must precede the macro or
type name with a ‘$’ character such as $mTopic for the macro mTopic. When combining arguments, you
must use parentheses ( ) to group the arguments and the character | to indicate a Boolean OR.
v You can add or remove rows in the Macro Value table using the buttons to its right.
v Enter each element in its own row. For example, if you wanted to create a macro that represents one of
3 literal strings such as am OR was OR is, you would enter each literal string on a separate row in the
view, and your Macro table would contain 3 rows.
210
IBM SPSS Modeler Text Analytics 16 User's Guide
Creating and Editing Macros
You can create new macros or edit existing ones. Follow the guidelines and descriptions for the macro
editor. See the topic “Working with Macros” on page 210 for more information.
Creating New Macros
1. From the menus, choose Tools > New Macro. Alternatively, click the New Macro icon in the tree
toolbar to open a new macro in the editor.
2. Enter a unique name and define the macro value elements.
3. Click Apply when finished to check for errors.
Editing Macros
1. Click the macro name in the tree. The macro opens in the editor pane on the right.
2. Make your changes.
3. Click Apply when finished to check for errors.
Disabling and Deleting Macros
Disabling Macros
If you want a macro to be ignored during processing, you can disable it. Doing so may cause warnings
or errors in any rules that still reference this disabled macro. Take caution when deleting and disabling
macros.
1. Click the macro name in the tree. The macro opens in the editor pane on the right.
2. Right-click on the name.
3. From the context menus, choose Disable. The macro icon becomes gray and the macro itself becomes
uneditable.
Deleting Macros
If you want to get rid of a macro, you can delete it. Doing so may cause errors in any rules that still
reference this macro. Take caution when deleting and disabling macros.
1. Click the macro name in the tree. The macro opens in the editor pane on the right.
2. Right-click on the name.
3. From the context menus, choose Delete. The macro disappears from the list.
Checking for Errors, Saving, and Cancelling
Applying Macro Changes
If you click outside of the macro editor or if you click Apply, the macro is automatically scanned for
errors. If an error is found, you will need to fix it before moving on to another part of the application.
However, if less serious errors are detected, only a warning is given. For example, if your macro contains
incomplete or unreferenced definitions to types or other macros, a warning message is displayed. Once
you click Apply, any uncorrected warnings cause a warning icon to appear to the left of the macro name
in the Rules and Macro Tree in the left pane.
Applying a macro does not mean that your macro is permanently saved. Applying will cause the
validation process to check for errors and warnings.
Saving Resources inside an Interactive Workbench Session
1. To save the changes you made to your resources during an interactive workbench session so you can
get them next time you run your stream, you must:
Chapter 19. About Text Link Rules
211
v Update your modeling node to make sure that you can get these same resources next time you
execute your stream. See the topic “Updating Modeling Nodes and Saving” on page 82 for more
information. Then save your stream. To save your stream, do so in the main IBM SPSS Modeler
window after updating the modeling node.
2. To save the changes you made to your resources during an interactive workbench session so that you
can use them in other streams, you can:
v Update the template you used or make a new one. See the topic “Making and Updating Templates” on
page 161 for more information. This will not save the changes for the current node (see previous step)
v Or, update the TAP you used. See the topic “Updating Text Analysis Packages” on page 137 for more
information.
Saving Resources inside the Template Editor
1. First, publish the library. See the topic “Publishing Libraries” on page 178 for more information.
2. Then, save the template through File > Save Resource Template in the menus.
Cancelling Macro Changes
1. If you wish to discard the changes, click Cancel.
Special Macros: mTopic, mNonLingEntities, SEP
The Opinions template (and like templates) as well as the Basic Resources templates are shipped with
two special macros called mTopic and mNonLingEntities.
mTopic
By default, the macro mTopic groups all the types shipped in the template that are likely to be connected
with an opinion, such as the following Core library types: <Person>, <Organization>, <Location>, and so
on, as long as the type is not an opinion type (for example, <Negative> or <Positive>) or a type defined
as a nonlinguistic entity in the Advanced Resources.
Whenever you create a new type in an Opinions (or similar) template, the product assumes that unless
this type is specified in another macro or in the nonlinguistic entities section of the Advanced Resource
tab, it will be treated the same way as the other types defined in the macro mTopic.
Let's say you created new types in the resources from an Opinions template: <Vegetables> and <Fruit>.
Without having to make any changes, your new types are treated as mTopic types so you can
automatically uncover the positive, negative, neutral, and contextual opinions about your new types.
During extraction, for example, the sentence "I enjoy broccoli, but I hate grapefruit" would produce the
following 2 output patterns:
broccoli <Vegetables> + like <Positive>
grapefruit <Fruit> + dislike <Negative>
However, if you want to process those types differently than the other types in mTopic, you can either
add the type name to an existing macro such as mPos, which groups all positive opinion types, or create a
new macro that you can later reference in one or more rules.
Important! If you create a new type such as <Vegetables>, this new type will be included as a type in
mTopic, however, this type name will not be explicitly visible in the macro definition.
mNonLingEntities
212
IBM SPSS Modeler Text Analytics 16 User's Guide
Similarly, if you add new nonlinguistic entities in the Nonlinguistic Entities section of the Advanced
Resources tab, they will be automatically processed as mNonLingEntities unless specified otherwise. See
the topic “Nonlinguistic Entities” on page 196 for more information.
SEP
You can also use the predefined macro SEP, which corresponds to the global separator defined on the
local machine, generally a comma (,).
Working with Text Link Rules
A text link analysis rule is a Boolean query that is used to perform a match on a sentence. Text link
analysis rules contain one or more of the following arguments: types, macros, literal strings, or word
gaps. You must have at least one text link analysis rule in order to extract TLA results.
The following areas and fields are displayed in the Text Link Rules tab, Rule Editor:
Name field. The unique name for the text link rule.
Example field. Optionally, you can include an example sentence or word sequence that would be
captured by this rule. We recommend using examples. In this editor, you will be able to generate tokens
from this example text to see how it matches the rule and how it will be output. A token is defined as
any word or word phrase identified during the extraction process. For example, in the sentence My uncle
lives in New York, the following tokens might be found during extraction: my, uncle, lives, in, and new york.
Additionally, uncle could be extracted as a concept and typed as <Unknown>, and new york could also be
extracted as a concept and typed as <Location>. All concepts are tokens but not all tokens are concepts.
Tokens can also be other macros, literal strings, and word gaps. Only those words or word phrases that
are typed can be concepts.
Rule Value table. This table contains the elements of the rule that are used for matching a rule to a
sentence. You can add or remove rows in the table using the buttons to its right. The table consists of 3
columns:
v Element column. Enter values as one or a combination of types, literal strings, word gaps (<Any
Token>), or macros. See the topic “Supported Elements for Rules and Macros” on page 219 for more
information. Double-click the element cell to enter the information directly. Alternatively, right-click in
the cell to display a contextual menu offering lists of common macros, type names, and nonlinguistic
type names. Keep in mind that if you enter the information into the cell by typing it in, precede the
macro or type name with a ‘$’ character such as $mTopic for the macro mTopic. The order in which you
create your element rows is critical to how the rule will be matched to the text. When combining
arguments, you must use parentheses ( ) to group the arguments and the character | to indicate a
Boolean OR. Keep in mind that values are case-sensitive.
v Quantity column. This indicates the minimum and maximum number of times the element must be
found for a match to occur. For example, if you want to define a gap, or a series of words, between
two other elements of anywhere from 0 to 3 words, you could choose Between 0 and 3 from the list or
enter the numbers directly into the dialog box. The default is ‘Exactly 1’. In some cases you will want
to make an element optional. If this is the case, then it will have a minimum quantity of 0 and a
maximum quantity greater than 0 (i.e. 0 or 1, between 0 and 2). Note that the first element in a rule
cannot be optional, meaning it cannot have a quantity of 0.
v Example Token column. If you click Get Tokens, the program breaks the Example text down into
tokens and uses those tokens to fill this column with those that match the elements you defined. You
can also see these tokens in the output table if you choose to.
Chapter 19. About Text Link Rules
213
Rule Output table. Each row in this table defines how the TLA pattern output will appear in the results.
Rule output can produce patterns of up to six Concept/Type column pairs, each representing a slot. For
example, the type pattern <Location> + <Positive> is a two slot pattern meaning that it is made up of 2
Concept/Type column pairs.
Just as language gives us the freedom to express the same basic ideas in many different ways, so you
might have a number of rules defined to capture the same basic idea. For example, the text "Paris is a
place I love" and the text "I really, really like Paris and Florence" represent the same basic idea -- that Paris is
liked -- but are expressed differently and would require two different rules to both be captured. However,
it is easier to work with the pattern results if similar ideas are grouped together. For this reason, while
you might have 2 different rules to capture these 2 phrases, you could define the same output for both
rules, such as the type pattern <Location> + <Positive> so that it represents both texts. And in this way,
you can see that the output does not always mimic the structure or order of the words found in the
original text. Furthermore, such a type pattern could match other phrases and could produce concept
patterns such as: paris + like and tokyo + like.
To help you define the output quickly with fewer errors, you can use the context menu to choose the
element you want to see in the output. Alternatively, you can also drag and drop elements from the Rule
Value table into the output. For example, if you have a rule that contains a reference to the mTopic macro
in row 2 of the Rule Value table, and you want that value to be in your output, you can simply
drag/drop the element for mTopic to the first column pair in the Rule Output table. Doing so will
automatically populate both the Concept and Type for the pair you've selected. Or if you want the output
to begin with the type defined by the third element (row 3) of the rule value table, then drag that type
from the Rule Value table to the Type 1 cell in the output table. The table will update to show the row
reference in parenthesis (3).
Alternatively, you can enter these references manually into the table by double-clicking the cell in each
Concept column you want to output and entering the $ symbol followed by the row number, such as $2
to refer to the element defined in row 2 of the Rule Value table. When you enter the information
manually, you need to also define the Type column, enter the # symbol followed by the row number,
such as #2 to refer to the element defined in row 2 of the Rule Value table.
Furthermore, you might even combine methods. Let's say you had the type <Positive> in row 4 of your
Rule Value table. You could drag it to the Type 2 column and then double-click the cell in the Concept 2
column and then manually enter the word 'not' in front of it. The output column would then read not
(4) in the table, or if you were in the edit mode or source mode not $4. Then you could right-click in the
Type 1 column and select, for example, the macro called mTopic. Then this output could result in a
concept pattern such as: car + bad.
Most rules have only one output row but there are times when more than one output is possible and
desired. In this case, define one output per row in the Rule Output table.
Important! Keep in mind that other linguistic handling operations are performed during the extraction of
TLA patterns. So when the output reads t$3\t#3, this means that the pattern will ultimately display the
final concept for the third element and the final type for the third element after all linguistic processing is
applied (synonyms and other groupings).
v Show output as. By default, the option References to row in Rule Value table is selected and the
output is shown by using the numerical references to the row as defined in the Rule Value tab. If you
previously clicked Get Tokens and have tokens in the Example Tokens column in the Rule Value table,
you can choose to see the output for these specific tokens by choosing the option .
Note: If there are not enough concept/type output pairs shown in the output table, you can add another
pair by clicking the Add button in the editor toolbar. If 3 pairs are currently shown and you click add, 2
more columns (Concept 4 and Type 4) are added to the table. This means that you will now see 4 pairs in
the output table for all rules. You can also remove unused pairs as long as no other rule in the set of
rules in this library uses that pair.
214
IBM SPSS Modeler Text Analytics 16 User's Guide
Example Rule
Let's suppose your resources contain the following text link analysis rule and that you have enabled the
extraction of TLA results:
Figure 43. Text Link Rules tab: Rule Editor
Whenever you extract, the extraction engine will read each sentence and will try to match the following
sequence:
Table 44. Extraction sequence example
Element
(row)
Description of the arguments
1
The concept from one of the types represented by the macros mPos or mNeg or from the type
<Uncertain>.
2
A concept typed as one of the types represented by the macro mTopic.
3
One of the words represented by the macro mBe.
4
An optional element, 0 or 1 words, also referred to as a word gap or <Any Token>
5
A concept typed as one of the types represented by the macro mTopic.
The output table shows that all that is wanted from this rule is a pattern where any concept or type
corresponding to the mTopic macro that was defined in row 5 in the Rule Value table + any concept or
type corresponding to the mPos, mNeg, or <Uncertain> as was defined in row 1 in the Rule Value table.
This could be sausage + like or <Unknown> + <Positive>.
Creating and Editing Rules
You can create new rules or edit existing ones. Follow the guidelines and descriptions for the rule editor.
See the topic “Working with Text Link Rules” on page 213 for more information.
Chapter 19. About Text Link Rules
215
Creating New Rules
1. From the menus, choose Tools > New Rule. Alternatively, click the New rule icon in the tree toolbar
to open a new rule in the editor.
2. Enter a unique name and define the rule value elements.
3. Click Apply when finished to check for errors.
Editing Rules
1. Click the rule name in the tree. The rule opens in the editor pane on the right.
2. Make your changes.
3. Click Apply when finished to check for errors.
Disabling and Deleting Rules
Disabling Rules
If you want a rule to be ignored during processing, you can disable it. Take caution when deleting and
disabling rules.
1. Click the rule name in the tree. The rule opens in the editor pane on the right.
2. Right-click on the name.
3. From the context menus, choose Disable. The rule icon becomes gray and the rule itself becomes
uneditable.
Deleting Rules
If you want to get rid of a rule, you can delete it. Take caution when deleting and disabling rules.
1. Click the rule name in the tree. The rule opens in the editor pane on the right.
2. Right-click on the name.
3. From the context menus, choose Delete. The rule disappears from the list.
Checking for Errors, Saving, and Cancelling
Applying Rule Changes
If you click outside of the rule editor or if you click Apply, the rule is automatically scanned for errors. If
an error is found, you will need to fix it before moving on to another part of the application.
However, if less serious errors are detected, only a warning is given. For example, if your rule contains
incomplete or unreferenced definitions to types or macros, a warning message is displayed. Once you
click Apply, any uncorrected warnings cause a warning icon to appear to the left of the rule name in the
tree in the left pane.
Applying a rule does not mean that your rule is permanently saved. Applying will cause the validation
process to check for errors and warnings.
Saving Resources inside an Interactive Workbench Session
1. To save the changes you made to your resources during an interactive workbench session so you can
get them next time you run your stream, you must:
v Update your modeling node to make sure that you can get these same resources next time you
execute your stream. See the topic “Updating Modeling Nodes and Saving” on page 82 for more
information. Then save your stream. To save your stream, do so in the main IBM SPSS Modeler
window after updating the modeling node.
2. To save the changes you made to your resources during an interactive workbench session so that you
can use them in other streams, you can:
216
IBM SPSS Modeler Text Analytics 16 User's Guide
v Update the template you used or make a new one. See the topic “Making and Updating Templates”
on page 161 for more information. This will not save the changes for the current node (see previous
step)
v Or, update the TAP you used. See the topic “Updating Text Analysis Packages” on page 137 for
more information.
Saving Resources inside the Template Editor
1. First, publish the library. See the topic “Publishing Libraries” on page 178 for more information.
2. Then, save the template through File > Save Resource Template in the menus.
Cancelling Rule Changes
1. If you wish to discard the changes, click Cancel in the editor pane.
Processing Order for Rules
When text link analysis is performed during extraction, a "sentence" (clause, word, phrase) will be
matched against each rule in turn until a match is found or all rules have been exhausted. Position in the
tree dictates the order in which rules are tried. Best practice states that you should order your rules from
most specific to most generic. The most specific ones should be at the top of the tree. To change the order
of a specific rule or rule set, select Move up or Move down from the Rules and Macro Tree context menu
or the up and down arrows in the toolbar.
If you are in the source view, you cannot change the order of the rules by moving them around in the
editor. The higher up the rule appears in the source view, the sooner it is processed. We strongly
recommend reordering rules only in the tree to avoid copy/paste issues.
Important! In previous versions of IBM SPSS Modeler Text Analytics, you were required to have a
unique, numeric rule ID. Starting in version 16, you can only indicate processing order by moving a rule
up or down in the tree, or by their position in the source view.
For example, suppose your text contains the following two sentences:
I love anchovies
I love anchovies and green peppers
In addition, suppose that two text link analysis rules exist with the following values:
Chapter 19. About Text Link Rules
217
Figure 44. 2 Example Rules
In the source view, the rule values might look like the following:
A: value = $Positive $mDet? $mTopic
B: value = $Positive $mDet? $mTopic ($SEP|and|or){1,2} $mDet? $mTopic
If rule A is higher up in the tree (closer to the top) than rule B, then rule A will be processed first and
the sentence I love anchovies and green peppers will be first matched by $Positive $mDet? $mTopic, and it
will produce an incomplete pattern output (anchovies + like) since it was matched by a rule that wasn't
looking for 2 $mTopic matches.
Therefore, to capture the true essence of the text, the most specific rule, in this case B must be placed
higher in the tree than the more generic one, in this case rule A.
Working with Rule Sets (Multiple Pass)
A rule set is a helpful way of grouping a related set of rules together in the Rules and Macro Tree so as
to perform multiple pass processing. A rule set has no definition itself other than a name, and is used to
organize your rules into meaningful groups. In some contexts, the text is too rich and varied to be
processed in a single pass. For example, when working with security intelligence data, the text may
contain links between individuals that are uncovered through contact methods (x called y), through family
relationships (y’s brother-in-law x), through exchange of money (x wired $100 to y), and so on. In this case,
it is helpful to create specialized sets of text link analysis rules, each of which is focused on a certain kind
of relationship such as one for uncovering contacts, another for uncovering family members, and so on.
To create a rule set, select “Create Rule Set” from the Rules and Macro Tree context menu, or from the
toolbar. You can then create new rules directly under a Rule Set node on the tree, or move existing rules
to a Rule Set.
When you run an extraction using resources in which the rules are grouped into rule sets, the extraction
engine is forced to make multiple passes through the text in order to match different kinds of patterns in
each pass. In this way, a "sentence" can be matched to a rule in each rule set, whereas without a rule set
it can only matched to a single rule.
Note: You can add up to 512 rules per rule set.
218
IBM SPSS Modeler Text Analytics 16 User's Guide
Creating New Rule Sets
1. From the menus, choose Tools > New Rule Set. Alternatively, click the New Rule Set icon in the tree
toolbar. A rule set appears in the rule tree.
2. Add new rules to this rule set or move existing rules into the set.
Disabling Rule Sets
1. Right-click the rule set name in the tree.
2. From the context menus, choose Disable. The rule set icon becomes gray and all of the rules
contained within that rule set are also disabled and ignored during processing.
Deleting Rule Sets
1. Right-click the rule set name in the tree.
2. From the context menus, choose Delete. The rule set and all the rules it contains are deleted from the
resources.
Supported Elements for Rules and Macros
The following arguments are accepted for the value parameters in text link analysis rules and macros:
Macros
You can use a macro directly in a text link analysis rule or within another macro. If you are entering the
macro name by hand or from within the source view (as opposed to selecting the macro name from a
context menu), make sure to prefix the name with a dollar sign character ($), such as $mTopic. The macro
name is case sensitive. You can choose from any macro defined in the current Text Link Rules tab when
selecting macros through the context menus.
Types
You can use a type directly in a text link analysis rule or macro. If you are entering the type name by
hand or in the source view (as opposed to selecting the type from a context menu), make sure to prefix
the type name with a dollar sign character ($), such as $Person. The type name is case sensitive. If you
use the context menus, you can choose from any type from the current set of resources being used.
If you reference an unrecognized type, you will receive a warning message, and the rule will have a
warning icon in the Rules and Macro Tree until you correct it.
Literal Strings
To include information that was never extracted, you can define a literal string for which the extraction
engine will search. All extracted words or phrases have been assigned to a type and for this reason, they
cannot be used in literal strings. If you use a word that was extracted, it will be ignored, even if its type
is <Unknown>.
A literal string can be one or more words. The following rules apply when defining a list of literal
strings:
v Enclose the list of strings in parentheses such as (his). If there is a choice of literal strings then each
string must be separated by the OR operator, such as (a|an|the) or (his|hers|its).
v Use single or compound words.
v Separate each word in the list by the | character, which is like a Boolean OR.
v Enter both singular and plural forms if you want to match both. Inflection is not automatically
generated.
v Use lower case only.
Chapter 19. About Text Link Rules
219
v To reuse literal strings, define them as a macro and then use that macro in your other macros and text
link analysis rules.
v If a string contains periods (full stops) or hyphens, you must include them. For example, to match
a.k.a in the text, enter the periods along with the letters a.k.a as the literal string.
Exclusion Operator
Use ! as an exclusion operator to stop any expression of the negation from occupying a particular slot.
You can only add an exclusion operator by hand through inline cell editing (double-click the cell in the
Rule Value table or Macro Value table) or in the source view. For example, if you add $mTopic @{0,2}
!($Positive) $Budget to your text link analysis rule, you are looking for text that contains (1) a term
assigned to any of the types in the mTopic macro, (2) a word gap of zero to two words long, (3) no
instances of a term assigned to the <Positive> type, and (4) a term assigned to the <Budget> type. This
might capture "cars have an inflated price tag" but would ignore "store offers amazing discounts".
To use this operator, you must enter the exclamation point and parenthesis manually into the element cell
by double-clicking the cell.
Word Gaps (<Any Token>)
A word gap, also referred to as <Any Token>, defines a numeric range of tokens that may be present
between two elements. Word gaps are very useful when matching very similar phrases that may differ
only slightly due to the presence of additional determiners, prepositional phrases, adjectives, or other
such words.
Table 45. Example of the elements in a Rule Value table without a word gap
#
Element
1
Unknown
2
mBeHave
3
Positive
Note: In the source view this value is defined as: $Unknown $mBeHave $Positive
This value will match sentences like "the hotel staff was nice”, where hotel staff belongs to type <Unknown>,
was is under the macro mBeHave and nice is <Positive>. But it will not match “the hotel staff was very nice”.
Table 46. Example of the elements in a Rule Value table with a <Any Token> word gap
#
Element
1
Unknown
2
mBeHave
3
220
IBM SPSS Modeler Text Analytics 16 User's Guide
Table 46. Example of the elements in a Rule Value table with a <Any Token> word gap (continued)
4
Positive
Note: In the source view this value is defined as: $Unknown $mBeHave @{0,1} $Positive
If you add a word gap to your rule value, it will match both “the hotel staff was nice” and “the hotel staff
was very nice”.
In the source view or with inline editing, the syntax for a word gap is @{#,#}, where @ signifies a word
gap and the {#,#} defines the minimum and maximum of words accepted between the preceding
element and following element. For example, @{1,3} means that a match can be made between the two
defined elements if there is at least one word present but no more than three words appearing between
those two elements. @{0,3} means that a match can be made between the two defined elements if there is
0, 1, 2 or 3 words present but no more than three words.
Viewing and Working in Source Mode
For each rule and macro the TLA editor generates the underlying source code that is used by the
Extractor for matching and producing TLA output. If you prefer to work with the code itself, you can
view this source code and edit it directly by clicking the “View Source” button at the top of the Editor.
The Source view will jump to and highlight the currently selected rule or macro. However, we
recommend using the editor panes to reduce the chance of errors.
When you have finished viewing or editing the source, click Exit Source. If you generate invalid syntax
for a rule, you will be required to fix it before you exit the source view.
Important! If you edit in the source view, we strongly recommend that you edit rules and macros one at
a time. After editing a macro, please validate the results by extracting. If you are satisfied with the result,
we recommend that you save the template before making another change. If you are not satisfied with
the result or an error occurs, revert to your saved resources.
Macros in the Source View
[macro]
name = macro_name
value = ([type_name|macro_name|literal_string|word_gap])
Table 47. Macro entries.
[macro]
Each macro must begin with the line marked [macro] to denote the beginning of a macro.
name
The name of the macro definition. Each name must be unique.
value
A combination of one or more types, literal strings, word gaps, or macros.See the topic “Supported
Elements for Rules and Macros” on page 219 for more information. When combining arguments,
you must use parentheses ( ) to group the arguments and the character | to indicate a Boolean
OR.
In addition to the guidelines and syntax covered in the section on Macros, the source view has a few
additional guidelines that aren't required when working in the editor view. Macros must also respect the
following when working in source mode:
v Each macro must begin with the line marked [macro] to denote the beginning of a macro.
v To disable an element, place a comment indicator (#) before each line.
Chapter 19. About Text Link Rules
221
Example. This example defines a macro called mTopic. The value for mTopic is the presence of a term
matching one of the following types: <Product>, <Person>, <Location>, <Organization>, <Budget>, or
<Unknown>.
[macro]
name=mTopic
value=($Unknown|$Product|$Person|$Location|$Organization|$Budget|$Currency)
Rules in the Source View
[pattern(ID)]
name = pattern_name
value = [$type_name|macro_name|word_gaps|literal_strings]
output = $digit[\t]#digit[\t]$digit[\t]#digit[\t]$digit[\t]#digit[\t]
Table 48. Rule entries.
[pattern
(<ID>)]
Indicates the start of a that text link analysis rule and provides a unique numerical ID use to
determine processing order.
name
Provides a unique name for this text link analysis rule.
value
Provides the syntax and arguments to be matched to the text. See the topic “Supported Elements
for Rules and Macros” on page 219 for more information.
output
The output format for the resulting matched patterns discovered in the text. The output does not
always resemble the exact original position of elements in the source text. Additionally, it is
possible to have multiple output lines for a given text link analysis rule by placing each output on
a separate line.
Syntax for output:
v Separate output with the tab code \t, such as $1\t#1\t$3\t#3
v
$ and a number calls for the term found matching the argument defined in the value
parameter in that position. So $1 means the term matching the first argument defined for the
value.
v
# and a number calls for the type name of the element in that position. If an item is a list of
literal strings, the type <Unknown> will be assigned.
v A value of Null\tNull will not create any output.
In addition to the guidelines and syntax covered in the section on Rules, the source view has a few
additional guidelines that aren't required when working in the editor view. Rules must also respect the
following when working in source mode:
v Whenever two or more elements are defined, they must be enclosed in parentheses whether or not
they are optional (for example, ($Negative|$Positive) or ($mCoord|$SEP)?). $SEP represents a
comma.
v The first element in a text link analysis rule cannot be an optional element. For example, you cannot
begin with value = $mTopic? or value = @{0,1}.
v It is possible to associate a quantity (or instance count) to a token. This is useful in writing only one
rule that encompasses all cases instead of writing a separate rule for each case. For example, you may
use the literal string ($SEP|and) if you are trying to match either , (comma) or and. If you extend this
by adding a quantity so that the literal string becomes ($SEP|and){1,2}, you will now match any of
the following instances: "," "and" ", and".
v Spaces are not supported between the macro name and the $ and ? characters in the text link analysis
rule value.
v Spaces are not supported in the text link analysis rule output.
v To disable an element, place a comment indicator (#) before each line.
Example. Let's suppose your resources contain the following TLA text link analysis rule and that you
have enabled the extraction of TLA results:
222
IBM SPSS Modeler Text Analytics 16 User's Guide
## Jean Doe was the former HR director of IBM in France
[pattern(201)]
name= 1_201
value = $Person ($SEP|$mDet|$mSupport|as|then){1,2} @{0,1} $Function
(of|with|for|in|to|at) @{0,1} $Organization @{0,2} $Location
output = $1\t#1\t$4\t#4\t$7\t#7\t$9\t#9
Whenever you extract, the extraction engine will read each sentence and will try to match the following
sequence:
Table 49. Extraction sequence example.
Position
Description of the arguments
1
The name of a person ($Person),
2
One or two of the following: comma ($SEP), determiner ($mDet), auxiliary verb ($mSupport), the strings
“then” or “as”,
3
0 or 1 word (@{0,1})
4
A function ($Function)
5
One of the following strings: “of”, “with”, “for”, “in”, “to”, or “at”,
6
0 or 1 word (@{0,1})
7
The name of an organization ($Organization)
8
0, 1, or 2 words (@{0,2})
9
The name of a location ($Location)
This sample text link analysis rule would match sentences or phrases like:
Jean Doe, the HR director of IBM in France
Jean Doe was the former HR director of IBM in France
IBM appointed Jean Doe as the HR director of IBM in France
This sample text link analysis rule would produce the following output:
jean doe <Person> hr director <Function> ibm <Organization> france <Location>
Where:
v jean doe is the term corresponding to $1 (the first element in the text link analysis rule) and <Person>
is the type for jean doe (#1),
v hr director is the term corresponding to $4 (the 4th element in the text link analysis rule) and
<Function> is the type for hr director (#4),
v ibm is the term corresponding to $7 (the 7th element in the text link analysis rule) and <Organization>
is the type for ibm. (#7),
v
france is the term corresponding to $9 (the 9th element in the text link analysis rule) and <Location>
is the type for france (#9)
Rule Sets in the Source View
[set(<ID>)]
Where [set (<ID>)] indicates the start of a rule set and provides a unique numerical ID use to determine
processing order of the sets.
Chapter 19. About Text Link Rules
223
Example. The following sentence contains information about individuals, their function within a
company, and also the merge/acquisition activities of that company.
IBM has entered into a definitive merger agreement with SPSS, said Jack Noonan, CEO of SPSS.
You could write one rule with several outputs to handle all possible output such as:
## IBM entered into a definitive merger agreement with SPSS, said
Jack Noonan, CEO of SPSS.
[pattern(020)]
name=020
value = $Organization @{0,4} $ActionNouns @{0,6}
$Person @{0,2} $Function @{0,1} $Organization
output = $1\t#1\t$3\t#3\t$5\t#5
output = $7\t#7\t$9\t#9\t$11\t#11
$mOrg @{1,2}
which would produce the following 2 output patterns:
v
v
ibm <Organization> + merges with <ActiveVerb> + spss <Organization>
jack noonan <Person> + ceo <Function> + spss <Organization>
Important! Keep in mind that other linguistic handling operations are performed during the extraction of
TLA patterns. In this case, merger is grouped under merges with during the synonym grouping phase of
the extraction process. And since merges with belongs to <ActiveVerb> type, this type name is what
appears in the final TLA pattern output. So when the output reads t$3\t#3, this means that the pattern
will ultimately display the final concept for the third element and the final type for the third element
after all linguistic processing is applied (synonyms and other groupings).
Instead of writing complex rules like the preceding, it can be easier to manage and work with two rules.
The first is specialized in finding out mergers/acquisitions between companies:
[set(1)]
## IBM has entered into a definitive merger agreement with SPSS
[pattern(44)]
name=firm + action + firm_0044
value=$mOrg @{0,20} $ActionNouns @{0,6} $mOrg
output(1)=$1\t#1\t$3\t#3\t$5\t#5
which would produce ibm <Organization> + merges with <ActiveVerb> + spss <Organization>
The second is specialized in individual/function/company:
[set(2)]
## said Jack Noonan, CEO of SPSS
[pattern(52)]
name=individual + role + firm_0007
value=$Person @{0,3} $mFunction (at|of)? ($mOrg|$Media|$Unknown)
output(1)=$1\t#1\t$3\tFunction\t$5\t#5
which would produce jack noonan <Person> + ceo <Function> + spss <Organization>
224
IBM SPSS Modeler Text Analytics 16 User's Guide
Notices
This information was developed for products and services offered worldwide.
IBM may not offer the products, services, or features discussed in this document in other countries.
Consult your local IBM representative for information on the products and services currently available in
your area. Any reference to an IBM product, program, or service is not intended to state or imply that
only that IBM product, program, or service may be used. Any functionally equivalent product, program,
or service that does not infringe any IBM intellectual property right may be used instead. However, it is
the user's responsibility to evaluate and verify the operation of any non-IBM product, program, or
service.
IBM may have patents or pending patent applications covering subject matter described in this
document. The furnishing of this document does not grant you any license to these patents. You can send
license inquiries, in writing, to:
IBM Director of Licensing
IBM Corporation
North Castle Drive
Armonk, NY 10504-1785
U.S.A.
For license inquiries regarding double-byte (DBCS) information, contact the IBM Intellectual Property
Department in your country or send inquiries, in writing, to:
Intellectual Property Licensing
Legal and Intellectual Property Law
IBM Japan Ltd.
1623-14, Shimotsuruma, Yamato-shi
Kanagawa 242-8502 Japan
The following paragraph does not apply to the United Kingdom or any other country where such
provisions are inconsistent with local law: INTERNATIONAL BUSINESS MACHINES CORPORATION
PROVIDES THIS PUBLICATION "AS IS" WITHOUT WARRANTY OF ANY KIND, EITHER EXPRESS OR
IMPLIED, INCLUDING, BUT NOT LIMITED TO, THE IMPLIED WARRANTIES OF
NON-INFRINGEMENT, MERCHANTABILITY OR FITNESS FOR A PARTICULAR PURPOSE. Some
states do not allow disclaimer of express or implied warranties in certain transactions, therefore, this
statement may not apply to you.
This information could include technical inaccuracies or typographical errors. Changes are periodically
made to the information herein; these changes will be incorporated in new editions of the publication.
IBM may make improvements and/or changes in the product(s) and/or the program(s) described in this
publication at any time without notice.
Any references in this information to non-IBM Web sites are provided for convenience only and do not in
any manner serve as an endorsement of those Web sites. The materials at those Web sites are not part of
the materials for this IBM product and use of those Web sites is at your own risk.
IBM may use or distribute any of the information you supply in any way it believes appropriate without
incurring any obligation to you.
225
Licensees of this program who wish to have information about it for the purpose of enabling: (i) the
exchange of information between independently created programs and other programs (including this
one) and (ii) the mutual use of the information which has been exchanged, should contact:
IBM Software Group
ATTN: Licensing
200 W. Madison St.
Chicago, IL; 60606
U.S.A.
Such information may be available, subject to appropriate terms and conditions, including in some cases,
payment of a fee.
The licensed program described in this document and all licensed material available for it are provided
by IBM under terms of the IBM Customer Agreement, IBM International Program License Agreement or
any equivalent agreement between us.
Any performance data contained herein was determined in a controlled environment. Therefore, the
results obtained in other operating environments may vary significantly. Some measurements may have
been made on development-level systems and there is no guarantee that these measurements will be the
same on generally available systems. Furthermore, some measurements may have been estimated through
extrapolation. Actual results may vary. Users of this document should verify the applicable data for their
specific environment.
Information concerning non-IBM products was obtained from the suppliers of those products, their
published announcements or other publicly available sources. IBM has not tested those products and
cannot confirm the accuracy of performance, compatibility or any other claims related to non-IBM
products. Questions on the capabilities of non-IBM products should be addressed to the suppliers of
those products.
All statements regarding IBM's future direction or intent are subject to change or withdrawal without
notice, and represent goals and objectives only.
This information contains examples of data and reports used in daily business operations. To illustrate
them as completely as possible, the examples include the names of individuals, companies, brands, and
products. All of these names are fictitious and any similarity to the names and addresses used by an
actual business enterprise is entirely coincidental.
If you are viewing this information softcopy, the photographs and color illustrations may not appear.
Trademarks
IBM, the IBM logo, and ibm.com are trademarks or registered trademarks of International Business
Machines Corp., registered in many jurisdictions worldwide. Other product and service names might be
trademarks of IBM or other companies. A current list of IBM trademarks is available on the Web at
“Copyright and trademark information” at www.ibm.com/legal/copytrade.shtml.
Intel, Intel logo, Intel Inside, Intel Inside logo, Intel Centrino, Intel Centrino logo, Celeron, Intel Xeon,
Intel SpeedStep, Itanium, and Pentium are trademarks or registered trademarks of Intel Corporation or its
subsidiaries in the United States and other countries.
Linux is a registered trademark of Linus Torvalds in the United States, other countries, or both.
Microsoft, Windows, Windows NT, and the Windows logo are trademarks of Microsoft Corporation in the
United States, other countries, or both.
226
IBM SPSS Modeler Text Analytics 16 User's Guide
UNIX is a registered trademark of The Open Group in the United States and other countries.
Java and all Java-based trademarks and logos are trademarks or registered trademarks of Oracle and/or
its affiliates.
Other product and service names might be trademarks of IBM or other companies.
Notices
227
228
IBM SPSS Modeler Text Analytics 16 User's Guide
Index
Special characters
C
! ^ * $ symbols in synonyms 188
.doc/.docx/.docm files for text
mining 12
.htm/.html files for text mining 12
.pdf files for text mining 12
.ppt/.pptx/.pptmfiles for text mining 12
.rtf files for text mining 12
.shtml files for text mining 12
.txt/.textfiles for text mining 12
.xls/.xlsx/.xlsm files for text mining 12
.xml files for text mining 12
*.lib 177
*.tap text analysis packages 136, 137
& | !() rule operators 130
"All" language option 202, 203
caching
data and session extraction results 24
translated text 56
Web feeds 14
calculating similarity link values 144
caret symbol (^) 188
categories 19, 99, 100, 106, 138
adding to 139
annotations 107
building 109, 111, 113, 119
creating 102, 118, 122
creating new empty category 121
deleting 140
descriptors 103, 104, 106
editing 138, 139
extending 113, 119
flattening 140
labels 107
manual creation 121
merging 140
moving 139
names 107
properties 107
refining results 138
relevance 108
renaming 121
scoring 100
strategies 102
text analysis packages 136, 137
text mining category model
nuggets 25
categories and concepts view 71, 99
categories pane 100
data pane 107
categories pane 100
categorizing 7, 99
co-occurrence rules 111, 113, 117
concept inclusion 111, 113, 115
concept root derivation 111, 113, 114
frequency techniques 118
linguistic techniques 109, 119
manually 121
methods 102
semantic networks 111, 113, 115
using grouping techniques 111
using techniques 113
category bar chart 154
category building 7, 109, 111
classification link exceptions 113
co-occurrence rule technique 119
concept inclusion technique 119
concept root derivation
technique 119
semantic networks technique 119
category model nuggets 19, 39
building via node 25
building via workbench 24
concepts as fields or records 41
example 42
fields tab 42
A
abbreviations 201, 202
activating nonlinguistic entities 200
adding
concepts to categories 139
descriptors 104
optional elements 190
public libraries 174
sounds 80, 81
synonyms 94, 188
terms to exclude list 191
terms to type dictionaries 184
types 95
addresses (nonlinguistic entity) 196
advanced resources 193
find and replace in editor 194, 195
all documents 100
amino acids (nonlinguistic entity) 196
AND rule operator 130
annotations
for categories 107
antilinks 113
asterisk (*)
exclude dictionary 191
synonyms 188
B
backing up resources 171
Boolean operators 130
Budget library 182
Budget type dictionary 182
build concept map index 92
building
categories 2, 7, 109, 111, 113, 114, 115,
117, 118, 119, 121
clusters 142
category model nuggets (continued)
generating 81
model tab 40
output 40
settings tab 41
summary tab 42
category name 100
category rules 123, 128, 130, 131
co-occurrence rules 111, 113, 119
examples 128
from concept co-occurrence 111, 113,
117, 119
from synonymous words 111, 113,
119
syntax 123
category web graph/table 154
changing
templates 162, 168
closing the session 82
clusters 24, 74, 141
about 141
building 142
cluster web graph 154, 155
concept web graph 154, 155
descriptors 145
exploring 144
similarity link values 144
clusters view 74
co-occurrence rules technique 111, 113,
117, 119
code frames 131, 132
colors
exclude dictionary 191
for types and terms 183
setting color options 80
synonyms 188
column wrapping 80
combining categories 140
compact format 133
componentization 114
concept inclusion technique 111, 113,
115, 119
concept maps 90, 92
build index 92
concept model nuggets 19, 30
building via node 25
concepts as fields or records 33
concepts for scoring 31
example 35
fields tab 34
model tab 31
settings tab 33
summary tab 35
synonyms 33
concept patterns 149
concept root derivation technique 111,
113, 114, 119
concept web graph 154, 155
concepts 19, 31
adding to categories 103, 106, 139
adding to types 95
229
concepts (continued)
as fields or records for scoring 33, 41
best descriptors 104
concept maps 90
creating types 93
excluding from extraction 96
extracting 85
filtering 89
forcing into extraction 97
in categories 103, 106
in clusters 145
Core library 182
creating
categories 25, 102, 109, 122
categories with rules 123
category rules 123, 130
exclude dictionary entries 191
libraries 174
modeling nodes and category model
nuggets 81
optional elements 190
synonyms 93, 94, 188
template from resources 161
templates 169
type dictionaries 183
types 95
currencies (nonlinguistic entity) 196
custom colors 80
D
data
categorizing 99, 109, 121
category building 111, 113, 119
clustering 141
data pane 107, 151
extracting 85, 86, 148
extracting text link patterns 147
filtering results 89, 149
refining results 93
restructuring 51
text link analysis 147
data pane
categories and concepts view 107
display button 100
text link analysis view 151
date format
nonlinguistic entities 199
dates (nonlinguistic entity) 196, 199
deactivating nonlinguistic entities 200
default libraries 173
definitions 103, 106
deleting
categories 140
category rules 131
disabling libraries 176
excluded entries 191
libraries 176, 177
optional elements 190
resource templates 170
synonyms 190
type dictionaries 187
delimiter 80
descriptors 100
categories 103, 106
choosing best 104
clusters 145
230
descriptors (continued)
editing in categories 139
dictionaries 78, 181
excludes 173, 181, 191
substitutions 173, 181, 187
types 173, 181
digits (nonlinguistic entity) 196
disabling
exclude dictionaries 191
libraries 176
nonlinguistic entities 200
substitution dictionaries 190
synonym dictionaries 196
type dictionaries 187
display button 100
display columns in the categories
pane 100
display columns in the data pane 151
display settings 80
docs column 100
document fields 59
documents 107, 151
listing 59
dollar sign ($) 188
drag and drop 122
E
e-mail (nonlinguistic entity) 196
edit mode 156
editing
categories 138, 139
category rules 131
refining extraction results 93
enabling nonlinguistic entities 200
encoding 56
exclamation mark (!) 188
exclude dictionary 173, 191
excluding
concepts from extraction 96
disabling dictionaries 187, 190
disabling exclude entries 191
disabling libraries 176
from category links 113
from fuzzy exclude 196
exclusion operator 219
explore mode 156
exporting
predefined categories 135
public libraries 177
templates 170
expression builder 83
extending categories 119
extension list in file list node 12
external links 141
extracting 1, 2, 5, 49, 85, 86, 173, 181
extraction results 85
forcing words 97
patterns from data 47
refining results 93
TLA patterns 148
uniterms 5
extraction patterns 201
IBM SPSS Modeler Text Analytics 16 User's Guide
F
FALLBACK_LANGUAGE 202
file list node 8, 11, 12, 13
example 13
extension list 12
other tabs 13
scripting properties 63
settings tab 12
filelistnode scripting properties 63
filtering libraries 175
filtering results 89, 149
find and replace (advanced
resources) 194, 195
finding terms and types 175
flat list format 133
flattening categories 140
font color 183
forced definitions 201
forcing
concept extraction 97
terms 186
frequency 118
fuzzy grouping exceptions 193, 196
G
generate inflected forms 181, 183, 184
generating nodes and model nuggets 81
global delimiter 80
graphs 156
cluster web graph 154, 155
concept maps 90
concept web graph 154, 155
editing 156
explore mode 156
TLA concept web graph 156
type web graph 156
H
HTML formats for Web feeds 13, 15
HTTP/URLs (nonlinguistic) 196
I
ID field 47
identifying languages 202, 203
ignoring concepts 96
importing
predefined categories 132
public libraries 177
templates 170
indented format 134
index for concept maps 92
inflected forms 114, 181, 183, 184
input encoding 56
interactive workbench 23, 24, 26, 71, 82
internal links 141
IP addresses (nonlinguistic entity) 196
K
keyboard shortcuts
82, 83
L
label
to reuse translated text 56
to reuse Web feeds 14
labels for categories 107
language
setting target language for
resources 195
language handling sections 193, 201
abbreviations 201, 202
extraction patterns 201
forced definitions 201
language identifier 202, 203
launch interactive workbench 23
libraries 78, 173, 181
adding 174
Budget library 182
Core library 182
creating 174
deleting 176, 177
dictionaries 173
disabling 176
exporting 177
importing 177
library synchronization warning 177
linking 174
local libraries 177
naming 176
Opinions library 182
public libraries 177
publishing 178
renaming 176
sharing and publishing 177
shipped default libraries 173
synchronizing 177
updating 179
viewing 175
linguistic resources 47, 173
resource templates 163
templates 159
text analysis packages 136, 137
linguistic techniques 2
link exceptions 113
link values 144
links in clusters 141
literal strings 219
loading resource templates 26, 47, 169
Location type dictionary 182
M
macros 210, 211
mNonLingEntitities 212
mTopic 212
making templates from resources 161
managing
categories 138
local libraries 176
public libraries 177
mapping concepts 90
match option 181, 183, 184
maximum number of categories to
create 111
merging categories 140
Microsoft Excel .xls / .xlsx files
exporting predefined categories 135
Microsoft Excel .xls / .xlsx files
(continued)
importing predefined categories 132
Microsoft Excel.xls / .xlsx files
importing predefined categories 131
minimum link value 111
mNonLingEntitities 212
model nuggets 23
category model nuggets 19, 23, 25,
39, 40
concept model nuggets 19, 23, 25, 30,
31
generating from interactive
workbench 81
moving
categories 139
type dictionaries 187
mTopic 212
multistep processing 218
muting sounds 81
N
naming
categories 107
libraries 176
type dictionaries 186
navigating keyboard shortcuts 82
Negative type dictionary 182
new categories 121
nodes
category model nuggets 39
concept model nugget 30
file list 8, 11
text link analysis 8, 47
text mining model nugget 8
text mining modeling node 8, 20
text mining viewer 8, 59
translate 8, 55
web feed 8, 13
nonlinguistic entities
addresses 196
amino acids 196
currencies 196
date format 199
dates 196
digits 196
e-mail addresses 196
enabling and disabling 200
HTTP addresses/URLs 196
IP addresses 196
normalization, NonLingNorm.ini 199
percentages 196
phone numbers 196
proteins 196
regular expressions, RegExp.ini 197
times 196
U.S. social security number 196
weights and measures 196
normalization 199
NOT rule operator 130
NUM_CHARS 202
O
opening templates 168
operators in rules & | !() 130
Opinions library 182
optional elements 187
adding 190
definition of 187
deleting entries 190
target 190
options 79
display options (colors) 80
session options 80
sound options 81
OR rule operator 130
Organization type dictionary 182
P
part-of-speech 201
partition mode 21
patterns 24, 47, 85, 147, 149, 205, 209,
213
arguments 219
multistep processing 218
text link rule editor 205
percentages (nonlinguistic entity) 196
Person type dictionary 182
phone numbers (nonlinguistic) 196
plural word forms 183
Positive type dictionary 182
predefined categories 131, 132, 135
compact format 133
flat list format 133
indented format 134
preferences 79, 80, 81
Product type dictionary 182
properties
categories 107
proteins (nonlinguistic entity) 196
publishing 178
adding public libraries 174
libraries 177
R
records 107, 151
refining results
adding concepts to types 95
adding synonyms 94
categories 138
creating types 95
excluding concepts 96
extraction results 93
forcing concept extraction 97
relevance of responses and
categories 108
renaming
categories 121
libraries 176
resource templates 170
type dictionaries 186
replacing resources with template 162
resource editor 78, 159, 161, 162, 164,
193
making templates 161
switching resources 162
Index
231
resource editor (continued)
updating templates 161
resource templates 5, 47, 78, 147, 159,
163
resources
backing up 171
editing advanced resources 193
restoring 171
shipped default libraries 173
switching template resources 162
restoring resources 171
results of extractions 85
filtering results 89, 149
reusing
data and session extraction results 24
translated text 56
Web feeds 14
RSS formats for Web feeds 13, 15
rules 215
Boolean operators 130
co-occurrence rules technique 117
creating 130
deleting 131
editing 131
syntax 123
S
sample node
when mining text 29
saving
data and session extraction results 24
interactive workbench 82
resources 171
resources as templates 161
templates 169
translated text 56
Web feeds 14
score button 100
scoring 100
concepts 32
screen readers 82, 83
selecting concepts for scoring 32
semantic networks technique 111, 113,
115, 119
separators 80
session information 23, 24, 26
settings 79, 80, 81
sharing libraries 177
adding public libraries 174
publishing 178
updating 179
shipped (default) libraries 173
shortcut keys 82, 83
similarity link values 144
simulating text link analysis results 207,
208
defining data 207
social security # (nonlinguistic) 196
sound options 81
source nodes
file list 8, 11
web feed 8, 13
spelling mistakes 196
substitution dictionary 173, 187, 188, 190
synchronizing libraries 177, 178, 179
synonyms 93, 187
232
synonyms (continued)
! ^ * $ symbols 188
adding 94, 188
colors 188
definition of 187
deleting entries 190
fuzzy grouping exceptions 196
in concept model nuggets 33
target terms 188
T
tables 83
target language 195
target terms 188
techniques
co-occurrence rules 111, 113, 117, 119
concept inclusion 111, 113, 115, 119
concept root derivation 111, 113, 114,
119
drag and drop 122
frequency 118
semantic networks 111, 113, 115, 119
Template Editor 163, 164, 168, 169, 170,
171
deleting templates 170
exiting the editor 171
importing and exporting 170
opening templates 168
renaming templates 170
resource libraries 173
saving templates 169
updating resources in node 169
templates 5, 47, 78, 147, 159, 163
backing up 171
deleting 170
importing and exporting 170
load resource templates dialog
box 26
making from resources 161
opening templates 168
renaming 170
restoring 171
saving 169
switching templates 162
TLA 162
updating or saving as 161
term componentization 114
terms
adding to exclude dictionary 191
adding to types 184
color 183
finding in the editor 175
forcing terms 186
inflected forms 181
match options 181
text analysis 2
text analysis packages 136, 137
loading 137
text field 56
text link analysis (TLA) 47, 76, 147, 149,
205, 206, 207, 208, 209, 213, 215, 216,
217, 221
arguments 219
data pane 151
disabling and deleting rules 216
editing macros and rules 205
IBM SPSS Modeler Text Analytics 16 User's Guide
text link analysis (TLA) (continued)
exploring patterns 147
filtering patterns 149
in text mining modeling nodes 24
macros 210
multistep processing 218
navigating rules and macros 209
rule editor 205
rule processing order 217
simulating results 207, 208
source mode 221
specifying which library 205, 209
TLA node 47
viewing graphs 156
Visualization pane 156
warnings in the tree 209
web graph 156
when to edit 206
where to start 206
text link analysis node 8, 47, 49, 51, 67
caching TLA 51
example 51
expert tab 49
fields tab 47
model tab 49
output 51
restructuring data 51
scripting properties 67
text match 107
text mining 2
text mining model nugget 8
scripting properties for
TMWBModelApplier 66
text mining modeling node 8, 19, 20, 63
example 30
expert tab 27
fields tab 21
generating new node 81
model tab 23
scripting properties for
TextMiningWorkbench 64
updating 82
text separators 80
textlinkanalysis properties 67
TextMiningWorkbench scripting
properties 64
times (nonlinguistic entity) 196
titles 59
TLA 162
TLA concept web graph 156
TMWBModelApplier scripting
properties 66
translate node 8, 55, 56, 57, 69
caching translated text 55, 56, 57
fields tab 56
reusing translated files 57
scripting properties 69
usage example 57
translatenode scripting properties 69
translation label 56
type dictionary 173
adding terms 184
built-in types 182
creating types 183
deleting 187
disabling 187
forcing terms 186
web feed node (continued)
scripting properties 63
web graphs
cluster web graph 154, 155
concept web graph 154, 155
TLA concept web graph 156
type web graph 156
webfeednode properties 63
weights/measures (nonlinguistic)
word gaps 219
workbench 23, 24, 26
type dictionary (continued)
moving 187
optional elements 181
renaming 186
synonyms 181
type frequency 118
type patterns 149
type web graph 156
types 181
adding concepts 93
built-in types 182
creating 183
default color 80, 183
dictionaries 173
extracting 85
filtering 89, 149
finding in the editor 175
type frequency 118
196
U
uncategorized 100
Uncertain type dictionary 182
underlying terms 33
Unknown type dictionary 182
updating
libraries 177, 179
modeling nodes 82
node resources and template
templates 161, 169
upgrading 1
URLs 14, 15
USE_FIRST_SUPPORTED
_LANGUAGE 202
169
V
viewer node 8, 59
example 59
for text mining 59
settings tab 59
viewing
clusters 154, 155
documents 59
libraries 175
text link analysis 156
views in interactive workbench
categories and concepts 71, 99
clusters 74
resource editor 78
text link analysis 76
visualization pane 153
cluster web graph 154, 155
concept web graph 154, 155
Text Link Analysis view 156
TLA concept web graph 156
type web graph 156
W
web feed node 8, 11, 13, 14, 15, 63
content tab 16
example 17
input tab 14
label for caching and reuse 14
records tab 15
Index
233
234
IBM SPSS Modeler Text Analytics 16 User's Guide
Printed in USA