1
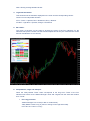
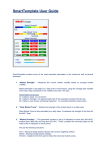
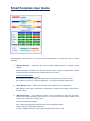
SmartTemplate User Guide SmartTemplate monitors some of the most important parameters in the market as well as several indicators. 1. “Market Strength” – Measures the current market volatility based on average market volatility. Market strength is calculated on a daily and H1 time frames, using the average daily volatility of the last 5 days compared to the volatility of the last 4 H1 bars. Interpretations/examples: 10- market is weak, no movement. 50- market is stronger, it is approximately half of the expected movement for the day. 90- market is very strong, something happened - for example important market news. 2. “Daily Market Trend” – Monitors the strength of the market trend on a daily basis. Daily Market Trend is also calculated on a daily base. It measures the strength of the trend for the last 7 days. 3. “Market Direction” – This parameter monitors a set of 4 indicators for short term (M1-M15), medium term (M30-H4) and long term (D1-W1). “Trend” provides the summary based on the result of the 4 indicators for each period. We use the following indicators: ATCI - Moving average based indicator with custom weighting method. MACD - Moving average based indicator. ATLDiG - Adaptive trend line used to follow the trend and market cycles. AMA - Moving average based indicator. 4. Legend at the bottom This shows the list of indicators displayed on the chart and the corresponding colours: Colours can be interpreted as follow: ATCI – Green = Uptrend, Red = Downtrend, Grey = Neutral. ATLDiG – Light blue = Uptrend, Orange = Downtrend 5. Bar charts: The colour of the bars on the charts is showing the trend of the four indicators, for the selected chart period. Please note that SmartTemplate should only be used with Bar Charts and not Candlesticks or Line Charts) 6. Interpretation, usage and example: When the “Daily Market Trend” value corresponds to the long term “Trend” of the four indicators we wait for a low “Market Strength” value and a signal from the short and medium term “Trend”. For Long positions: “Market Strength” is at 10-20 (in dark or medium blue). “Daily Market Trend” is up (in yellow or orange on the right hand side). In D1-W1 the “Trend” is “Long”. If we have “Trend” Long for M1-M15 and for M30-H4, this might indicate an uptrend in the market. For Short positions “Market Strength” is at 10-20 (in dark or medium blue). “Daily Market Trend” is down (in yellow or orange on the left hand side). In D1-W1 the “Trend” is “Short”. If we have “Trend” Short for M1-M15 and for M30-H4, this might indicate a downtrend in the market. ActivTrades PLC is authorised and regulated by the Financial Services Authority, FSA registration number 434413. This User Guide is for information purposes only and should not be considered as investment advice or an invitation to trade. Although every effort has been made to ensure the accuracy of the information contained in this User Guide, the decision to act on any methods, ideas and suggestions presented is at the sole discretion of user. This User Guide does not take into account your investment objectives, financial situation or needs. Forex, CFDs and futures are leveraged products and carry a high degree of risk to your capital. They are not suited to all investors and you can lose substantially more than your initial investment. Please ensure that you fully understand the risks involved, and seek independent advice if necessary.