1
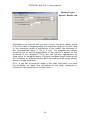
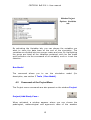
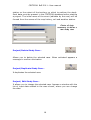
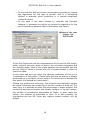
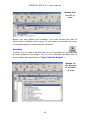
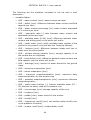
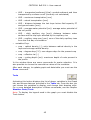
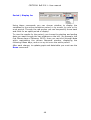
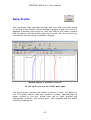
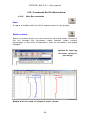
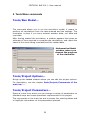
ARPA Emilia-Romagna, Hydrometeorological Service
Agrometeorology Area and Territory
CRITERIA
Test Bench
User manual
By
Francesco Dottori, Arcangela Matera,
and Vittorio Marletto
April 2011
CRITERIA BdP 2011– User manual
Contents
1.
INTRODUCTION
4
2.
FILE MENU COMMANDS
5
FILE/NEW PROJECT... CTRL+N
FILE/OPEN PROJECT... CTRL+O
FILE/DELETE PROJECT...
FILE/IMPORT...
FILE/EXPORT...
FILE/PRINT...
FILE/PRINT PREVIEW…
FILE/EXIT
2.1. THE PRINT PREVIEW WINDOW COMMANDS
2.1.1. FILE MENU COMMANDS
2.1.2. MAIN BAR COMMANDS
5
6
7
7
8
8
9
9
9
9
10
3.
10
EDIT MENU COMMANDS
EDIT/COPY CTRL+C
10
4.
11
DATA MENU COMMANDS
DATA/PROJECT
4.1. COMMANDS OF THE PROJECT WINDOW
4.1.3. RIGHT MOUSE BUTTON COMMANDS ACTIVE ON STUDY CASES
4.1.4. RIGHT MOUSE BUTTON COMMANDS OF THE MAIN BAR
4.2. COMMANDS OF THE PROJECT MENU
DATA/SOILS
4.3. COMMANDS OF THE SOIL WINDOW
4.3.5. WINDOW ACCESSORIES
4.3.5.1. COMMANDS OF THE HORIZONS TAB
4.3.6. MAIN BAR COMMANDS
4.4. COMMANDS OF THE SOIL MENU
DATA/WEATHER DATA
4.5. COMMANDS OF THE WEATHER MENU
4.6. COMMANDS OF THE WEATHER DATA WINDOW
DATA/CROP HISTORIES
4.7. COMMANDS OF THE CROP HISTORY MENU
4.7.7. MAIN BAR COMMANDS
DATA/EXPERIMENTAL DATA
DATA/RESULTS
4.8. COMMANDS OF THE RESULTS MENU
4.9. COMMANDS OF THE MODEL RESULTS WINDOW
4.9.8. MAIN BAR COMMANDS
DATA/PROFILE
4.10. COMMANDS SOIL PROFILES WINDOW
4.10.9. MAIN BAR COMMANDS
2
11
12
12
13
15
20
20
20
22
25
27
29
29
30
35
35
38
41
42
42
42
42
47
48
48
CRITERIA BdP 2011– User manual
5.
TOOLS MENU COMMANDS
50
TOOLS/RUN MODEL…
TOOLS/PROJECT OPTIONS…
TOOLS/PROJECT PARAMETERS...
TOOLS/CROP STANDARDS...
TOOLS/VIEW LOG FILE...
50
50
50
52
53
6.
54
WINDOW MENU COMMANDS
WINDOW/CLOSE ALL
WINDOW/ARRANGE HORIZONTALLY
WINDOW/ARRANGE VERTICALLY
WINDOW/ARRANGE OVERLAY
54
54
54
55
3
CRITERIA BdP 2011– User manual
1. Introduction
This manual is a reference guide for the commands of the program
CRITERIA Test Bench version 2011, made at the Agrometeorology
Area and Hydrometeorological Service Territory of Arpa EmiliaRomagna.
The Test Bench interface differs from the geographical one of Criteria
for the fact of allowing the creation and simulation of individual study
cases essentially composed of a series of weather data, crop history
and a soil. The model and many of the masks are the same in both
versions.
For command descriptions follow the order in which they are
accessible on the menu bar, from left to right, top to bottom. Where
a command opens a new interface, commands associated with it are
described in correspondence to the command itself.
CRITERIA,
made
at
the
Agrometeorology
Area
and
Hydrometeorological Service Territory of Arpa Emilia-Romagna, is the
result of a collective effort that began in the nineties, directed by
Franco Zinoni and Vittorio Marletto. The interface is the work of
Gabriele Antolini, Fausto Tomei, Tomaso Tonelli and the modeling
code is by Gabriele Antolini, Fausto Tomei, Vittorio Marletto, Franco
Zinoni, Giorgio Ducco, Margot Van Soetendael, Luca Criscuolo and
Marco Bittelli.
4
CRITERIA BdP 2011– User manual
2. File Menu Commands
This menu includes commands for creating, opening and registration
of the project settings, set controls and management of printing,
setting of printing and data export. Some of these commands are
used frequently and thus can be performed using special
combinations of buttons and icons.
Note: registration and saving of the project occurs as it is composed,
without a specific command.
File/New Project... Ctrl+N
This command opens a window for naming the new project.
Window for the
creation of a new
project Criteria
The project name should not contain spaces. The inclusion of a name
with spaces entails replacing with the character _ (underscore) by the
program.
All the new project files are placed in a folder that bears its name,
and is also placed in the Projects folder.
The main program window appears after entering the name of the
new project.
5
CRITERIA BdP 2011– User manual
Main window Project
File/Open Project... Ctrl+O
This command opens an existing project. If there is a project already
open then it will be closed automatically when the chosen one is
opened.
Window for opening an
existing project.
6
CRITERIA BdP 2011– User manual
File/Delete Project...
The command is currently non active, if you want to delete a project,
simply delete the folder with that name, located in the folder
"Criteria/Projects".
File/Import...
The command is available only if viewing a weather station. From BdP
version you can import a csv format (comma separated values), with
a header row, which are as follows:
- aa: year
-
mm: month
-
gg: day
-
tmin: minimum temperature
-
tmax: maximum temperature
-
prec: rainfall
-
etp: potential evapotranpiration
-
urel: relative humidity
-
vento: wind
-
rad: global radiation
-
falda: hypodermic groundwater depth
The date-related fields are required.
After the import you will see a preview window in order to verify
whether the data was imported correctly, before proceeding to save it
in the database. Through this window you can also choose to
recalculate the average temperature and the ETP.
7
CRITERIA BdP 2011– User manual
File/Export...
The command is available only after you open or create a new project
and allows the export of the project; it means the set of all cases
contained in it. A window appears where you can choose which
section to save the file and you can also choose which format to save
the file between two options: txt or. htm.
Screenshot for the
import of the set of
all cases contained in
the open project.
File/Print...
This command (and its icon) is available only after you open or create
a new project and allows you to print your project, it means the
8
CRITERIA BdP 2011– User manual
number of cases contained in it. The program will print the current
document belonging to the selected database (project, crop history,
weather data, etc..).
File/Print Preview…
It opens a window where you view the currently active document
(project, crop history, weather data, etc.) through the commands on
(paragraph 2.1) you can choose the layout of the document
Window Print
Preview.
File/Exit
This command closes Criteria.
2.1.
2.1.1.
The Print Preview window commands
File Menu commands
File/Print CTRL+P
Opens the window to start printing where you can choose the printer,
the number of copies and other options normally found in printing
operations.
File/Close Print Preview CTRL+Q
It closes the print preview window.
9
CRITERIA BdP 2011– User manual
2.1.2.
Main Bar commands
The print preview window has a main bar with a series of commands.
Below there is a description of only those present on the bar.
Detail of the main bar
With the Previous and Next commands is possible to view all the
pages that contain information and that can be printed.
With the Zoom command is possible to enlarge the print preview
page.
3. Edit Menu commands
Edit/Copy CTRL+C
This command allows you to copy into another file (*) data contained
in the sheets and documents of CRITERIA. To do this you need to
display the object and select the data you want.
(*) The copy operation is done in the "clipboard" of Windows
10
CRITERIA BdP 2011– User manual
4. Data Menu commands
This menu contains a series of submenus for the managing of
databases necessary to operate the model, such as meteorological,
agronomic and soil data, as well as the results of the model.
Data/Project
The command (also operated by the icon with the same name on the
toolbar of the Project) allows the opening of the window with the
project and the creation on the main bar of a new menu: Project.
A project may consist of one or more cases, that is, combinations of
meteorological, pedological and agronomic data referred to a point in
the territory studied.
Window
with the
toolbar of
the Project
open
In the lower right there is a LED that indicates if the open project has
already been executed (green), or still to be performed (red). In
addition, the button turns red every time changes are made to a
project already executed: in this way it highlights the need to run
again the model to update the results.
Green color indicates that
the project was executed
11
CRITERIA BdP 2011– User manual
4.1. Commands of the Project window
The Project window has a main bar of commands and a series of lines
representing a case. The cases are numbered automatically by the
program in ascending order. Following the structure of a line in the
first column labeled Run, there is a checkbox that allows you to
specify which cases to include or exclude from the simulation. In the
second column - Name - appears the appropriate identification name:
when it is created it will automatically appear the name of weather
data, soil data and agronomic data, and is however still freely
editable by the user (by double clicking the left button).
In the third column - Weather - is the name of the meteorological
data file. In the fourth column - Soil - the name of the type of soil on
which simulation is being performed. In the fifth column, Crop
History, is the name of the agronomic data file.
By positioning on the columns and clicking the right button of the
mouse, you access the database or the column you are placed on.
This procedure will be described below.
4.1.3.
Right mouse button commands active on Study Cases
Right Button/Edit Study Case...
Opens a window where you can change the study case, described in
Project/Edit Study Case…
Right Button/Options of Study Case…
Opens a window where you can view and edit the options of the study
case, described in Project/Options of Study Case…
- Column Name/Right Button/Open…
Opens the Results window, described in the .Data/Results….. from
which you access on the results database of the simulation model.
- Column Weather/Right Button/Open
Opens the Weather Data window, described in Data/Weather…
from which you access the weather data database of the simulation
model.
12
CRITERIA BdP 2011– User manual
- Column Soil/Right Button/Open
Opens the description of soil window, described in Data/Soils… from
which you access the pedological data database of the simulation
model.
- Column Crop History/Right Button/Open
Opens the Crop History window, described in Data/Crop Histories…
from which you access the agronomic data database of the simulation
model.
4.1.4.
Right mouse button commands of the Main Bar
Below we will describe the commands that are not present in the
menus.
Project Options
Opens a tabbed window where you can edit the project options. In
the window there are three separate tabs, as described below
Window Project Options:
Processes Tab
On the Processes tab you can choose which processes you want to
simulate in modeling. Some processes (precipitation, evaporation,
transpiration, crop) are essential to achieve meaningful results and
therefore should never be excluded, while others may be included in
cases where they are considered influential on the results, or if you
intend to obtain a desired behavior of the model (for example, the
form of automatic watering).
13
CRITERIA BdP 2011– User manual
Window Project
Options: Results tab
Highlighting the Results tab, you can choose: the print range, which
is the scan rate of outgoing data, the maximum depth of the soil, that
is, the maximum depth of application of the model, the thickness of
the computational layer (1 cm or 2 cm). The program also allows
choosing how to set the aggregation of the results in output for the
thickness of soil assigned. There are two options: aggregation by
fixed layers or variables layers. Choosing variables layers must be set
the thickness of different layers while by setting fixed layers simply
assign a single thickness.
Note: If you set a maximum depth of soil than that which you have
the available soil data, the simulation of the layer remaining is
resolved in the repetition of the last layer.
14
CRITERIA BdP 2011– User manual
Window Project
Options: Variables
tab
By activating the Variables tab, you can choose the variables you
want to store the data base at the end of the simulation. The
variables are divided into two groups: water and crop. By highlighting
the group are listed all the variables contained, and you can make
quick selection via the commands of all variables, none or invert the
selection.
Run Model
The command allows you to run the simulation
description, see section 5 Tools / Run Model)
model
(for
4.2. Commands of the Project Menu
The Project menu commands are also present on the window Project
Project/Add Study Case…
When activated, a window appears where you can choose the
pedological, meteorological and agronomic data of the weather
15
CRITERIA BdP 2011– User manual
station on the extent of the territory on which to perform the study.
Such data must be present in the CRITERIA database before starting
a project. The initial name of the event (editable by the user) will be
formed from the names of the crop history, soil and weather station.
Choice of data
necessary to define a
new study case
Project/Delete Study Case…
Allows you to delete the selected case. When activated appears a
message to confirm elimination.
Project/Duplicate Study Case…
It duplicates the selected case.
Project/ Edit Study Case…
It allows you to change the selected case. Appears a window with the
list of input data related to the case shown, where you can change
the data.
16
CRITERIA BdP 2011– User manual
Editing required data of
an existing study case
Project/Study Case options…
It allows you to choose options of Case Study. A tabbed window
appears where you can change a number of parameters relating to
the study case selected.
Window of the case
option: Algorithms
tab
In the Algorithms tab you can choose from among those available in
the program, the algorithms for the estimation of some variables:
•
potential evapotranspiration: you can choose the formulas of
Hargreaves, Priestley and Taylor, or Penman and Monteith
•
retention curves: you can choose from that of Campbell or that
of van Genuchten, and also you can choose whether to draw
the water retention curves, take into account laboratory data
entered in the database of soil data, in the sub tab of Data on
the Horizons tab.
17
CRITERIA BdP 2011– User manual
•
In the case the Wofost process is activated is possible to choose
the algorithms for the type of growth, that is if simulating
Wofost in potential grow conditions or in growth conditions
limited by water.
•
In the case it has been chosen to simulate the nitrogen
balance, it activates the option to choose the algorithm for the
soil temperature between that of Robertson and Parton.
Window of the case
options: tab
Soil/Profile
In the Soil/Profile tab are set characteristics of the plot as the length,
width, slope of the plot, depth of drains, the minimum roughness and
the working angle, that is, the angle between the horizontal and the
groove. Next to items is shown the unit of measurement in which to
insert the data.
In the same tab you can enter the starting conditions of the soil in
"Initialization of the profile." Please note that the simulation is always
performed on a soil depth of two meters. The thickness is divided into
two parts: the worked soil and subsoil.
Putting the worked soil thickness, the program automatically assigns
as subsoil thickness the remaining of the two meters of total soil. For
each layer it is possible to place the percentage of water present, the
content of ammonia nitrogen and nitrate nitrogen in kg per hectare,
the content of phosphorus assimilable by Olsen, in ppm, parts per
million, the content of pesticides in ppm. It is also possible, by
highlighting the box SO, insert any organic matter content, in% by
weight
18
CRITERIA BdP 2011– User manual
In this tab there is the option to reload from groundwater, which
leads to soil field capacity on a given day of the year set in the same
option.
Window case
options: Infiltration
tab
In the infiltration tab you can choose how to happen infiltration:
according to the semi-empirical model by layer, or as 1D numerical
model. If you want to use this last one you must also choose the type
of infiltration on the surface to be simulated, according to Dunne
Horton, and set the other calculation parameters that, in case of
infiltration by layer cannot be changed
The model 1D takes into reference the retention curve of van
Genuchten, and the program will automatically select it even if curve
of Campbell has been chosen.
19
CRITERIA BdP 2011– User manual
Data/Soils
With the activation of the command (Data menu or by using the icon
on the main bar) displays a window and a menu of commands both
named Soil.
Window highlighting the window with soil data access and the window
Project in the background
The window allows the access to the soil data database, from which
to do the viewing end editing operation.
4.3. Commands of the Soil window
4.3.5.
Window accessories
20
CRITERIA BdP 2011– User manual
The Soil Data window has two columns and four tabs: Horizons,
Tensiometric Curve, Layers and Description.
Window highlighting the tabs and the two columns
The left column presents the USDA textural classification triangle.
Each layer in the soil profile is colored according to the textural class
of belonging while in the USDA triangle is placed a red circle
representing the layer. In the upper right of the triangle you can see
the percentages of clay, silt and sand of the points of the USDA
triangle indicated by the mouse pointer.
Under the USDA textural triangle is shown information obtained from
the textural class, such as field capacity and wilting point.
The narrower column positioned to the right, represents the layers,
and is divided according to the number of layers forming the ground,
takes on the color of the layer it represents. By positioning on a piece
in which the column is divided it highlights the information layer it
represents.
The Horizons tab
It contains all information related to the layers forming a soil.
21
CRITERIA BdP 2011– User manual
Detail of the window Soil Data activating the command Horizons
The Horizons tab, as shown in the figure above, is divided into two
parts. The upper part is manageable by the user and there are
commands to create or modify a soil. The lower part is run only by
the program, and there are all collected data on soil, both those
placed above by the user and those derived from the program, and
necessary for the simulation. In particular, if the data entered by the
user is not consistently held by the program, it will show it at the
bottom of the figure, colored coral pink, as you can see from the
picture above.
4.3.5.1.
Commands of the Horizons tab
Horizon +
By activating Horizon + a new line appears in both the top and
bottom, which represents the layer that you are creating. The line is
divided into columns representing the different soil characteristics, for
example the first two columns allow you to enter the depth,
compared to ground level, upper and lower layer. Other information
to be included in the other columns and necessary for the
characterization of a soil are:
− Percentages of clay, silt and sand,
22
CRITERIA BdP 2011– User manual
− Content of organic matter;
− pH;
− BD, bulk density;
− K Sat, hydraulic conductivity at saturation;
− Total lime;
− Active lime;
− CSC,
As you enter data textural columns are colored red and at the end of
the correct data entry, they assume the color of the textural class of
belonging.
Horizon X
Delete the line/layer selected.
Data
By activating the command displays a window where you can enter
and display laboratory data on tensiometric curve of a layer, each
layer/line thus has a related Data tab.
Horizons tab with the particular tab Data – Layer 1
23
CRITERIA BdP 2011– User manual
Horizons tab with the particular tab Data – Layer 5
Data +
It allows you to insert a new data item/line in the Data tab. The
command is active only if you are in the process of editing, that is,
after activating the command Edit On/Off
Data X
It allows you to eliminate a data item/line in the Data tab. Also this
command is active only if you are in the process of editing, that is,
after activating the command Edit On/Off.
Tensiometric Curve tab
From Tensiometric Curves tab is possible to view the tensiometric
curves associated to the layers, in equal number to that of the layers.
The curves are colored fuchsia when the layer to which they are
associated is highlighted.
Layers tab
Layers tab contains information relating to the computational layers.
Each soil layer is divided into computational layers of the same size
or different. The greatness of a computational layer is inserted
through the Results tab in the Options project, under "aggregation
of the output layers" (described in the relevant section).
Description tab
24
CRITERIA BdP 2011– User manual
In the Description tab, you can better characterize the soil, to allow
its immediate identification. In the tab you can enter the date on
which the soil was created, location, family and other useful
information.
4.3.6.
Main Bar commands
Soil
Allows you to open a window with the list of available soils, previously
entered, where you can choose the one you want to work on.
Window for the choice of soils
Edit On/Off
The command allows the start and end of all editing operations. For
an example of these operations see section Soil/New Soil...
When activating the command become active other commands
specifically designed to change operations or creation of new
information.
Window Retention Curves
25
CRITERIA BdP 2011– User manual
In this window you can choose the retention curve to be used for the
soil that you are viewing. The retention curves available are two: van
Genuchten and Campbell.
Use
laboratory
available
data
if
Checking this box the program interpolates the available laboratory
data to derive the tensiometric curves of the soil in question
(according to the formula chosen for the curve). The figure below
shows you the tab with the graph of the tensiometric curves obtained
from laboratory data. If you do not select this option, or there are no
laboratory data, the curves are estimated according to the textural
classes of each layer.
Window with the detail of the Curves tab
Note: The choice of the tensiometric curve and of the laboratory data
in the model calculations are not carried out in this menu, but in the
Options Case/Algorithms menu. The controls on the Data/Soils
menu serve merely to view the curves and the data available.
26
CRITERIA BdP 2011– User manual
4.4. Commands of the Soil Menu
As already mentioned, the opening of the Data/Soil… menu, causes
the appearance of a new menu called Soil, in the main bar of
Criteria.
Soil/New Soil…
The command allows you to create a new soil. Activation of the
command displays a window where you can name the new soil, and
then a window where you can enter all necessary data.
Window for entering data for the new soil
A soil is composed of layers with different characteristics, both in
terms of both soil and in terms hydraulic point of view. Through the
Edit On/Off command, present on the main bar, is possible to create
every single layer, represented by a line in the database. At the
activation of the command become active other two commands in the
tab Horizons: Horizon + and Horizon X.
After entering all the data for the layers that constitute the ground, it
activates once again the Edit On/Off command that lets you close
27
CRITERIA BdP 2011– User manual
the editing phase. Before closing, a confirmation message appears to
save the changes on the layers.
Note: the composition of a layer can be determined by inserting the
percentages of sand, silt and clay in the corresponding line, or
alternatively by moving the symbol that identifies it in the textural
classes triangle until the desired "point".
Soil/Delete Soil…
It allows you to remove the soil that you are viewing. When
activated, a confirmation message appears.
28
CRITERIA BdP 2011– User manual
Data/Weather Data
The window called Weather Data can be opened from the menu or
icon located on the main bar. Simultaneously with its opening
appears the new menu Weather in the main bar.
The window allows the management of the weather database of the
project, and displaying the list of weather stations/points of the
territory.
4.5. Commands of the Weather Menu
Weather/New Weather Station…
It allows the creation of a new weather station, which in the case of
Criteria BdP represents a point of the territory in which you want to
simulate.
A window appears in which to insert the name of the weather
station/point of the territory.
Window for entering the
name of a new Weather
station
After entering the name the Weather Data window appears with blank
tabs Graph, Data and Description. The compilation of the Data
table can be initiated and completed by activating and disabling the
Edit On/Off command. At the end of the compilation of the table
and after activating the Edit On/Off command a confirmation
message appears.
29
CRITERIA BdP 2011– User manual
Window Weather Data of a new station
Weather/Delete Weather Station…
The command allows you to delete from the project the selected
weather station/simulation point and meteorological data associated
with it. After activating it a confirmation message to delete data
appears.
Weather/Draw
The daily or cumulative values can be displayed through graphs and
tables. The command allows you to draw or update the graphs and
tables of selected variables.
4.6. Commands of the Weather Data window
The Meteorological Data window has a main bar and three command
tabs: Graph, Data and Description. From the Graph tab the available
weather data can be viewed as graphs, from the Data tab is accessed
to numeric values of reference, while the Description tab allows you
to post notes concerning the station/point of the territory and its data
30
CRITERIA BdP 2011– User manual
Please note that the program allows you to the view weather data
related to a single station/point, the one selected by using the
command Stations..
Graph
tab
Stations
Through the icon Stations you can access to the list of weather
stations/points of the territory from which you want to display data.
Variables
The icon opens a window where you can select the variables of which
you want to know the data and relevant graphs.
The following are variables in the list along with a brief description
o Minimum – maximum – average temperature [°C]
o Rainfall [mm]
o ETP [mm]: value of daily potential evapotranspiration reported
in the weather data
o Hydro – climatic balance [mm]: difference between rainfall and
daily evapotranspiration
31
CRITERIA BdP 2011– User manual
o Thermal summation threshold 0 – 5 – 10 [°C]: daily thermal
sum based on the threshold.
o Temperature range [°C]: difference between maximum and
minimum temperature
o Groundwater [cm]: depth of the water at ground level
After choosing the variables of interest, singularly or by commands
that allow you to select all or none variable, you should ask the
program to do the Draw operation directly from the main bar. If you
do not ask the program to draw variables, you do not get the
updating of the required data both in the graph and in the data table.
From the window variable you can also choose to display the
cumulative values and set some default variables.
To view the cumulative values of the variables, after choosing the
type of variable through the activation of the Variables command of
the main bar, you must activate the Draw command.
Tools
Activating this button displays the list of variables drawn in the
Graph tab, and whose data are provided in the Data tab. From the
bar you can choose the variables to display, and change their drawing
style.
Window with the list of variables in the
graph. To each one is listed the drawing style
and the color
For each variable there are (from left to right): an icon that indicates
the type of graph used for the representation (line, histogram, area,
etc.), a box to delete/insert the variable in the graph, the indication
of color used, and the variable name.
32
CRITERIA BdP 2011– User manual
Selecting the icon of the graph type with the left button, appears a
menu from which you can change the style of representation of the
variable. Depending on the type of variable, you can select only
certain styles of graph from those present.
Menu for choosing the
graph type to use for
the selected variables.
The icons of the styles
not usable are displayed
in gray
By selecting with the left button the icon color appears a menu from
which you can change the colors used for the variable.
Menu for the choice of colors to
be used for the selected variable.
Note: To display the legend used in the graph you must disable the
Tools button.
33
CRITERIA BdP 2011– User manual
Edit On/Off
The command must be activated before and after changing weather
data. The editing operations are concluded by reactivating the Edit
On/Off command, followed by a confirmation message for the
registration of operations carried out in memory.
Period and Display for
Using these commands you can choose whether to display the
variables for the entire simulation period, or by month, year or for a
set period. Through the red arrows you can temporarily move back
and forth an equal period of display.
To view the results for the period, you choose the starting and the
ending date you want by the two windows on the left, (for example,
the first fifteen days of February 2005), then you can scroll through
data while maintaining the chosen temporal window, displaying the
next fifteen days, and so on up to cover the entire period.
34
CRITERIA BdP 2011– User manual
Data/Crop Histories
This command allows the opening of the interface window of the
agronomic data database and the creation of a new menu (Crop
History) in the main bar. The command also works using the icon on
the main bar of the project.
Window access
to the database
of Crop
information
(below)
Through this window you can see all the crops present within the
project and associated with different cases, or create new crop
conductions.
4.7. Commands of the Crop History Menu
Crop History/New History…
Is the only active command of the menu at the opening of the data
base agronomic data. Selecting it opens a window for entering the
name of the crop history you want to create.
Crop History/Delete History...
The command allows the elimination of a crop history and is active
only if you are viewing the history, that is, if you have selected the
history from the list through the History command, which will be
described below. When activated, a confirmation message appears
where you can choose whether to delete the selected crop history.
Crop History/Add Standard Crop...
35
CRITERIA BdP 2011– User manual
The command is active only after selecting editing operations by the
Edit On/Off command present in the main bar.
The command is similar to that in the Main bar and will be described
later.
Crop History/Add Event...
The command is active only after unlocking the editing operations
through the command in charge, Edit On/Off present in the main
bar. Allows you to add an event to the crop history that you are
viewing
When activated, the crop history is enriched by the event,
represented by a new line divided in the columns Date, Category,
Type, units (measurement unit), Quantity, Depth, and notes.
Window with the crop history and the event added
By selecting the Category box shows the list of the different
categories implemented in CRITERIA: crop, crop operations, working,
irrigation, fertilization, and pesticide treatments.
36
CRITERIA BdP 2011– User manual
Window with the crop history highlighting the list of categories
For each category there are different types of events, selected from
the window Type. Depending on category and type of event are
activated other columns of the line/event. The following is a list of
event types for the category Irrigation.
Window with the list of event types of the category Irrigations
The column measurement units (udm) shows in which unit of
measurement you should enter the amount of irrigation. In the
column notes, always active regardless of the category and type of
event, you can enter additional information characterizing the event.
After entering one or more events, to be able to return to the main
window of the project you have to activate the command present in
the main bar Edit On/Off, described below.
37
CRITERIA BdP 2011– User manual
Crop History/Delete Event...
The command is active only after unlocking editing operations from
the Edit On/Off command (described later). It allows deleting the
selected event/line of the crop that you are viewing. After you have
enabled the operation, you must disable the Edit On/Off command
to close the editing operations.
4.7.7.
Main Bar commands
History
When activated, shows the list of crop histories in the project.
Window with
the list of
crop histories
Edit On/Off
The command must be activated before and after editing. Following
its activation is made active a series of commands that allow you to
enter or edit a crop history, such as commands that allow you to
enter a new history or an event.
38
CRITERIA BdP 2011– User manual
The editing operations are concluded by reactivating the Edit On/Off
command, followed by a confirmation message for the registration in
the memory of operations carried out.
Add crop...
The command opens a window from which you can choose a
predefined set of crops to be added to a crop history.
Choice of a default crop (sunflower).
From this window you can choose the crop, whereby become
available the choice of the working period of the crop and the sowing,
and the class of earliness.
The data concerning the various stages of working and fertilizer
cannot be edited from this window, (the changes should be entered
on the menu Tools/Standard Crops ...). If for a project appears as
temporal data the value -999, it means that the operation is not
defined for the crop.
After the choice of crop you must specify the period during which
simulate the crop (by selecting the initial and final years), and then
insert the crop in the table on the right side of using the Add button.
39
CRITERIA BdP 2011– User manual
Selection of crop period
By selecting Ok, the events associated with crop will be aggregated
to the main crop history.
Inclusion of events associated with the sunflower crop to the existing
crop history.
If you enter periods during which other crops are already present, a
message reports the problem, because it is not possible to create two
crops growing simultaneously in the crop histories model.
40
CRITERIA BdP 2011– User manual
Error message in case of overlap
or the growth period in the same
crop history.
Data/Experimental Data
Note: this menu is not yet working in the current version of CRITERIA
BdP
The command opens the management and import window of
experimental surveys of water content and nitrogen content of soils in
the project. Also appears Experiment menu on the main bar of the
project. The window can be opened via the Surveys icon, always on
the main bar of the project.
Window management of experimental profiles of a soil
41
CRITERIA BdP 2011– User manual
Data/Results
The command allows you to view the results of the model using
graphs and tables.
Its activation (also possible from the icon on the main bar) causes the
opening of the window Results Model and the creation of the menu
Results on the bar of the project. Through the window you can see
the trend of the output variables of the simulation carried out. The
window has a command bar, a menu of commands and two tabs:
Graph and Tables. Graph tab shows a graphical representation of the
chosen variable, while in the Tables tab, you can see all the numerical
values shown in the graph.
Window of results of the
model
4.8. Commands of the Results Menu
Results/Draw
The command allows you to create or update windows Graph and
Tables with the variables and the time period selected.
4.9. Commands of the Model Results window
4.9.8.
Main Bar commands
Cases
It opens a window with the list of simulation cases in the project.
42
CRITERIA BdP 2011– User manual
Window with
the list of
cases
Before you can display the variables, you must choose the case to
which these variables must report. If you have not selected any case,
a message appears requesting the selection.
Variables
It allows you to open a window with a list of variables to be displayed
through graphics and tables. Can only be selected variables set on
the Variables tab described in Tools/Options Project ....
Window for
the selection
of variables
to draw
43
CRITERIA BdP 2011– User manual
The following are the variables contained in the list with a brief
description:
o variables Water:
•
H2O – water content [mm]: water content per layer
•
H2O – deficit [mm]: difference between water content and field
capacity per layer
•
H2O – water content percentage [%]: water content expressed
in % volume per layer
•
H2O – saturation ratio [-]:ratio between water content and
saturated content per layer
•
H2O – available water (U-PA) [mm]: difference between water
content and wilting point on the entire soil profile
•
H2O – useful water [mm]: easily available water content of the
profile for the present crop (see also the Technical Manual)
•
H2O – balance [mm]: difference between intake and loss of
water over the entire profile
•
H2O – surface storage capacity [mm]: storage capacity in on
the surface due to roughness
•
H2O – total deficit [mm]: difference between water content and
field capacity over the entire soil profile
•
H2O – drainage [mm]: amount of water drained to the ground
water
•
H2O – maximum evaporation [mm]
•
H2O – actual evaporation [mm]
•
H2O – maximum evapotranspiration [mm]: maximum daily
evapotranspiration for the present crop
•
H2O – potential evapotranspiration [mm]: maximum reference
evapotranspiration
•
H2O – useful water fraction [-]: fraction available water (CC –
PA) that can be easily used by the present crop
•
H2O – crop storage [mm]: storage capacity of the crop
•
H2O – irrigation [mm]
•
H2O – puddle [mm]: water stored on the surface
•
H2O – rainfall [mm]
•
H2O – hypodermic runoff [mm]: sub surface water runoff (only
in the presence of drains)
•
H2O – surface runoff [mm]: surface water runoff
44
CRITERIA BdP 2011– User manual
•
H2O – transported sediment [t/ha]: eroded sediment and then
transported by surface runoff (currently not calculated)
•
H2O – maximum transpiration [mm]
•
H2O – actual transpiration [mm]
•
H2O – distance between the last layer below field capacity FC
and ground water [mm]
•
H2O – average water potential [cm]: average water potential of
the soil profile
•
H2O – daily capillary rise [mm]: distance between water
surface and the top layer affected by the capillary rise
•
H2O – capillary rises sum [mm]: sum of the daily capillary rises
from the first day of simulation
o variables Crop:
•
crop – radical density [-]: ratio between radical density in the
layer and average radical density
•
crop – degree days [°C]: sum degree days for the present crop
•
crop – effective Lai [-]
•
crop – rooting depth [cm]: maximum depth of roots present in
the profile
In the window there are some commands for easier selection. It is
also possible to choose the cumulative values of the variables.
After each change, to update graph and data table you must use the
Draw command.
Tools
Activating this button displays the list of drawn variables in the Graph
tab, and whose data are provided in the Table tab. From the bar you
can choose the variables to display, and change their drawing style.
For a more detailed description of these commands, see the chapter
Weather Data/Tools.
Note: To display the legend used in the graph you must disable the
Tools button.
45
CRITERIA BdP 2011– User manual
Period / Display for
Using these commands you can choose whether to display the
variables for the entire simulation period, or by month, by year or for
a set period. Through the red arrows you can temporarily move back
and forth for an equal period of display.
To view the results for the period, you choose the starting and ending
date you want through the two windows on the left, (for example, the
first fifteen days of February 2005), then you can scroll through data
while maintaining the chosen temporal window, displaying the
following fifteen days, and so on up to cover the entire period.
After each change, to update graph and data table you must use the
Draw command.
46
CRITERIA BdP 2011– User manual
Data/Profile
The command (also operated through the icon with the same name
on the bar of the Project) allows access to graphs in the soil profile. It
appears a window from which to view the trend in soil water content
and the deficit, and the profile menu on the main bar, from which you
can directly choose which variables to display.
Window display of profiles in the soil
At the top we can see the Profile menu open
The trend water content with depth is shown in blue, the deficit in
red. The graph shows other four profiles in black, representing the
water content in the soil. Going from left to right, profiles are
hygroscopic moisture, the wilting point, field capacity and the water
content at saturation.
47
CRITERIA BdP 2011– User manual
4.10. Commands Soil Profiles window
4.10.9.
Main Bar commands
Case
It opens a window with the list of cases present in the project.
Water content
Opens a window where you can choose to have the water content in
the soil through the volumetric water content, water content
percentage or the ratio of saturation, after its activation, the graph
changes.
Window for selecting
the water content in
percentage
Window with the trend of volumetric water content
48
CRITERIA BdP 2011– User manual
Time Commands
You can view the trends of soil water content in the daily temporal
scanning. The commands in figure allow moving along the time frame
in which you have results. The First and Last commands allow
visualization of the water content profile of the first and last days of
simulation. Commands -10, -1 and +10, +1 allow you to move, back
and forth, respectively, of 10 days or of one day than the one
displayed. However from the list of the Day box is possible to access
a specific day of interest.
Movie and Speed
Through this command you can view the progress of the water
content in soil over time as a movie, that is a continuous sequence of
developments. The trend starts from the day set in the window Day
and continues, unless interrupted, until the last day of simulation.
Sequence stops by reactivating the command during the sequence.
Through the command Speed you can adjust the speed at which you
want to show trend.
49
CRITERIA BdP 2011– User manual
5. Tools Menu commands
Tools/Run Model…
The command allows you to run the simulation model; it means to
perform all calculations from the data entered and the settings. The
simulation is done if you have entered weather data, soil data and
crop data.
After having started the simulation, a window appears that gives an
estimate of time required to complete the calculations, and report the
name of the event being simulated and the related data.
Mathematical Model
window, where you
observe the progress
of the simulation.
Tools/Project Options…
Brings up the tabbed window where you can edit the project options.
For description, see the chapter Data/Project/Commands of the
main bar ....
Tools/Project Parameters...
Opens a menu from which you can change a variety of parameters on
standard crops and crops operations implemented in the project.
The commands on the main bar are to access the existing tables and
to highlight information on the parameters selected.
50
CRITERIA BdP 2011– User manual
Main bar of the window Project Parameters.
Groups menu
This menu allows you to view one of the four tables in which are
organized the default parameters on crops and crops operations.
Table of parameters implemented by CRITERIA in the standard crops
By selecting any item in the table, on the main bar appear: The
default value, the interval of values within which the parameter can
vary, a brief description of the meaning of the parameter within the
model.
Modified items on the table are highlighted in yellow. If necessary,
you can set back the initial value of a parameter, pressing the default
button on the main bar.
The modified values can be saved by changing the table from the
Groups menu, or by closing the Project Parameters window. In both
cases a message appears asking if you want to save your changes.
51
CRITERIA BdP 2011– User manual
The request window
allows you to save
your changes
Tools/Crop Standards...
It opens the window interface of the database of information about
crop histories.
Window interface to
database of the
characteristics of a crop
From the window you can define a standard crop, the type of work,
the class of the earliness, the type of seeding, fertilizing etc. For
every choice and every operation must match the specific day,
expressed in relative terms (e.g., days from sowing, day of the
year);Other optional information concern the water volume, the
52
CRITERIA BdP 2011– User manual
quantities of fertilizer used during the various phases and the total
quantities of nitrogen and phosphorus to be supplied. The interface
also lets you change the default information already present.
The image here presented shows the sunflower crop, with an
autumnal work, medium earliness class and medium sowing, to which
correspond a certain number of days for each processing phase.
The defined crop standards are used when selecting a crop to fit into
a crop history (Agronomic Data menu, Add Crop command) in a
specific year, at this point the related days associated with various
crop operations materialize in actual dates, however, editable by the
user.
Tools/View Log File...
It opens the text file containing information about simulation. The file
contains the date and time of simulation start, a list of various data of
the working point and any failures or errors found during the
simulations.
Detail of Log file
53
CRITERIA BdP 2011– User manual
6. Window Menu commands
Opening windows of various interfaces of the data base and of the
project, under the Window menu shows the list of the various
elements.
Window/Close All
It closes all windows except the one of the project.
Window/Arrange Horizontally
It allows arranging the data base windows horizontally.
Image showing the windows horizontally
Window/Arrange Vertically
It allows arranging the data base windows vertically.
54
CRITERIA BdP 2011– User manual
Image showing the windows vertically
Window/Arrange Overlay
It allows overlaying the windows of the data base.
Image showing overlaid windows
55