1
Landis + Gyr EDC-S
User Manual
Software version: 3.5
Doc. number:
Responsible:
Doc. release:
Doc. administration:
EDC-S V3.5 1004 en
MS/JM - 675
September 2004
+420 251 119 551
Quality and
environmental
approval
ISO/EN 9001
ISO/EN 14001
Copying of this document, and giving it to others and the
use or communication of the contents thereof, are
forbidden without express authority. Offenders are liable to
the payment of damages. All rights are reserved in the
event of grant of a patent or the registration of a utility
model or design.
Copyright reserved
Revision History
Revision
Date
Description
September
2004
First release
a
b
c
d
e
f
Landis+Gyr
EDC-S V3.5 1004 en
EDC-S User Manual
Revision History
I
II
EDC-S User Manual
Revision History
Landis+Gyr
EDC-S V3.5 1004 en
Table of Contents
1
1.1
1.2
Safety aspects...................................................................................................1-1
Landis + Gyr EDC-S ...........................................................................................1-1
User manual........................................................................................................1-2
2
2.1
2.2
2.3
2.4
Before you start ................................................................................................2-1
Overview .............................................................................................................2-1
System requirements ..........................................................................................2-2
Components........................................................................................................2-2
Installation...........................................................................................................2-3
2.4.1
Defining the working directory ...............................................................2-3
2.4.2
Activating the licence.............................................................................2-4
2.4.3
Selecting the menu language ................................................................2-5
2.4.4
Directories .............................................................................................2-6
2.4.5
General system parameters ..................................................................2-7
Importing archived data and examples .............................................................2-10
2.5.1
Set archive data path...........................................................................2-10
2.5.2
Import archived sample data ...............................................................2-11
2.5
3
3.1
3.2
3.3
3.4
4
4.1
4.2
4.3
4.4
4.5
4.6
4.7
Landis+Gyr
EDC-S V3.5 1004 en
Quick start .........................................................................................................3-1
Remote acquisition .............................................................................................3-1
3.1.1
Step 1: Definition of the communication line .........................................3-1
3.1.2
Step 2 : RTU definition ..........................................................................3-2
3.1.3
Step 3: Remote acquisition....................................................................3-3
3.1.4
Step 4 : Checking the metering values..................................................3-4
Read-out via the optical interface .......................................................................3-5
3.2.1
Step 1: Reading out a meter..................................................................3-5
3.2.2
Step 2: Importing the data .....................................................................3-6
3.2.3
Step 3 : Checking the metering values..................................................3-7
Data acquisition from hand-held terminals..........................................................3-7
3.3.1
Step 1: Copying the read-out route .......................................................3-7
3.3.2
Step 2: Importing the data .....................................................................3-8
3.3.3
Step 3 : Checking the metering values..................................................3-9
Analysing the metering data ...............................................................................3-9
3.4.1
Step 1: Displaying and printing 15-minute values ...............................3-10
3.4.2
Step 2: Displaying, printing and exporting load curves........................3-11
Remote acquisition...........................................................................................4-1
Remote acquisition process................................................................................4-1
The modem.........................................................................................................4-2
4.2.1
Siemens FKJ 11.1 .................................................................................4-2
4.2.2
Using Hyper Terminal............................................................................4-3
Definition of communication lines .......................................................................4-4
Definition of RTU’s ..............................................................................................4-6
Manual remote acquisition ................................................................................4-13
Automatic Acquisition........................................................................................4-15
4.6.1
Acquisition lists ....................................................................................4-15
4.6.2
Definition of automatic operation .........................................................4-16
4.6.3
Starting automatic acquisition..............................................................4-17
Service Functions .............................................................................................4-18
4.7.1
Error acquisition list .............................................................................4-18
4.7.2
Monitoring functions ............................................................................4-19
4.7.3
Recording the communication .............................................................4-19
4.7.4
Communication statistics.....................................................................4-21
EDC-S User Manual
Table of Contents
III
4.8
Rigi Solar Station.............................................................................................. 4-21
5
5.1
5.2
5.3
5.4
5.5
5.6
Optical read-out................................................................................................ 5-1
Optical acquisition process................................................................................. 5-1
Definition of decoding sets ................................................................................. 5-1
Definition of the communication interface .......................................................... 5-1
RTU definitions................................................................................................... 5-1
Data acquisition.................................................................................................. 5-2
Data import......................................................................................................... 5-3
5.6.1
Assigning devices to RTU’s .................................................................. 5-4
6
6.1
6.2
Data import ....................................................................................................... 6-1
Data import procedure........................................................................................ 6-1
Data import from hand-held terminals ................................................................ 6-2
6.2.1
Assignment of devices to RTU’s ........................................................... 6-3
Files from Landis + Gyr central stations ............................................................. 6-4
6.3.1
Assignment of files to RTU’s................................................................. 6-5
6.3
7
7.1
7.2
8
8.1
8.2
8.3
8.4
8.5
8.6
8.7
8.8
9
9.1
9.2
IV
Data export........................................................................................................ 7-1
Exporting load profile data.................................................................................. 7-1
7.1.1
Text format............................................................................................ 7-2
7.1.2
LG format .............................................................................................. 7-4
7.1.3
Manual export ....................................................................................... 7-5
7.1.4
Automatic export ................................................................................... 7-6
Exporting billing data .......................................................................................... 7-8
Data analysis .................................................................................................... 8-1
System definitions .............................................................................................. 8-3
8.1.1
Status display........................................................................................ 8-3
8.1.2
Integrating period .................................................................................. 8-4
8.1.3
Identification code key .......................................................................... 8-4
Definition of projects........................................................................................... 8-6
8.2.1
Basic operations ................................................................................. 8-10
8.2.2
Comparative operators ....................................................................... 8-11
8.2.3
Active and reactive calculations.......................................................... 8-12
Definition of tariffs............................................................................................. 8-13
8.3.1
Tariff variants... ................................................................................... 8-14
8.3.2
Tariff agreements................................................................................ 8-15
8.3.3
Holidays... ........................................................................................... 8-16
8.3.4
Special days........................................................................................ 8-16
Definition of reports .......................................................................................... 8-17
8.4.1
Definition of fields................................................................................ 8-19
Numerical analysis ........................................................................................... 8-21
8.5.1
Display report...................................................................................... 8-23
8.5.2
Show demand values.......................................................................... 8-23
8.5.3
Contribution to maximum .................................................................... 8-24
8.5.4
Billing values ....................................................................................... 8-25
Graphic analysis............................................................................................... 8-27
8.6.1
Curve types......................................................................................... 8-29
8.6.2
The graphic window ............................................................................ 8-31
Histograms ....................................................................................................... 8-33
Analysing spontaneous events......................................................................... 8-35
Synthetic load profile....................................................................................... 9-1
Purpose .............................................................................................................. 9-1
Synthetic load profile definitions......................................................................... 9-1
9.2.1
Day definition ........................................................................................ 9-2
EDC-S User Manual
Table of Contents
Landis+Gyr
EDC-S V3.5 1004 en
9.3
10
10.1
Landis+Gyr
EDC-S V3.5 1004 en
9.2.2
Week definition ......................................................................................9-3
9.2.3
Year definition........................................................................................9-4
9.2.4
Calculation definition .............................................................................9-5
9.2.5
Calculation list definition ........................................................................9-6
Synthetic load profile calculation.........................................................................9-7
10.2
System administration ...................................................................................10-1
The archiving system ........................................................................................10-1
10.1.1 Archiving metering values ...................................................................10-2
10.1.2 Archiving definitions.............................................................................10-3
10.1.3 Archiving projects and reports .............................................................10-4
10.1.4 Deleting archived files .........................................................................10-5
10.1.5 Billing data maintenance .....................................................................10-5
Editing periodic buffers .....................................................................................10-6
11
11.1
11.2
11.3
Troubleshooting..............................................................................................11-1
Licence, Language............................................................................................11-1
Troubleshooting modem installations for remote acquisition ............................11-2
Local read-out ...................................................................................................11-5
EDC-S User Manual
Table of Contents
V
VI
EDC-S User Manual
Table of Contents
Landis+Gyr
EDC-S V3.5 1004 en
1
Safety aspects
Please read this chapter before proceeding any further!
1.1
Landis+Gyr EDC-S
Purpose
The EDC-S remote meter reading (RMR) central station is a software application for
reading out remote terminal units via the telephone network, leased lines or optical
interface.
The SCTM and VDEW 2.0 communication protocols are used for remote acquisition,
whereas acquisition via the optical interface conforms to EN 61107.
The presentation module permits tariff-based calculations, as well as the display of
metering data in the form of graphics or freely-definable reports.
A scheduler function supports round-the-clock automatic operation. The EDC-S may
therefore be used as a fully-functioning RMR central station for small to medium-sized
systems.
The main functions of the EDC-S are:
•
•
•
•
•
•
•
•
•
Remote data acquisition from RTUs via the telephone or leased line networks
Synchronisation of RTUs in the RMR network
Analysis of metering value status, event messages and communication statistics
Local read-out of RTUs via their optical interface
Import of metering values from hand-held units
Export of metering values to third-party systems
Numerical reporting of load profiles and billing data
Graphical reporting of load profiles
Time-controlled automated operation for the acquisition and reporting of metering
values
• Calculation of synthetic load profiles
• Archiving system for the secure storage of billing-relevant data
Users
Personnel that are responsible for configuring and operating the EDC-S must possess
appropriate technical qualifications, as well as the necessary authorisation to program
and operate the remote meter reading system.
Training
Landis+Gyr offers training courses for EDC-S users.
Courses covering the administration of hardware and operating systems are offered by
the relevant suppliers.
It is the customer’s responsibility to ensure that all users receive the necessary training.
Landis+Gyr
EDC-S V3.5 1004 en
EDC-S User Manual
Safety aspects
1-1
1.2
User manual
Documentation concept
User manual and CD with examples
Users
The EDC-S user manual is intended for qualified specialists. Furthermore, some prior
knowledge of remote meter reading systems is essential.
Document structure
The EDC-S use manual has been split into nine chapters:
• Chapter 2: Before you start
Describes the main prerequisites as well as the installation and definitions for the
EDC-S.
• Chapter 3: Quick start
Describes a fast procedure for reading out and displaying metering data.
• Chapter 4: Remote acquisition
Describes the detailed functions of the RMR system.
• Chapter 5: Optical read-out
Detailed description of the read-out via the meter’s optical interface.
• Chapter 6: Data import
Describes how to import data from hand-held systems or other RMR systems.
• Chapter 7: Data export
Describes how to export data to other RMR central stations and billing systems.
• Chapter 8: Data analysis
Describes the usage of the graphical and numerical processing tools.
• Chapter 9
Describes the definition and calculation of synthetic load profiles.
• Chapter 10: System administration
Describes maintenance functions such as archiving or modifying/deleting raw data.
• Chapter 11: Troubleshooting
Describes solutions to known problems, e.g. during manual acquisition
1-2
EDC-S User Manual
Safety aspects
Landis+Gyr
EDC-S V3.5 1004 en
2
Before you start
2.1
Overview
The EDC-S is an automated remote meter reading central station. It is able to manage
up to 500 RTUs, as well as supporting the read-out of billing data.
The EDC-S also features the following powerful functions:
•
Local read-out of RTUs via their optical interface
•
Import of read-outs from hand-held systems
•
Processing of load profile data based on tariff switching periods
•
Flexible cross summations and load profile calculations
•
Graphic analysis
•
Export of processed data in text or graphic files
•
Import and export of load profile data in LG-format
•
Service functions by means of reading/setting any RTU parameters
NOTE
Should it not be possible to solve a problem using this manual, contact your local
Landis+Gyr representative or the Landis+Gyr Helpdesk in Zug for further support.
Select the hyperlink www.landisgyr.cz and include details of the customer name, version
and problem description in the e-mail.
Landis+Gyr
EDC-S V3.5 1004 en
EDC User Manual
Before you start
2-1
2.2
System requirements
Operating system
: WINDOWS 95, 98
WINDOWS NT 4.0/ 2000/ XP
2.3
Processor
: INTEL 486 200 MHz or faster
RAM
: 32 MByte
Free hard disk space
: 500 MByte
Components
Modem
: functional tests have been performed to check remote
acquisition using a EDC-S with the following modem types:
- Alcatel 1144 (V22, V22bis, V23)
- Landis+Gyr FKJ 11.1 (V22, V22bis, V23)
- Siemens M20 (GSM) (V22bis)
- 3com US Robotics 56k Message Modem (V22bis)
- ISDN TA Zyxel Omninet
Optical reading head
2-2
EDC User Manual
Before you start
: -Landis+Gyr FDC3.1
Landis+Gyr
EDC-S V3.5 1004 en
2.4
Installation
The installation program setup.exe guides you through the various installation steps.
Start setup.exe from the installation CD. Follow the steps and instructions given by the
installation wizard.
NOTE
If you require 3.5‘‘ diskettes instead of the CD, copy directories Disk1 to Disk5 from the
installation CD onto 3.5‘‘ diskettes.
2.4.1
Defining the working directory
All settings, files and directories are retained when installing EDC-S over an existing
installation.
If you install EDC-S in a new directory, the working directories are undefined. The
following dialogue will appear when running the program for the first time:
Default:
When completely reinstalling the software, the directory path will be created as
described in the next section.
Update:
The directories and files from a previously installed version will be used. Enter the path
of the existing installation. Press the button "..." to browse for the path containing the file
EDC.ini.
Landis+Gyr
EDC-S V3.5 1004 en
EDC User Manual
Before you start
2-3
Custom:
Used to select the path if the definitions and settings should be stored in a special
directory. Press the button " ... ", after which the following browse window will appear:
Then press the "Custom" button to complete the EDC-S installation.
2.4.2
Activating the licence
The EDC-S is supplied as a demo version. To use the program, activate it by entering
the licence name, number of periodic buffers and licence key.
The language may be changed following installation. The English and German
languages are supplied with the software.
Procedure
Help ⇒ Licence
Modify settings
Save ⇒ Close
2-4
EDC User Manual
Before you start
Landis+Gyr
EDC-S V3.5 1004 en
Settings
Licence:
Enter the name of the licence.
Number of buffers:
Enter the number of periodic buffers that may be managed using your licence.
Licence key:
Enter the licence key.
NOTE
Ensure that the licence key is entered
within 30 days of running the program for the first time, otherwise EDC-S will
automatically lock itself once this period has expired.
The time remaining until the program is locked is indicated in the upper part of the
window.
2.4.3
Selecting the menu language
The English and German languages are included in the standard package. The
language may be changed afterwards.
Procedure
Help ⇒ Language
Select language
Save ⇒ Close ⇒ Restart program
Settings
Language:
Select one of the languages listed.
Landis+Gyr
EDC-S V3.5 1004 en
EDC User Manual
Before you start
2-5
2.4.4
Directories
The following directories are created during a new installation:
Directory
Contents
C:\EDC\ASCII
Load profile data in text format for transfer to other
programs
(e.g. MS EXCEL, etc.)
C:\EDC\CONV600
Path of the CONV600 program, which is used to convert
load profiles from the EKM660 and EKM670 devices.
C:\EDC\DATEN
EDC database.
Each file contains the metering values for one month from
one load profile register.
C:\EDC\DEFIN
Contains all definitions for RTUs, projects, tariff
agreements, acquisition lists, processing lists and reports.
C:\EDC\DG20
Load profile data in LG format for data exchange between
central stations
Note that DG20 only supports a limited directory length of
8 characters.
C:\EDC\EMT2000
Interface to the EMT2000 load management system
C:\EDC\MESS
Comments to raw data
C:\EDC\ROUTEN
All billing data acquired from meters and from processed
load profile data.
C:\EDC\SPON
Spontaneous (event) messages
C:\EDC\EXT
Contains EKM670 switching states.
C:\EDC\TARIDAT
Raw data acquired locally via the optical interface or from
hand-held units.
This data is deleted after import into the EDC database.
C:\EDC\TMP
Temporary files
C:\EDC\TRA
Directory for the export of graphics (Word Meta Files) and
demand values (text file).
C:\EDC\TRANSFER
Data store for read-outs from hand-held units.
Completed routes are stored in this directory, ready for
import into EDC.
These files are not deleted by EDC after the routes have
been imported.
2-6
C:\EDC\ZST
Meter register values
C:\EDC\SYNLP
Synthetic load profile
EDC User Manual
Before you start
Landis+Gyr
EDC-S V3.5 1004 en
2.4.5
General system parameters
Procedure
Start the DGC 300.
Definitions
⇒ System
Select settings
Save ⇒ Close
Summer time
Enable / disable:
The summer time change over function can be enabled or disabled.
Start / End:
Define the dates/times of the next summer time period. The table below gives the
European change-over times for the next few years.
Year
Start
Finish
2001
25. March
02:00
28. October 03:00
2002
31. March
02:00
27. October 03:00
2003
30. March
02:00
26. October 03:00
2004
28. March
02:00
31. October 03:00
2005
27. March
02:00
30. October 03:00
2006
26. March
02:00
29. October 03:00
2007
25. March
02:00
28. October 03:00
2008
30. March
02:00
26. October 03:00
2009
29. March
02:00
25. October 03:00
2010
28. March
02:00
31. October 03:00
2011
27. March
02:00
30. October 03:00
2012
25. March
02:00
28. October 03:00
The above data is only valid if the daylight saving system is not changed in the
meantime.
Landis+Gyr
EDC-S V3.5 1004 en
EDC User Manual
Before you start
2-7
This year / Next year:
Permits the definition of change-over times for the next 2 years.
NOTE
The summer time change-over must be defined before the beginning of the month in
which the change-over occurs. The database is prepared for the change-over at the
beginning of the month.
Integrating periods will be incorrectly interpreted if the change-over times are missing or
incorrectly defined. Subsequent modifications are not possible.
Make a note of when the EDC settings must be changed.
Data storage
Separator:
Defies the separator between two metering values from the same load profile integrating
period. The default character is <TAB> (09) HT, however others may be used to
support the import of data from third-party systems.
Recording: logging to file / detailed logging:
Defines the content of the communication log books. It is recommended that
communication details are always recorded in a log book. A file is created for each
communication interface.
Detailed recordings are useful for communications specialists, however they should only
be used in special cases due to the large volumes of generated data.
Identification code key
Billing data identification codes are used to identify data sets when meters or tariff units
are read out via their optical interfaces, or when data is imported from hand-held units.
The following settings may be used for all Landis+Gyr meters and tariff units from
Landis+Gyr:
2-8
EDC User Manual
Before you start
Landis+Gyr
EDC-S V3.5 1004 en
Device identifier:
Each meter manufacturer using the EN 61107 protocol must be able to interpret the
device type. For example, the Landis+Gyr ZMB400 uses device code
/LGZ4ZMB410CT647.SsF .
A specific identification code set may be defined for each device type. Often it may be
possible to use only one ID code set since the ID codes for meter number, date, time
and load profile are frequently identical. The device type will then only comprise the first
few characters that are valid for all types.
If several ID code sets with differing device IDs are defined, the ID code set with the
longest (closest) matching device ID will be used.
The device ID codes for all major manufacturers are given in the table below:
Manufacturer
Device ID
ABB Kent Meters AB
/ABBxxxx
AEG
/AEGxxxx
Danubia
/DANxxxx
Deutsche Zählergesellschaft DZG
/DZGxxxxx
Eurometers Ltd
/EURxxxx
GEC Meters Ltd.
/GECxxxx
Heliowatt
/HELxxxx
Iskraemeco, Slovenia
/ISKxxxx
Landis+Gyr
/LGZxxxx
Schlumberger
/SLBxxxx
Siemens Nürnberg
/SIExxxxx
Device number, date, time:
ID codes for metering data ( as displayed on the meter rating plate).
Load profile:
ID code for distinguishing load profile from billing data.
IEC1107
Com port:
Specifies the port that will be used for read-outs via the optical interface.
Landis+Gyr
EDC-S V3.5 1004 en
EDC User Manual
Before you start
2-9
2.5
Importing archived data and examples
All the examples and data used in this manual are archived on the enclosed CD. To
import this archived data, first specify the archive path.
Import the archive from the installation CD to work through the examples given in this
manual.
2.5.1
Set archive data path
Data is archived in a specified directory. Per default, drive A is used for archiving
purposes, however other paths may also be defined.
Procedure
2-10
1.
Exit the EDC
2.
Open the file EDC\EDC.ini using Microsoft Editor
3.
Modify the path setting bacdir=A:\ in section [DIRECTORIES]. To use the sample
data on the CD, enter the drive letter of your CD drive.
4.
Save the file EDC.ini
5.
Restart the EDC
EDC User Manual
Before you start
Landis+Gyr
EDC-S V3.5 1004 en
2.5.2
Import archived sample data
Procedure
1.
Insert the enclosed installatation CD in your drive
2.
Start the EDC
Press this button
to open the presentation window
3.
Select the menu “Data management” and sub-menu “Backup/archive”
4.
Copy all archived data (raw values, definitions, projects and reports) into the
database.
Note: Select the tab “All” and the year 1999 in the raw data archive.
Landis+Gyr
EDC-S V3.5 1004 en
EDC User Manual
Before you start
2-11
2-12
EDC User Manual
Before you start
Landis+Gyr
EDC-S V3.5 1004 en
Landis+Gyr
EDC-S V3.5 1004 en
EDC User Manual
Before you start
2-13
3
Quick start
3.1
Remote acquisition
This chapter demonstrates the remote acquisition of data using an operational RTU
installed by Landis+Gyr.
A prerequisite is successful installation and commissioning as described in section 2
“Before You Start”. The settings and configurations archived on the installation disk will
be used for this example.
3.1.1
Step 1: Definition of the communication line
A communication line defines the electrical connection between the PC and telephone
network. First connect the modem to the PC. Refer to the modem manual for further
details.
Procedure
Definitions ⇒ Communication line
Check that the port (COM) number matches the port to which the modem is connected:
If your telephone network utilises tone dialling, use the default settings in the “Line” tab.
Deactivate “tone dialling” if this is not the case”.
Confirm these settings using Save ⇒ Close.
Landis+Gyr
EDC-S V3.5 1004 en
EDC User Manual
Quick start
3-1
3.1.2
Step 2 : RTU definition
The archive contains a predefined RTU. If the archive has been imported as described
in section 2 “Before You Start”, one only needs to modify the telephone number of the
metering point.
Procedure
Definitions ⇒
RTU
Select the RTU "Rigi Solaranlage", click on the tab "Communication" and alter the
telephone number as shown in the table below.
It may be necessary to add an area or country access code to the telephone number.
Add the dial-out prefix (in this example “0”) if a private line is used.
Within CH, connection to public network
W041855035
Within CH, with dial-out prefix
,0W041855035
Outside CH, connection to public network
W004141855035
Outside CH, with dial-out prefix
,0W004141855035
W:
The modem does not dial until the dialling tone is detected.
,:
The modem waits 2-3 seconds before dialling
Confirm these settings using Save ⇒ Close.
NOTE
Verify that the number has been entered correctly. Incorrectly entered numbers could
irritate other telephone subscribers.
3-2
EDC User Manual
Quick start
Landis+Gyr
EDC-S V3.5 1004 en
3.1.3
Step 3: Remote acquisition
Start remote acquisition to obtain metering data from the "Rigi" solar station in central
Switzerland.
Procedure
Acquisition ⇒ Remote reading
Select the RTU "Rigi Solaranlage". Activate the options "load profiles" and "billing data":
Confirm these settings using Ok.
A status window will appear once communication has started:
If communication was successful, one should see the messages "InitCom" and "query
periodical buffer" in the window. Remote acquisition is terminated when the window is
closed.
If communication problems occur, remote acquisition is repeated a maximum of 3 times.
NOTE
Refer to the “Troubleshooting” section if there are communication problems.
Landis+Gyr
EDC-S V3.5 1004 en
EDC User Manual
Quick start
3-3
3.1.4
Step 4 : Checking the metering values
Check if the metering values have been stored in the EDC database.
Procedure
Display ⇒ Presentation⇒ Data management ⇒ Input substitute values
A list of all current metering data in the database will be displayed:
At least metering values 1000_01 to 1000_04 should be available.
Close the window by pressing Cancel.
3-4
EDC User Manual
Quick start
Landis+Gyr
EDC-S V3.5 1004 en
3.2
Read-out via the optical interface
The read-out procedure will be illustrated using a meter type Landis+Gyr
ZMB310CT647 which contains 4 registers stored in a load profile.
A prerequisite is successful installation and commissioning as described in section 2
“Before You Start”. The interface for reading head FDC3.1 must be configured (section
2.4.5, system parameters).
The settings and configurations archived on the installation disk will be used for this
example.
3.2.1
Step 1: Reading out a meter
Connect reading head FDC3.1 to the optical interface on the meter.
Procedure
Acquisition ⇒ Local reading
Select the meter type and data to be acquired. Choose a password level and a
password if the meter require it to read meter data.
A window will then display a counter indicating the amount of data already transferred.
Landis+Gyr
EDC-S V3.5 1004 en
EDC User Manual
Quick start
3-5
3.2.2
Step 2: Importing the data
Procedure
File ⇒ Import... ⇒ Local Reading
A list of current read-outs is displayed (users should note the load profile time range).
Select the read-out and press the button Import Manual. A new window then appears:
Select the RTU "Rigi Solaranlage" and map the acquired data to this RTU by pressing
Map. The name of the RTU will now be shown in the read-out list next to the selected
device number. Then press Import.
The imported file is subsequently removed from the list.
3-6
EDC User Manual
Quick start
Landis+Gyr
EDC-S V3.5 1004 en
3.2.3
Step 3 : Checking the metering values
Check whether the metering values have been stored in the EDC database.
Procedure
Display ⇒ Presentation ⇒ Data management ⇒ Input substitute values
A list of all current metering data in the database will be displayed:
Change the month and year to the load profile time range that was read out.
The raw value list should contain the values 1000_01 and 1000_02. The number 5000
corresponds to the database reference of the "Rigi Solaranlage“ RTU. The raw value list
contains two values if both metering values were imported.
Close the window by pressing Cancel.
3.3
Data acquisition from hand-held terminals
Data import will be illustrated using a sample file from a Landis+Gyr NORTI System.
A prerequisite is successful installation and commissioning as described in section 2
“Before You Start”.
The settings and configurations archived on the installation disk will be used for this
example.
3.3.1
Step 1: Copying the read-out route
Use the Windows Explorer to copy read-outs from a hand-held unit to the TRANSFER
directory.
Procedure
Copy the file "HTT_Route.abg" from the archive on the installation CD to directory C:\
EDC\TRANSFER\.
Users may also employ files from their own read-out system instead of the archived
sample file.
Landis+Gyr
EDC-S V3.5 1004 en
EDC User Manual
Quick start
3-7
3.3.2
Step 2: Importing the data
Procedure
File ⇒ Import... ⇒ Local Reading
All read-outs stored in the file are displayed in the “Local Reading” window. Press the
button Import Manual. A new window then appears:
Select the RTU " Messung 5000 " and map the acquired data to this RTU by pressing
Map. The name of the RTU will now be shown in the read-out list next to the selected
device number. Then press Import.
The imported file is subsequently removed from the list.
3-8
EDC User Manual
Quick start
Landis+Gyr
EDC-S V3.5 1004 en
3.3.3
Step 3 : Checking the metering values
Check whether the metering values have been stored in the EDC database.
Procedure
Display ⇒ Presentation ⇒ Data management ⇒ Input substitute values
A list of all current metering data in the database will be displayed:
Change the month and year to the load profile time range that was imported. Set the
time to January 2000 when using the archived sample file.
The raw value list should contain the values 5000_01 and 5000_02. The number 5000
corresponds to the database reference of project 5000.
Close the window by pressing Cancel.
3.4
Analysing the metering data
The analysis of load profiles will be illustrated using an example based on archived data.
A prerequisite is successful installation and commissioning as described in section 2
“Before You Start”. The settings and configurations archived on the installation disk will
be used for this example.
All processing functions are accessed through one window. The menu items described
below always refer to the “Presentation” window".
Procedure
Display ⇒ Presentation
Close this window when processing is complete:
File ⇒ Exit
Landis+Gyr
EDC-S V3.5 1004 en
EDC User Manual
Quick start
3-9
3.4.1
Step 1: Displaying and printing 15-minute values
The metering value for each integrating period may be displayed and printed out.
Procedure
File ⇒ Open ⇒ Show demand values
Enter the settings shown below:
Confirm these settings using Ok
The demand values for one week, incl. date/time stamps, will then be displayed:
Click the "+" and "-" symbols to zoom in/out. The ">" and "<" buttons are used to scroll
the values.
This view may be printed out:
Procedure
File ⇒ Print
The print-out is in landscape format. Each A4 page holds 5 days worth of 15 minute
metering values.
Close the window "Project: Messung 5000".
3-10
EDC User Manual
Quick start
Landis+Gyr
EDC-S V3.5 1004 en
3.4.2
Step 2: Displaying, printing and exporting load curves
The load curve for a particular measurement may be displayed in graphic form.
Procedure
File ⇒ Open ⇒ Graph
Enter the settings shown below:
Confirm using Ok
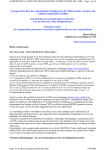
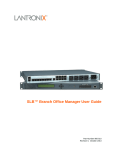
The load curve for one month will now be displayed:
The green line indicates the monthly maximum which is given in the footer of the graph,
i.e. 3816 kW.
Use the cursor keys ← and → to move the cursor line across the load curve. The date,
time and measured value will then change accordingly.
The various toolbar buttons permit the expansion and compression of the graph.
Landis+Gyr
EDC-S V3.5 1004 en
EDC User Manual
Quick start
3-11
The graph may be printed out:
Procedure
File ⇒ Print
The print-out is in landscape format. Check that the default printer settings (in the Printer
menu) are also set to landscape.
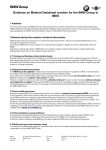
The graphic may also be exported as a Word Meta File (file.wmf).
Procedure
File ⇒ Export…
The graphic is automatically assigned a unique name and stored in directory
X:\...\EDC\TRA. Another directory and filename may be chosen, if required.
Press Ok to start the export. This file can now be pasted into, e.g. a Microsoft Word
document using "Insert ⇒ Picture ⇒ From File":
Messung 5000
01.01.99 - 31.01.99
4000
3600
3200
2800
2400
2000
1600
1200
800
400
MM-DD
0
01-05
Dim:
Start:
End:
90Min/point Max.
31.12.98 24:00 Value
31.01.99 24:00 Time:
01-10
01-15
01-20
01-25
01-30
3816.00 kW
744.00 kW
01.01.99 01:15 Fr
Close the window "Graph [5000_01]".
3-12
EDC User Manual
Quick start
Landis+Gyr
EDC-S V3.5 1004 en
4
Remote acquisition
4.1
Remote acquisition process
When starting the remote acquisition of metering data, communication is established
using the applicable RTU definitions. A line is used to connect to a modem and establish
a connection to an RTU. Metering data is acquired once this connection is up.
Monitoring
All the data traffic between metering point and PC is displayed in a monitoring window
during read-out. This data is also recorded in a file together with date/time stamps, and
may be used for troubleshooting purposes.
Data errors
If checksum errors occur, the read-out of erroneous telegrams will be repeated. The
connection to the metering point will be terminated if too many checksum errors occur or
the data format is not as expected.
Repeat calls
After a certain time, a repeat call will be made in another attempt to acquire the data.
This procedure is repeated until either all the data has been received correctly or the
maximum number of permissible repeat calls has been reached.
Data storage
The data is then scaled using the pulse value matching definitions and stored in the
EDC database. The metering data is supplemented with status information and is now
available for further analysis. The metering data may also be stored in text format at the
same time, thus permitting analysis using programs such as MICROSOFT EXCEL.
Time control
Remote acquisition may be started manually or automatically. Automated operation is
based on the PC clock, thus permitting the use of cheap communication tariffs.
Landis+Gyr
EDC-S V3.5 1004 en
EDC User Manual
Remote acquisition
4-1
4.2
The modem
In principle it is possible to use devices from various suppliers, however most product
specifications, functionality, timings etc… are changing rapidly.
Remote acquisition of data from new and old telemetering equipment will only function
correctly when the modem settings, functions and timing are all known. Landis+Gyr
therefore only recommends the following modem types whose functions have been
thoroughly tested.
NOTE
In contrast to versions 2.4 or older, EDC V3.0 is able to interpret modem text messages.
Configure the installed modems accordingly.
4.2.1
Siemens FKJ 11.1
The FKJ11.1 modem, which is recommended for use with the EDC, is configured so that
it may be immediately used for remote acquisition. After commissioning, the unit
displays its configured modulation mode.
If the modem should be configured to revert to another modulation mode following a
power outage, use the "Hyper Terminal" program to modify the settings.
Start "Hyper Terminal" as described in section 4.2.2 and send the following AT –
commands to the FKJ11.1 modem:
Modulation mode following power outage
AT command
V23
Half-duplex
1200 Baud
AT&F0W
V21
Full-duplex
300 Baud
AT&F1W
V22
Full-duplex
1200 Baud
AT&F2W
V22bis Full-duplex
2400 Baud
AT&F3W
The modem settings are correct if the desired modulation mode is displayed.
NOTE
When ordering the FKJ11.1 modem, ensure that the correct application and modulation
mode are specified. The configuration is dependent on the employed central station.
Using modems that have not been correctly configured for use with the EDC, can lead
to malfunctions.
4-2
EDC User Manual
Remote acquisition
Landis+Gyr
EDC-S V3.5 1004 en
4.2.2
Using Hyper Terminal
1.
Close all open applications, particularly those that may be accessing the modem
COM port (e.g. EDC, SW fax devices, ... ).
2.
Start Hyper Terminal
áStart
⇒ Programs ⇒ Accessories ⇒ Communications ⇒ Hypertrm.exe
Note: Hyper Terminal may not be installed on your system. If this is the case,
install it using:
á Start ⇒ Settings ⇒ Control Panel ⇒ Add/Remove Programs
Select the "Windows Setup" tab and activate
; Communication ⇒ Details... ⇒ ; Hyper Terminal
3.
Enter a name for the connection in the field Name. Confirm by pressing OK.
4.
Enter the COM port to which the modem is connected in the field Connect
using.
For example, COM1 would require the selection Direct to COM1. Confirm by
pressing OK.
5.
Confirm the dialogue settings using OK.
6.
Define the following connection parameters:
Bits per second
Data bits
Parity
Stop bits
Flow control
7.
: 2400
:8
: None
:1
: Hardware
Now enter the command sequence, given in section “Modem Settings”, at the
position of the blinking cursor. Confirm by pressing <ENTER>. The modem will
acknowledge with a "0".
Note: The entries may not be displayed, indicating that the local echo of the
modem has not been activated. In this case enter the commands ‘’blindly”.
8.
Landis+Gyr
EDC-S V3.5 1004 en
Exit the Hyper Terminal program.
EDC User Manual
Remote acquisition
4-3
4.3
Definition of communication lines
Communication lines define the modem control settings for remote acquisition. There
must be at least one communication line per modem.
If it is planned to use different transmission modes with the same modem, define a
separate communication line for every transmission mode. The modem will then be
initialised before each call.
NOTE
The use of several communication lines per modem is only permitted for test purposes
or manual operation.
Functional errors may result if more than one transmission mode (communication line) is
defined per modem, and power outages or communication problems occur at the
metering points.
Procedure
Definitions
⇒
Communication line
Create a new line using New or select an existing line.
Naming conventions
Name of communication line:
Specify a name for each line. This name should indicate the connection, transmission
mode and (if possible) the communication speed. This simplifies the definition of RTU’s
later on.
Number:
Each communication line is automatically assigned a number. This cannot be edited.
4-4
EDC User Manual
Remote acquisition
Landis+Gyr
EDC-S V3.5 1004 en
Modem
COM port number:
Number (1 .. 4) of the serial interface to which the modem is connected.
Modem initialisation
Initialisation is not necessary if a modem is used solely for one transmission mode. In
this case only enter “AT” and configure the modem so that it may be controlled without
any additional initialisation.
When using different transmission modes, define the transmission mode per line.
The following initialisation strings apply to the FKJ11.1:
Transmission mode
AT commands
V23
Half-duplex
1200 Baud
AT&F0
V21
Full-duplex
300 Baud
AT&F1
V22
Full-duplex
1200 Baud
AT&F2
V22bis Full-duplex
2400 Baud
AT&F3
Baud rate of dial-up unit:
Specifies the communication speed between PC and modem. This should match the
speed of the selected transmission mode.
Half-duplex:
Activate the half-duplex function when operating the modem in V.23 mode.
Line
Number of redials:
Defines the number of automatic repeat call attempts when remote acquisition was
unsuccessful. In most countries it is not permitted to make more than 5 repeat calls
attempts.
NOTE
The maximum number of repeat calls is specific to individual countries and is limited by
the modem itself. The modem will shut down if the number of automatic repeat call
attempts exceed this limit. This results in complete disruption of the automated
acquisition process.
Landis+Gyr
EDC-S V3.5 1004 en
EDC User Manual
Remote acquisition
4-5
Time between calls to same number [s]:
Defines the time between repeat calls when remote acquisition was unsuccessful. This
must be set to at least 10 seconds, as the modem will only release the line after a
certain delay.
Time between calls to different number [s]:
Defines the delay between the acquisition of data from 2 metering points in automatic
operation. This parameter is dependent on the employed telephone exchange, however
it is typically set to 2 seconds.
Tone dialling:
All modern telephone exchanges support this faster dialling method. Pulse dialling
(slower) will be used if the box is not checked.
Finishing off
Once all settings have been made, press Save to store them. The new line will then
appear in the list of available communication lines.
Use Close to exit the window. All definitions that were not previously applied using Save
will be lost.
Use Delete to delete the line currently selected.
4.4
Definition of RTU’s
The RTU definition specifies how metering values are acquired and saved, as well as
any synchronisation of the metering point by the central station.
Each RTU definition may contain one periodic buffer. If a metering point has several
periodic buffers (METCOM MTT3, FAG), define an RTU for each periodic buffer.
Up to 500 RTU’s may be defined, regardless of the purchased licence. The current and
maximum number of RTU’s are displayed in the window "RTU".
Procedure
Definitions ⇒ RTU
Create a new RTU using New or select an existing RTU.
4-6
EDC User Manual
Remote acquisition
Landis+Gyr
EDC-S V3.5 1004 en
Naming conventions
RTU name:
Specify a name for each RTU that clearly identifies it. Incorporate the buffer name when
defining RTU’s with several periodic buffers.
For example, the metering point for the solar installation at Hotel Rigi-Kulm has been
given the name "Rigi Solaranlage".
Number:
Periodic buffers are identified in the database using 4-digit numbers. This number is
specified here.
In contrast with earlier releases, version 3.1 permits the definition of buffer numbers that
are independent of device numbers. The buffer numbers no longer have a bearing on
the import of local read-outs.
Timing
Synchronisation from central station:
Select "Synchronisation" to synchronise the metering point clock to the central station
during every acquisition. Synchronisation is only possible when the time drift is max.
+/- 1 minute.
Alternatively, use the setting "Synch. resp. time set" to correct larger time drifts. This
function will synchronise the metering point clock for drifts less than 1 minute and set
the clock for larger drifts.
NOTES:
•
Metering points with several periodic buffers should only be synchronised once, i.e.
only activate this function in one of the RTU definitions.
•
If the metering point clocks are synchronised to the line frequency, the time drifts
are typically greater than 60 seconds. In this case, synchronisation by the central
station is ineffective.
•
If the metering point clock is set, data may be lost.
Periodic buffers with pulse inputs will lose all their data if the time correction goes
beyond the end of the integrating period.
Periodic buffers with CS interfaces will lose the duplicate integrating periods that
result when the clock is corrected backwards.
Maximum time deviation [s]:
Specifies the maximum permissible time difference between central station and
metering point. Synchronisation is not performed if the deviation is less than the defined
value.
NOTE: Define the maximum permissible difference as large as possible. Each
synchronisation requires an average of 30 seconds because synchronisation is always
to the full minute. An entry is also made in the status register of the affected metering
values.
It is therefore not recommended to specify values less than 5 seconds. Typical values
are 10 and 30 seconds for daily and monthly acquisition respectively.
Landis+Gyr
EDC-S V3.5 1004 en
EDC User Manual
Remote acquisition
4-7
Latest data storage:
Indicates the last integrating period stored in the central station database. When
creating a new definition, this value may be set to a point in the past dependent on the
storage capacity of the RTU. The first acquisition may then be performed several days
or weeks after commissioning.
Once the first acquisition has been completed, this value changes to the date/time of the
last integrating period stored in the database.
Last acquisition:
Indicates the last time that communication with the RTU took place. For new definitions
this is set to a default date of 1980.
Data format
RTU type:
Specifies the type of RTU from which data will be acquired.
The RTU type "VDEW" comprises all devices supporting the VDEW 2.0 communication
protocol.
The RTU type "ZMC" comprises all devices supporting the DG-COM communication
protocol.
4-8
EDC User Manual
Remote acquisition
Landis+Gyr
EDC-S V3.5 1004 en
Periodic buffer:
Defines the periodic buffer that should be read out. Check the RTU configuration for
details.
For example, the following apply to the METCOM3:
Connection to METCOM3
Periodic buffer no.
Load profile on INP 1
1
Load profile on INP 2
2
:
:
Load profile on INP 8
8
Number of decades / register values:
Specifies how many decades of each metering value should be transferred. The number
of decades transmitted is determined by the RTU configuration, which is dependent on
the measurement accuracy and integrating period.
The following settings are typical for an integrating period of 15 minutes:
Integrating period
5 .. 20 Min.
Register values
no
yes
20 .. 60 Min.
no
yes
No. of decades
Accuracy of meter
4
0.5 .. 2 %
6
0.1 .. 0.5 %
8
0.1 .. 2 %
4 or 6
0.5 .. 2 %
6
0.1 .. 0.5 %
8
0.1 .. 2 %
Integrating period:
The integrating period of the RTU is defined in minutes.
NOTE
RTU’s may also be deleted. Any previously acquired data associated with this RTU
must also be deleted – refer to section 9.1.4 " Deleting archived files".
Landis+Gyr
EDC-S V3.5 1004 en
EDC User Manual
Remote acquisition
4-9
Metering value
Number:
Every periodic buffer stores one or more metering values, each of which has an
identification number and may be scaled individually.
All metering values in the periodic buffer must be identified by a number ≠ 0. If this
number is missing, an error will occur when communicating with the RTU.
The number used has no effect on the storage of data, i.e. the first value is always
stored with number xxxx_01, the second with xxxx_02 etc… .
A/B *10^C:
Pulse value matching is achieved by multiplying the metering value with A, dividing it by
B and weighting it with exponent C.
The pulse value matching function in the RTU definition modifies the values when they
are stored in the central station database. Subsequent changes to these factors could
lead to misinterpretation of the metering data. It is recommended that the following
calculations are used when wishing to scale pulse values as described below :
1.
4-10
Inserting the decimal point
The metering values are always stored in the periodic buffer without decimal points
and are interpreted by the central station as kW values.
Compare the billing and load profile data and adapt the metering value to match
the value displayed on the meter.
Displayed demand on meter
Exponent C
0.000 kW
-3
00.00 kW
-2
000.0 kW
-1
0000 kW
0
0.000 MW
1
00.00 MW
2
000.0 MW
3
0000 MW
4
EDC User Manual
Remote acquisition
Landis+Gyr
EDC-S V3.5 1004 en
The Project definition also contains a pulse value matching function (see section
“Presentation”). This should only take into account the reading factor that is used
when manually reading the meter.
2.
Converting energy advance values to demand
The central station interprets all values as average demand. If the RTU stores its
periodic buffer values as energy advance instead of demand, these values must be
converted. Use multiplier A for this purpose. Divisor B should be set to 1:
Integrating period in minutes
Conversion from energy advance
to demand values
10
15
20
30
60
A=6
B=1
A=4
B=1
A=3
B=1
A=2
B=1
A=1
B=1
NOTE: It is recommended that reading factors and measurement transformer factors
are NOT included in the RTU definition. Any changes in the measurement transformers
cannot be corrected for past data.
Finishing off
Once all settings have been made, press Save to store them. The new RTU will then
appear in the list.
Use Close to exit the window. All definitions that were not previously applied using Save
will be lost.
Use Delete to delete the RTU currently selected.
Communication
Telephone number:
Specifies the telephone number of the RTU. Permitted are digits as well as the
characters ',' (standard waiting character) and 'W' (wait for dialling tone).
Do not enter a number when using leased lines.
Communication line:
Specify the communication line which should be used with this RTU.
Number for communication:
Specifies the RTU address: 5 and 8 digit RTU numbers are supported.
Landis+Gyr
EDC-S V3.5 1004 en
EDC User Manual
Remote acquisition
4-11
Type, Password:
The METCOM3 RTU includes a password protection function which prevents
unauthorised access to the metering point.
Set the password Type to "none" for all other RTU types and when not using the
METCOM3 password protection function.
The following settings apply to the METCOM3:
Setting under “Type”
Corresponds to METCOM3 user
"P1"
"System manager"
"P2"
"User 1"
"P3"
" User 2"
"P4"
" User 3"
"P5"
" User 4"
Access to the METCOM3 is configured using these settings. Verify that the settings in
the central station match those in the METCOM3.
Transmission blocking time:
This blocking time prevents communication errors when using half-duplex
communication. Its value is dependent on line quality and length. Typically, a value of
500ms is recommended.
4-12
EDC User Manual
Remote acquisition
Landis+Gyr
EDC-S V3.5 1004 en
4.5
Manual remote acquisition
Procedure
Acquisition ⇒ Remote reading
Communication
Select an RTU or RTU acquisition list. Then define which data should be acquired.
Press Ok to start the acquisition for the selected RTU or acquisition list.
Settings
Periodic buffer / from .. to :
When selecting periodic buffers, the time range between the last integrating period
stored in the database to the current time is automatically read out.
Checking the box from .. to permits the user to acquire periodic buffer data over any
time range. This is particularly useful for testing and avoids long communication times.
Spontaneous buffer / from .. to:
When selecting spontaneous buffers, the time range between the last integrating period
stored in the database to the current time is automatically read out.
Checking the box from .. to permits the user to acquire spontaneous buffer data over
any time range. This is particularly useful for testing and avoids long communication
times.
Billing data / remote cumulation:
If both functions are selected, the cumulation is performed before the acquisition of new
billing data.
Read table values:
To query details of the RTU configuration, first create a table containing the relevant
SCTM addresses. The addresses are given in the corresponding product manuals.
The result of the query may be displayed by selecting
Display ⇒ Read table - result
Landis+Gyr
EDC-S V3.5 1004 en
EDC User Manual
Remote acquisition
4-13
Set table values :
RTU settings may also be modified providing this is permitted by the RTU access rights.
All addresses and modified settings are defined in a table. The addresses and settings
are given in the corresponding product manuals.
The result may be displayed by selecting
Display ⇒ Set table result
Summer/winter time:
Activate this option to copy the current summer time settings from the central station to
RTU.
This function is not supported by the following instruments:
FAG, FAF10, FAF20
Metcom2 relays a-c /b-c:
Controls the position of the METCOM2 relay contacts.
Synchronisation from central station:
The current central station time is compared with that of the RTU. Should the time
discrepancy exceed the maximum permissible limit, the RTU is synchronised or the
RTU clock is set by the central station. The activation of the synchronisation and time
setting functions is individually defined for each RTU.
4-14
EDC User Manual
Remote acquisition
Landis+Gyr
EDC-S V3.5 1004 en
4.6
Automatic Acquisition
RTU’s may be grouped into acquisition lists to automate the remote acquisition process.
The scheduler ("Automatic Operation”) is used to manage the periodic acquisition of
data for individual RTU’s or whole acquisition lists.
4.6.1
Acquisition lists
Procedure
Definitions ⇒ Automatic mode ⇒ New
Settings
Name of acquisition list:
Used to specify the name for a group of RTU’s that should be acquired collectively, e.g.
the grouping of all RTU’s with periodic buffers makes sense as they are read out more
frequently than RTU’s with billing data.
RTUs to choose from:
List of RTU’s not yet included in the acquisition list.
List:
List of RTU’s included in the acquisition list.
NOTE
Only group RTU’s using a common communications protocol in each acquisition list.
Create separate lists for VDEW2.0 or ZMC meters.
Landis+Gyr
EDC-S V3.5 1004 en
EDC User Manual
Remote acquisition
4-15
4.6.2
Definition of automatic operation
Procedure
Definitions ⇒ Automatic mode ⇒ New
Settings
Job:
List of previously defined actions.
Job name:
Used to specify the name for an action, which should run periodically, e.g. daily
acquisition.
Type:
Select the option “Read data” for remote acquisition.
Read data:
Define whether the action applies to a single RTU or a complete acquisition list.
Reading:
Select the data to be acquired. When selecting both "Cumulation" and "Billing data", the
cumulation is performed first followed by acquisition of the new billing data.
Maintenance:
"Summer/Winter time" is used to program the summer time change-overs in the RTU’s
based on the settings in the central station.
“Synchronisation from central station” authorises the central station to adjust the clocks
in the RTU’s. The master clock is the central station.
NOTE
Ensure that the PC clock is sufficiently accurate. It may be necessary to synchronise the
PC using a GPS or DCF77 receiver.
Inaccurate clocks may result in RTU data being lost.
4-16
EDC User Manual
Remote acquisition
Landis+Gyr
EDC-S V3.5 1004 en
Timing:
Select the date and time when the action should first be executed. Depending on the
chosen period, the action may be executed at intervals ranging from 5 minutes to every
year.
4.6.3
Starting automatic acquisition
Automatic operation is started by clicking the red telephone on the toolbar.
T
he status bar at the bottom of the window indicates the date/time when the next
acquisition will take place.
NOTE
If the start time is set in the past, acquisition will automatically commence once
automatic operation has been enabled.
Landis+Gyr
EDC-S V3.5 1004 en
EDC User Manual
Remote acquisition
4-17
4.7
Service Functions
4.7.1
Error acquisition list
The error acquisition list represents an overview of all not successful acquired RTU’s.
The error acquisition list valid for manual- and automatic remote acquisition.
Acquisition
⇒ Error acquisition list
The following information are recorded:
Periodic buffer name:
RTU, which could not be acquired.
Last call:
Last attempt to call the RTU.
Valid until:
In the central station the data are valid until the shown
date and time.
Re-acquisition:
All listed RTU’s will be re-acquired. If the re-acquisition is successful then the
corresponding list entry will be removed.
Delete:
If an RTU has not to be acquired because of any reasons, then the RTU can be
deleted.
4-18
EDC User Manual
Remote acquisition
Landis+Gyr
EDC-S V3.5 1004 en
4.7.2
Monitoring functions
It is possible to display the communication traffic.
A prerequisite is that the recording has been enabled as described in section 2.4.5,
"General System Parameters, Data Storage.
4.7.3
Recording the communication
The data exchanged with the modem is stored in a file. Each interface (COM port x) has
its own file with the name SCTMx.LOG. If the file size exceeds 1 MByte, the file is
renamed OldSCTMx.LOG and a new file SCTMx.LOG is created.
Similarly, the communication with VDEW devices is recorded in the files VDEWx.LOG.
These files may be displayed:
Display ⇒ Display comm. logfile…
The following data is recorded:
Messages
Starting RTU acquisition:
Message:
L&G Bau 17 PP3 started at: 24.02.00 11:19:11
Comments to the acquired data:
Message:
Periodic Buffer: Start: 23.02.00 15:30:00 End: 24.02.00
11:00:00
Periods: 79 Dec: 4 Points: 3 bytes collected: 1758
estimated: 1758
Message:
amount of bytes collected ok, data accepted
Terminating RTU acquisition:
Message:
L&G Bau 17 PP3 ended at: 24.02.00 11:19:46
Data transfer
The recorded data is divided into two types according to its direction:
"Transmit" implies the data sent from PC to modem.
"Receive" implies the data sent from modem to PC.
This means that the communication between RTU and PC as well as between PC and
modem is recorded. Non-printable characters are represented as hexadecimal ASCII
codes in square brackets. The following control characters are used:
Landis+Gyr
EDC-S V3.5 1004 en
EDC User Manual
Remote acquisition
4-19
Representation
Abbreviation
Description
[00]
NUL
Empty data
[01]
SOH
Start of header
[02]
STX
Start of text
[03]
ETX
End of text
[09]
HT
Tab
[0A]
LF
Line Feed
[0D]
CR
carriage return
[0E]
SO
??
The data traffic between modem and PC is normally based on AT commands. The
significance of these commands is given in the appropriate modem product manuals.
The connection between modem and RTU is set up using the following commands:
Transmit:
ATV1[0D]
Initialisation of the modem
Receive:
O
Acknowledgement by the modem
Transmit:
ATDT0123456789[0D]
Receive:
K[0D][0A]CONNECT[0D][0A]
Dial command for tel. no.
0123456789
Acknowledgement of connection by
modem
The acquisition of load profiles is as follows:
Transmit:
[01]1036890?000:[03]
RTU address
Nr. 03689
Receive:
[01]003689000004[03]
Acknowledgement by RTU
Transmit:
Read command for load profile
[01]103689100271[02]E60300022315150002241119[03]|
Receive:
Load profile data
[01]203689112433[02]000223153000022411000000017900008300000000
00000172000082000000000000017400008300000000000001740000850000
00000000017200008500000000000001630000800000000000000165000082
00000000000001650000860000000000000161000082000000000000016400
008300000000[03][0A]
Interpretation
4-20
Specialised knowledge in the areas of “modem communication” and the “SCTM
protocol” are needed to analyse this file. These files are an important aid to specialists
when troubleshooting connection problems between RTU and central station.
EDC User Manual
Remote acquisition
Landis+Gyr
EDC-S V3.5 1004 en
4.7.4
Communication statistics
The communication statistics indicate which RTU’s experience the most communication
problems. To display these statistics, select:
Display ⇒ Statistics
The data indicates how many successful calls have been made per RTU.
4.8
Rigi Solar Station
All examples in this manual are based on the remote acquisition of data from the photovoltaic installation at the Hotel Rigi Kulm in Switzerland, which is operated by the
"Rigistrom" cooperative. This organisation is known for its public work in promoting the
use of solar energy, and has kindly provided Landis+Gyr access to the measurement
data.
The photovoltaic station at Hotel Rigi Kulm has been in operation since 1st April 1997.
The generated electricity is fed into the public grid.
The installation has a surface area of 138 m2 and a rated power of 13.6 kW (DC). It is
located at 1780 m above sea level and has an annual production of approximately
13'500 kWh, which equates to the annual consumption of 4 households.
Landis+Gyr
EDC-S V3.5 1004 en
EDC User Manual
Remote acquisition
4-21
Settings
The energy is measured by a meter type ZMB310CT647. A METCOM MTT3A/E2A is
used to read out the metering data. The following settings are required for remote
acquisition:
Communication:
Telephone number
SCTM number
Transmission mode
+41 (041) 855 00 35
42533
V.22bis, 2400 Baud
Metering data acquisition:
Integrating period
15 Min.
Register format
4 digits
energy advance
Periodic buffer 1:
Metering value 1, Sum of all 3 phases,
Metering value 2, Phase 1,
Metering value 3, Phase 2,
Metering value 4, Phase 3,
XX,XX kW
XX,XX kW
XX,XX kW
XX,XX kW
Configuration:
=/
=/
=/
#
3 x 230/400 VAC
50 Hz
PSTN
Network
NOTE
Various central stations from several time zones access this metering point. In order to
prevent the metering data from being modified during remote acquisition, it is not
permitted to use functions such as remote cumulation, remote setting of parameters,
time setting or synchronisation.
4-22
EDC User Manual
Remote acquisition
Landis+Gyr
EDC-S V3.5 1004 en
5
Optical read-out
5.1
Optical acquisition process
Data read out via the optical interface is identified using ID codes and stored in an
intermediate buffer.
The read out data is then imported and assigned using the same RTU definitions as for
remote acquisition.
Read-out
The active data traffic over the optical interface is displayed during acquisition. All
meters having an optical interface may be read out, however the import of load profile
data is only supported for the product lines ZMBxxxT647, EKM647 and METCOM MxT3
devices.
Formatted commands
Instead of reading out the last 40 days of load profile memory, it is also possible to
acquire data for single days or a specific time range. This permits the subsequent
acquisition of data from instruments like the EKM640 for up to a year in the past.
Mixed acquisition modes
Existing load profile data stored in the database will be supplemented and not
overwritten by new read-outs. A combination of modem and optical acquisition is fully
supported.
5.2
Definition of decoding sets
Decoding sets are used to define the significance of the ID codes found in billing data.
The device number, which is contained in the billing data acquired from meters and tariff
units, is used to assign a decoding set to the acquired data.
Define the decoding set as described in section 2.4.5, " General System Parameters ".
5.3
Definition of the communication interface
Specify the COM port as described in section 2.4.5, "General System Parameters".
5.4
RTU definitions
To import data acquired via the optical interface, first define its structure and pulse value
matching factors.
All settings are described in section 4.4 „ Definition of RTU’s“.
NOTE
The settings in the "Timing" and "Communication" tabs are of no importance if RTU data
is only being acquired over an optical interface.
Landis+Gyr
EDC-S V3.5 1004 en
EDC User Manual
Optical read-out
5-1
5.5
Data acquisition
Procedure
Acquisition ⇒ Local reading
Settings
Device type:
Specify the type of device to be read out. Optical read-out is supported for Landis+Gyr
ZMB meters and Landis&Gyr METCOM MxT3 telemetering units.
The dialogue window will then display the available acquisition modes.
Password level and password:
If the meter requires a password to read out data, choose the password level and type
in the password.
Type of read-out:
Several acquisition modes are supported. The various load profile settings differ in the
volume of data that is read out.
NOTES
The load profile memory of the Z.B, EKM640 products is approximately 600 kByte. The
read-out of „Billing data and load profiles“ will therefore take approximately 20 minutes
at a speed of 4800 Bit/s.
Whenever possible, only acquire partial load profiles (typically the last 40 days) or from
a defined time range (from... to...).
Should the read-out take longer than ca. 30 minutes, there is a problem with the meter
or tariff unit:
Communication
•
The connection between tariff unit and modem (CS interface) should be
disconnected whilst acquiring data over the optical interface.
•
The load profile data may be inconsistent. Such a situation could arise when large
time jumps or configuration changes have taken place and the load profiles were
not subsequently deleted. This can result in endless loops occurring.
It may still be possible to acquire data over specific time ranges from such devices,
however in the majority of cases it will be necessary to delete the load profiles.
Press Ok to start the acquisition.
The acquired data is stored in TARIDAT. The filename is composed of the date and
time.
5-2
EDC User Manual
Optical read-out
Landis+Gyr
EDC-S V3.5 1004 en
5.6
Data import
Procedure
File ⇒ Import... ⇒ Local reading
All recognised read-outs are displayed in the window.
During the import process, all metering data is transferred from the local read-outs and
assigned to the corresponding RTU in the database. The metering values are scaled
according to the pulse value matching definitions and stored as raw values in the
database. If metering data is already available from earlier read-outs, only the data for
the missing integrating periods is saved.
If the read-outs include billing data, this data is stored in a separate file in directory
ROUTEN.
Successfully imported files are deleted from the directory TARIDAT and hence no longer
appear in the list.
NOTES
The file identification data (device no., filename, load profile time range) can only be
displayed if a suitable identification code key is defined first (see section 2.4.5 „General
system parameters“).
Functions
•
No files displayed:
The system cannot find an identification code key matching the device ID in the
read-outs.
•
Incomplete file data in list:
The identification code key does not include the ID code for the device number or
load profile.
•
No periodic buffer names listed:
The assignment between device numbers and RTU’s, as described in section 5.6.1,
has not been performed.
Import, Automatic
Used to import all files whose RTU, device number and load profile time range are
known.
Import, Manual:
Used to assign acquired data to RTU’s, and manually import the data.
Landis+Gyr
EDC-S V3.5 1004 en
EDC User Manual
Optical read-out
5-3
Delete:
Used to delete files without importing them. This command removes the selected files
from directory TARIDAT.
5.6.1
Assigning devices to RTU’s
Load profile data may only be imported if it is first assigned to an RTU.
Procedure
File ⇒ Import... ⇒ Local reading⇒ Import Manual
Functions:
File Header:
Device number ID:
Device number appearing in the billing data string
Number of decades:
No. of decades - load profile data
Integrating period [min.]: Integrating period of load profile data
Metering values:
Register numbers recorded in load profile data: no’s 1
and 3 correspond to P-registers 1 and 3 in a ZMB meter.
from .... to:
Time interval of the read out load profile
Mapping to:
Select the RTU to be assigned to the device.
Map:
Activates the mapping between device number and RTU. The link is then displayed in
the “Periodic buffer name” column for the selected device.
Import :
The data of the selected read-out is transferred to the EDC database.
5-4
EDC User Manual
Optical read-out
Landis+Gyr
EDC-S V3.5 1004 en
6
Data import
6.1
Data import procedure
Data is imported in two steps:
Automatic Import
1.
Identification and separation
EDC recognises the format and content of a file by its directory location and ID
code key set.
Large route files from hand-held terminals are separated into several smaller files,
one for each read-out. This makes the conversion and import into the database
more manageable.
This first step is automatically performed when selecting the import function.
2.
Conversion and import
In order to successfully import data, each file must have a corresponding RTU in
the EDC database.
The various files are then converted into the EDC database format. The
subsequent import fills the gaps in the existing database records.
Files in LG-format are automatically assigned to the correct RTU. These files contain the
RTU name and RTU database reference in addition to the actual load profile data.
Files obtained from hand-held terminals do not include any details about RTU names
etc…, hence it is necessary to assign each device number to an RTU during the first
import. Subsequent data imports for this device number are automatically assigned to
the correct RTU.
Landis+Gyr
EDC-S V3.5 1004 en
EDC User Manual
Data import
6-1
6.2
Data import from hand-held terminals
Procedure
Copy the completed read-out routes to directory ...EDC/TRANSFER.
File ⇒ Import… ⇒ Local reading
When selecting this function, all the read-outs from directory ...EDC/TRANSFER are
separated into individual files and stored in directory...EDC/TARIDAT. These files are
displayed in the window:
During the import process, all metering data is transferred from the local read-outs and
assigned to the corresponding RTU in the database. The metering values are scaled
according to the pulse value matching definitions and stored as raw values in the
database. If metering data is already available from earlier read-outs, only the data for
the missing integrating periods is saved.
If the read-outs include billing data, this data is stored in a separate file in directory
EDC/ROUTEN/.. .
Successfully imported files are deleted from the directory TARIDAT and hence no longer
appear in the list.
NOTES
The file identification data (device no., filename, load profile time range) can only be
displayed if a suitable identification code key is defined first (see section 2.4.5 „General
system parameters“).
6-2
•
No files displayed:
The system cannot find an identification code key matching the device ID in the
read-outs.
•
Incomplete file data in list:
The identification code key does not include the ID code for the device number or
load profile.
•
No periodic buffer names listed:
The assignment between device numbers and RTU’s, as described in section 6.2.1,
has not been performed.
EDC User Manual
Data import
Landis+Gyr
EDC-S V3.5 1004 en
Functions
Import, Automatic
Used to import all files whose RTU, device number and load profile time range are
known.
Import, Manual:
Used to assign acquired data to RTU’s, and manually import the data.
Delete:
Used to delete files without importing them. This command removes the selected files
from directory TARIDAT.
6.2.1
Assignment of devices to RTU’s
Load profiles may only be imported if they are first assigned to a previously defined
RTU.
Procedure
Functions:
File ⇒ Import… ⇒ Local Reading ⇒ Import Manual
File Header:
Device number ID:
Device number appearing in the billing data string
Number of decades:
No. of decades - load profile data
Integrating period [min.]: Integrating period of load profile data
Metering values:
Register numbers recorded in load profile data: no’s 1
and 3 correspond to P-registers 1 and 3 in a ZMB meter.
from .... to:
Time interval of the read out load profile
Mapping to:
Select the RTU to be assigned to the device.
Map:
Activates the mapping between device number and RTU. The link is then displayed in
the “Periodic buffer name” column for the selected device.
Import :
The data of the selected read-out is transferred to the EDC database
Landis+Gyr
EDC-S V3.5 1004 en
EDC User Manual
Data import
6-3
6.3
Files from Landis & Gyr central stations
Procedure
Copy the files to directory ...EDC/DG20.
File ⇒ Import… ⇒ LG Format
This window displays all files in directory /EDC/DG20/. If metering data is already
available, only the data for the missing integrating periods is saved.
NOTES
The periodic buffer name and th DB ref. No. can only be displayed if a suitable RTU is
defined first.
Functions
No periodic buffer names listed:
The assignment between files and RTU’s, as described in section 6.3.1, has not
been performed.
Import, Automatic
Used to import all files whose periodic buffer name and DB ref. no. are known.
Import, Manual:
Used to assign files to RTU’s, and manually import the data.
Delete:
Used to delete files without importing them. This command removes the selected files
from directory EDC/DG20/.
6-4
EDC User Manual
Data import
Landis+Gyr
EDC-S V3.5 1004 en
6.3.1
Assignment of files to RTU’s
LG files may only be imported if they are first assigned to a previously defined RTU.
Procedure
File ⇒ Import… ⇒ LG - Format ⇒ Import Manual
File Header:
Periodic buffer name:
Name of periodic buffer (proposal from LG file)
Type of value:
Format of metering values
Number of decades:
No. of decades - load profile data
Integrating period [min.]: Integrating period of load profile data
Metering values:
Register numbers of load profile data.
from .... to:
Time interval of the read out load profile
Mapping to:
Select the RTU to be assigned to the file.
Map:
Activates the mapping between file and RTU. The link is then displayed in the “Periodic
buffer name” column for the selected device.
Functions:
Import :
The data of the selected read-out is transferred to the EDC database
Landis+Gyr
EDC-S V3.5 1004 en
EDC User Manual
Data import
6-5
6-6
EDC User Manual
Data import
Landis+Gyr
EDC-S V3.5 1004 en
7
Data export
Several program modules support data export functions. All export functions for the
presentation module are described in section 8 "Data analysis".
The export of raw values and billing data is covered by this chapter.
7.1
Exporting load profile data
Analysis or periodic buffer data may be exported from the DGC300 database at any
time, either as text files or in LG format.
LG format
LG format is used to exchange periodic buffer data between Landis+Gyr central
stations. These files contain RTU definitions in addition to the actual load profile data.
Text format
Text format export files may be imported into standard spreadsheet programs. These
files are structured as tables and do not contain any supplementary information about
RTU’s.
Manual export
It is possible to manually export files for single RTU’s or RTU groups (acquisition lists).
Automatic export
The export function may also be used in automatic mode.
NOTE
The exported load profiles are derived from the raw values in the DGC300 database.
These raw values represent either energy advance or average demand.
The export of register values is not supported.
Landis+Gyr
EDC-S V3.5 1004 en
DGC300 User Manual
Data export
7-1
7.1.1
Text format
When exporting periodic buffer data in text format, files are created in directory
..\DGC300\ASCII\. The filenames are dependent on how the files are created:
Filenames in automatic
mode:
The filename YYYYZZDDPPPP.txt is determined by the date of the first integrating
period, the time span, and the number of the periodic buffer.
YYYY
: Year
ZZ
: 01 .. 12 corresponds to the months January .. December
13 .. 16 corresponds to the 1st .. 4th quarter
17 .. 18 corresponds to the 1st .. 2nd half-year
DD
: Applies to time spans: days, months, quarters, half-years and years,
01 ..31 indicates the day of the first integrating period
PPPP
: Number of the periodic buffer
NOTE
When exporting using a time span of "1 week", it is not guaranteed that a unique
filename will be created. The export for 1 day (e.g. 1. August) and 1 month (e.g. August)
creates the same filename in both cases.
Filenames for manual
export
•
The export of "Month" and "Day" in the same target directory will result in the loss of
data.
•
The export of "Weekly" data will overwrite any older files in the same directory.
•
To prevent such mishaps, define a target directory for each time span. Exported
data should be transferred to their target systems before new files are created in
automatic mode.
The filename YYYYMMPPPP.txt is determined by the date of the first integrating
period, and the number of the periodic buffer.
YYYY
MM
PPPP
: Year
: Month
: Number of the periodic buffer
Each month has a separate file.
Data content
The following extract from a text file shows four metering values from a periodic buffer:
:
:
:
:
:
:
:
:
:
:
00.11.01 09:15
0.05
00000000
0.04
00000000
0.01
00000000
0
00000000
00.11.01 09:30
0.05
00000000
0.04
00000000
0.02
00000000
0
00000000
00.11.01 09:45
0.06
00000000
0.03
00000000
0.02
00000000
0
00000000
00.11.01 10:00
0.05
00000000
0.05
00000000
0.01
00000000
0
00000000
:
:
:
:
:
:
:
:
:
:
Each line contains the date/time of the integrating period closure, followed by the
metering values in the periodic buffer. The default separator between values is the
tabulator character, however alternative characters may be defined under
Definitions ⇒ System ⇒ Data storage ⇒ "Separator"
7-2
DGC300 User Manual
Data export
Landis+Gyr
EDC-S V3.5 1004 en
The metering values are represented identically to the raw values in the database:
Status information
•
No units
•
Decimal places are only present if the acquired values were modified using the
pulse value matching function.
•
The date/time stamp format is YY.MM.DD hh:mm. The separator between the date
and time is a space " 32 (space)". This cannot be modified.
•
Metering values 1 to n from a periodic buffer are displayed from left to right.
•
In addition to the metering values, 8 status information digits are displayed. Each
digit represents a status bit, having the following significance
1000'0000 → Value changed in RTU
0100'0000 → Partial power outage
0010'0000 → Value or start/end of int. period missing
0001'0000 → Value suspect or invalid
0000'1000 → Summertime
0000'0100 → Reserve
0000'0010 → Value affected by time change
0000'0001 → Value was manually changed in the central station
Combinations of these bit patterns may occur, e.g. 0010'1000 implies -> this value
was affected by a power outage at the start or end of the integrating period.
The following extract from a text file shows for one meter value the winter – summer
time change over.
:
:
:
01.03.25 01:45
24
00000000
01.03.25 02:00
74
00000010 Value affected by time change
01.03.25 02:15
0
00100000 value or start/end of int. period missing
01.03.25 02:30
0
00100000 value or start/end of int. period missing
01.03.25 02:45
0
00100000 value or start/end of int. period missing
01.03.25 03:00
0
00100000 value or start/end of int. period missing
01.03.25 03:15
44
00001000 Summertime
01.03.25 03:30
54
00001000 Summertime
01.03.25 03:45
65
00001000 Summertime
:
Landis+Gyr
EDC-S V3.5 1004 en
:
:
:
DGC300 User Manual
Data export
:
7-3
The following extract from a text file shows for one meter value the summer – winter
time change over.
:
:
:
:
01.10.28 01:45
24
00001000 Summertime
01.10.28 02:00
74
00001000 Summertime
01.10.28 02:15
0
00001000 Summertime
01.10.28 02:30
0
00001000 Summertime
01.10.28 02:45
0
00001010 Value affected by time change
01.10.28 03:00
0
00000000
01.10.28 02:15
44
00000000
01.10.28 02:30
54
00000000
01.10.28 02:45
65
00000000
01.10.28 03:00
60
00000000
:
:
:
:
NOTE
Dependent on the protocol and the device type not all status information are supported.
The shown example is valid for the device Metcom3, acquired via SCTM protocol.
7.1.2
LG format
The export of periodic buffer data in LG format creates files in directory
..\DGC300\DG20\.
Filenames
The filename PPPPhhmmss.txt is composed of the periodic buffer number and the
current time.
PPPP : Number of the periodic buffer
hhmmss : Time when the data file was stored
7-4
DGC300 User Manual
Data export
Landis+Gyr
EDC-S V3.5 1004 en
7.1.3
Manual export
Procedure
File ⇒ Export
Press Export to start the process, which is complete when the message "done" is
displayed.
RTU
Select one RTU to export specific metering values.
Export format:
Select the required format.
Time range:
Specify the required time range. If metering values are not available for the specified
time range, their value is set to zero when exported.
RTU list
Data from RTU’s, which have been grouped into acquisition lists, may be exported in
one step. The settings are identical to those when exporting data for individual RTU’s.
Landis+Gyr
EDC-S V3.5 1004 en
DGC300 User Manual
Data export
7-5
7.1.4
Automatic export
In automatic mode, RTU’s are grouped into acquisition lists and periodically read out.
Use the automatic export feature if the read-out data is required in text format.
Procedure
Definitions ⇒ Automatic mode ⇒ New
Settings
Job:
List of previously defined tasks.
Job name:
Specify a name for the periodic task, e.g. daily acquisition or monthly export.
Type:
Select the "Export data" option when wishing to export.
Entry active:
Deactivate this box to disable automatic mode for this particular task.
Export data:
Specifies whether the export applies to a single RTU or a whole acquisition list.
Range:
Defines the time range to be exported. Exported files may contain between one
metering value and metering values for a whole year.
Start day:
Defines the start day for the export. When exporting one week, 1 = Monday, 2 =
Tuesday etc…. When exporting data from a single day or a whole month, the start day
refers to the date of the first exported day.
Separator:
Tabulator "(09) HT" is the standard separator between metering values. Another
character may be selected.
7-6
DGC300 User Manual
Data export
Landis+Gyr
EDC-S V3.5 1004 en
Destination:
The default path for storing text files is DGC300\ASCII. Use a different directory for
each time range (month, day …).
Timing:
Start date and Period:
Select the date and time when the action should first be executed. Depending on the
chosen period, the action may be executed at intervals ranging from 5 minutes to every
year.
Starting automatic mode
Press the red telephone button on the toolbar to start automatic mode.
The status bar at the bottom of the window indicates the date and time when the next
export will start. The definitions of filenames, directories and data format are described
above.
NOTE
If the start time is set in the past, the export will automatically commence once
automatic operation has been enabled.
Landis+Gyr
EDC-S V3.5 1004 en
DGC300 User Manual
Data export
7-7
7.2
Exporting billing data
Billing data is treated specially by the DGC300. Such data is generated in tariff units and
separated from load profile values during acquisition (remote, local or via import of
reading routes). The billing data is then stored in DGC300\Routen\datei.abg.
Billing data can also be derived from load profile values using the DGC300 analysis
module. The results of reports (refer to section 8.4 ff) may be stored in
DGC300\Routen\datei.abg, similarly to the billing data from tariff devices.
Export
There is no actual export function. The target system must retrieve the files from
directory DGC300\Routen\...
Data is identified by means of the file content and not the filename. The device number
and read-out date contained in the billing data are used to uniquely identify all files.
Data maintenance
7-8
The DGC300 does not automatically delete the files in directory DGC300\Routen\.. It is
therefore imperative that the target system or system administrator periodically archives
or deletes these files (refer to section 9.1.5 Billing data maintenance).
DGC300 User Manual
Data export
Landis+Gyr
EDC-S V3.5 1004 en
8
Data analysis
Data analysis is performed in a separate window and is independent of data acquisition.
It is based on the use of „projects“, that are linked with tariff agreements and integrating
periods for the time period under analysis.
The analysis results are stored in graphic or text format and displayed on-screen.
Results may also be printed out or exported.
Features
• Graphic analysis
Load curves, load duration curves, histograms, application of tariffs.
• Numerical analysis
Energy tariffs, maxima, contribution to maximum function, presentation of billing data.
• Reports
Freely-definable reports incl. use of embedded graphics.
• Operation
User-friendly, several simultaneous display modes, variable time spans for analysis.
• Interfaces
Data export in text format, as Word Meta File or in LG-ASCII format.
Procedure
Display ⇒ Presentation
Landis+Gyr
EDC-S V3.5 1004 en
EDC User Manual
Data analysis
8-1
Open the "Presentation" window as described above.
8-2
1.
Define the general system parameters.
2.
Define a project.
3.
Perform numerical or graphic analysis.
4.
Export or print-out the analysis.
5.
Return to the main window using File ⇒ Exit.
EDC User Manual
Data analysis
Landis+Gyr
EDC-S V3.5 1004 en
8.1
System definitions
Several global parameters must be set before using the presentation module for the first
time.
Procedure
Definitions ⇒ System ⇒ Status display...
Definitions ⇒ System ⇒ Integrating period...
Definitions ⇒ System ⇒ Identification code key...
8.1.1
Status display
The validity of each metering value is indicated by its metering value status, which
comprises 6 different status indicators. This status information is stored together with
the raw values.
The status is displayed during numerical analysis of the metering data as well as when
entering substitute values (menu item "Input substitute values"). The status message
with the highest priority is displayed should several status messages occur
simultaneously.
The display and priority of the metering value status may be defined.
Input dialogue
Procedure
1.
Specify a character for each status message. Status messages are displayed
using this character.
2.
Specify a priority for each status message.
NOTE
The character and priority settings shown above are identical to the standard settings
used in the DGC2000.
Landis+Gyr
EDC-S V3.5 1004 en
EDC User Manual
Data analysis
8-3
8.1.2
Integrating period
The integrating period used in data analysis may differ to that in the RTUs.
• Int. period for data analysis = Int. period of acquired metering values
No conversion takes place.
• Int. period for data analysis < Int. period of acquired metering values
The metering values are evenly divided:
The two metering values 1264 kW and 1351 kW with an integrating period of 30
minutes are converted to the values 1264 kW, 1264 kW 1351 kW and 1351 kW with
an integrating period of 15 minutes.
• Int. period for data analysis > Int. period of acquired metering values
The metering values are added:
The two metering values 1264 kW and 1351 kW with an integrating period of 15
minutes are converted to a value of 1307.5 kW with an integrating period of 30
minutes.
8.1.3
Identification code key
Identification code keys must be defined in order to analyse the metering data. Apart
from defining the date, time etc… as described in section 2.4.5, "General system
parameters", also specify the ID codes corresponding to the other meter registers and
data.
Procedure
Select an existing key and press open, or define a new key by pressing new.
Base definitions
These definitions are identical to those made in section 2.4.5, "General system
parameters".
8-4
EDC User Manual
Data analysis
Landis+Gyr
EDC-S V3.5 1004 en
Display definitions
Specify the ID code and text for each register that will be used for analysis:
Syntax
The ID codes must be specified exactly as they are stored in the billing data. The
acquired ID codes and registers may be checked by looking at the files in directory
EDC\ROUTEN\***.ABG.
Exceptions are the previous (stored) values and maxima time stamps:
•
Previous values:
The position in the read-out order is specified and not the index number for the
stored value:
8.1*0 corresponds to the stored value for Register 8.1 at the end of last month
8.1*1 corresponds to the stored value for Register 8.1 at the end of the month
before last
8.1*2 etc
•
Maxima time stamps:
Maxima time stamps are acquired without the use of individual ID codes. These
time stamps are filtered out in a special way:
6.1;2
implies the time stamp for register 6.1
6.1*0;2 implies the time stamp for the latest stored value for register 6.1
Text and empty lines may be created by entering values in the “ID-code” field that do not
correspond to any real data.
NOTE
There are numerous different ID-code numbering systems, depending on the applied
standard as well as the application. ID-code definitions should be checked by the staff
responsible for meter configuration.
Landis+Gyr
EDC-S V3.5 1004 en
•
The ID-codes and their significance are usually documented in the service software
and meter configuration sheets.
•
The metering point "Rigi Solar" uses non-standard ID-codes. Most of the register
data will not be displayed if the ID-code definitions from the enclosed archive are
used.
EDC User Manual
Data analysis
8-5
8.2
Definition of projects
Graphic analysis is based on so-called cross summations and projects. Projects are
used to supplement metering data with information used for the analysis.
Projects are used to specify details such as the customer address, device identification,
scaling of units and the calculation of metering data. The combination of several values
into one result is also supported.
Procedure
Definitions ⇒ Project
1.
Enter the project name in the "Customer data" tab.
2.
Enter at least one command line in the “Cross summation” tab.
3.
Press Ok or File ⇒ Save to save the project. The name should have maximum 8
characters.
NOTE
The EDC links the "storage name" of a project with comments in the periodic buffer,
provided that the periodic buffer and “storage name” are identical.
8-6
•
Specify a separate project for each metering value. Use the number of the raw
value as the “storage number”,
e.g.:
The project "Rigi Summe" was created for metering value 9159_01. This value may
be found in the first row of the “cross summation” tab. The project "Rigi Summe" is
saved under the name 9159_01.
•
The comments may be viewed, if graphic analysis is performed for projects with a
single metering value.
•
Projects, consisting of several metering values, may be assigned arbitrary names
and numbers, however the comments cannot be displayed.
EDC User Manual
Data analysis
Landis+Gyr
EDC-S V3.5 1004 en
“Customer data” tab
• Number
Enter the meter number, customer number or project number. When using the meter
number, the project name will be shown when displaying the billing data.
• Name (always specify)
Project or customer name
• Address
Customer address
• Sender
Name of sender in the analysis department
• Device
Name of devices (text) used at the metering point.
• Text
Any comment relating to the project
• Status input
Designations for status inputs 1 to 8 (only for EKM670)
• Constant
Used to enter pulse value matching data for read-outs made via the optical interface
(EKM647and EKM670).
W
I
U
=
=
=
Transformer constant
Pulse value
Revolutions / kWh (only for meters using a reading head on the Ferraris
disc).
• Internal
The default units displayed are kWh and kW. These units may be replaced by any
sequence of characters:
E = kvarh indicates that the units kvarh will be used instead of kWh for graphic
analysis. P=kvar indicates that the units kvar will be used instead of kW for graphic
analysis.
Landis+Gyr
EDC-S V3.5 1004 en
EDC User Manual
Data analysis
8-7
“Cross summation” tab
Cross summations are used to combine or convert raw values or other cross
summations. The calculated results are stored under the name of the new cross
summation.
In addition to the basic arithmetic operators + - x / , comparison functions are also
supported. Special functions used for analysing energy values (apparent energy, tariffbased functions) may also be included in cross summations.
Dialogue
8-8
EDC User Manual
Data analysis
Landis+Gyr
EDC-S V3.5 1004 en
Procedure
1.
Enter the operator + or S+ on the first line under “Command”.
2.
Under “Factor” enter a multiplier that should be applied to the metering value
3.
Under "Value" enter the identifier of the raw value or cross summation.
Alternatively, double-click the desired value in the list of raw values or cross
summations.
4.
Enter further command lines as required.
5.
Once the "Customer data" tab is complete, save the new project by pressing Ok
or File ⇒ Save.
The command lines are processed in the specified sequence. The result of the last
command line is saved as the cross summation value under a new name.
NOTES
• The analysis of metering data is always based on cross summations. Direct analysis
of raw values is not possible.
• Cross summations are initialised with null values. The first command line with + or +S
is used to add a value to this null, after which further calculations are possible on the
subsequent command lines.
• Cross summations are re-calculated during every analysis. The results are not stored
as new “raw values”.
• Divisions by zero are set to zero.
• Mathematical rules, such as multiplication before addition, are not supported:
In the above example, the result is calculated (Value 9159_02 + Value 9159_03) x 10
and not Value 9159_02 + (Value 9159_03 x 10).
• Calculations are made per integrating period.
Landis+Gyr
EDC-S V3.5 1004 en
EDC User Manual
Data analysis
8-9
8.2.1
Basic operations
Commands using
constants
Commands with raw
values
A constant will be applied to the result of the previous command line:
Command
+
*
/
Addition of 5
Subtraction of 5
Multiplication by 5
Division by 5
Factor
5.000
5.000
5.000
5.000
Value
[Raw value]
[Raw value]
[Raw value]
[Raw value]
Addition of (Raw value x 5)
Subtraction of (Raw value x 5)
Multiplication by (Raw value x 5)
Division by (Raw value x 5)
A cross summation, multiplied by a factor, will be applied to the result of the previous
command line:
Command
+S
-S
*S
/S
Example
Value
[empty]
[empty]
[empty]
[empty]
A raw value, multiplied by a factor, will be applied to the result of the previous command
line:
Command
+
*
/
Command using cross
summations
Factor
5.000
5.000
5.000
5.000
Factor
5.000
5.000
5.000
5.000
Value
[cross sum]
[cross sum]
[cross sum]
[cross sum]
Addition of (cross sum x 5)
Subtraction of (cross sum * 5)
Multiplication by (cross sum * 5)
Division by (cross sum * 5)
The electric supply to an office building comprises a common incoming supply and
several outgoing feeder circuits supplying different areas of the building. The incoming
supply as well as each feeder circuit are metered. The metered values for the incoming
supply (raw value 4645_01) should be compared with the sum of the outgoing circuits
(3645_01, 3646_01, 3650_01, 3652_01) and the discrepancy between them calculated
as a percentage of the incoming value.
Formula:
Sum of the outgoing feeders – Incoming supply
Discrepancy =
x 100
Incoming supply
Entering the cross summation:
8-10
EDC User Manual
Data analysis
Landis+Gyr
EDC-S V3.5 1004 en
8.2.2
Comparative operators
The result of the previous command line is compared with a constant, raw value or
cross summation. The following operators are supported:
<
=
>
<=
>=
<>
Command
>
>
>S
Factor
5.000
5.000
5.000
less than
equal to
greater than
less than or equal to
greater than or equal to
not equal to
Value
[empty]
Comparison with the constant 5
[Value]
Comparison with a raw value * 5
[cross sum] Comparison with another cross sum * 5
If the result of the comparison is true, the value is carried over to the next operation. If it
is false, the result is set to zero.
Example:
A customer has a tariff contract whereby reactive energy is paid when power factor
cos ϕ is worse than 0.707. Reactive and active power are both metered (values
5000_02 and 5000_01 respectively.
Formula:
If
Reactive power – active power > 0 -> reactive power – active power is billed
Reactive power – active power = 0 -> 0
Reactive power – active power < 0 -> 0
Entering the cross summation:
Landis+Gyr
EDC-S V3.5 1004 en
EDC User Manual
Data analysis
8-11
8.2.3
Active and reactive calculations
Apparent power and cos ϕ calculations are only possible by means of cross
summations. The direct use of raw values is not possible.
Cos phi
Command
+S
COS
Factor
1.000
1.000
Value
[Active cross sum]
[Reactive cross sum]
Apparent power
Command
+S
VA
Factor
1.000
1.000
Value
[Active cross sum]
[Reactive cross sum]
[Active cross sum] refers to the active power, [Reactive cross sum] to the associated
reactive power.
Example:
Apparent power is a better indication of the load on a distribution network than active
power, hence calculate the maximum apparent power (instead of using the maximum
active power 5000_01).
Formula:
Apparent power = (Active power2 + Reactive power2)1/2
Entering the cross summation:
The cos ϕ curve is used to advise larger consumers. It should be displayed graphically.
Formula:
Active power
cos ϕ =
1
=
Apparent power
(1 + (Reactive power/Active power)2)1/2
Entering the cross summation:
8-12
EDC User Manual
Data analysis
Landis+Gyr
EDC-S V3.5 1004 en
8.3
Definition of tariffs
The analysis of load profiles may be extended by means of freely-definable tariff
agreements. A tariff agreement is a combination of weekly programs (tariff variants).
Tariff variants define the time-based control of active tariff registers during one week
(similar to a tariff switching program). An "eight weekday" defines the tariff structure for
public holidays that may occur during the normal weekly sequence.
Features
The following configuration features are supported:
• Flexible linking of tariff agreements to load profile data.
• Definition of tariff agreements with limited validity periods.
• Use of public holidays.
• Maximum of 12 tariff variants per tariff agreement.
• Maximum of 12 tariffs per tariff agreement.
• Maximum of 24 different switching times.
Procedure
Landis+Gyr
EDC-S V3.5 1004 en
Definitions ⇒ Tariff ⇒ Tariff variant...
1.
First create the different tariff variants.
2.
Create a tariff agreement, which is based on one or more tariff variants.
3.
Optionally, define any public holidays and special days that may be applicable and
have an effect on the tariff variants.
EDC User Manual
Data analysis
8-13
8.3.1
Tariff variants...
Name
Select a neutral name that permits the use of the tariff variant in several tariff
agreements.
Dialogue
Editing is performed using 9 tabs, one for each day of the week, and two for special
days and public holidays.
Procedure
1.
Select the tab for the day requiring editing.
2.
Specify the times and tariffs. A daily program is complete if the last tariff finishes
at midnight (24:00).
3.
Press Ok to confirm the entries and proceed to the next tab.
4.
When all 9 tabs are complete, press Ok to conclude the tariff variant definition.
NOTES
• Use the Copy function to duplicate previously defined programs for another day.
• Tariff number 0 may be used for special days and public holidays. The number 0
indicates that the given tariff variant does not take into account special days or public
holidays.
• Tariff variants may be deleted or modified, even if the tariff variant is used on one or
more tariff agreements. It is therefore advisable to check that changes in the tariff
variants have not resulted in errors to the tariff agreement.
8-14
EDC User Manual
Data analysis
Landis+Gyr
EDC-S V3.5 1004 en
8.3.2
Tariff agreements...
Name
Specify a name relating to the customer tariff contract. If possible, incorporate the
validity period when using limited tariff agreements.
Dialogue
Procedure
1.
Enter the date until which the first tariff variant is valid under "End".
2.
Double-click the mouse to select the first tariff variant.
3.
Enter the date until which the second tariff variant is valid under "End". Repeat
from step 2.
NOTES
• Tariff agreements must always be defined, even if only one tariff variant is used.
• Tariff agreements always start on January the 1st .
• If a tariff variant finishes on December 31st , no data is indicated for the start of the
next tariff variant (1st January).
• Entering two ** instead of the year indicates that the agreement should repeat every
year. In this case the last tariff variant must finish on 31.12.**.
Landis+Gyr
EDC-S V3.5 1004 en
EDC User Manual
Data analysis
8-15
8.3.3
Holidays...
Dialogue
Procedure
1.
Enter the year to which the public holidays should apply.
2.
Select the tab for the month to be edited.
3.
Activate the public holiday(s) by clicking on the date(s).
4.
Copy any public holidays that repeat every year on the same date.
NOTES
• Press Copy to copy the specified public holidays to another year.
• There is no automatic date adjustment when copying public holidays to another year.
The user must maintain this data on a periodic basis.
8.3.4
Special days...
Special days have the same significance as public holidays. They are used to
differentiate between two types of public holiday.
Examples:
• They may be used to differentiate between half-day (24th December) and full-day
(25th December) public holidays, each of which have different tariff switching times.
• They may be used to differentiate between annually recurring holidays that always
occur on the same date (1st January, 25th December, .. ) and other special days
(Easter). hence only the dates of the special days must be maintained by the
operator.
• They may be used to differentiate between statutory holidays and special days on
which energy is sold at a reduced rate.
8-16
EDC User Manual
Data analysis
Landis+Gyr
EDC-S V3.5 1004 en
8.4
Definition of reports
Numerical analysis is based on the use of reports that contain calculation results. A
report may be used to analyse any number of projects. The report format is designed
using a report editor which permits the integration of texts, graphics or project
information.
Features
• Flexible report layout
• Insertion of several maxima
• Use of tariffs
• Insertion of billing data
• Insertion of text, project information
• Embedding of graphics
Procedure
Definitions ⇒ Define report...
The "Report editor" window then appears.. The menu bar of the “Presentation” window
is supplemented with an additional menu entitled "Edit".
1.
Maximise the "Report editor" window.
2.
Select "File" ⇒ "Open" to open the STANDARD report or another previously
defined report.
3.
Open the dialogue window by double-clicking on an existing or when inserting a
new field.
4.
Modify the configuration of the field in this window.
5.
A new toolbar appears when making multiple selections of fields (hold down the
"Shift" key and make multiple selections using the mouse).
These functions are used to align the highlighted fields in the report.
6.
Save the report under a new name.
NOTES
• The report editor is operated solely using the mouse. Keyboard operation is not
supported.
• The "Report editor" does not have a text bar. The "Report editor" menus are
integrated in the menu bar of the "Presentation" window.
Landis+Gyr
EDC-S V3.5 1004 en
EDC User Manual
Data analysis
8-17
Dialogue
The following function keys are available on the report editor toolbar:
Pointer
Used to mark report fields, either individually or as a group.
Text field
Used to create fields with fixed information content, e.g. header, comments.
Result field
Used to create fields containing calculation results, e.g. max., min., summations,
tariff, data.
Customer field
Field for inserting customer information from project definitions, e.g. name,
address.
Bitmap
This feature is not supported.
Day graphic
Simple graphic depicting the load curve on the day the maximum occurred.
General definitions
Used to define the step size for sliding maximum calculations. For example, enter
4 if an hourly sliding maximum should be formed from 4 consecutive 15 minute
values.
8-18
EDC User Manual
Data analysis
Landis+Gyr
EDC-S V3.5 1004 en
8.4.1
Definition of fields
Each report field is defined using 3 tabs.
Display properties
The position of the field (upper left corner) and its dimensions are defined in 1/100 inch
increments. 10 centimetres more or less corresponds to the number 394.
The font and its alignment in the field may be defined.
Definition
The ”Definition” tab contains settings that vary depending on the type of field.
• Cross summation #1, .... (for graphics and result fields)
The cross summation number refers to registers #1..#10. They are used for print-out
purposes.
• Results in result fields
The following results may be calculated for load profile data and displayed in a result
field:
Landis+Gyr
EDC-S V3.5 1004 en
Sum
Energy that was metered for a given tariff and analysis
period.
Max, Min.
Minimum or maximum power that was registered for a given
tariff and analysis period.
Sliding max., min.
Averaged maximum/minimum over several integrating
periods for a given tariff and analysis period.
Avg. demand
Average demand (power).
Load factor
Ratio between the average and maximum demand.
EDC User Manual
Data analysis
8-19
Start/end register
value
Meter register values at the beginning/end of the evaluation
period (only possible when acquiring meter register values).
Evaluation date
Date on which calculations were made.
Start/end date
Begin and end of reporting period.
• Element (customer info field)
All elements that were defined for a project can also be displayed in a report.
• Factor (result fields)
Numerical results may be scaled using a factor.
• Format (result fields)
Various result and time formats are supported. Results based on load profile
calculations may be supplemented with status information (format ########.##S).
Should a metering value with a set status bit be used in the given analysis period, the
result will be marked with the appropriate status letter (see section "System
definitions”).
• Tariff (graph and result fields)
If a tariff number between 1 and 12 is selected, the result is only calculated for this
tariff.
• Number (result fields)
Used to display several maxima/minima (2 = second highest, 3 = third highest, ..).
• Number (customer info field)
Applies to customer details spanning several rows. Specifies the row number to be
displayed (address, ..).
Data storage
This tab specifies any text or labels to be used as a prefix. This prefix is used to
determine the filename when storing the report results.
This result field is stored in a file ********.abg in directory EDC\Routen. In the above
example, the filename would be 0.8.2 (xxxxxx).
8-20
EDC User Manual
Data analysis
Landis+Gyr
EDC-S V3.5 1004 en
8.5
Numerical analysis
Numerical analysis is based on the use of reports. In addition, there are three other
functions for displaying metering values:
• The listing of all acquired metering values.
• The contribution to maximum analysis for several measurements, illustrated using
one load curve.
• The presentation of billing data acquired from devices with an integrated tariff unit..
Each report is displayed in a separate window and can be printed out. Several graphics
and numerical reports may be displayed simultaneously.
Procedure
File ⇒ Open ⇒ Display report
1.
Select the desired report type.
2.
In the dialogue, enter the project and time span to be analysed. Specify the report
and tariff agreement that should be used for the analysis.
3.
Confirm the entries by pressing Ok.
• Tabs #1, #2, ...
Specify one project per tab if a report should include several projects.
• In use
Select the project to be displayed.
• Tariff agreement
The report reflects the selected tariff agreement.
• Period
Specifies the time span for the report.
• from
Specifies the start date for the report.
• to
Specifies the end date for the report. Only specify when using a "Custom period".
Landis+Gyr
EDC-S V3.5 1004 en
EDC User Manual
Data analysis
8-21
• Report:
Specifies the report type.
NOTE
Report result fields are linked to the definitions in the various tabs. Before running an
analysis, check that the tabs are linked to the correct projects.
8-22
EDC User Manual
Data analysis
Landis+Gyr
EDC-S V3.5 1004 en
8.5.1
Display report
The selected report is displayed in its print-out format (print preview).
The toolbar buttons have the following function:
Zoom buttons for enlarging/reducing the picture.
Page scrolling keys. Used for reports spanning several pages.
8.5.2
Show demand values
Use this report type to verify and compare metering values with locally displayed values
at the metering point. One A4 page has space for 3 ½ days worth of 15 minute metering
values.
The toolbar functions are identical to those for “Display report”.
Landis+Gyr
EDC-S V3.5 1004 en
EDC User Manual
Data analysis
8-23
8.5.3
Contribution to maximum
Used in configurations where a common measurement (metering point) may be broken
down into several sub-measurements. This report determines the contribution of each
sub-measurement to the maximum of the common measurement.
The toolbar functions are identical to those for “Display report”.
8-24
EDC User Manual
Data analysis
Landis+Gyr
EDC-S V3.5 1004 en
8.5.4
Billing values
In contrast to load profile data, billing data is not administered using projects. The
analysis procedure therefore differs slightly from the other report types.
Procedure
File ⇒ Open ⇒ Billing values
1.
Specify which meter read-out should be analysed. The dialogue window displays
the meter number, read-out date and time. Regularly archive and delete old data
to keep the list manageable.
2.
Confirm the entries by pressing Ok.
NOTE
The displayed data is dependent on the configured ID code keys and projects:
Landis+Gyr
EDC-S V3.5 1004 en
•
The filename is displayed if neither the meter number nor the read-out date/time
can be determined from the billing data using the basic ID code key. In the above
example, this is the case for the file 1D5B85D2.
The billing data cannot be displayed. A new ID code key must be defined for this
meter type.
•
The meter number and date/time are displayed if the read-out date/time were
determined from the billing data using the basic ID code key, and there is no
project using this meter number as its project number. In the above example, this is
the case for meter number 72418452.
•
The project name and date/time are displayed if the read-out date/time were
determined from the billing data using the basic ID code key, and there is a project
using this meter number as its project number.
EDC User Manual
Data analysis
8-25
The billing data is displayed using the appropriate ID code definitions.
The toolbar functions are identical to those for “Display report”.
NOTE
It is only possible to display billing data if the decoding set (ID code key) is configured
correctly. Refer to section 8.1.3 "Identification code key" for more details.
8-26
EDC User Manual
Data analysis
Landis+Gyr
EDC-S V3.5 1004 en
8.6
Graphic analysis
There are several graphics for detailed analysis of load curves and tariffs.
Each graphic is displayed in a separate window and can be printed out. Several
graphics and numerical reports may be displayed simultaneously.
Procedure
File ⇒ Open ⇒ Graph
• Tabs #1, #2, ...
Define one curve per tab if a graph should include several curves.
• In use
Select the project to be displayed.
• Tariff agreement
The colour graphics reflect the selected tariff agreement.
• Period
Specifies the time span for the graphic.
• from
Specifies the start date for the graphic.
• to
Specifies the end date for the graphic. Only specify when using a "Custom period".
• Maximum
By activating this field, the specified value is set as the upper limit for the Y-axis. If the
metering values exceed this limit, the highest metered value is used as the limit
instead.
• Minimum
By activating this field, the specified value is set as the lower limit for the Y-axis. If
some metering values are below this limit, the lowest metered value is used as the
limit instead.
• Type of curve
Specifies the type of graphic (see next section).
Landis+Gyr
EDC-S V3.5 1004 en
EDC User Manual
Data analysis
8-27
NOTE
Define a maximum value if several curves should be displayed on the same graph, or
when wanting to compare different graphs. Load curve analysis is simplified when using
the same scale.
8-28
EDC User Manual
Data analysis
Landis+Gyr
EDC-S V3.5 1004 en
8.6.1
Curve types
Load curve
The load curve depicts the time and energy consumption on the x- and y- axes
respectively. Load curves are usually of a periodic nature. Any changes in their periodic
behaviour quickly become apparent.
Load duration curve
Load duration curves indicate the duration (x-axis) that a certain demand level was
exceeded (y-axis). An arbitrary analysis period may be chosen.
Load duration curves are used for the qualitative assessment of energy consumption.
A typical consumption profile with high peak demand and relatively low continuous
consumption is shown in blue, whereas the red curve corresponds to profiles with a
fairly constant consumption level.
Landis+Gyr
EDC-S V3.5 1004 en
EDC User Manual
Data analysis
8-29
96-hour values
The 96-hour tariff is used to determine the maximum energy consumption in the last 96
hour period. The graphic depicts the energy consumption in the last 96 hours for each
hour of the analysis period. This results in a smoothed curve which generally reaches its
peak towards the end of the working week.
In the above example, the load profile and 96-hour values are shown as light and dark
curves respectively. The 96-hour curve data is automatically calculated from the
demand values.
Temperature
8-30
This graph has a y-axis which is automatically set to ± 50 °C. Otherwise, the curve is
identical to that for the “Load curve” graphic.
EDC User Manual
Data analysis
Landis+Gyr
EDC-S V3.5 1004 en
8.6.2
The graphic window
The graphic window has the same basic structure for all types of curve. A toolbar with
various functions is provided for the user. Each graphic is supplemented with additional
information to help localise maximums or other metered values.
The following information and functions are provided in a graphic:
• A : Expand the value axis
Use these functions to expand/shrink the value axis by 10%. The lowest values may
become hidden.
For a value range of 0 .. 4000 kW the display range will be reduced by 10% i.e. 400
kW every time the axis is expanded. After the first zoom, the value range will be 400
to 4000 kW, after the second 800 to 4000 kW etc…. Zooming out has the exact
opposite effect.
• B : Move cursor
Use the keyboard cursor keys to move cursor line K. The 6 other function keys may
be used to move the cursor line more quickly or to position it at the edge of the graph.
• C : Expand the time axis
Use these 4 buttons to expand/shrink the time axis. Expansion or compression of the
graph is always centred around cursor line K.
Use the justification function to set the time at the left edge of the graph to 00:00.
• D : New content
Press this button to open the dialogue "Select cross summation”. All graph settings
may now be modified.
Landis+Gyr
EDC-S V3.5 1004 en
EDC User Manual
Data analysis
8-31
• E : Notes, dialogue and demand limit
Use the button "Display notes" to display/hide comments to the raw values. Press the
button "Notes" to display a list of all notes for this metering data.
The “demand limit” function provides an auxiliary line that simulates a load
management system. The demand above this line is shifted to later integrating
periods The position of this line may be adjusted in percentage steps.
This graphic gives a quick indication on the potential effectiveness of a load
management system in reducing peak demand.
• F : Colour
Use this function to change the colour settings for the graphic.
• G : Graph data
Press this button to show the current display resolution and analysis period.
• H : Curve data
The maximum and its time of occurrence are displayed for each curve next to cursor
line K in the same colour as the curve.
• I : Maximum mark
The maximum of each curve is marked by a coloured line. Its numerical value is given
in footer H.
• K : Cursor line
The cursor line may be moved to any point on the graph. The current metering value
and time stamp are given in footer H.
8-32
EDC User Manual
Data analysis
Landis+Gyr
EDC-S V3.5 1004 en
8.7
Histograms
Histograms are used to show the number of integrating periods within a given demand
band. They are used to determine the typical (average) demand level of a consumer.
The data is displayed both graphically and numerically.
Procedure
File ⇒ Open ⇒ Histogram
1.
Select the analysis period.
2.
Select a project.
The histogram
The graph clearly shows that the energy consumption falls into four distinct bands.
Interpreting this data together with the load curve leads to the following conclusions:
• Demand 0 .. 100 kW
Data was not acquired for almost a whole month, hence there are numerous
integrating periods with a demand of zero.
Landis+Gyr
EDC-S V3.5 1004 en
EDC User Manual
Data analysis
8-33
• Demand 800 .. 1100 kW
During weekends the demand drops to this level.
• Demand 1400 .. 1700 kW
Corresponds to the demand level on weekday nights and Saturday mornings.
• Demand 3000 .. 3900 kW
Corresponds to the demand between 8 a.m. and 5 p.m. on working days.
Press the
chart.
button to select the class width and demand range for each bar on the
Increasing the class width to 400 Watts per bar gives a clearer indication of the load
bands 800 - 1200 Watts and 3200 - 3600 Watts.
8-34
EDC User Manual
Data analysis
Landis+Gyr
EDC-S V3.5 1004 en
8.8
Analysing spontaneous events
Most RTUs store any abnormal events in a so-called spontaneous buffer. The contents
of this buffer may be acquired and analysed.
Procedure:
Display ⇒ Presentation
Data management ⇒ Spontaneous events…
Select an RTU
⇒ OK
Display
Time:
Time that the event occurred
Type of event, Old value, New value:
The significance of the status information varies from RTU to RTU. Please consult the
relevant product manuals for a precise interpretation.
The above example shows the spontaneous buffer contents of a METCOM MTT3A,
whose time has been set several times.
Landis+Gyr
EDC-S V3.5 1004 en
EDC User Manual
Data analysis
8-35
8-36
EDC User Manual
Data analysis
Landis+Gyr
EDC-S V3.5 1004 en
9
Synthetic load profile
9.1
Purpose
A synthetic load profile is a manually constructed load profile. If a measured load profile
exists for each type of customer, e.g. bakery, restaurant, household, a synthetic load
profile can be defined for each type of customer based on the measured load profile.
The defined synthetic load profile can then be used, together with the acquired billing
values, to calculate a synthetic load profile for each individual customer.
The advantage of using synthetic load profiles is that not every premise has to be fitted
with an expensive load profile meter. The majority of premises can be fitted with a
simpler, less expensive billing meter.
9.2
Synthetic load profile definitions
A synthetic load profile definition comprises interval definitions and a calculation
definition.
Value
Synthetic
Load Profile
Calculation Definition
Load Profile
Coefficient
Interval
Definition
Time
Each synthetic load profile coefficient must be a complete year. Year definitions are
made up of week definitions. Week definitions are made up of day definitions. Day
definitions are made up of typical energy values for each integrating period.
A calculation is defined for each RTU. The RTU must already be defined in EDC. The
calculation references the defined synthetic load profile and the billing values from the
chosen RTU and calculates the synthetic load profile.
Landis+Gyr
EDC-S V3.5 1004 en
EDC User Manual
Synthetic load profile
9-1
9.2.1
Day definition
To define a day definition:
Procedure
Synthetic load profile ⇒ Definition ⇒ Day
Click New to define a new day definition
Enter the Name of the day definition.
Import load profile
Click Import to import an existing load profile. In this case, the integrating period is
determined by the selected file. The load profile may already have been exported from
EDC in text format. The default file location is EDC\SYNLP.
How to export data is described in the Data export chapter.
Enter load profile manually
Select the integrating period from the Period list.
Manually enter a value for each integrating period.
Click Save to save the day definition. The definition is entered in the list.
Click Delete to delete the selected definition.
Click Close to close the window.
9-2
EDC User Manual
Synthetic load profile
Landis+Gyr
EDC-S V3.5 1004 en
9.2.2
Week definition
The day definitions must already exist before a week definition can be defined. How to
define a day definition is described in the previous paragraph.
Procedure
Synthetic load profile ⇒ Definition ⇒ Week.
Click New to define a new week definition.
Enter the Name of the week definition.
Select a day definition for each day from the drop down list.
Click Save to save the week definition. The definition is entered in the list.
Click Delete to delete the selected definition.
Click Close to close the window.
Landis+Gyr
EDC-S V3.5 1004 en
EDC User Manual
Synthetic load profile
9-3
9.2.3
Year definition
The week definitions must already exist before a year definition can be defined. How to
define a week definition is described in the previous paragraph.
Procedure
Synthetic load profile ⇒ Definition ⇒ Year.
Click New to define a new year definition.
Enter the Name of the year definition.
The Start date is set to the 1st of January of the current year. The End date is selected
using the calendar.
Step forwards and backwards through the months using the arrows, then click the
desired date. If an end date is selected that is less than a complete year, the start date
of the next period is entered automatically.
Select a week definition for each period from the drop down list.
NOTE
Each synthetic load profile coefficient must be a complete year. It is, therefore, not
possible to save the definition if the year is not complete.
Click Save to save the year definition. The definition is entered in the list.
Click Delete to delete the selected definition.
Click View to display the synthetic load profile values. A Search function enables you to
display the value on a specific day at a specific time.
Click Close to close the window.
9-4
EDC User Manual
Synthetic load profile
Landis+Gyr
EDC-S V3.5 1004 en
9.2.4
Calculation definition
RTU and synthetic load profile definitions must already exist before a calculation can be
defined for that RTU.
Procedure
Synthetic load profile ⇒ Definition ⇒ Calculation.
Click New to define a new calculation definition.
Select the Latest data storage date from the calendar. This is the last time data from
this meter was stored in EDC. The default is the current date.
Enter the Last energy billing value, i.e. the value stored at the date selected above.
NOTE
The Latest data storage and Last energy billing value are automatically updated
when a calculation is made.
Enter the Name of the calculation definition.
Select the desired Synthetic load profile from the list.
Select the desired Periodic buffer name from the list. Periodic buffers are defined in
Definitions ⇒ RTU.
Enter the Device number. This is the number of the meter whose billing values are
used to calculate the synthetic load profile.
NOTE
The device number must be managed by the user. EDC does not check whether the
number is valid.
Enter the Identification code key of the meter in each field. The default is the
identification code for the ZMB meter.
Click Save to save the day definition. The definition is entered in the list.
Click Delete to delete the selected definition.
Click Close to close the window.
Landis+Gyr
EDC-S V3.5 1004 en
EDC User Manual
Synthetic load profile
9-5
9.2.5
Calculation list definition
To help you calculate a number of calculations quickly, they can be grouped into lists.
Procedure
Synthetic load profile ⇒ Definition ⇒ Calculation list.
Click New to define a new calculation list definition.
Enter the Name of the calculation list definition.
Click
to add the defined calculations sequentially to the list. To add individual
calculations to a list, select the desired calculation then click
.
Calculation can be removed sequentially from the list using
or selectively using
.
Click Save to save the calculation list definition. The definition is entered in the list.
Click Delete to delete the selected definition.
Click Close to close the window.
9-6
EDC User Manual
Synthetic load profile
Landis+Gyr
EDC-S V3.5 1004 en
9.3
Synthetic load profile calculation
When the synthetic load profile definitions (day, week, and year) and calculation
definition have been made, the synthetic load profile can be calculated. The synthetic
load profile may be calculated from the billing value file acquired by EDC or from a
billing value entered manually.
Single calculation
procedure
From file
Synthetic load profile ⇒ Calculation.
Select the desired calculation from the list.
Click the Input values from billing file(s) checkbox to use data acquired by EDC.
The period of billing starts from latest data storage and ends with the newest date and
time in EDC\Routen\*.abg file whose device number matches the device number in the
calculation definition. The billing values are also taken from this file.
NOTE
If the latest data storage is the same or more recent than the newest date and time in
the *.abg file, EDC will advise you that new billing values are needed to perform the
calculation.
Click Calculation to perform the synthetic load profile calculation. When the calculation
is complete, the Calculation button is dimmed.
or
Manual entry
Set the calculation period and time in the from and to fields using the calendar.
Enter the billing value for the entered period in the Energy total field.
Click Calculation to perform the synthetic load profile calculation. When the calculation
is complete, the Calculation button is dimmed.
The synthetic load profile data can now be processed the same as other load profile
data.
Landis+Gyr
EDC-S V3.5 1004 en
EDC User Manual
Synthetic load profile
9-7
List calculation
Synthetic load profile ⇒ Calculation.
Click the List tab.
Select the desired list.
The Input values from billing file(s) option is automatically selected and the other
fields disabled.
The period of billing starts from latest data storage and ends with the newest date and
time in EDC\Routen\*.abg file whose device number matches the device number in the
calculation definition. The billing values are also taken from this file.
NOTE
If the latest data storage is the same or more recent than the newest date and time in
the *.abg file, EDC will advise you that new billing values are needed to perform the
calculation.
Click Calculation to perform the synthetic load profile list calculation. When the list
calculation is complete, the Calculation button is dimmed.
The synthetic load profile data can now be processed the same as other load profile
data.
9-8
EDC User Manual
Synthetic load profile
Landis+Gyr
EDC-S V3.5 1004 en
10
System administration
10.1 The archiving system
EDC performance (response time) reduces with increasing data volume, however this is
not the only reason for archiving old data. The archiving of data and definitions is also
recommended when making changes to definitions or at the end of each business year.
Changing the archive
directory
The default archive path is A:, however it may be modified to another drive and/or
directory. If this is necessary, modify the file EDC.ini located in the EDC working
directory as follows:
Default settings:
[DIRECTORIES]
:
zstdir=C:\SIEMEN~1\DGC3_GC\ZST\
setupdir=A:\
bacdir=A:\
:
The row marked in bold type specifies the working directory. It may be changed, for
example, to a network directory:
[DIRECTORIES]
:
zstdir=C:\SIEMEN~1\DGC3_GC\ZST\
setupdir=A:\
bacdir=G:\arch300\1998\
:
NOTE
The archiving feature is based on the use of diskettes. The administration of different
directories is not supported.
If you do not wish to use diskettes, use the following archive directory structure to
simplify the procedure:
•
One directory per year for metering values, e.g.
..\Archiv\Messw\1998\...
..\Archiv\Messw\1999\...
•
For definitions, one directory per archiving operation, e.g.
..\Archiv\Definitionen\1998-08-03\...
..\Archiv\Definitionen\1998-11-27\...
The archive may also be located on the network. If one can ensure that only the central
station is able to store and administrate data in this archive, several workplaces may be
configured to access this data (read-only access).
Landis+Gyr
EDC-S V3.5 1004 en
EDC User Manual
System administration
10-1
10.1.1 Archiving metering values
Periodic buffers, spontaneous events and meter register values are all archived in the
same way.
Procedure
Display ⇒ Presentation
Data management ⇒ Backup/ archive ⇒ Raw values
Data management ⇒ Backup/ archive ⇒ Register values
Data management ⇒ Backup/ archive ⇒ Spontaneous events...
Database:
Lists all metering values that have data in the EDC database for the selected time
range.
Archive:
Lists all metering values that already been archived for the selected time range.
Year:
Select the year to be archived .
Tabs (months):
Select individual months to archive monthly data or All to archive data from the whole
year.
< >:
Press buttons > and < to copy the selected metering values from the database to the
archive and vice-versa respectively.
10-2
EDC User Manual
System administration
Landis+Gyr
EDC-S V3.5 1004 en
10.1.2 Archiving definitions
Procedure
Display ⇒ Presentation
Data management ⇒ Backup/ archive ⇒ Definitions
Database:
List of all available definitions in the EDC database.
Archive:
List of all archived EDC definitions.
Filenames:
DGUSDAT
TAB
TVA
FTL
SDT
KENNER
STAZ
RTU definitions
Tariff agreements
Tariff variants
Holidays
Special days
ID code keys
Status display
Older versions of EDC may also have the following archive files:
USER
PW
ZMBPW
User list for access management
User password list
Password for read-only access via the optical interface
< >:
Press buttons > and < to copy the selected definitions from the database to the archive
and vice-versa respectively.
NOTE
Existing archive files will be overwritten when starting the archiving procedure !
Therefore always use new diskettes or define a new directory before archiving.
Landis+Gyr
EDC-S V3.5 1004 en
EDC User Manual
System administration
10-3
10.1.3 Archiving projects and reports
Procedure
Display ⇒ Presentation
Data management ⇒ Backup/ archive ⇒ Project
Data management ⇒ Backup/ archive ⇒ Form
Database:
List of all available projects in the EDC database.
Archive:
List of all archived EDC projects.
Filenames:
The filenames correspond to those specified when saving the projects and forms
(save as).
< >:
Press buttons > and < to copy the selected projects from the database to the archive
and vice-versa respectively.
NOTE
Existing archive files will be overwritten when starting the archiving procedure !
Therefore always use new diskettes or define a new directory before archiving.
10-4
EDC User Manual
System administration
Landis+Gyr
EDC-S V3.5 1004 en
10.1.4 Deleting archived files
Once archiving has been performed, one may delete metering data and projects no
longer required.
Procedure
Display ⇒ Presentation
Data management ⇒ Delete ⇒ Raw values..
Data management ⇒ Delete ⇒ Register values...
Data management ⇒ Delete ⇒ Spontaneous events...
Data management ⇒ Delete ⇒ Projects
Select file
⇒ Delete
Year:
Select a year between 0 and 99.
Month:
Select a month between 1 and 12
NOTE
The delete action cannot be undone, i.e. the restoration of files is not supported.
•
Always archive files before deleting them.
10.1.5 Billing data maintenance
Billing data is stored in the directory EDC\ROUTEN. This directory is intended as the
interface to higher-level systems. Such systems periodically transfer the data and
subsequently delete the files in directory EDC\ROUTEN.
These files must be manually deleted if there are no higher-level systems performing
this task.
Procedure
Display ⇒ Presentation
File ⇒ Open ⇒ Billing data
Select file
Delete
Landis+Gyr
EDC-S V3.5 1004 en
EDC User Manual
System administration
10-5
10.2 Editing periodic buffers
Periodic buffer data may be edited. This is particularly useful when metering data could
not be acquired due to maintenance work or outages at the metering point.
Every modified value is flagged with a status bit. Comments on the changes may also
be stored with the value directly in the database.
Procedure
Display ⇒ Presentation
Data management ⇒ Input substitute values
Select a metering value
⇒ OK
Year:
Select a year between 0 and 99.
Month:
Select a month between 1 and 12
Dialogue
10-6
EDC User Manual
System administration
Landis+Gyr
EDC-S V3.5 1004 en
Date:
Date and time of integrating period closure.
Register value:
Meter register value (only displayed if such values have been acquired)
Raw value:
Metering value in periodic buffer.
Status:
Status information in the form of a bit pattern, followed by the character that should be
displayed (defined under "Definitions" - "Status indication").
Manual input:
Dialogue window for new metering values.
In the above example, the acquired value of 7.450 must be replaced by 7.400 as the
comparison with the billing data indicated a discrepancy caused by a measurement
error.
Note:
Used for noting the change in metering value or any other comment.
Once the manual change has been made, the original data cannot be restored, however
the new value is marked with a status bit:
NOTE
The manipulation of metering values may result in the misinterpretation of load profiles
and can lead to discrepancies between the billing and load profile data.
Landis+Gyr
EDC-S V3.5 1004 en
•
Modifications should only be made by authorised personnel.
•
The original values are lost once the changes have been made. Archive the values
before making any changes or enter the original value in the “Note” field.
EDC User Manual
System administration
10-7
10-8
EDC User Manual
System administration
Landis+Gyr
EDC-S V3.5 1004 en
11
Troubleshooting
11.1 Licence, Language
Keyword
Problem:
Proposed solution:
Licence
Where should I enter
the licence?
Procedure:
Menu Help Ö About:
Press licence and enter the licence details:
i.e. licence, no. of periodic buffers, licence key
Licence,
RTU
Definition
It is not possible to
create any new
RTUs .
Your licence is
limited to a
maximum number of
RTUs.
Please contact your local Landis+Gyr
representative.
New
language
How can I add a
new language?
Use the EDC
Language
Translation Tool to
add new languages.
1. Start the EDC Language Translation Tool
(Lang.exe)
Note:
The Language
Translation Tool is
only intended for use
by local group
companies.
Open library Tvstrcon.pas using menu
File ÖOpen
Add a new language using menu
Edit Ö New Language
Perform the translation based on an existing
language. Use the search and replace functions to
assist in the translation.
Export the language using menu
Edit Ö Export (*.str)
Archive the new library using menu
File Ö Save as..
Changing
language
How can I change
the language?
Landis+Gyr
EDC-S V3.5 1004 en
EDC User Manual
Troubleshooting
Press the language button in the dialogue and select
a new language. Restart the EDC.
11-1
11.2 Troubleshooting modem installations for remote acquisition
If required, EDC can store all the data traffic in a file. Activate the data recording
function:
Preparations:
Definitions ⇒ System ⇒ Data storage
There are two available settings:
Logging to file:
Suited to technically skilled EDC users who wish to solve any modem and
communication problems.
Detailed logging:
This provides a lot of detailed information and is intended for support by EDC software
engineers.
For troubleshooting select the “Logging to file” setting.
Keyword
Problem:
Proposed solution:
Procedure:
Modem,
Initialise
Modem cannot be
initialised.
Check the modem
connection and the
communication line
definition.
1.
Is the modem connected to the PC by a modem
cable?
2.
Is the port number (COM) correct?
3.
Is the baud rate correct?
4.
Is the modem initialisation correct?
FKJ11.1:
AT&F3
ZyXEL:
AT
Logem:
AT&V0
1.
Has the modem been connected to the
telephone socket?
2.
Is the dialling mode correct?
(tone or pulse)
3.
If you are not using an original modem cable, it
may be that RX and TX are reversed. Check the
configuration e.g. with an RS232 test adapter or
with an existing application that you are familiar
with.
The recorded file
contains the
message:
Transmit:
ATV1[0D]Message
:
Mt. Rigi Demo
ended
Modem,
Dial
Modem does not
detect a line.
The recorded file
contains the
message:
Check if the modem
has been connected
to the telephone
socket.
Receive:
OK[0D][0A]ATDT0
w8550035[0D][0D
][0A]NO[20]DIAL
TONMessage:
11-2
EDC User Manual
Troubleshooting
Landis+Gyr
EDC-S V3.5 1004 en
Keyword
Problem:
Proposed solution:
Procedure:
Modem,
Dial
Telephone number
cannot be dialled.
Using a telephone,
check if the dialled
number really exists
and is attainable.
1.
You should hear modem noises.
2.
Is a prefix necessary?
Z.B. 0 8550035
3.
Enter the character “w” if one has to wait for a
dialling tone.
e.g. 0w8550035
4.
If possible, attempt to dial the number using
another telephone, e.g. using a mobile
telephone.
5.
Check with the responsible authorities that the
telephone number is not blocked by the in-house
exchange (PBX) or public network operator
(PSTN).
The recorded file
contains the
message:
Receive:
OK[0D][0A]ATDT0
w8550036[0D][0D
][0A]NO[20]CARR
IEMessage:
Modem,
InitCom
Data could not be
acquired even
though the modem
connection was
established.
The recording shows
that the EDC
attempted to
initialise the RTU 5
times.
Check the RTU
communication
number, the
password and the
communication
protocol.
Check the menu settings under
Definitions Ö RTU:
1.
Communication number
2.
Password
3.
Has the correct protocol been selected for the
RTU? e.g. V22, V22bis, V23
The recording will show the connection parameters.
Receive:
Message:
OK[0D][0A]ATDT0w8550035[0D][0D][0A]CONN
ECT[20]2400/V.22b[20]2400/NONE[0D][0A]
InitCom
Transmit:
[01]1425340?000
:[03][01]142534
0?000:[03][01]1
425340?000:[03]
[01]1425340?000
:
Check the settings with the department responsible
for RTUs.
[03][01]1425340
?000:[03]
Landis+Gyr
EDC-S V3.5 1004 en
EDC User Manual
Troubleshooting
11-3
Keyword
Problem:
Proposed solution:
Procedure:
Modem, no
data
The data is acquired
but not saved.
Check the data
format and RTU
configuration.
EDC checks the amount of transferred data against
the RTU definition. If they do not correspond, the
message „Wrong amount of bytes collected, data
dismissed“ appears in the recorded file
Message:
Periodic
Buffer: Start:
30.05.00
12:00:00 End:
31.05.00
11:45:00
Periods: 96
Dec: 4 Points:
3 bytes
collected: 2708
estimated: 2132
Message:
Wrong amount of
bytes
collected, data
dismissed
11-4
EDC User Manual
Troubleshooting
Check the menu settings under
Definitions Ö RTU:
1.
RTU type
2.
Periodic buffer
3.
No. of decades
4.
Integrating period
5.
Metering values
6.
Check the settings with the department
responsible for RTUs..
The message „amount of bytes collected ok, data
accepted“ will appear in the recorded file if
acquisition and storage were successful.
Landis+Gyr
EDC-S V3.5 1004 en
11.3 Local read-out
Keyword
Problem:
Proposed solution:
Procedure:
Local readout
The message
„Windows NT
required“ appears.
Note:
Local read-out is not
supported by
Windows 95.
Solve the problem as follows.
Identifier is
not defined
The locally read-out
load profile cannot
be imported.
The ident. codes still
need to be defined.
Ident. codes
Missing
local readout
The dialogue under
menu
File Ö Import Ö
Local reading
Does not display all
local read-outs
stored in the \Taridat
directory.
Landis+Gyr
EDC-S V3.5 1004 en
Note:
1.
Install EDC under the Windows NT operating
system.
2.
If you have an older version, e.g. V2.4, use it in
this case.
Check the menu settings under
Definitions Ö System and define the ident. codes,
e.g.
1.
Device ID:
/LGZ
2.
Device number:
0
3.
Date:
12
4.
Time:
11
5.
Load profile:
80
Delete the file \Taridat\Index.tmp
EDC only shows
semantics of
acceptable local
read-outs.
Also see file:
Index.tmp
EDC User Manual
Troubleshooting
11-5
11-6
EDC User Manual
Troubleshooting
Landis+Gyr
EDC-S V3.5 1004 en