1
MultiLab
Powerful and simple to use analysis
software with video and audio features
Supporting:
USB Link and MultiLogPRO
Data Loggers
User Guide for PC
MultiLab PC User
Guide
For USBLink and
MultiLogPRO Data
Loggers
Fifteenth Edition, First Print
September 2010
Released with MultiLab v1.5
© 2009 Fourier Systems Ltd. All rights reserved. Reproduction of this document in any
manner without the prior written consent of Fourier Systems Ltd. is strictly forbidden.
Contents
What’s New in MultiLab v1.5? ....................................................................................................1
Introduction
.............................................................................................................................1
USBLink Overview..................................................................................................................1
MultiLogPRO Overview ..........................................................................................................2
HP SS410 Overview ...............................................................................................................2
User Guide Overview .............................................................................................................3
Chapter 1
USBLink...............................................................................................................4
1.1. General........................................................................................................................4
1.1.1.
USBLink System Contents .................................................................................4
1.1.2.
External Connections..........................................................................................4
1.1.3.
Powering the USBLink........................................................................................5
1.1.4.
USBLink Memory................................................................................................5
1.1.5.
Input Modes ........................................................................................................6
1. Auto ID .....................................................................................................6
2. 8 Inputs ....................................................................................................6
1.1.6.
Quick-Start..........................................................................................................6
1.1.7.
Updating USBLink Firmware ..............................................................................7
1.1.8.
Choose the Right Setup .....................................................................................7
1. Sampling Rate .........................................................................................7
2. Sampling Points .......................................................................................8
1.1.9.
Programming Rules and Limitations...................................................................9
1. Sampling Points .......................................................................................9
2. Maximum Sampling Rate.........................................................................9
3. Continuous Sampling...............................................................................9
1.2. Sensor Calibration.....................................................................................................10
1.2.1.
Hardware Offset Calibration .............................................................................10
1.2.2.
USBLink Automatic Zero Calibration ................................................................10
1.2.3.
pH Temperature Compensation .......................................................................11
1.2.4.
DO2 Calibration .................................................................................................11
1.2.5.
MultiLab Sensor Calibration .............................................................................11
1.2.6.
Factory Calibration (No Calibration Required) .................................................11
Chapter 2
MultiLogPRO .....................................................................................................12
2.1. General......................................................................................................................12
2.1.1.
MultiLogPRO System Contents........................................................................12
2.1.2.
External Connections........................................................................................13
2.1.3.
Battery...............................................................................................................14
2.1.4.
AC/DC Adaptor .................................................................................................14
2.1.5.
Automatic Shut-off ............................................................................................15
2.2. Standalone Operation ...............................................................................................15
2.2.1.
Front Panel Layout ...........................................................................................15
2.2.2.
Input Modes ......................................................................................................16
1. Auto ID ...................................................................................................16
2. 8 Inputs ..................................................................................................16
2.2.3.
Quick-Start........................................................................................................16
2.2.4.
Working with the MultiLogPRO Menus.............................................................19
1. Turning MultiLogPRO On and Off .........................................................19
2. Main Menu Display ................................................................................19
3. Menu Buttons.........................................................................................19
4. Menu Icons and Commands..................................................................20
2.2.5.
Graphic Display ................................................................................................22
1. The Cursor .............................................................................................22
2. Zooming .................................................................................................22
2.2.6.
Measuring Timing Events .................................................................................22
1. Stopwatch ..............................................................................................23
2. Time and Speed ....................................................................................24
3. Time, Speed and Acceleration ..............................................................25
2.2.7.
Select Sensors Manually ..................................................................................26
2.2.8.
Load the Last Setup..........................................................................................27
2.2.9.
Configure Your MultiLogPRO ...........................................................................27
1. Input Mode .............................................................................................27
2. Clear Memory ........................................................................................28
3. DO2 Sensor Calibration .........................................................................28
4. Screen Contrast.....................................................................................28
5. Connect to a Computer or to a TI Calculator.........................................28
2.2.10. Internal Clock and Calendar .............................................................................28
2.2.11. Clear the Memory .............................................................................................29
2.2.12. Choose the Right Setup ...................................................................................29
2.2.13. Programming Rules and Limitations.................................................................30
1. Sampling Points .....................................................................................30
2. Sampling Rate .......................................................................................31
3. Continuous Sampling.............................................................................31
2.3. Sensor Calibration.....................................................................................................32
2.3.1.
Hardware Offset Calibration .............................................................................32
2.3.2.
MultiLogPRO Automatic Zero Calibration ........................................................32
2.3.3.
pH Temperature Compensation .......................................................................33
2.3.4.
DO2 Calibration .................................................................................................33
2.3.5.
MultiLab Sensor Calibration .............................................................................33
2.3.6.
Factory Calibration (No Calibration Required) .................................................33
Chapter 3
MultiLab Software..............................................................................................34
3.1. Installing the Software...............................................................................................34
3.1.1.
System Requirements ......................................................................................34
1. Windows ................................................................................................34
2. Mac OS ..................................................................................................34
3.1.2.
Multiple Language Support...............................................................................35
3.1.3.
MultiLab Installation on Windows OS ...............................................................35
3.1.4.
MultiLab Installation on Mac OS.......................................................................36
3.1.5.
Installing USB Driver for USBLink ....................................................................36
1. On MultiLab v1.4.22 and higher ............................................................36
2. On MultiLab v1.4.21 and older ..............................................................36
3.1.6.
Installing USB Driver for MultiLogPRO.............................................................37
1. On MultiLab v1.4.22 and higher ............................................................37
2. On MultiLab v1.4.21 and older ..............................................................37
3.1.7.
Uninstalling MultiLab.........................................................................................38
3.2. Overview ...................................................................................................................40
3.2.1.
MultiLab On-screen Layout ..............................................................................40
3.2.2.
MultiLab Window Layout ..................................................................................40
3.2.3.
Working with Projects .......................................................................................41
3.3. Getting Started ..........................................................................................................41
3.3.1.
Set up a Recording Session .............................................................................41
1. Prepare the USBLink .............................................................................41
2. Prepare the MultiLogPRO......................................................................41
3. Enable Video Recording ........................................................................41
4. Setup the USBLink/MultiLogPRO..........................................................42
5. Start Recording......................................................................................42
3.3.2.
Data Recording Options ...................................................................................42
1. Single Measurement..............................................................................42
2. Replace..................................................................................................42
3. Add.........................................................................................................42
3.3.3.
Manual Sampling ..............................................................................................43
3.3.4.
Online Video .....................................................................................................43
1. Online Video ..........................................................................................43
2. Recording...............................................................................................43
3. Replaying an Experiment.......................................................................44
4. Video and Audio Properties ...................................................................44
3.3.5.
Download Data from the USBLink....................................................................44
3.3.6.
Download Data from the MultiLogPRO ............................................................44
3.3.7.
The Timer Module.............................................................................................45
1. Working with the Timer Module Wizard.................................................45
2. Measuring Methods ...............................................................................46
3. Time Schemes and Calculations ...........................................................48
3.3.8.
Save Data .........................................................................................................50
3.3.9.
Open a File .......................................................................................................50
3.3.10. Create a New Project........................................................................................50
3.3.11. Import Data .......................................................................................................50
3.3.12. Print...................................................................................................................51
1. Print a Graph..........................................................................................51
2. Print a Table...........................................................................................52
3.4. Viewing the Data .......................................................................................................53
3.4.1.
Display Options.................................................................................................53
3.4.2.
Graph Display ...................................................................................................53
1. Split Graph View ....................................................................................54
2. The Cursor .............................................................................................54
3. Zooming .................................................................................................55
4. Manual scaling.......................................................................................55
5. The Stretch/Compress Axis tool ............................................................56
6. Panning..................................................................................................56
7. Edit the Graph........................................................................................56
8. Format the Graph ..................................................................................57
9. Change the Graph’s Units and its Number Format ...............................57
10. Add Annotations to the Graph .............................................................58
11. Add a Graph to the Project ..................................................................59
3.4.3.
The Table Display.............................................................................................59
1. Editing Data Values ...............................................................................59
2. Editing the Table ....................................................................................59
3. Formatting the Table..............................................................................60
4. Add a Table to the Project .....................................................................60
3.4.4.
Meters ...............................................................................................................61
3.4.5.
Data Map ..........................................................................................................61
1. Control the Display with the Data Map ..................................................61
2. Understanding Data Map Icons .............................................................62
3.4.6.
Export Data to Excel .........................................................................................63
1. Export File Settings................................................................................63
3.4.7.
Copy the Graph as a Picture ............................................................................63
3.5. Programming the Data Logger..................................................................................64
3.5.1.
Setup.................................................................................................................64
1. Quick Setup ...........................................................................................64
2. Defining Sensor Properties....................................................................65
3. Setting the Zero Point of a Sensor ........................................................66
4. Presetting the Display............................................................................67
5. Presetting the Graph’s X-axis ................................................................67
6. Triggering...............................................................................................68
3.5.2.
Start Recording.................................................................................................70
3.5.3.
Stop Recording .................................................................................................70
3.5.4.
Clear USBLink’s Memory .................................................................................70
3.5.5.
Clear MultiLogPRO’s Memory ..........................................................................70
3.5.6.
Edit MultiLogPRO’s Experiment Notes.............................................................70
3.5.7.
Calibrating the Sensors ....................................................................................71
3.5.8.
Define a Custom Sensor ..................................................................................71
3.5.9.
Communication Setup ......................................................................................72
3.6. Analyzing the Data ....................................................................................................74
3.6.1.
Reading Data Point Coordinates ......................................................................74
3.6.2.
Reading the Difference between two Coordinate Values.................................74
3.6.3.
Working with the Analysis Tools.......................................................................74
3.6.4.
Smoothing.........................................................................................................74
3.6.5.
Statistics............................................................................................................75
3.6.6.
Most Common Analysis Functions ...................................................................75
1. Linear Fit ................................................................................................75
2. Derivative ...............................................................................................75
3. Integral ...................................................................................................76
3.6.7.
The Analysis Wizard .........................................................................................76
1. Using the Analysis Wizard .....................................................................76
2. Curve Fit ................................................................................................76
3. Averaging...............................................................................................77
4. Functions ...............................................................................................78
5. Editing a Function ..................................................................................79
3.6.8.
Available Analysis Tools ...................................................................................79
1. Curve Fit ................................................................................................79
2. Averaging...............................................................................................80
3. Functions ...............................................................................................80
3.6.9.
Online Analysis .................................................................................................83
3.6.10. Manual Curve Fitting.........................................................................................85
3.7. Video Motion Analyzer ..............................................................................................86
3.7.1.
Overview ...........................................................................................................86
3.7.2.
Getting Started..................................................................................................86
1. Video Motion Analyzer Basics ...............................................................86
2. Saving a New Movie ..............................................................................87
3. Opening a Stored Movie ........................................................................87
4. Saving a Video Motion Analyzer Project ...............................................87
5. Opening a Video Motion Analyzer Project.............................................87
3.7.3.
Capturing a New Movie ....................................................................................87
1. From a Device Attached to your Computer ...........................................87
2. From an External Source through a Video Board .................................88
3.7.4.
Capturing Position and Time ............................................................................89
1. Scaling ...................................................................................................89
2. Set Coordinate System..........................................................................90
3. Set Step .................................................................................................91
4. Mark the Video.......................................................................................91
5. Changing the Colors of the Marker and the Axes .................................94
3.7.5.
Analyzing the Data............................................................................................94
3.8. Workbook ..................................................................................................................95
3.8.1.
Working with Workbook....................................................................................95
3.8.2.
Opening a Worksheet.......................................................................................95
3.8.3.
Create Your Own Worksheet............................................................................96
1. Create an HTML Document with Word..................................................96
2. Create a Configuration File....................................................................96
3.9. Special Tools.............................................................................................................98
3.9.1.
Predicting ..........................................................................................................98
3.9.2.
The Timing Wizard............................................................................................98
1. Overview ................................................................................................98
2. Working with the Timing Wizard ............................................................99
3. Measuring Methods .............................................................................100
4. Time Schemes and Calculations .........................................................102
5. Tips on using the Timing Wizard .........................................................105
3.9.3.
Crop Tool ........................................................................................................106
1. To Trim all Data up to a Point ..............................................................106
2. To Trim all Data Outside a Selected Range ........................................106
3.9.4.
Capture Tool ...................................................................................................106
1. Preparing the Capture Table ...............................................................107
2. Capturing Data.....................................................................................108
3. Displaying the Captured Data on the Graph .......................................108
3.10. Toolbar Buttons .......................................................................................................109
3.10.1. Main (Upper) Toolbar .....................................................................................109
3.10.2. Graph Toolbar.................................................................................................110
3.10.3. Table Toolbar..................................................................................................111
3.10.4. Video Motion Analyzer Toolbar ......................................................................111
3.10.5. Capture New Movie Toolbar...........................................................................112
Chapter 4
4.1.
4.2.
4.3.
4.4.
4.5.
Working with a TI Calculator ...........................................................................113
Overview .................................................................................................................113
Installing the Software.............................................................................................113
Getting Started ........................................................................................................113
1. Prepare MultiLogPRO..........................................................................113
2. Run MultiLab on a TI Calculator ..........................................................114
3. Setup MultiLogPRO .............................................................................114
4. Start Recording....................................................................................115
5. View the Data.......................................................................................116
6. Downloading Data ...............................................................................116
The Graph Display ..................................................................................................116
1. The Cursor ...........................................................................................116
2. Zooming ...............................................................................................116
3. Rescaling .............................................................................................117
4. Auto Scaling.........................................................................................117
5. X – Axis Scaling ...................................................................................118
6. Y – Axis Scaling ...................................................................................118
7. Choosing the X–axis............................................................................119
Analyzing the Data ..................................................................................................119
1. Applying an Analysis Tool....................................................................119
2. Curve Fit ..............................................................................................120
4.6.
4.7.
4.8.
3. User Curve Fit......................................................................................121
4. Statistics...............................................................................................121
5. Integral .................................................................................................122
Data Collection Modes ............................................................................................123
1. Log Data ..............................................................................................123
2. Time Graph ..........................................................................................124
3. Events with Entry .................................................................................124
4. Single Point..........................................................................................124
5. Selected Event.....................................................................................125
Conditioned Data Collection....................................................................................125
1. To Enable Triggering ...........................................................................125
2. To Disable the Triggering Condition ....................................................126
Calibrating the Sensors...........................................................................................126
1. To Calibrate a Sensor..........................................................................126
2. To Restore the Default Calibration Values ..........................................127
Chapter 5
Troubleshooting Guide ....................................................................................128
Chapter 6
Specifications ..................................................................................................131
6.1. The USBLink Data Logger ......................................................................................131
6.2. The MultiLogPRO Data Logger...............................................................................132
6.3. Supported Sensors .................................................................................................134
6.3.1.
Supported Fourier Systems Sensors .............................................................134
6.3.2.
Supported Vernier Sensors ............................................................................135
6.3.3.
Supported Data Harvest Sensors...................................................................137
6.4. Accessories .............................................................................................................138
6.5. MultiLab Software (Windows and Mac OS) ............................................................139
6.6. MultiLab Software (TI-83 PLUS Calculator)............................................................140
Appendix A: Figures ...............................................................................................................141
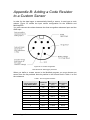
Appendix B: Adding a Code Resistor to a Custom Sensor ....................................................142
Index
.........................................................................................................................143
What’s New in MultiLab v1.5?
This edition of the MultiLab User Guide includes the following updates, which were
released with v1.5 of the MultiLab software:
•
Integrated support for HP StreamSmart 410 data streamer
•
Support for French and German language interface
Previous Versions
MultiLab 1.4.22 – March 2010
•
Updated installation procedure for the USBLink USB driver. Refer to 36 for more
details.
•
Updated FTDI USB driver for the MultiLogPRO, supporting Windows 7 as well as
automatic driver installation on Windows operating systems. Refer to 37 for more
details.
•
Support for Latvian language interface.
Introduction
MultiLab is a comprehensive PC software program that supports the full range of
Fourier Systems data loggers. It provides everything you need in order to collect
data, display the data in graphs, meters and tables, analyze the data with
sophisticated analysis tools and even view online or recorded video movies of the
actual experiment.
MultiLab supports the following products:
•
USBLink
•
MultiLogPRO
•
HP StreamSmart 410 data streamer (refer to separate user guide for this product)
MultiLab includes four displays: Graph, Table, Video, and a navigation display called
the Data Map. You can view all four displays simultaneously or view any combination
of the four.
Unique video and audio features allow students to view online or recorded movies.
Using a Web cam, students can film their experiment process, while the experiment
data is displayed in graph, or meter format. Students can participate in e-learning
projects, since MultiLab allows them to produce complete multimedia lab reports with
real-time, synchronized annotated graphs and video.
Another useful feature is the Workbook tool. This gives students a step-by-step
preview of the Lab activity to be conducted, and then automatically configures the
MultiLab program and sets up the data logger so that the student can begin collecting
the data. You can open an existing Workbook or create a new one.
MultiLab also includes a Video Motion Analyzer module that enables you to capture
position and time from video movies and analyze the data with MultiLab’s analysis
tools.
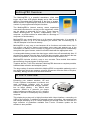
USBLink Overview
To enhance your student computing solutions, Fourier
incorporates our science and math legacy into our latest
offering - the USBLink. We are presenting this together with
our broad curriculum, probeware and analysis software as a
distinct science solution. USBLink is a powerful, yet simple
probe interface providing the key for a science hands-on
solution to accompany every student computer.
This simple plug-n-play unit is highly-functional with 4-input
interface, connecting via USB to the computer, in addition to
automatic sensor recognition, fast sampling rate and sample streaming of up to
10,000 samples per second. Users can connect to a large selection of probeware
available from Fourier. Firmware update via the software is also possible.
Students using any Web camera, together with the USBLink and Fourier probes can
create multimedia science projects combining video, sound, text and samples of any
experiment activity. Complemented by the Fourier vast curriculum library, K-12
teachers and students can experiment in all subjects: Physics, Chemistry, Biology,
Environmental Sciences and Math.
Introduction
1
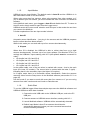
MultiLogPRO Overview
The MultiLogPRO is a powerful standalone 12-bit data
logger with a clear LCD graphic display and a 128K internal
memory. Recorded data is displayed in the form of graphs,
tables, meters or digital displays, and can be analyzed with a
number of pre-programmed analysis functions.
The MultiLogPRO’s internal memory stores experiment
notes and instructions for carrying out the experiment, which
can be edited or expanded at any time. These features
enable MultiLogPRO to function independently from a
computer - a perfect solution for when there is a shortage of
computers in the laboratory.
MultiLogPRO can record data from up to 8 sensors simultaneously; it is capable of
recording at rates of up to 21,000 samples per second, and of collecting up to
100,000 samples in its internal memory.
MultiLogPRO is very easy to use because all its functions are broken down into 8
icon menus, and its four buttons can browse every menu and execute any of the
commands. In addition, when a sensor is plugged in, the MultiLogPRO automatically
recognizes the type of sensor, and will record the data with the appropriate units.
A rechargeable battery powers the data logger, which shuts off automatically after 15
minutes have passed since the time of the last data recording, since the time the last
button was pressed, or since the time the last communication with the PC.
MultiLogPRO includes a built-in, easy to use, accurate Timer module that enables
the measuring of several types of timing events.
Together with the TI–83 Plus calculator, MultiLogPRO becomes a complete portable,
handheld data collection and analysis system.
The large variety of sensors with which MultiLogPRO is compatible makes the unit a
true digital Lab, which can measure scientific phenomena from the fields of Physics,
Chemistry, Biology and the environmental sciences.
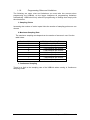
HP SS410 Overview
Enhancing your student solutions, HP and
Fourier Systems incorporates its science and
math technology together with its broad
curriculum, probeware and analysis software,
into its latest offering - the SS410 data
streamer. SS410 is a powerful, yet simple
probe interface providing the key for a science
hands-on solution to accompany every student
computer.
This simple plug-n-play unit is highly-functional with 4-input interface, connecting via
USB to the computer, in addition to automatic sensor recognition, fast sampling rate
and sample streaming of up to 10,000 samples per second. Users can connect to a
large selection of probeware available from Fourier. Firmware update via the
software is also possible.
2
Introduction
In addition, the SS410 also connects to the HP 39gs and 40gs Graphing Calculator.
More information on this solution is available from HP and from the SS410 User
Guide, included on the MultiLab software CD.
User Guide Overview
This manual is divided into seven chapters:
• The Introduction provides an overview of the MultiLab supported
products.
• Chapters 1 and 2 are dedicated to the USBLink and MultiLogPRO data
loggers respectively. These chapters explain how the data loggers
themselves operate, and describe how to connect sensors, configure the
loggers, and for the MultiLogPRO, operate the LCD graphic display to
take measurements when working offline.
• Chapter 3 gives a comprehensive overview of the MultiLab for Windows
and Mac OS software. Topics include: How to download data from the
data logger to a PC, analyzing the data both graphically and
mathematically, and using the MultiLab software to program the data
logger when working online.
• Chapter 4 guides you in operating the MultiLogPRO and TI–83 Plus
system, how to setup MultiLogPRO via the TI calculator, how to download
the data and how to analyze this data.
• Chapter 5 contains a troubleshooting guide that gives answers to
common questions.
• Chapter 6 includes the specifications of the data logger systems.
Introduction
3
Chapter 1
USBLink
The USBLink is a 4-input sensor interface, able to accept the full range of Fourier
sensors as well as certain Vernier and Data Harvest sensors. It connects to and is
powered by the PC via a mini USB cable and features data logging capabilities
based on the MultiLogPRO data logger design. The USBLink doesn’t have a LCD
screen and doesn’t require external AC power source or batteries. It is a sensor
interface only, so doesn’t require onboard memory.
Note: USBLink data logger is supported by MultiLab PC software running on
Windows XP and higher.
This chapter will focus on the USBLink data collection device and includes sections
on:
• How to set up USBLink
• How to connect USBLink to your PC
• How to connect sensor to the USBLink
• How to upgrade USBLink firmware
1.1. General
1.1.1.
USBLink System Contents
The following items are included in your USBLink order:
• USBLink data logger
• Mini USB communication cable
• MultiLab software mini CD
1.1.2.
External Connections
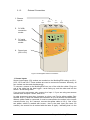
Figure 1: USBLink external connections
4
Chapter 1 USBLink
1. Sensor Inputs
Sensor input/output (I/O) sockets are marked on the USBLink casing as I/O-1, I/O-2,
I/O-3 and I/O-4. These sockets are used to connect the sensors. Normally, all four
sockets can be used simultaneously.
To connect a sensor to the USBLink, use one of the mini-din cables. Plug one end of
the cable into the data logger - arrow facing up, and the other end into the sensor arrow facing down.
If you are using one sensor only connect it to input 1. If you are using two sensors
connect them to inputs 1 and 2, and so on.
In order to connect more than 4 sensors at a time, use Fourier splitter cables (Part
Number DT011), which will enable the connection of up to 8 sensors simultaneously.
When a splitter cable is connected, it must be connected to the socket in the correct
numerical order (e.g. for 5 sensors, connect the splitter cable to I/O-1). One of the
two splitter cables is marked with arrows - that is the main input (the lower I/O
number), the second line is marked with the letter S (split) - indicating that it is the
secondary input (the higher I/O number). Connect up to four input splitters to split the
USBLink’s inputs starting with I/O-4 (the splitters must be connected in order):
•
•
•
•
I/O-4 splits into I/O-4 and I/O-8
I/O-3 splits into I/O-3 and I/O-7
I/O-2 splits into I/O-2 and I/O-6
I/O-1 splits into I/O-1 and I/O-5
Note: Before connecting the mini-din cable to the data logger or the sensor
sockets, make sure that the mini-din plug is correctly positioned in front of the
socket. Connecting the cable in an awkward position might cause damage to the
cable pins.
2. PC Mini USB communication socket
For USB communication between logger and PC, connect the USB Type B plug to
the USBLink and the USB Type A plug to the PC.
1.1.3.
Powering the USBLink
When connected to the PC via the mini USB cable, the USBLink draws power from
the PC, via the USB port itself. No external AC power source is required. When the
USBLink is connected to the USB port, the unit becomes operational and a green
LED lights up on the logger casing. Certain sensors generally require external power
supply when used with other loggers such as the MultiLogPRO. However, when
connected to the USBLink, the external power is taken from the USB port as well.
Note: When powering the USBLink from a laptop running on battery, the laptop
battery will drain at negligibly faster rate than normal.
1.1.4.
USBLink Memory
The USBLink doesn’t have onboard memory. When logging data, this data is
displayed in the MultiLab software online, in real-time. The user must save this data
in the software as it cannot then be downloaded from the USBLink later.
Chapter 1 USBLink
5
1.1.5.
Input Modes
USBLink has two Input Modes. The default mode is Auto ID and the USBLink is in
this mode when turned on for the first time.
When using more than four sensors, when using sensors from other vendors, or if
you’ve defined your own sensor, you must unselect the Auto ID mode in the MultiLab
software.
In the MultiLab main menu, go to Logger > Auto ID and disable Auto ID. To return to
Auto ID mode, simply enable it again from the Logger menu.
USBLink saves the current mode selection and will open in that mode the next time
you connect it to MultiLab.
A further explanation of the two Input modes is below.
1. Auto ID
Automatic sensor identification – just plug in the sensors and the USBLink prepares
itself to collect data from these sensors.
While in this mode you can work with up to four sensors simultaneously.
2. 8 Inputs
When Auto ID is disabled, the USBLink is able to collect data from up to eight
sensors simultaneously. Connect up to four input splitters (Part Number DT011) to
multiply the USBLink’s inputs starting with I/O-4 (the splitters must be connected in
order):
• I/O-4 splits into I/O-4 and I/O-8
• I/O-3 splits into I/O-3 and I/O-7
• I/O-2 splits into I/O-2 and I/O-6
• I/O-1 splits into I/O-1 and I/O-5
In the splitter cable, one of the two wires is marked with arrows - that is the main
input (the lower I/O number). The second wire is marked with the letter S (split) indicating that it is the secondary input (the higher I/O number).
In 8 Inputs mode there is no automatic sensor identification. Select the sensors
manually either from the Setup menu in the MultiLab software (see section 3.5.1 on
page 64).
Use this mode if you want to work with more than four sensors or if you are using
sensors from other vendors such as Vernier or Data Harvest.
1.1.6.
Quick-Start
To run the USBLink logger follow these simple steps once the MultiLab software and
USBLink USB driver have been installed.
1. Connect the mini USB cable to the USBLink USB port, and to the PC
USB port.
2. Connect sensors to USBLink sensor interface, starting with I/O-1.
3. Launch MultiLab software. USBLink will be automatically detected.
4. Default Input Mode is Auto ID so sensors should also be
automatically detected (unless you have connected sensors that
must be manually selected).
6
Chapter 1 USBLink
5. Click Run
in the MultiLab upper toolbar. Logger will start
recording data and will display it in the MultiLab graph and table
views. The default sample rate of 10 samples per second will be
used.
6. Click Stop
1.1.7.
to stop the logger from recording data.
Updating USBLink Firmware
Use the MultiLab software to update the USBLink firmware whenever an updated
version is made available.
Follow these steps to update the USBLink firmware:
1. Download the latest firmware version from the Fourier Systems
Download Center: http://www.fouriersys.com/support_download.html
2. Save the firmware file to the MultiLab directory on your PC. The file
must reside here before you launch MultiLab otherwise an error
message will be displayed stating that the file wasn’t found.
3. Connect the USBLink to the PC and launch MultiLab.
4. In the MultiLab main menu, go to Logger > Firmware Update.
Follow the on-screen instructions to disconnect and connect the
USBLink USB cable in order to launch the firmware update process.
5. Once the update process is complete, follow the on-screen
instructions and disconnect and then connect the USBLink USB
cable again. The firmware update process will then be complete and
the firmware version will be displayed in the MultiLab status pane.
Note: If you disconnect the USBLink during the firmware update process, the
previous firmware is still intact on the logger memory. You may continue the
interrupted firmware updated by reconnecting the USBLink while MultiLab is open.
1.1.8.
Choose the Right Setup
1. Sampling Rate
The sampling rate should be determined by the frequency of the phenomenon being
sampled. If the phenomenon is periodic, sample at a rate of at least twice the
expected frequency. For example, sound recordings should be sampled at the
Chapter 1 USBLink
7
highest sampling rate possible on the USBLink – 10,000/sec, but changes in room
temperature can be measured at slower rates such as once per second or even
slower, depending on the speed of the expected changes.
There is no such thing as over-sampling. For extremely smooth graphs, the
sampling rate should be about 20 times the expected frequency.
Note: Sampling at a rate slower than the expected rate can cause frequency
aliasing. In such a case, the graph will show a frequency much lower than
expected. In Figure 2 below, the higher frequency sine wave was sampled at
1/3 of its frequency. Connecting the sampled points yielded a graph with a
lower, incorrect frequency.
Figure 2: Frequency Aliasing
Manual sampling
Use this mode for:
• Recordings or measurements that are not related to time.
• Situations in which you have to stop recording data after each sample
obtained, in order to change your location, or any other logging
parameter.
Note: During the experiment no changes can be made to the USBLink’s
configuration.
2. Sampling Points
After you have chosen the sampling rate, choosing the number of points will
determine the logging period: Samples / Rate = Logging time.
You can also choose the duration of an experiment first, and then calculate the
number of samples: Samples = Logging time × Rate.
Continuous
In Continuous mode, USBLink will continue to record data for an unlimited period of
time. The logger can continue logging indefinitely. Its only limitation is the size of the
PC memory where the data is stored.
The data is displayed in a real-time graph.
To operate in Continuous mode, when configuring USBLink in MultiLab, select
Recording Time = Continuous.
8
Chapter 1 USBLink
1.1.9.
Programming Rules and Limitations
The following are some rules and limitations you must take into account when
programming the USBLink, as the logger integrates all programming limitations
automatically. USBLink will only allow the programming of settings that comply with
the rules below.
1. Sampling Points
Increasing the number of active inputs limits the number of sampling points one can
choose.
2. Maximum Sampling Rate
The maximum sampling rate depends on the number of sensors in use. See the
table below:
Number of Sensors
1
2
3
4
5
6
7
8
Maximum Sampling Rate
10,000 samples per second
5,000 samples per second
3,333 samples per second
2,500 samples per second
2,000 samples per second
1.666 samples per second
1,428 samples per second
1,125 samples per second
3. Continuous Sampling
There is no limit to the sampling rate of the USBLink when running in Continuous
sampling mode.
Chapter 1 USBLink
9
1.2. Sensor Calibration
In this chapter you will learn how to increase the USBLink system accuracy using
calibration. Most of the sensors are linear, i.e. the output level of each sensor
changes according to the equation:
Y = aX + b
Where:
Y - Output of the sensor (voltage level changing from 0 to 5V)
X - Sensor input
a - Sensor gain
b - Sensor offset
The calibration process allows us to control the offset, and in some cases even the
gain, of a sensor. The USBLink system offers four types of calibration:
• Hardware offset calibration
• USBLink automatic zero calibration
• MultiLab Sensor calibration
• Factory calibration (no manual calibration required)
1.2.1.
Hardware Offset Calibration
On some of the sensors there is a screw controlling the sensor offset. To calibrate
the sensor, rotate this screw until the sensor shows the correct measured value
(obtain the actual correct value from another source that is known to be accurate).
1.2.2.
USBLink Automatic Zero Calibration
USBLink is able to automatically calibrate the sensor offset for all analog sensors
accurately, quickly, and for every new experiment conducted.
The calibration method is very simple. Whenever you plug in a sensor, the data
logger checks to see if the selected sensor measures a value within ± 2% of its zero
value. If so, USBLink sets that value as zero.
To enable this feature, make sure that the sensors are at their zero values when you
plug them in. To ensure the most accurate zero value, follow these instructions for
the following sensors:
• Shorten the Voltage sensor plugs
• Leave the Current sensor plugs open
• Cover the Light, Photo Gate, and Microphone sensors
• Insert the pH sensor in a pH 7 solution
• Unload the Force Transducer
• Place the Accelerometer on a stationary surface
• Place the Temperature probes in ice water
• Place the Pressure sensor in a 1 ATM (1013 mb) chamber
10
Chapter 1 USBLink
1.2.3.
pH Temperature Compensation
To compensate a pH sensor for temperature changes, plug the Temperature sensor
into Input 1, and the pH sensor in Input 2. USBLink will then measure the
compensated pH value.
1.2.4.
DO2 Calibration
When calibrating the DO2 sensor for use with the USBLink, you should use the table
below to obtain the relevant calibration value.
The default value is 8.26 mg/liter (zero altitude with no salinity).
Altitude (ft)
Salinity (ppt)
0
5
10
15
20
25
30
35
0
8.26
8.03
7.81
7.59
7.38
7.17
6.97
6.77
500
8.09
7.86
7.65
7.43
7.23
7.02
6.83
6.63
1000
7.92
7.7
7.49
7.28
7.08
6.88
6.69
6.49
1500
7.76
7.54
7.34
7.13
6.93
6.73
6.55
6.36
2000
7.59
7.38
7.18
6.98
6.78
6.59
6.41
6.22
2500
7.59
7.38
7.18
6.98
6.78
6.59
6.41
6.22
3000
7.43
7.22
7.02
6.83
6.64
6.45
6.27
6.09
3500
7.26
7.06
6.87
6.67
6.49
6.3
6.13
5.93
1.2.5.
MultiLab Sensor Calibration
The sensors can also be calibrated using the Calibrate Sensors option in MultiLab’s
Logger menu. Please refer to section 3.5.7 for more information.
1.2.6.
Factory Calibration (No Calibration Required)
All digital sensors that are essentially timers leave the factory fully calibrated, and do
not suffer from any accuracy degradation. An example of such a sensor is the Sonic
Ranger distance sensor, which measures the time passed from the transmission of a
sound pulse to its echo reception.
Chapter 1 USBLink
11
Chapter 2
MultiLogPRO
This chapter will focus on the MultiLogPRO data collection device and includes
sections on:
• How to operate the MultiLogPRO keypad
• How to set up MultiLogPRO
• How to connect MultiLogPRO to your PC
2.1. General
2.1.1.
MultiLogPRO System Contents
The following picture indicates the items included in the basic MultiLogPRO kit you
have ordered, together with the carrying case.
1
7
6
3
2
5
4
Figure 3: Contents of the MultiLogPRO system
1.
2.
3.
4.
5.
6.
7.
12
The MultiLogPRO data logger
Sensors (see your package list)
Four sensor mini-din cables
USB and Serial Communication cables (see your package list)
Web camera (optional)
MultiLab software installation CD
AC-DC adaptor
Chapter 2 MultiLogPRO
2.1.2.
1. Sensor
inputs
External Connections
th
4
input
rd
3
input
nd
2
input
st
1
input
2. PC USB
connection
socket
fn
3. PC serial
?
connection
socket
4. Power input
(DC 9–12V)
Figure 4: MultiLogPRO external connections
1. Sensor Inputs
Sensor input/output (I/O) sockets are marked on the MultiLogPRO casing as I/O-1,
I/O-2, I/O-3 and I/O-4. These sockets are used to connect the sensors. Normally, all
four sockets can be used simultaneously.
To connect a sensor to the MultiLogPRO use one of the mini-din cables. Plug one
end of the cable into the data logger - arrow facing up, and the other end into the
sensor - arrow facing down.
If you are using one sensor only connect it to input 1. If you are using two sensors
connect them to inputs 1 and 2, and so on.
In order to connect more than 4 sensors at a time, use Fourier splitter cables (Part
Number DT011), which will enable the connection of up to 8 sensors simultaneously.
When a splitter cable is connected, it must be connected to the socket in the correct
numerical order (e.g. for 5 sensors, connect the splitter cable to I/O-1). One of the
two splitter cables is marked with arrows - that is the main input (the lower I/O
number), the second line is marked with the letter S (split) - indicating that it is the
Chapter 2 MultiLogPRO
13
secondary input (the higher I/O number). Connect up to four input splitters to split the
MultiLogPRO’s inputs starting with I/O-4 (the splitters must be connected in order):
•
•
•
•
I/O-4 splits into I/O-4 and I/O-8
I/O-3 splits into I/O-3 and I/O-7
I/O-2 splits into I/O-2 and I/O-6
I/O-1 splits into I/O-1 and I/O-5
Note: Before connecting the mini-din cable to the data logger or the sensor
sockets, make sure that the mini-din plug is correctly positioned in front of the
socket. Connecting the cable in an awkward position might cause damage to the
cable pins.
2. PC USB communication socket
For USB communication between logger and PC, connect the USB Type B plug to
the MultiLogPRO and the USB Type A plug to the PC (see page 35 for USB driver
installation).
3. PC serial communication socket
For Serial communication between logger and PC, connect the 9-pin Type D cable
between this port and one of the computer’s PC COM ports. At the back of the
computer you will find a 9-pin Type D male socket. If your computer is using this port
for the mouse, look for a 25-pin D shell male socket near the mouse. Use the RS-232
9 to 25-pin adaptor to connect the MultiLogPRO serial cable to the 25-pin port (the
adaptor is included with the MultiLogPRO).
4. External DC power supply socket
Plug in an AC/DC 9-12V adaptor whenever you want to save battery power, or to
charge the battery when necessary. Connecting external power to the MultiLogPRO
automatically charges the internal battery. The adaptor should meet the required
specifications (see section 2.1.4).
2.1.3.
Battery
MultiLogPRO is equipped with a 7.2V NiCad rechargeable battery. Before you first
start working with MultiLogPRO, charge the unit for 10 to 12 hours while it is turned
off. Battery life is approximately 24 hours between charges.
If the data logger’s main battery runs out, the internal 3V Lithium battery backs up
the memory, so no data will be lost.
Note: Before storing the data logger make sure you have unplugged all the sensors
and pressed the OFF key.
2.1.4.
•
•
14
AC/DC Adaptor
Output: Capacitor filtered 9 to 12 VDC, 400 mA
Female plug, center Negative
Chapter 2 MultiLogPRO
2.1.5.
Automatic Shut-off
MultiLogPRO shuts off automatically after 15 minutes have passed since the time of
the last data recording, the time the last button was pressed, or the time the last
communication was made with the PC.
2.2. Standalone Operation
One way to program the MultiLogPRO is to use its keypad and screen (the other way
is to use the MultiLab software - see Chapter 3). The keypad allows us to set all the
parameters for data collection, while the LCD screen displays the setting values.
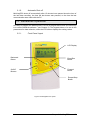
2.2.1.
Front Panel Layout
LCD Display
Backward
Button
Enter/Run
Button
On/Off
Buttons
Forward
Button
Escape/Stop
Button
Figure 5: MultiLogPRO front panel
Chapter 2 MultiLogPRO
15
2.2.2.
Input Modes
MultiLogPRO has two Input Modes. The default mode is Auto ID and the
MultiLogPRO is in this mode when turned on for the first time. When using more than
4 sensors, when using third-party sensors, or if you’ve defined your own sensor,
switch to the 8 inputs mode. Select the system configuration menu in the MAIN
MENU and choose the mode you want (see page 27).
MultiLogPRO saves the current mode selection and will open in that mode the next
time you turn it on.
1. Auto ID
Automatic sensor identification – just plug in the sensors and the MultiLogPRO
prepares itself to collect data from these sensors.
While in this mode you can work with up to 4 sensors simultaneously.
2. 8 Inputs
This mode enables data logging from up to 8 sensors simultaneously. Connect up to
four input splitters (DT011) to multiply the MultiLogPRO’s inputs starting with I/O-4
(the splitters must be connected in order):
• I/O-4 splits into I/O-4 and I/O-8
• I/O-3 splits into I/O-3 and I/O-7
• I/O-2 splits into I/O-2 and I/O-6
• I/O-1 splits into I/O-1 and I/O-5
In the splitter cable, one of the two wires is marked with arrows - that is the main
input (the lower I/O number). The second wire is marked with the letter S (split) indicating that it is the secondary input (the higher I/O number).
To learn how to switch to 8 inputs mode please refer to section 2.2.9 on page 27.
In this mode there is no automatic sensor identification. Select the sensors manually
either from the MultiLogPRO setup menu (see section 2.2.6 on page 22) or using the
MultiLab software (see section 3.5.1 on page 64).
Use this mode if you want to work with more than 4 sensors or if you are using thirdparty sensors.
2.2.3.
Quick-Start
Before you first use MultiLogPRO, charge the unit for 10 to 12 hours while it is turned
off.
1. Turn on MultiLogPRO
. You will see the initialization screen. MultiLogPRO
Press the on button
performs a brief self-check and displays its status including battery level. At this point
you can load the last setup you used (see page 27). If you need a new setup wait
until you see the Main Menu screen:
16
Chapter 2 MultiLogPRO
2. Plug in the Sensors
Start with the first input on the right. If MultiLogPRO is in Auto ID mode (the default
mode) it will display the setup menu and will identify the sensors you’ve plugged in.
In–1: Microphone
In–2: Light
In–3:
In–4:
→
RATE = 10/s
SAMPLES = 500
DISPLAY = numeric
Note: Sensors must be added successively, starting with input-1. If a single sensor is
used it must be connected to I/O-1. If two sensors are used in an experiment, they
must be connected to I/O-1 and I/O-2.
The arrow indicates that MultiLogPRO is ready to accept a new sampling rate.
If the MultiLogPRO is in 8 input mode, you have to select the sensors manually (see
page 22).
3. Select Rate
Use the Forward
and Backward
rate, and then press the Enter button
arrow buttons to select the desired
.
In–1: Microphone
In–2: Light
In–3:
In–4:
→
RATE
= Every sec
SAMPLES = 500
DISPLAY = numeric
MultiLogPRO automatically switches to the next step in the setup process and the
arrow moves to the samples row.
Chapter 2 MultiLogPRO
17
4. Select Total Number of Samples
Use the Forward
and Backward
arrow buttons to select the number
of samples, and then press the Enter button
.
In–1: Microphone
In–2: Light
In–3:
In–4:
→
RATE
= Every sec
SAMPLES = 200
DISPLAY = numeric
5. Choose Display
Use the Forward
and Backward
display, and then press the Enter button
arrow buttons to select the type of
.
In–1: Microphone
In–2: Light
In–3:
In–4:
→
SAMPLES = 200
DISPLAY = graphic
START
= ( > ).
6. Start Recording
Press the Forward arrow button
to start recording.
Or press the Enter button if you want to go back to the first item (Rate).
You can stop recording any time by pressing the Escape button
18
Chapter 2 MultiLogPRO
.
2.2.4.
Working with the MultiLogPRO Menus
1. Turning MultiLogPRO On and Off
On
Turn MultiLogPRO on
Off
Turn MultiLogPRO off
Note: Pressing OFF will not erase the sample memory. The data stored in the
memory will be kept for up to 10 years.
2. Main Menu Display
When turned on, MultiLogPRO opens with a system information window and then
displays the main menu:
MultiLogPRO has 9 menus. Use the Forward or Backward Arrow buttons to highlight
a menu and press the Enter button to select it. Then use the Arrow buttons to scan
the options. Press the Enter button to select an option. The MultiLogPRO
automatically executes the command.
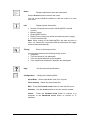
3. Menu Buttons
Forward
Move to the next menu or to the next menu options
Backward
Move to the previous menu or menu options
Enter (Start)
Enter the selected menu or select the current menu
option and move to the next menu command or start
recording
Chapter 2 MultiLogPRO
19
Escape
(Stop)
Return to the main menu or stop recording
4. Menu Icons and Commands
Start recording
Start
Press the Enter button to start recording
Setup MultiLogPRO in 4 steps:
Setup
Rate – Select recording rate
Samples – Select the total number of recording points
Display – Select the way MultiLogPRO will display the data (at a
rate of up to 10 samples per second):
•
•
Numeric - Displays the sensor values and the sample number
Meter - Displays all active sensors in a bar meter display
along with their values
• Table - Displays the last 6 values of all the active sensors in a
table
• Graphic - Displays a graphic representation of the sampled
sensors
At rates higher then 10/s the MultiLogPRO will display the data in
a graph at the end of the logging period.
Start – Press the Forward arrow to start recording
Function
•
•
•
Open
Display statistics of the current data
Minimum – The minimum graph value
Maximum – The maximum graph value
Average – The graph average
Open a stored data in graphic display
Use the Forward and Backward Arrow buttons to browse the
stored files,
press the Enter button to open a file
20
Chapter 2 MultiLogPRO
Notes
Display experiment notes and instructions
Use the Arrow buttons to browse the notes.
You can use the MultiLab software to edit the notes or to write
new notes
Display system information:
Info
•
Number of experiments stored in MultiLogPRO’s internal
memory
• Memory usage
• MultiLogPRO version
• Battery level (unplug any sensor and external power supply)
• Current date and time
Note: When turning off the MultiLogPRO, the date and time is
reset. You restore the current date and time whenever the logger
communicates with MultiLab.
Timing
Enter to the timing module
You can select between the following timing events:
• Stopwatch
• Time and speed in one photogate
• Time and speed between two photogates
• Time, speed and acceleration between two photogates
Help
On-line help and specifications
Configuration
Configure the MultiLogPRO:
Input Mode – Select Input Mode: Auto ID or 8 inputs
Clear memory – Delete the stored data files
DO2 – Press the Forward arrow button to enter the DO2 menu
Contrast – Use the arrow buttons to tune the screen contrast
Comm. – Press the Forward arrow button to connect to a
computer or the Backward arrow button to connect to TI
calculator
Chapter 2 MultiLogPRO
21
2.2.5.
Graphic Display
MultiLogPRO will automatically use a graphic display in three cases:
• If the recording rate is 10/s or less and you selected Graphic Display in the setup
menu
• Once logging has ended for an experiment with a data recording rate of over 10/s
• When opening a stored recording
The graphic display is available for recordings with up to 4 sensors simultaneously.
1. The Cursor
Use the Cursor in Graphic Display mode to read data values or to zoom in to the
area around a selected point. The cursor is displayed automatically after logging has
ended, or when opening a stored recording.
1. Use the Forward
move the cursor.
and Backward
arrow buttons to
2. MultiLogPRO displays the point coordinates at the bottom of the
graph.
3. If there is more then one sensor, press the Enter button
move the cursor to another plot on the graph.
to
2. Zooming
1. Position the cursor in the area you want to zoom into.
and
, simultaneously.
2. Press the two arrow buttons,
You will zoom in around the cursor in a 2:1 ratio.
3. Press the Escape button
2.2.6.
to zoom out.
Measuring Timing Events
MultiLogPRO incorporates an accurate Timer module with resolution of 0.1ms. The
timer can measure several types of events triggered by Fourier Systems' photogates:
• Time and speed with one photogate
• Time and speed between two gates
• Time, speed and acceleration between two gates
• Stopwatch
To learn more about the different measurement types see page 46 and page 48.
While in Timer mode MultiLogPRO does not store data. To save timing data in the
computer operate the Timer module via MultiLab.
To learn how to use the timer with MultiLab software please see page 45.
22
Chapter 2 MultiLogPRO
To use the photogates together with other sensors operate MultiLogPRO as a data
logger and then analyze the photogate data with the aid of MultiLab's Timing Wizard
(see page 98).
To perform a timing measurement:
1. Connect one or two photogates to MultiLogPRO
Note: MultiLogPRO must be in PC communication mode (see page 27)
2. Use the Forward
to the Timing
3. Press Enter
and Backward
arrow buttons to navigate
menu
to display the timing menu:
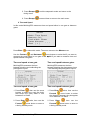
_ _ _ _ _TIMING _ _ _ _ _
→ Mode: Time Speed
Measure: In1
Card width: 30mm
Gates distance: 20cm
Start
( > )
The arrow indicates that MultiLogPRO is ready to accept the timing
mode
4. Use the arrow buttons to select the desired timing mode:
Stopwatch, Time Speed or Time Speed Acc
1. Stopwatch
_ _ _ _ _TIMING _ _ _ _ _
→ Mode: Stopwatch
Measure:
_ _ _
Card width: _ _ _
Gates distance:
_ _ _
Start ( > )
In this mode MultiLogPRO operates as a standard stopwatch with resolution of 0.01s.
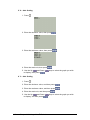
1. Press Enter
four times, then press the Forward
enter the stopwatch mode
arrow to
2. Press the Forward
arrow to start measuring time
3. Press the Forward
arrow a second time to stop the watch
4. Press the Backward
arrow to reset the watch
Chapter 2 MultiLogPRO
23
5. Press Escape
timing menu
to exit the stopwatch mode and return to the
6. Press Escape
a second time to return to the main menu
2. Time and Speed
In this mode MultiLogPRO measures time and speed either in one gate or between
gates.
_ _ _ _ _TIMING _ _ _ _ _
→ Mode: Time Speed
Measure: In1
Card width: 30mm
Gates distance: _ _ _
Start ( > )
Press Enter
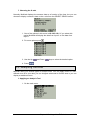
to select this mode. The arrow moves to the Measure row.
and Backward
arrow buttons to select In1 if you want to
Use the Forward
measure time and speed in one gate or In1 → In2 if you want to measure time and
speed between two gates.
Time and speed at one gate
Time and speed between gates
MultiLogPRO measures the time
between blocking and unblocking the
photogate at input 1
MultiLogPRO measures the time
between blocking the photogate at input
1 and blocking the photogate at input 2
Time and speed at one gate
Time and speed between gates
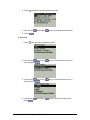
1. Press Enter
, then use the arrow
buttons to select the card (the body
that blocks the gate) width in mm
between 0 to 59mm
1. Press Enter
2. Press Enter
twice, then use the
arrow button to enter to
Forward
a timing standby mode
24
Chapter 2 MultiLogPRO
twice, then use the
arrow button to select
Forward
the distance between the photogates
in cm between 0 to 99cm
2. Press Enter
, then use the
arrow button to enter to
Forward
a timing standby mode
3. Timing begins each time a body
blocks the photogate and ends when
unblocking
the
photogate.
MultiLogPRO then displays the
elapsed time between entering and
leaving the gate and the speed of the
body
4. Use the arrow buttons to scroll
between the time and speed results
5. Press Escape
timing menu
to return to the
a second time to
6. Press Escape
return to the main menu
3. Timing begins each time a body
enters the first photogate (input 1)
and ends when leaving the second
photogate (input 2). MultiLogPRO
then displays the elapsed time
between entering the gates and the
body's average velocity
4. Use the arrow buttons to scroll
between the time and speed results
5. Press Escape
timing menu
to return to the
a second time to
6. Press Escape
return to the main menu
3. Time, Speed and Acceleration
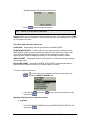
In this mode MultiLogPRO measures the crossing time at the first gate, the time it
takes the body to move from one gate to the second gate and the crossing time at
the second gate and returns the time between gates, the average speed and the
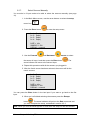
average acceleration.
_ _ _ _ _TIMING _ _ _ _ _
→ Mode: Time Speed Acc
Measure: In1 –>
In2
Card width: 30mm
Gates distance: 20cm
Start ( > )
1. Press Enter
twice, then use the arrow buttons to select the card
(the body that blocks the gate) width in mm between 0 to 59mm
2. Press Enter
, then use the Forward
arrow button to select
the distance between the photogates in cm between 0 to 99cm
3. Press Enter
, then use the Forward
a timing standby mode
arrow button to enter to
Timing begins each time a body enters the first photogate (input 1) and
ends when leaving the second photogate (input 2). MultiLogPRO then
displays the elapsed time between entering the gates and the body's
average velocity and acceleration
4. Use the arrow buttons to scroll between the time, speed and
acceleration results
5. Press Escape
to return to the timing menu
6. Press Escape
a second time to return to the main menu
Chapter 2 MultiLogPRO
25
2.2.7.
Select Sensors Manually
You must be in 8 input mode to be able to select the sensors manually (see page
16).
1. In the Main Menu screen, use the arrow buttons to select the setup
.
menu icon
2. Press the Enter button
→
In–1:
In–2:
In–3:
In–4:
to enter the setup menu:
Empty
Empty
Empty
Empty
RATE = 10/s
SAMPLES = 500
DISPLAY = numeric
3. Use the Forward
and Backward
arrows to select
the sensor in input 1 and then press the Enter button
arrow indicator will move to the second input.
. The
4. Repeat this procedure with all the sensors you plugged in.
5. After the fourth sensor has been selected, the screen will list the
next 4 sensors:
→
In–5:
In–6:
In–7:
In–8:
Empty
Empty
Empty
Empty
RATE = 10/s
SAMPLES = 500
DISPLAY = numeric
You can press the Enter button in the last input if you want to go back to the first
input.
6. When you’ve finished selecting the sensors press the Escape
. The arrow indicator will point to the Rate command and
button
you must complete the setup, as detailed in section 2.2.3.
Note: When you turn the MultiLogPRO off it will save the setup for the next session.
26
Chapter 2 MultiLogPRO
2.2.8.
Load the Last Setup
When you turn MultiLogPRO on, once the self testing has been completed, it will
display:
___INITIALIZATION___
Init.
Init.
Init.
Batt.
Display
ADC
RAM
99%
ENTER – load setup
to load the last setup.
Press the Enter button
2.2.9.
Configure Your MultiLogPRO
Use the System configuration menu to select the Input Mode, to clear the
MultiLogPRO’s memory, to change the screen contrast, or to calibrate the DO2
sensor.
In the MAIN MENU screen, select the System configuration icon
configuration screen. The default configuration is:
→
Use the Forward
to display the
Input Mode: Auto ID
Clear memory ( > )
DO2 calibration ( > )
Contrast ( < ) ( > )
Comm
( PC )
and Backward
then press the Enter button
arrows to select the mode and
to move to the next item. You can press the
Escape button
to leave the configuration menu at any time, saving the new
changes you made. Press Enter button in the last item (Contrast) if you want to go
back to the first item (Input Mode).
1. Input Mode
Select between Auto ID – automatic sensor identification and 8 inputs – manual
sensor selection (See also page 16).
The new configuration will be the default mode until the next time you change it.
Chapter 2 MultiLogPRO
27
2. Clear Memory
Press the Forward arrow button
from the MultiLogPRO.
if you want to delete all previous data files
3. DO2 Sensor Calibration
If you need to calibrate a DO2 sensor press the Forward arrow button
enter the DO2 calibration screen:
to
_____ DO2 CAL _____
Use the following
menu to calibrate
the DO2 electrode.
Salinity: 0 ppt
Use the arrow buttons to select between 0, 5, 10, 15, 20, 25, 30 and 35 ppt and
press the Enter button to confirm and move to calibrate altitude.
Use the arrow buttons to select between 0, 500, 1000, 1500, 2000, 2500, 3000 and
3500 ft and press the Enter button to confirm.
MultiLogPRO will display the calculated upper limit of the calibrated range and will
exit the DO2 calibration screen.
The new calibration parameters will be saved until the next time you change them.
4. Screen Contrast
Use the arrow buttons to adjust the LCD screen contrast.
Any contrast adjustment will be saved until the next time you change it.
5. Connect to a Computer or to a TI Calculator
Press the Forward arrow
button to connect to a computer or the Backward
button to connect to a TI calculator
arrow
2.2.10.
Internal Clock and Calendar
The internal clock is set the first time you use the Setup command from the MultiLab
software to program the MultiLogPRO. The clock is automatically updated to the
PC’s time and date whenever you connect your MultiLogPRO to a PC and perform
Setup in MultiLab.
28
Chapter 2 MultiLogPRO
When you shut off the MultiLogPRO, the internal clock and calendar is not saved. To
restore the clock and calendar, you must reconnect the MultiLogPRO to the PC and
Setup the logger again.
2.2.11.
Clear the Memory
If you want to start recording and the MultiLogPRO’s internal memory is full you will
see this message at the bottom of the display:
→
In–1:
In–2:
In–3:
In–4:
Microphone
Light
Empty
Empty
SAMPLES = 200
DISPLAY = graphic
Mem full, clear = ( > )
Press the Forward arrow button
to clear the memory
In order to clear the MultiLogPRO’s memory when it is not full, use the Memory
clear command from the Configuration menu (see page 27), or clear the memory
from the Logger menu in the MultiLab software (see page 70).
2.2.12.
Choose the Right Setup
1. Sampling rate - The sampling rate should be determined by the frequency of
the phenomenon being sampled. If the phenomenon is periodic, sample at a
rate of at least twice the expected frequency. For example, sound recordings
should be sampled at the highest sampling rate – 20,800/sec, but changes in
room temperature can be measured at slower rates such as once per second or
even slower, depending on the speed of the expected changes.
There is no such thing as over-sampling. For extremely smooth graphs, the
sampling rate should be about 20 times the expected frequency.
Note: Sampling at a rate slower than the expected rate can cause frequency
aliasing. In such a case, the graph will show a frequency much lower than
expected. In Figure 6 below, the higher frequency sine wave was sampled at
1/3 of its frequency. Connecting the sampled points yielded a graph with a
lower, incorrect frequency.
Figure 6: Frequency Aliasing
Chapter 2 MultiLogPRO
29
Manual sampling - use this mode for:
• Recordings or measurements that are not related to time.
• Situations in which you have to stop recording data after each sample
obtained, in order to change your location, or any other logging
parameter (Note: During the experiment no changes can be made to
the MultiLogPRO’s configuration).
To start an experiment using manual data logging, set the RATE to manual and
once to start the data recording, then press the
press the Enter button
Enter button each time you want to collect a sample.
You can also perform manual logging via MultiLab (see page 43).
2. Sampling Points - After you have chosen the sampling rate, choosing the
number of points will determine the logging period: Samples / Rate = Logging
time. You can also choose the duration of an experiment first, and then
calculate the number of samples: Samples = Logging time × Rate.
Continuous
In the Continuous mode, MultiLogPRO does not save data, and can continue logging
indefinitely.
If MultiLogPRO is connected to the PC and the MultiLab software is running, the data
is automatically saved to the computer and displayed in a real-time graph.
To operate in Continuous mode select RATE equal to or less than 100/s and
SAMPLES = Continuous.
You can also select Continuous mode directly from the MultiLab software.
Note: MultiLogPRO must be set to a display mode other than graphic in order to
enable the Continuous mode.
2.2.13.
Programming Rules and Limitations
The following are some rules and limitations you must take into account when
programming the MultiLogPRO, as MultiLogPRO integrates all programming
limitations automatically. MultiLogPRO will only allow the programming of settings
that comply with the rules below.
1. Sampling Points
•
•
30
Increasing the number of active inputs limits the number of
sampling points one can choose. The following condition must
be always satisfied: Samples × Active Inputs < Memory.
MultiLogPRO’s memory is sufficient for 100,000 samples.
However, when sampling at rates faster than 100 samples per
second the memory can store only two experiments of 32,000
samples each.
Selection of 100,000 sampling points will create 2 files of 50,000
points each in the data logger’s memory
Chapter 2 MultiLogPRO
2. Sampling Rate
The number of sensors in use limits the maximum sampling rate:
Number of Sensors
1
2
3
4
5
6
7
8
Maximum Sampling Rate
20,800 samples per second
3,701 samples per second
2,631 samples per second
2,041 samples per second
1,667 samples per second
1,409 samples per second
1,220 samples per second
1,076 samples per second
3. Continuous Sampling
•
•
Continuous sampling is possible up to a maximum sampling rate of
100/s.
The data must be presented in a display mode other than graphical.
Chapter 2 MultiLogPRO
31
2.3. Sensor Calibration
In this chapter you will learn how to increase the MultiLogPRO system accuracy
using calibration. Most of the sensors are linear, i.e. the output level of each sensor
changes according to the equation:
Y = aX + b
Where:
Y - Output of the sensor (voltage level changing from 0 to 5V)
X - Sensor input
a - Sensor gain
b - Sensor offset
The calibration process allows us to control the offset, and in some cases even the
gain, of a sensor. The MultiLogPRO system offers four types of calibration:
• Hardware offset calibration
• MultiLogPRO automatic zero calibration
• MultiLab Sensor calibration
• Factory calibration (no manual calibration required)
2.3.1.
Hardware Offset Calibration
On some of the sensors there is a screw controlling the sensor offset. To calibrate
the sensor, rotate this screw until the sensor shows the correct measured value
(obtain the actual correct value from another source that is known to be accurate).
2.3.2.
MultiLogPRO Automatic Zero Calibration
MultiLogPRO is able to automatically calibrate the sensor offset for all analog
sensors accurately, quickly, and for every new experiment conducted.
The calibration method is very simple. Whenever you plug in a sensor, the data
logger checks to see if the selected sensor measures a value within ±2% of its zero
value. If so, MultiLogPRO sets that value as zero.
To enable this feature, make sure that the sensors are at their zero values when you
plug them in. To ensure the most accurate zero value, follow these instructions for
the following sensors:
• Shorten the Voltage sensor plugs
• Leave the Current sensor plugs open
• Cover the Light, Photo Gate, and Microphone sensors
• Insert the pH sensor in a pH 7 solution
• Unload the Force Transducer
• Place the Accelerometer on a stationary surface
• Place the Temperature probes in ice water
• Place the Pressure sensor in a 1 ATM (1013 mb) chamber
32
Chapter 2 MultiLogPRO
2.3.3.
pH Temperature Compensation
To compensate a pH sensor for temperature changes, plug the temperature sensor
into Input 1, and the pH sensor in Input 2. MultiLogPRO will then display the
compensated pH value.
2.3.4.
DO2 Calibration
To calibrate your DO2 sensor with the right salinity and altitude parameters, use the
DO2 Calibration command from the Configuration menu (see page 28).
2.3.5.
MultiLab Sensor Calibration
The sensors can also be calibrated using the Calibrate Sensors option in MultiLab’s
Logger menu. Please refer to section 3.5.7 for more information.
2.3.6.
Factory Calibration (No Calibration Required)
All digital sensors that are essentially timers leave the factory fully calibrated, and do
not suffer from any accuracy degradation. An example of such a sensor is the Sonic
Ranger distance sensor, which measures the time passed from the transmission of a
sound pulse to its echo reception.
Chapter 2 MultiLogPRO
33
Chapter 3
MultiLab Software
3.1. Installing the Software
3.1.1.
System Requirements
To work with MultiLab, your system should be equipped with the following:
1. Windows
Software
• Windows 98/ME/2000/XP/Vista/7
Note: USBLink data logger is supported by MultiLab running on Windows OS
versions: XP, Vista and 7
• Internet Explorer 5.0 or later
Hardware
• Pentium II 600 MHz or higher (Pentium 4, 1.6 GHz or higher is needed for
video motion analysis recordings)
• 32 MB RAM (64 MB recommended)
• 10 MB available disk space for the MultiLab application (50 MB to install the
supporting applications)
• Free serial or USB port
• To work with the video window your system should be equipped with a video
camera, a free USB port and a compatible camera driver
• To be able to record and play voice comments your system should be
equipped with a sound card, a microphone and a speaker
2. Mac OS
Software
• Mac OS 9 or Mac OS X
• Web browser
Hardware
• PowerPC Macintosh G3 300 MHz or higher
• 64 MB RAM
• 15 MB available disk space
• USB port
• Recommended requirements for video recordings:
PowerPC G4 processor, 500 MHZ or higher, 256 MB RAM, 15 MB free disk
space, USB port, camera
• To be able to record and play voice comments your system should be equipped
with a microphone
34
Chapter 3 MultiLab Software
3.1.2.
Multiple Language Support
The MultiLab user interface supports several languages, with the default set to
English.
1. To change the interface language, go to Help > Language in the main menu.
The Language dialog will open.
2. Select the language from the list and click OK. The MultiLab user interface will
automatically switch to the selected language.
For support for other languages not listed, contact your local Fourier distributor.
3.1.3.
MultiLab Installation on Windows OS
Note to Windows users: MultiLab needs to modify its folder when
running. Ask your system administrator for permission to gain access to all
files in the MultiLab folder.
Instructions for installing and uninstalling MultiLab on your PC are provided below.
Once the software is installed, you will need to install a USB driver so that your data
logger will be detected by the PC. Refer to the relevant section on installing the USB
driver.
Installing MultiLab on Windows XP/Vista/7
1.
2.
3.
4.
Close all open programs.
Insert the CD labeled MultiLab into your PC's CD-ROM drive.
The Install Wizard will open. Click Next to continue the installation.
Select the option for agreeing to the terms of the MultiLab license agreement.
Click Next.
5. Enter user name and company name in the Customer Information window.
6. Select the option regarding for which user the application should be installed.
Click Next.
7. The default folder where MultiLab will be installed is C:\Program Files\Fourier
Systems\MultiLab\. Click Browse to change this folder location, or click Next.
Chapter 3 MultiLab Software
35
8. The default folder where the MultiLab data files will be stored is C:\Program
Files\Fourier Systems\MultiLab\. Click Browse to change this folder location, or
click Next.
9. MultiLab installation will proceed, followed by installation of associated drivers,
Windows Encoders and Quicktime ®.
10. When installation is complete the Install Wizard prompts you to restart the
computer. It is recommended to restart the computer now.
3.1.4.
MultiLab Installation on Mac OS
1. Insert the CD into your CD drive.
2. Open the CD drive folder and double-click the MultiLab Installer icon, then
follow the on-screen instructions to complete the installation process.
3.1.5.
Installing USB Driver for USBLink
Note: USB driver for USBLink is only supported by Windows XP, Vista and 7.
1. On MultiLab v1.4.22 and higher
Windows XP
1. Launch MultiLab.
2. Connect the mini USB cable to your USBLink and connect the cable to a USB
port on your PC. Windows will automatically detect the new device and open the
Found New Hardware Wizard.
3. Select the option No, not this time to prevent Windows from searching for
software on the Internet, then click Next.
4. Select the option Install the software automatically (Recommended) and click
Next.
5. A window requesting verification of the driver compatibility with Windows XP will
pop up. Click Continue Anyway.
6. The driver will be installed on the PC.
7. Click Finish once the driver has been successfully installed. The USBLink is now
ready to use and with the MultiLab software open, the device LED will indicate
green, confirming PC detection.
Windows Vista/7
1. Launch MultiLab.
2. Connect the mini USB cable to your USBLink and connect the cable to a USB
port on your PC.
3. Windows will automatically detect the new hardware and will automatically install
the USB driver for the USBLink.
4. The USBLink is now ready to use and with the MultiLab software open, the
device LED will indicate green, confirming PC detection.
2. On MultiLab v1.4.21 and older
Windows XP
1. Connect the mini USB cable to your USBLink and connect the cable to a USB
port on your PC. Windows will automatically detect the new device and open the
Found New Hardware Wizard.
2. Select the option No, not this time to prevent Windows from searching for
software on the Internet, then click Next.
36
Chapter 3 MultiLab Software
3. Select the option Install from a list or specific location and click Next.
4. Select the option to search manually for the driver, and select the checkbox
Include this location in the search. Browse to the location of the USBLink USB
driver, either on your MultiLab CD or on your PC hard disk. The name of the
driver folder is: USBLink Driver, and it resides in the Drivers folder in the
MultiLab setup directory. The driver file itself will not be displayed, only the folder
name.
5. Once you have located the driver folder, click Next. The driver will be installed on
the PC. You may be asked to verify the author of the driver software. Choose the
option to authorize and continue to install the driver.
6. Click Finish once the driver has been successfully installed. The USBLink is now
ready to use. When the device is detected by the PC the USBLink LED will
indicate.
Windows Vista/7
1. Connect the mini USB cable to your USBLink and connect the cable to a USB
port on your PC.
2. Windows will not automatically detect the new hardware. From the Start menu,
select Computer, and then click System Properties in the upper menu bar. In
the System window, select Device Manager from the Task list on the left of the
window.
3. In the Device Manager, locate the Other devices tree and right click on the
USBLink item. Select the Update Driver Software menu item.
4. Select the Browse my computer for driver software, and click Next.
5. Browse to the location of the USBLink USB driver, either on your MultiLab CD or
on your PC hard disk. The name of the driver folder is: USBLink Driver, and it
resides in the Drivers folder in the MultiLab setup directory. The driver file itself
will not be displayed, only the folder name.
6. Once you have located the driver folder, click Next. The driver will be installed on
the PC. You may be asked to verify the author of the driver software. Choose the
option to authorize and install the driver.
7. Click Close once the driver has been successfully installed. The USBLink is now
ready to use. When the device is detected by the PC the USBLink LED will
indicate.
3.1.6.
Installing USB Driver for MultiLogPRO
1. On MultiLab v1.4.22 and higher
Windows 2000 and higher
With the release of MultiLab v1.4.22 installation of the USB driver for the
MultiLogPRO is performed automatically as part of the main MultiLab software
installation. When connecting the MultiLogPRO to the PC for the first time, it will be
automatically recognized by MultiLab.
2. On MultiLab v1.4.21 and older
Pre-Windows XP systems
1. Insert the MultiLab installation CD into your CD drive.
2. Connect your data logger to a USB port on your PC and turn the data logger on.
Windows will automatically detect the new device and open the Found New
Hardware Wizard.
Chapter 3 MultiLab Software
37
3. Select Specify the location of the driver, and then click Next.
4. Select Search for the best driver for your device, then check the Removable
Media checkbox, and then click Next. Windows will automatically detect and
copy the necessary files to your system.
5. Click Finish. Windows will open the Found New Hardware Wizard for the
second time.
6. Click Next to complete the installation. Windows will automatically install the
necessary components on your system.
7. Click Finish.
Windows XP
1. Connect your data logger to a USB port on your PC and turn the data logger on.
Windows will automatically detect the new device and open the Found New
Hardware Wizard.
2. Select the No, not this time to prevent Windows from searching for software on
the Internet, then click Next.
3. Select the option Install from a list or specific location and click Next.
4. Select the option to search manually for the driver, and select the checkbox
Include this location in the search. Browse to the location of the USB driver,
either on your MultiLab CD or on your PC hard disk. The name of the driver folder
is: Logger USB Driver, and it resides in the Drivers folder in the MultiLab setup
directory.
5. Once you have located the driver folder, click Next. The driver will be installed on
the PC.
6. Click Finish. Windows will open the Found New Hardware Wizard for the
second time.
7. Click Next to complete the installation. Windows will automatically install the
necessary components on your system.
8. Click Finish. The logger is ready to use and will now be detected by the PC.
Windows Vista/7
1. Connect your data logger to a USB port on your PC and turn the data logger on.
2. Windows will not automatically detect the new hardware. From the Start menu,
select Computer, and then click System Properties in the upper menu bar. In
the System window, select Device Manager from the Task list on the left of the
window.
3. In the Device Manager, locate the Other devices tree and right click on the USB
Serial Port item. Select the Update Driver Software menu item.
4. Select the Browse my computer for driver software, and click Next.
5. Browse to the location of the USB driver, either on your MultiLab CD or on your
PC hard disk. The name of the driver folder is: Logger USB Driver, and it resides
in the Drivers folder in the MultiLab setup directory.
6. Once you have located the driver folder, click Next. The driver will be installed on
the PC.
7. Click Close once the driver has been successfully installed. The logger is ready
to use and will now be detected by the PC.
3.1.7.
Uninstalling MultiLab
Note: Uninstalling MultiLab removes program files only. Project files and worksheets
you created or modified in MultiLab will remain on your system and there is no need
to create backups.
To uninstall the software on Windows XP:
38
Chapter 3 MultiLab Software
1.
2.
3.
4.
5.
6.
From the Start menu select Settings then click Control Panel.
Double click Add or Remove Programs.
Select MultiLab from the list of programs.
Click Remove.
In the following dialog box, click Yes to confirm that you want to remove MultiLab.
When uninstall is complete you will be prompted to restart the computer. Select
Yes.
To uninstall the software on Windows Vista/7:
1. From the Start menu select Control Panel.
2. Select Programs > Uninstall a program.
3. Select MultiLab from the list of programs and click Uninstall from the top of the
window.
4. In the following dialog box, click Yes to confirm that you want to remove MultiLab.
Chapter 3 MultiLab Software
39
3.2. Overview
3.2.1.
MultiLab On-screen Layout
MultiLab is a comprehensive program that provides you with everything you need in
order to collect data from Fourier data loggers such as the USBLink and
MultiLogPRO. You may display the data in graphs, meters and tables, analyze it with
sophisticated analysis tools and view online or recorded video movies of the actual
experiment.
The Video Motion Analyzer module enables you to capture position and time from
video movies and analyze the data with MultiLab’s analysis tools
The program includes four windows: A graph window, table window, video window
and a navigation window called the Data Map. You can display all four windows
simultaneously or any combination of the four.
The most commonly used tools and commands are displayed on three toolbars.
Tools that relate to all aspects of the program and tools that control the data logger
are located in the main (upper) toolbar. Tools specific to the graphs are located on
the graph toolbar and tools specific to the tables are located on the table toolbar.
Another useful feature is the Workbook. A workbook is a lab activity that gives the
student a step-by-step preview of the activity and then automatically configures the
MultiLab program and the sets up the data logger so that the student can begin
collecting the data. You can open an existing workbook or create a new one from the
Workbook menu.
3.2.2.
MultiLab Window Layout
Main toolbar
Video window
Data map
Table window
Graph window
Information bar
Table toolbar
Graph toolbar
40
Figure 7: MultiLab window layout
Chapter 3 MultiLab Software
3.2.3.
Working with Projects
Every time you start a new experiment, MultiLab automatically creates a new project
file. All the information you collect and process for a given experiment is stored in a
single project file. Each of these files contain all the data sets you collect with the
data logger, the analysis functions you’ve processed, the video files you’ve recorded,
specific graphs and tables you’ve created, and the MultiLab settings for the
experiment.
Note: All data sets in a single project must be with the same sampling rate.
3.3. Getting Started
This section outlines getting started with using the USBLink and MultiLogPRO data
loggers.
3.3.1.
Set up a Recording Session
1. Prepare the USBLink
1. Connect USBLink to the PC (see page 4).
2. Plug in any external sensors.
3. Launch the MultiLab software.
2. Prepare the MultiLogPRO
1. Connect MultiLogPRO to the PC (see page 13).
2. Turn on MultiLogPRO.
Note: MultiLogPRO must be in PC communication mode (see page 27).
3. Plug in any external sensors.
4. Launch the MultiLab software.
3. Enable Video Recording
Note: Do not plug in the PC camera before you have installed the camera driver.
To display the video window and enable online video and video recording:
1. Connect the camera to the PC
2. Click Video on the menu bar, then click Enable video
MultiLab will remember the video settings until the next time you change them.
Note: if more than one video source is connected to your computer MultiLab will use
the default source. To select another source click Video on the menu bar and click
Select video device, then select the desired source from the drop list that opens and
click OK.
Chapter 3 MultiLab Software
41
3. Click Video
on the main toolbar to display the video window.
4. Point the camera to the experiment setup.
4. Setup the USBLink/MultiLogPRO
1. Click the Setup Wizard button on the main toolbar. For USBLink,
and for MultiLogPRO,
.
2. Follow the instructions in the Setup Wizard (see page 64).
5. Start Recording
Click Run
•
•
on the toolbar to start recording.
For the USBLink, the data is continuously streamed online into the
MultiLab software, whatever the sampling rate. Therefore it is always
visible to the viewer during the actual measurement.
For the MultiLogPRO, if the recording rate is 100 measurements per
second or less, MultiLab automatically opens a graph window
displaying the data in real-time, plotting it on the graph as it is being
recorded. If the recording rate is higher than 100/s, the data will be
downloaded and displayed automatically once the data recording is
finished.
You can stop recording anytime by clicking Stop
3.3.2.
on the toolbar.
Data Recording Options
To set the behavior of the data display when you start a new recording session, click
on the down arrow next to the Run button
, and select one of the following:
1. Single Measurement
MultiLab will open a new project file every time you start a new recording session.
2. Replace
MultiLab will display the new data set in place of the old one. The project’s old data
sets will still be available in the same project file. They will be listed in the Data Map
and you can add them to the display at any time.
3. Add
MultiLab will add the new data set to the graph in addition to the old ones.
Note: A maximum of eight data sets can be displayed on the graph at the same time.
42
Chapter 3 MultiLab Software
3.3.3.
Manual Sampling
Use this mode for:
• Recordings or measurements that are not related to time.
• Situations in which you have to stop recording data after each sample
obtained, in order to change your location, or any other logging
parameter (Note: During the experiment no changes can be made to
the MultiLogPRO’s configuration).
To start an experiment using manual data logging, set the rate to manual and click
once to start the data recording, and then press the Enter button each time
Run
you want to collect a sample.
You can also perform manual logging via MultiLogPRO (see page 29).
3.3.4.
Online Video
MultiLab enables you to view online video of your experiment along with the data
display, as well as to record video movies of the experiment and to replay them
simultaneously with the data graph. You can also add voice comments to the video
recordings.
To work with the video window your system should be equipped with a video camera.
To be able to record and play voice comments your system should be equipped with
a sound card, a microphone and a speaker.
1. Online Video
The online video will start playing when you open the Video window. Click Video
on the main toolbar to display the video window and enable video (see page
41).
2. Recording
1. From the Video menu select Enable video.
2. Click Record
video recording.
3. Click Run
on the right-hand side of the toolbar to start
to start data recording.
4. Once the data logging has finished, click Stop Video Recording
.
to replay both the data graphing process the
5. Click Replay
video recording simultaneously.
Note: Saving the file will automatically save the video as well.
Chapter 3 MultiLab Software
43
3. Replaying an Experiment
To simultaneously replay the video and the data graphing process of a saved file:
1. Open the file (see page 50).
2. Display the data on the graph (see page 61).
3. Click Replay
.
4. Video and Audio Properties
To set the video properties click Video on the menu bar, then click Video properties
to open the video properties dialog box:
Figure 8: Video properties dialog box
Changing Video Quality
The video default quality is Normal; click another option to select either higher quality
(12 KBps) or lower quality (3 KBps). Changing the video quality not only affects the
image quality, but the recorded file space and the computer’s performance as well. A
higher video quality means more disk space is used, which can slow down the
computer’s performance.
Audio Visual Options
The default option is Audio_video. That means that both video and audio are
enabled and you can record voice comments along with the video. If you plan to
record video only, select the Video only option. If you plan to record voice comments
only select the Audio only option.
3.3.5.
Download Data from the USBLink
There is no download function for the USBLink as it doesn’t have onboard memory.
All data is recorded directly into the MultiLab software.
3.3.6.
Download Data from the MultiLogPRO
Whenever data is received from the MultiLogPRO, it is accumulated and displayed
automatically by MultiLab. There are two modes of communication: Online and PostExperiment.
44
Chapter 3 MultiLab Software
Online communication
When MultiLogPRO is connected to the PC and is programmed to run at sampling
rates of up to 100/s, MultiLogPRO transmits each data sample immediately, as it is
recorded, to the PC. The software thus displays the data in real-time in both the
graph window and the table window.
When MultiLogPRO is connected to the PC and programmed to run at a sampling
rate faster than 100/s, data is accumulated in MultiLogPRO‘s internal memory but is
not transmitted directly to the PC until the recording period has ended. Once the
recording has ended, the data is automatically downloaded to the PC and displayed.
Off-line data logging
To download data that was recorded offline, or while MultiLogPRO was not
connected to a PC, connect MultiLogPRO to the computer, run the MultiLab program
on the toolbar. This will initiate the Post-Experiment Data
and click Download
Transfer communication mode. Once the transfer is complete, the data will be
displayed automatically in the graph window and in the table window. If there are
several experiments stored in the MultiLogPRO, the first download will bring up the
most recent experiment; the second download will bring up the earliest file, the third
download will bring up the second earliest file, and so on.
To download a particular experiment, choose Selective Download from the Logger
menu, then select the experiment’s number in the Download dialog box.
Click Cancel in the Download progress window at any time to stop downloading the
data.
3.3.7.
The Timer Module
MultiLab enables you to measure timing events with the data logger’s Timer module
(see page 22).
To use the photogates together with other sensors operate the data logger and then
analyze the photogates data with the aid of MultiLab's Timing Wizard (see page 98).
1. Working with the Timer Module Wizard
1. Connect the data logger to the computer
2. Connect one photogate to input 1 of the data logger or two
photogates to inputs 1 and 2 (according to the event method)
3. Click Logger on the menu bar, and then click Timer Module
Wizard to open the Timer module wizard:
Chapter 3 MultiLab Software
45
4. Click an option to select measurement: Time, Velocity or
Acceleration
5. Click Next to move to step 2 of the wizard:
6. Click an option to select the measuring method
7. If required enter the body’s width in mm (an integer between 0 to
59), or the distance between the gates in cm (an integer between 0
to 99) in the appropriate edit box (in velocity and acceleration
measurements only)
8. Click Start to enter to a timing standby mode
Timing begins each time a body blocks the photogate in input 1 and ends when
unblocking the photogate in input 1 or input 2 (according to the event method).
MultiLab displays the results in a bar graph and in the table.
You can repeat as many measurements as you want. After each event MultiLab adds
the results as a new bar in the graph and as a new raw in the table.
To exit the timing mode click Stop
on the main toolbar.
2. Measuring Methods
The Timing Wizard offers you various methods of analyzing the different
measurements. In some measurements you will be asked to enter the dimension of
the moving body, or the distance between the two photogates to allow for the
calculation of velocity and acceleration.
The methods depend on the selected measurement:
46
Chapter 3 MultiLab Software
Time
•
At one gate
Measures the time it takes the
body to cross the photogate
(between
blocking
and
unblocking the infrared beam)
•
Between gates
Measures the time it takes the
body to move from one
photogate to the second
photogate (between blocking
the first and blocking the
second infrared beams)
Velocity
•
At one gate
Measures the time it takes the
body to cross the photogate
(between
blocking
and
unblocking the infrared beam)
and returns the velocity.
You should enter the body’s
width in mm
•
Between gates
Measures the time it takes the
body to move from one
photogate to the second
photogate (between blocking
the first and blocking the
second infrared beams) and
returns the average velocity.
You should enter the distance
between gates in cm.
Acceleration
•
Between gates
Chapter 3 MultiLab Software
47
Measures the crossing time at
the first gate, the time it takes
the body to move from one gate
to the second gate and the
crossing time at the second
gate and returns the average
acceleration.
You should enter the body’s
width in mm.
3. Time Schemes and Calculations
Time measurements
At one gate
t2
t1
Result:
Δt = t 2 − t1
Between gates
t2
Input 1
t1
t3
Input 2
t4
Result:
Δt = t 3 − t1
Velocity
At one gate
Required parameters: w – The body’s width
48
Chapter 3 MultiLab Software
t1
t2
Result:
v=
w
; Δt = t 2 − t1
Δt
Between gates
Required parameters: L – The distance between gates
t2
Input 1
t1
t3
Input 2
t4
Result:
v=
L
; Δt = t 3 − t1
Δt
Acceleration
Between gates
Required parameters: w – The body’s width
Δt
t2
Input 1
Input 2
t1
t3
t4
Chapter 3 MultiLab Software
49
v1 =
Result:
3.3.8.
w
w
; v2 =
t 2 − t1
t 4 − t3
t 4 + t 3 − t 2 − t1
2
v −v
a= 2 1
Δt
Δt =
Save Data
Click Save
on the main toolbar to save your project. This will save all the data
sets, graphs, tables and video movies under one project file.
Saving the project will also save any special formatting and scaling you did.
If you made any changes to a previously saved project, click Save to update the
saved file or select Save as… from the file menu to save it under another name.
Note: To delete a specific data set, graph or table from the project, use the Data Map
(see page 61).
To remove unwanted data from a specific data set, apply the crop tool (see page 98).
3.3.9.
Open a File
1. Click Open
on the main toolbar.
2. Navigate to the folder in which the project is stored.
3. Double click the file name to open the project.
MultiLab opens the project and displays the first graph on the graph list. If the project
does not include saved graphs, the file opens with an empty graph window. Use the
Data Map (see page 61) to display the desired data set.
3.3.10.
Create a New Project
There are three ways to create a new project:
1. Open the MultiLab program, which will open a new file each time.
2. When working in Single Measurement mode, a new project is
opened every time you click on the Run button to start a new
recording
3. Any time you click New button
3.3.11.
on the toolbar.
Import Data
Any file that is in comma separated values text format (CSV) can be imported into
MultiLab.
To import a CSV file:
1. Click File on the menu bar, then click Import CSV file.
50
Chapter 3 MultiLab Software
2. In the dialog that opens, next to Look in, navigate to the drive and
folder that contains the CSV file.
3. Select the file.
4. Click Open.
Tips:
To create a text file in a spreadsheet:
1. Open a new spreadsheet.
2. Enter your data according to the following rules:
a)
The first row should contain headers. Each header includes
the name of the data set and units in brackets, e.g. Distance
(m).
b)
The first column should be the time. The time interval between
successive rows must match the time intervals accepted by
MultiLab. You can export MultiLab files to Excel to learn about
these time formats.
See for example the table below:
3. On the File menu, click Save As.
4. In the File name box, type a name for the workbook.
5. In the Save as type list, click the CSV format.
6. Click Save.
To import files that were previously exported from MultiLab open MultiLab and import
the file as described above as they are already in CSV format.
3.3.12.
Print
1. Print a Graph
1. Click Print
on the main toolbar.
2. Select the Graph 1 option (when in split graph mode you can
choose between Graph 1 and Graph 2).
3. Click Print to open the print dialog box.
4. Click OK.
MultiLab will print exactly what you see in the graph display.
Chapter 3 MultiLab Software
51
2. Print a Table
1. Click Print
on the main toolbar.
2. Select the Table option.
3. If you want to print only a specific range, uncheck the Print all data
check box and type the desired row numbers into the To and From
edit boxes
4. Click Print to open the print dialog box.
5. Click OK.
52
Chapter 3 MultiLab Software
3.4. Viewing the Data
3.4.1.
Display Options
The MultiLab program screen consists of four parts: Graph window, table window,
video window and Data Map window. You can display all four parts simultaneously
(the default view) or any combination of the four.
The graph window is the main window by default and is and displayed in the center
of the application window. To specify other window as the main window:
1. Click View on the menu bar, and then click View selection to open
the View selection dialog box:
Figure 9: View selection dialog box
2. Check the checkbox next to any window you’d like to include in the
view.
3. Click the window display type you want.
4. Click OK.
In addition to these sections, you have the option to display an on-screen meter for
each of the sensors (see page 61).
3.4.2.
Graph Display
Click Graph
to display or hide the graph. The default graph display is the data
set or sets plotted vs. time, but you can change the X-axis to represent any of the
individual data sets (see page 56).
The graph usually displays all the data sets of a given recording, but you can use the
Data Map to remove one or more of the sets from the graph (see page 61).
In order to keep the graph clear and simple, only two Y-axes are shown on the graph
at once. If there are three curves in the graph, one of the Y-axes is hidden. To make
this axis visible, select the corresponding plot with the cursor (see section 2 below).
You can identify the Y-axis by its color, which matches the plot color.
Chapter 3 MultiLab Software
53
1. Split Graph View
MultiLab enables you to display your data in two separate graphs within the graph
window.
1. Click Split graph
on the graph toolbar to split the graph
window into two separate graphs.
2. Click Edit graph
dialog box.
on the graph toolbar to open the Edit graph
3. Choose which data sets to display on each of the graphs (or use the
Data Map to do so – see page 61).
4. To return to the single graph display, click Split graph
second time.
a
2. The Cursor
You can display up to two cursors on the graph simultaneously.
Use the first cursor to display individual data recording values, to select a curve or to
reveal the hidden Y-axis.
Use two cursors to display the difference between two coordinate values or to select
a range of data points.
To display the first cursor:
on the graph toolbar.
Double click on an individual data point or click 1st Cursor
You can drag the cursor with the mouse onto any other point on the plot, or onto a
different plot. For finer cursor movements use the forward and backward keys on the
keyboard.
The coordinate values of the selected point will appear in the information bar at the
bottom of the graph window.
To display the second cursor:
on the graph
Double click again anywhere on the graph area or click 2nd Cursor
toolbar.
The information bar will now display the difference between the two coordinate
values. If the x-axis is time 1/dt will also be displayed.
To remove the cursors:
Double click anywhere on the graph area, or click 1st Cursor a second time.
To remove the 2nd cursor:
Click 2nd Cursor a second time.
54
Chapter 3 MultiLab Software
To display the cursors in split graph mode:
To display the cursors on the upper graph, use the same method as for single graph
mode.
To display the cursors on the lower graph, you must first remove them from the upper
graph and then double click anywhere on the lower graph to display the first cursor.
Double click a second time to display the second cursor, and double click a third time
to remove the cursors.
3. Zooming
To zoom in to a specific data point
1. Select the point with the cursor (see above).
2. Go to Graph > Zoom in on the main menu.
3. To reverse the operation, go to Graph > Zoom out on the main
menu or click Autoscale
on the graph toolbar.
To zoom in to a range
1. Select the range with both cursors.
2. Go to Graph > Zoom in on the main menu.
3. To reverse the operation, go to Graph > Zoom out on the main
menu or click Autoscale
on the graph toolbar.
To zoom in to a specific area
Click Zoom to selection
on the graph toolbar and drag the cursor diagonally to
select the area you want to magnify. Release the mouse button to zoom in to the
selected area.
Click Zoom to selection a second time to disable the zoom tool.
Autoscale
on the graph toolbar to view the full data display, or double click
Click Autoscale
on an axis to auto scale that axis alone.
4. Manual scaling
1. Click Graph properties
properties dialog box.
on the graph toolbar to open the Graph
2. Select the Scale tab, and choose the axis you want to scale in the
Select axis drop down menu.
3. Uncheck the Autoscale check box and enter the new values in the
edit box.
4. Click OK.
To manually scale a specific axis, right click on the axis to open its Properties dialog
box.
Chapter 3 MultiLab Software
55
To restore auto scaling click Autoscale
.
5. The Stretch/Compress Axis tool
Move the cursor onto one of the graph axes. The cursor icon changes to the double
arrow symbol (↔), indicating that you can stretch or compress the axis scale. Drag
the cursor to the desired location. Repeat the procedure for the other axis if
necessary.
Double click on the axis to restore auto scaling.
6. Panning
Use the pan tool after zooming in to see any part of the graph that is outside the
zoomed area.
To do this, click Pan
on the graph toolbar, then click anywhere on the graph and
drag the mouse to view another area.
Click Pan a second time to disable the Pan tool.
7. Edit the Graph
Use the Edit graph dialog box to select which data sets to display on the graph’s
Y-axis and to change the X-axis from time, to one of the data sets.
1. Click Edit graph
dialog box:
on the graph toolbar to open the Edit graph
Figure 10: Edit graph dialog box
2. To select a data set to display on the Y-axis, click on the data set’s
name in the Y-axis list. To display more than one curve, click on the
data sets you want.
3. A list entry that begins with an Experiment (Exp.) number denotes a
recorded data set. A list entry that begins with an input number
denotes the next recording and will be displayed on the graph the
next time you start a recording.
56
Chapter 3 MultiLab Software
4. To deselect a data set click on the set a second time.
5. To select a data set for display on the X-axis, click on the data set’s
name in the X-axis list. You can only select one data set at a time for
the X-axis.
6. Type the title of the graph in the Graph title edit box (optional).
7. Click OK.
8. Format the Graph
You can change the data line’s color, style and width. You can also add markers that
represent the data points on the graph and format their style and color.
The color of the Y-axis matches the corresponding plot’s color and will automatically
change with any change made to the color of the corresponding plot.
1. Click Graph properties
properties dialog box.
on the graph toolbar to open the Graph
2. Select the Lines tab, and then select the plot or axis you want to
format in the Select plot drop list.
3. From here you can format the line’s color, style and width, as well
as the markers’ color and style. To remove the line or the marker,
uncheck the corresponding Visible check box.
4. Click OK.
5. To restore the default formatting, click Restore default.
9. Change the Graph’s Units and its Number Format
1. Click Graph properties
properties dialog box
on the graph toolbar to open the graph
2. Select the Units tab, and then select the plot or axis you want to
format in the select plot drop list.
3. Choose the prefix option you want.
4. Select the desired number of decimal places.
5. To display numbers in scientific format, check the Scientific check
box.
6. Click OK.
Chapter 3 MultiLab Software
57
10. Add Annotations to the Graph
You can add annotations to the graph. An annotation is always connected to a
certain data point.
To view annotations:
Click Graph on the menu bar and then select Show annotation (this option is
usually selected by default).
To add an annotation:
1. Place a cursor on the desired point.
on the graph toolbar to display the
2. Click Add new annotation
new annotation caption edit box.
3. Type in the text, and then click OK.
To move an annotation:
1. Click Move annotation
on the graph toolbar.
2. Click on the annotation you want to move, then drag if to the new
position.
3. Click Move annotation
annotation mode.
a second time to exit the move
To edit an annotation:
1. Place a cursor on the point to which the annotation is connected.
2. Click Graph on the menu bar, and then click Edit annotation.
3. Edit your annotation, and then click OK.
To delete an annotation:
1. Place a cursor on the point to which the annotation is connected.
2. Click Graph on the menu bar, then click Delete annotation.
To hide all annotations:
Click Graph on the menu bar and then click Show annotation to uncheck it.
58
Chapter 3 MultiLab Software
11. Add a Graph to the Project
MultiLab displays new data in the graph window every time you start a new
recording. You can always display previous data using the Edit graph dialog box or
by double-clicking on the data’s icon in the Data Map. If you want to save a graph
that you created to your project, or to update a saved graph with changes you made,
use the Add to project tool:
Click Add to project
3.4.3.
on the graph toolbar.
The Table Display
Click Table
to display or to remove the table window.
When you start a new recording, MultiLab displays the new data on the table.
To add or remove columns from the table, use the Edit table tool (see below).
1. Editing Data Values
You can change the value of any data point. When any value is changed, MultiLab
automatically creates a copy of the data set and leaves the original data unchanged.
To do this:
1. Select a data cell by clicking on it.
2. Type in the new value.
3. Press Enter on the keyboard to accept (you can also press Tab or
the arrow keys to accept and move to the next cell).
2. Editing the Table
To add or remove data sets from the table:
Click Edit table
box:
on the table toolbar to open the Edit table dialog
Figure 11: Edit table dialog box
Chapter 3 MultiLab Software
59
To add columns to the table:
1. Select one or more of the data sets from the Available Columns
list.
2. Click Add.
To remove columns from the table:
1. Select one or more of the data sets from the Current Columns list.
2. Click Remove.
3. Click OK.
3. Formatting the Table
Changing column width
Drag the boundary on the right side of the column heading until the column is the
desired width.
Changing row height
Drag the boundary below the row heading until the row is the desired height.
Formatting the fonts
1. Click Table properties
on the table toolbar.
2. Select the Font tab.
3. Format the font, as well as the font style and size.
4. Click OK.
Changing units and number format
1. Click Table properties
on the table toolbar.
2. Select the Units tab, and then select the plot you want to format
from the select plot drop list.
3. Choose the prefix option you want.
4. Select the desired number of decimal places.
5. To display numbers in scientific format, check the Scientific check
box.
6. Click OK.
4. Add a Table to the Project
MultiLab displays new data in the table window every time you start a new recording.
You can always display previously recorded data using the Edit table dialog. If you
want to save a table that you created to your project, or to update a saved table with
changes you made, use the Add to project tool:
Click Add to project
60
on the table toolbar.
Chapter 3 MultiLab Software
3.4.4.
Meters
MultiLab enables you to view data in meters format on the screen (one meter for
each sensor), with up to four meters showing at once. The meters can display live
data while MultiLab is recording, or saved data when a saved file is replayed.
When a cursor is displayed, the meter shows the measured values that correspond
to the time of the point at which the cursor is positioned.
There are three meter types: analog, bar and digital. The meter’s scaling
automatically matches the graph’s scaling.
To set up the meters:
1. Click Meter Setup
on the main toolbar:
2. Select the meter type, and the data set to be displayed.
3. A list entry that begins with a graph number denotes a displayed
data set. A list entry that begins with an input number denotes the
next recording, and will be displayed on the meter the next time you
start a recording.
4. Repeat this procedure for up to four meters.
5. To remove the meters click Meter Setup
all.
3.4.5.
, and click Remove
Data Map
Click Data Map
to display or remove the Data Map.
The data map is a separate window that displays the list of data sets that were
recorded or downloaded in the current session, as well as the lists of all the saved
graphs and tables. Use the Data Map to navigate through the available data sets and
to keep track of the data that is displayed in the graph window.
1. Control the Display with the Data Map
The items in the Data Map are sorted into three main categories:
• Data sets (including analysis functions)
• Saved graphs
• Saved tables
Double click on a category to bring up the full list. Double click a second time to
collapse the list. You can also use the plus (+) and minus (-) signs next to the icons
to expand or collapse the categories.
The Data sets list expands to sub-categories of experiments and functions. To
display the complete list of measurements, or the complete list of analysis functions
performed on the measurements for any individual experiment, double click the
experiment’s icon or click the plus sign (+) next to it.
To collapse a list under an individual experiment, double click the experiment’s icon
or click the minus sign (-) next to it.
To display a data set or a saved graph in the graph window, or to display a table in
the table window, double click its icon. Double click a second time to remove it.
Chapter 3 MultiLab Software
61
You can also use a shortcut menu to display or remove a data set from the graph.
Simply right-click an icon, then click display on graph #1 or display on graph #2.
To delete an individual item from the Data Map and from the project, right-click on its
icon and click Delete. To permanently delete the item, click Save
on the main
toolbar.
To remove all data sets from the Data Map, right-click the Data sets icon
Clear All Data.
and click
2. Understanding Data Map Icons
Data sets list
Functions – includes all the analysis functions of the project
Individual function – Currently not on display
Individual function – Currently displayed on graph 1
Individual function – Currently displayed on graph 2
Individual function – Currently displayed both on graphs 1 and 2
Function
Experiment – Includes all recorded data of the experiment
Individual data set – Currently not on display
Individual data set – Currently displayed on graph 1
Individual data set – Currently displayed on graph 2
Individual data set – Currently displayed both on graphs 1 and 2
Data recorded without video
Data recorded with video
List of saved graphs
Saved graph – Data sets vs. time
Saved graph – Data sets vs. data set
Graph currently not on display
Graph currently displayed on graph 1
Graph currently displayed on graph 2
Graph currently displayed both on graphs 1 and 2
List of saved tables
Saved table
Table not currently displayed
Table currently displayed
62
Chapter 3 MultiLab Software
3.4.6.
Export Data to Excel
Click Export to Excel
on the graph toolbar to export the displayed data to Excel.
You will be given the option of saving the data in a specific location, and then
MultiLab will open a new Excel workbook displaying the data.
1. Export File Settings
If MultiLab fails to export the data properly, try to change the export file settings:
1. Click File on the menu bar, and then click Export file settings.
2. Check the Ignore regional settings check box.
3. Click OK.
3.4.7.
Copy the Graph as a Picture
You can copy the graph to the clipboard as a picture and then paste it to other
Windows programs such as Word or PowerPoint:
1. In the Graph menu, click Copy graph.
2. Open the destination file.
3. In the destination file, right click and select Paste.
Chapter 3 MultiLab Software
63
3.5. Programming the Data Logger
3.5.1.
Setup
1. Quick Setup
Use the Setup wizard to guide you through the setup process.
1. Click the Setup wizard icon on the main toolbar to launch the setup
process for the data logger. The USBLink Setup icon is
MultiLogPRO Setup icon is
. The
.
Figure 12: Setup wizard step 1 of 3
The first step is to assign sensors to each input. If you are working
with the data logger in Auto ID mode, the sensors are selected
automatically as you plug them in to the data logger. Otherwise, you
can manually select the sensors you are using from the corresponding
input drop down menus.
2. Click Next to move to the second step:
Figure 13: Setup wizard step 2 of 3
64
Chapter 3 MultiLab Software
3. Select the desired recording rate in the Select rate drop down
menu.
4. Select the Scroll option if you want the graph window to scroll as
the data recording progresses.
5. Select the desired data recording mode in the Select recording
mode drop down menu.
6. Click Next to move to the third step:
Figure 14: Setup wizard step 3 of 3
7. Select the desired length of the recording period in the Select
recording time drop down menu.
The recording period is displayed as a unit of time by default. To
display the recording period as the number of recording samples,
select the By samples option. The number of samples is calculated
with the following formula:
Total recording samples = Recording rate x Recording period
8. To start the data recording only when a specific time or
measurement condition has been met click Triggering to open the
triggering dialog box (see page 68).
9. Click Finish to complete the setup and to send the setup command
to the data logger.
2. Defining Sensor Properties
Some of the sensors can produce more than one measurement. For example, the
distance sensor measures distance, but MultiLab also calculates the velocity and
acceleration of the measured body in real-time. MultiLab automatically displays the
basic measurement of distance, but enables you to display any combination of
distance, velocity and acceleration. Other sensors may only give one measurement,
but can display the data in different units. For example, the acceleration sensor can
display the acceleration in multiples of the gravity acceleration, or in the standard unit
m
s2
.
Chapter 3 MultiLab Software
65
The Distance and Force sensors properties include definition of the positive direction
and the distance sensor properties enable online averaging as this sensor is
comparatively noisy.
You can define the properties of each sensor individually in the first step of the Setup
wizard, or by selecting Calibrate sensors from the Logger menu.
1. Click Setup Wizard on the main toolbar to open the Setup wizard
2. Click Properties
next to the input you want to set.
3. Click the check boxes next to the desired measurements.
4. To change more properties, click the corresponding tab at the top of
the dialog box.
5. Click OK.
3. Setting the Zero Point of a Sensor
MultiLab enables you to rescale some sensors and to set the current readings to zero
for subsequent loggings. This feature applies to the following sensors:
•
Distance
•
Force
•
Magnetic field
•
Light sensors
•
Pressure sensors
To set the current readings of a sensor to zero:
1. Click Setup Wizard on the main toolbar to open the Setup Wizard.
2. Click Properties
next to the input you want to set.
3. Click the Set Zero tab.
4. Check the Set the current reading to zero checkbox.
5. Click OK.
6. Click Finish
MultiLab takes a single measurement and set the reading to zero.
To change the zero point:
1. Click Setup Wizard on the main toolbar to open the Setup Wizard.
2. Click Properties
next to the input you want to set.
3. Click the Set Zero tab.
4. Click Reset zero.
66
Chapter 3 MultiLab Software
5. Click OK.
6. Click Finish.
To return to the default zero point:
1. Click Setup Wizard on the main toolbar to open the Setup Wizard.
2. Click Properties
next to the input you want to set.
3. Click the Set Zero tab.
4. Uncheck the Set the current reading to zero checkbox.
5. Click OK.
6. Click Finish.
4. Presetting the Display
You may want to define the graph’s settings, such as formatting and scaling the
graph and selecting the axes, and to define the meters’ settings prior to beginning a
recording session. You can define the settings of each sensor input individually in the
first step of the Setup Wizard:
1. Click Setup Wizard on the main toolbar to open the Setup Wizard.
2. Click Properties
next to the input you want to set.
3. Click the Display properties tab.
4. Select a measurement from the Select measurement drop down
menu.
5. Select the graph or graphs in which you would like to display the
data, from the Display on graph drop down menu.
6. Select a meter in the Meter type drop list if you want to display the
data in a meter as well as on the graph.
7. Format the line and markers in the Plot section.
8. If you want a specific scale, uncheck the Auto scale checkbox and
enter the desired minimum and maximum values of the axis.
9. Click OK.
5. Presetting the Graph’s X-axis
1. Click X-Axis display properties in the first step of the Setup Wizard
to open the dialog box:
Chapter 3 MultiLab Software
67
Figure 15: X-axis properties dialog box
2. Select the graph you wish to modify.
3. Select the measurement you’d like to display on the X-axis.
4. If you want a specific scale, uncheck the Auto scale check box and
enter the minimum and maximum values of the axis.
5. Click OK.
6. Triggering
To start the data recording only when a specific time or measurement condition has
been met, click Triggering in step 3 of the Setup Wizard to open the triggering dialog
box:
Figure 16: Triggering dialog box
1. Select the triggering sensor in the Based on sensor drop down
menu.
2. Choose one of the following from the Type options:
a)
68
None - Trigger is disabled
Chapter 3 MultiLab Software
b)
Above level - Start logging only once the measured
value is higher than the trigger level.
c)
Below level - Start logging only once the measured
value is lower than the trigger level.
d)
Event Recording - This function enables you to
record the exact time and date at which a certain
phenomenon occurs: The trigger level set for this
option is actually a threshold setting. Each time the
threshold is crossed, the data logger will record the
exact time and date of the occurrence, and will
continue to do so until the desired number of samples
has been obtained.
Note: The trigger acts on analog measurements only (not on the Distance sensor).
The trigger condition must be fulfilled for at least 300 μS.
e)
Control Level - The Control Level trigger allows you
to create an automatic sense & control system. This
means that you can connect a sensor measuring a
certain phenomenon (for example, temperature) and
connect a device that will start operating when the
recorded data from the sensor falls above or below a
certain level (for example, a fan that will start
operating when the temperature measured by the
sensor rises above 30 °C). This function requires the
use of a Splitter cable and a Control sensor. The
cable divides each input into a sensor cable and a
controller cable. After setting the control level and
starting the data logging process, the sensor will
sample and record the data as usual. However, when
the measurement from the sensor rises above the
predetermined threshold value, the controller cable
will send a pulse of 5 V to the Control sensor, and will
continue to do so until the sensor measures a value
below the threshold level. When receiving the 5 V
pulse, the Control sensor will close/open a relay
capable of switching 110/220 V to any load.
f)
Time delay - This trigger type enables you to set a
timer that will start the logging after a predetermined
amount of time. After setting the trigger to Timer
Delay, click the down arrow on the Level combo-box,
and select from the 17 different time options. The
timer will start its countdown when you click RUN, and
the actual recording will start once the countdown has
ended.
3. Select the trigger level in the Level drop down menu.
4. Click OK.
Note: When you turn off the MultiLogPRO, it will save the setup for the next session.
Chapter 3 MultiLab Software
69
3.5.2.
Start Recording
Click Run
recording mode.
on the main toolbar. Click the down arrow to change the
3.5.3.
Stop Recording
Click Stop
on the main toolbar.
3.5.4.
Clear USBLink’s Memory
This function is not relevant for the USBLink as it doesn’t have onboard memory.
3.5.5.
Clear MultiLogPRO’s Memory
To erase all experiment data currently stored in the MultiLogPRO, click Clear
memory in the Logger menu.
3.5.6.
Edit MultiLogPRO’s Experiment Notes
1. Connect MultiLogPRO to the PC.
2. Select Edit notes from the Logger menu to open the Notes dialog
box with the MultiLogPRO’s current experiment’s notes downloaded
to the window.
Figure 17: Edit experiment notes dialog box
3. From this dialog box, you can edit, delete, or write new notes.
Note: An experiment note is limited to 140 characters and a maximum of 5 notes can
be stored in MultiLogPRO at any time.
4. Use the arrow buttons to move to the next note, or to the previous
one.
5. Click OK to upload the edited notes to MultiLogPRO.
70
Chapter 3 MultiLab Software
3.5.7.
Calibrating the Sensors
MultiLab enables you to calibrate any of the sensors manually. This calibration is
much more accurate than the calibration performed by USBLink or MultiLogPRO.
With MultiLab, you can calibrate the sensor using two points instead of the one point
automatic offset calibration used by the data logger:
1. Connect the data logger to the PC.
2. Select the Calibrate sensors option from the Logger menu.
3. Choose a sensor from the Select sensor drop down menu and click
OK.
4. Click the Calibration tab.
5. Enter a distinct real value in each of the Real Value edit boxes and
the corresponding measured values in each of the Measured Value
edit boxes (The measured values are the values displayed by
MultiLab when measuring the two real values).
6. Click OK.
The calibrated sensor parameters will be saved, so there is no need to calibrate the
data logger every time you run the MultiLab program.
To reset to the default calibration for any sensor, select the sensor and click Restore
defaults.
3.5.8.
Define a Custom Sensor
Ordinarily, you will not need to use this option, but MultiLab enables the user to
define additional custom sensors. This is a useful tool for when the data logger is
communicating with many sensors from different vendors. See section 6.3 on page
134 for a list of supported sensors.
Any additional sensor that you would like to connect to USBLink or MultiLogPRO
must comply with the following restrictions:
• The sensor’s output must be greater than or equal to 0V and less than or
equal to 5V. Remember that all sensors transform actual data into electrical
data, so the electrical output should remain between 0 and 5 V.
• The sensor Transfer Function (sensor output voltage changes vs. the sampled
phenomenon changes) must be a linear Transfer Function.
• The sensor must have a code resistor in order to be automatically identified. If
the sensor does not have a code resistor, you will have to work in 8 inputs
mode and select the sensor manually.
To determine whether your sensor has a code resistor or not, simply plug it in to
the data logger (while in Auto ID mode) and see if MultiLogPRO displays the
setup menu and the sensor name.
Refer to the appendix to learn how to add a code resistor to your custom sensor.
To define a new sensor:
1. Connect the data logger to the PC.
2. Select Define new sensor from the Logger menu to open the
Define new sensor dialog box:
Chapter 3 MultiLab Software
71
Figure 18: Define new sensor dialog box
3. Click Add New Sensor.
4. Type a sensor name and a sensor unit into the relevant fields.
5. Type in two calibration values (two real values and the
corresponding output voltages of the sensor).
6. Click OK.
3.5.9.
Communication Setup
USBLink communicates with the MultiLab software via a USB port and the
MultiLogPRO communicates via a USB or Serial communication port. Some users
may find it difficult to select the correct port, in which case MultiLab can perform an
automatic port selection, and can also report on the status of all available ports.
Automatic COM Port recognition
The computer may have several communication ports. One of these ports is usually
available for external communication. It is not necessary to know which port is
available, since MultiLab will find it for you:
1. Connect the communication cable from the data logger to one of the
computer COM port connectors.
2. Turn on the data logger and launch the MultiLab software.
MultiLab automatically attempts to communicate with the data logger. Once
communication is established, MultiLab reports the connection in the status bar at the
bottom of the application window.
If communication fails:
Working in Windows OS
1. Select Comm Setup from the Logger menu. MultiLab will display a
dialog box reporting what COM ports are already in use, and which
port is recommended for use with the USBLink or MultiLogPRO:
72
Chapter 3 MultiLab Software
Figure 19: Communication setup dialog box (Windows)
2. Click Try to connect and MultiLab will try to communicate with the
logger. If communication is achieved, MultiLab will designate the
selected port as the specific logger’s communication port.
You can override the MultiLab recommendation and choose the COM port yourself
by clicking the checkbox button to the left of the desired port, and clicking Try to
connect.
Note: In the event of any communication malfunction, please refer to 4.1:
Troubleshooting Guide.
3. You can click Work offline if you wish to work without the logger.
While working offline, you can still open saved files to view and
analyze them.
Working in Mac OS
1. Select Comm Setup from the Logger menu. MultiLab will display a
dialog box listing the available ports:
Figure 20: Communication setup dialog box (Mac OS)
2. Select a port from the drop down menu.
3. Click Try to connect and MultiLab will try to communicate with the
data logger. Once communication is established, MultiLab reports
the connection in the status bar at the bottom of the application
window.
Chapter 3 MultiLab Software
73
4. Click Cancel if you wish to work without the data logger. While
working offline, you can still open saved files to view and analyze
them.
Note: MultiLab for MAC does not support the USBLink at this time.
3.6. Analyzing the Data
3.6.1.
Reading Data Point Coordinates
Position the cursor (see page 54) on a point to display its coordinates on the
information bar at the bottom of the graph window.
If more than one curve is displayed, and you want to read the Y- coordinates of all of
the curves simultaneously, bring up digital meters (see page 61) for each of the
curves. When you position a cursor on one curve, the meters will show the
corresponding Y-coordinates for the other curves.
3.6.2.
Reading the Difference between two Coordinate Values
Position one cursor on the first point and a second cursor on the second point to
display the difference between the two coordinate values on the information bar at
the bottom of the graph window.
3.6.3.
Working with the Analysis Tools
The analysis tools can only be applied to data sets that are displayed in the graph
window.
1. Use the cursors (see page 54) to select the graph and the data
range to which you want to apply the analysis.
2. Select the analysis function you wish to use.
The analysis function will be added onto the graph, with the exception of the
smoothing (averaging) function, which will replace the original data set.
To measure and analyze time events with photogates use the Timing Wizard (see
page 98).
3.6.4.
Smoothing
The smoothing tool is very useful in reducing random noises, especially if you want to
apply any analysis functions to the data. The smoothing process replaces every data
point with the average of its neighboring points.
1. Use the cursor to select the graph that you want to smooth.
2. Click More smoothing
on the graph toolbar.
3. You can repeat the procedure to further smooth the data.
4. Click Less smoothing
74
Chapter 3 MultiLab Software
to reduce the amount of smoothing.
3.6.5.
Statistics
Use the statistics tool to display statistics of a selected data set or a range of data.
The statistics include:
Average
The average of all the numbers in the range
Median
The median is the number in the middle of a set of numbers; that is, half
the numbers have values that are greater than the median, and half
have values that are less. If there is an even number of numbers in the
set, then Median calculates the average of the two numbers in the
middle
StDev.
The standard deviation
Minimum
The smallest value in the range
Maximum
The largest value in the range
Sum
Adds all the numbers in the range
Area
The area between the graph and the x-axis in the range
Samples
The number of data points in the range
Rate
The recording rate
To display statistics:
1. Use the cursors to select the graph and the data range to which you
want to apply the statistics.
2. Click Analysis on the menu bar, and then click Statistics.
MultiLab will open a statistics window and will display the results in it.
3.6.6.
Most Common Analysis Functions
1. Linear Fit
Click Linear Fit
on the main toolbar to draw a line of linear least square fit
y = ax + b
and to display the line’s equation.
Note: If you want the automatic curve fit equation to start at t = 0 , apply the crop tool
before applying the linear fit (see page 98).
2. Derivative
Click Derivative
on the main toolbar to construct a graph in which each point is
the slope of the three consecutive points on the source graph.
Chapter 3 MultiLab Software
75
3. Integral
Choose Integral from the Analysis menu to construct a graph in which each point is
the integral of all the preceding points on the source graph.
3.6.7.
The Analysis Wizard
1. Using the Analysis Wizard
The analysis wizard will guide you through the various analysis functions available in
the MultiLab program. The analysis functions are grouped into three main categories:
curve fit (regression), averaging, and mathematical and trigonometric functions.
To apply an analysis function to a data set:
1. Use the cursors to select the graph or data range to which you
would like to apply the analysis (optional – you can select the
desired data set directly from the Analysis Wizard).
2. Click Analysis Wizard
on the main toolbar.
3. Click a category tab:
a)
Curve fit
b)
Averaging
c)
Functions
2. Curve Fit
Figure 21: Analysis wizard – curve fit
1. Select a fit type by clicking its icon (If you choose polynomial fit,
select the order you want).
76
Chapter 3 MultiLab Software
2. If you use the cursor to select a data set, it will be highlighted in the
Based on data set list, but you have the option of selecting a
different data set.
3. Type a name in the Name box (optional - the default name includes
both the function and the data set names).
4. Click the Show equation on graph check box to display the line’s
equation on the information bar.
5. Click the Show R2 on graph check box to display the correlation
coefficient on the information bar.
6. Click OK.
Note: If you want the automatic curve fit equation to start at t = 0 , apply the crop tool
before any type of curve fitting (see page 98).
3. Averaging
Figure 22: Analysis wizard – averaging
1. If you use the cursor to select a data set, it will be highlighted in the
Based on data set list, but you have the option of selecting a
different data set.
2. Select an averaging option (if you choose custom averaging,
choose the number of averaging points in the Points box).
3. Enter a name in the Name box (optional - the default name include
both the function and the data set names).
4. Select an Open option.
5. Click OK.
Chapter 3 MultiLab Software
77
4. Functions
Figure 23: Analysis wizard – functions
1. Select a function from the Functions list. MultiLab displays the
function’s formula at the bottom of the dialog box.
2. If you use the cursor to select a data set, it will be highlighted in the
G1 drop down menu, but you have the option of selecting a different
data set.
Tip: To create a function whose independent variable is time (e.g. to fit a
mathematical function to a data series), select a time series from the G1 drop down
menu. If there are several plots on the graph the list includes a separate time series
for each plot as the number of data point may vary from plot to plot.
3. If the analysis function involves two data sets, select the second
data or time series set from the G2 drop down menu.
4. To synchronize the Y – Scale with one of the plots on the graph,
check the Synchronize scale with checkbox and select the
appropriate plot from the adjacent drop down menu.
5. Enter a constant in each of the A, B and C boxes (optional, the
default values are one for a coefficient and zero for a free term).
6. Enter a name in the Name box (optional – the default name includes
both the function’s formula and the data set name).
7. Enter a unit (optional).
8. Select an Open option.
9. Click OK.
78
Chapter 3 MultiLab Software
5. Editing a Function
MultiLab enables you to edit the functions parameters as well as its name and units
after you have displayed it on the graph. The Edit function command is enabled for
all the analysis functions created in the current session and is disabled when you
open a stored file.
To edit the function:
1. Right click the function's icon in the Data Map to open a context
menu.
2. Click Edit function to open the Function dialog.
3. Enter the new parameters.
4. Click OK.
3.6.8.
Available Analysis Tools
This section includes a brief description of each of MultiLab’s analysis functions.
For time, velocity and acceleration analysis see also the Timing Wizard on page 98.
1. Curve Fit
Linear
y = ax + b
Draws a line of linear least square fit.
Polynomial
y = a 0 x n + a1 x n −1 + L + a n
Draws a line of polynomial least square fit (you must select an order
between 1 and 6.)
Power
y=
a
xn
Draws a line of power least square fit.
Chapter 3 MultiLab Software
79
Exponential
y = ae bx
Draws a line of exponential least square fit.
MultiLab displays the curve fit equation and the correlation coefficient (R2) on the
information bar below the graph.
2. Averaging
The average function replaces every point with the average of n neighboring points
from both sides of the point.
Low averaging: n = 5 , Medium averaging: n = 11 , High averaging: n = 41 .
3. Functions
In the formulas below, G1 and G2 represent selected data sets or time series, and A,
B and C are constants that you can enter.
Absolute
y = A BG1
Draws a line of the absolute values of a data set.
y = AG1 + BG2
Add
Draws a line of the addition of two data sets.
Arccosine
y = A arccos( BG1 )
Draws a line of the arccosine values of a data set (in radians).
Arccosine is the angle whose cosine is BG1 . The argument BG1
must be between –1 and 1.
Arcsine
y = A arcsin( BG1 )
Draws a line of the arcsine values of a data set in radians. Arcsine is
the angle whose sine is BG1 . The argument BG1 must be between –
1 and 1.
Cosine
y = A cos( BG1 + C )
Draws a line of the cosine values of a data set. The argument
BG1 + C must be expressed in radians.
Delta Y
y = G1 − G1 (t = 0)
Draws a line of the difference between the Y-coordinate of every
point and Y-coordinate of the first point. Use this function to move the
data set along the Y-axis so that the point will intersect the Y- axis at
the origin.
80
Chapter 3 MultiLab Software
Derivative
yn =
y n +1 − y n −1
1
, Δt =
sampling rate
2Δt
Draws a line of the slopes of every three consecutive points of a data
set. For high recording rates and small Δt, this line may be very noisy,
which is why smoothing the data set is recommended before applying
the derivative function.
Divide
y=
AG1
BG2
Draws a line of the division of two data sets
Envelope
(lower)
Lower envelope of G1 with tolerance of A points
Draws a line that connects the minimum values of a data set. The
tolerance defines the minimum distance (in sampling points) between
two minima, so that the envelope function is able to ignore random
noises.
Envelope
(upper)
Upper envelope of G1 with tolerance of A points
Draws a line that connects the maximum values of a data set. The
tolerance defines the minimum distance (in sampling points) between
two maxima, so that the envelope function will be able to ignore
random noises.
Exp.
y = Ae BG1 + C
Draws a line of e raised to the power of a data set.
Fourier
transform
Discrete Fourier transform of G1.
Draws a line of the amplitudes of the harmonics of Fourier transform
vs. frequency.
Frequency
The frequency of G1 (minimum of A points in one cycle).
Draws a line of the frequency of a periodic data set vs. time. The
constant A defines the minimum data points in one cycle.
Integral
y = A + B ∑ G1 Δt
Draws a line in which each point is the discrete integral of all the
preceding points in a data set.
Chapter 3 MultiLab Software
81
Kinetic
energy
y=
1
A(G1 ) 2
2
Draws a line of the kinetic energy of a data set. The argument G1
must be the velocity of the body, and the constant C1 must be the
mass of the body.
y = AG1 + B
Linear
Draws a line of a linear displacement of a data set. This function is
useful when you want to change the point of origin of a data set.
y = A ln( BG1 )
Ln
Draws a line of the natural logarithm of a data set. The argument
BG1 must be positive.
y = A log10 ( BG1 )
Log
Draws a line of the logarithm of a data set to base 10. The argument
BG1 must be positive.
y = AG1 ⋅ BG2
Multiply
Draws a line of the multiplication of two data sets
Quadratic
y = AG1 + BG1 + C
2
Draws a line of the quadratic form of a data set.
Reciprocal
(1/X)
y=
A
+C
G1 + B
Draws a line of the reciprocal values of a data set.
y = A sin( BG1 + C )
Sine
Draws a line of the sine values of a data set. The argument BG1 + C
must be expressed in radians.
Square (X2)
y = A( BG1 ) 2
Draws a line of the squares of a data set.
82
Chapter 3 MultiLab Software
Square root
y = A BG1 + C
Draws a line of the square root values of a data set: The argument
C 2 G1 must be greater than or equal to zero.
Subtract
y = AG1 − BG2
Draws a line the subtraction of two data sets.
y = A tan( BG1 + C )
Tan
Draws a line of the tangent values of a data set. The argument
BG1 + C must be expressed in radians.
3.6.9.
Online Analysis
MultiLab enables you to analyze data from a live experiment and to display the
analysis function in the graph window, as the data is being recorded and processed.
To execute online analysis, you will first have to use the Analysis Wizard to define
the function to be used, and then edit the graph in order to display the function (see
page 56).
For example, here is how to set up an online envelope (amplitude) function of data,
recorded with a Voltage sensor connected to Input 1:
on the main toolbar to open the
1. Click Analysis Wizard
Analysis Wizard dialog box:
Figure 24: Analysis Wizard – online functions
2. Select Envelope (upper) from the Functions list.
3. Select Input 1: Voltage from the G1 drop down menu.
4. Click OK.
Chapter 3 MultiLab Software
83
5. Click Edit graph
dialog box:
on the graph toolbar to open the Graph edit
Figure 25: Using graph edit dialog to display online functions
6. In the Y-Axis list click Input 1: Voltage to select it and then click
Online function: Envelope (upper) to select it.
7. If there are other highlighted data sets in the Y-Axis list, deselect
them by clicking on them.
8. Click OK.
9. Click Run
on the main toolbar to start recording. MultiLab will
display the original data readings coming from Input 1, as well as the
data processed by the analysis function:
Figure 26: Online envelope function
84
Chapter 3 MultiLab Software
The online analysis function will still be active in subsequent recordings.
To remove the online functions, click Analysis on the menu bar and then click Clear
online functions.
3.6.10.
Manual Curve Fitting
The manual curve fit tool enables you to draw a mathematical curve, to change the
curve’s parameters until it fits into data set, and to display the resulting equation.
There are four types of mathematical curves you can draw:
y = At + B
Linear
Draws a straight line.
y = A(t − B) 2 + C
Quadratic
Draws a parabola.
Exponential
y = Ae Bt + C
Draws an exponential line.
Power
y = At B + C
Draws a line of the time raised to the power of a number from –5 to 5.
Note: If you want the curve fit equation to start at t = 0 , apply the crop tool before
any type of curve fitting (see page 98).
To apply manual curve fit:
1. Click on the Analysis menu, then click Manual curve fit to display
the Manual curve fit dialog box.
2. To select a data set for display on the X-axis, click on the data set’s
name in the X-axis list.
3. To select a data set to display on the Y-axis, click on the data set’s
name in the Y-axis list.
4. Click OK. MultiLab will display the Manual curve fit toolbox at the
bottom of the graph window:
Figure 27: Manual curve fit toolbox
Chapter 3 MultiLab Software
85
5. Choose one of the four curves by clicking its icon in the toolbox.
6. Use the sliders to change the A, B and C parameters until the new
curve fits the sampled curve.
7. The lower and upper limits of each sliding bar are located on the
sliding bar’s left and right ends, respectively. You can change the
limit values by clicking a limit box, and typing in your new value.
MultiLab will display the resulting equation on the information bar at the bottom of the
toolbox.
8. Click Add to project
project.
in the toolbox to add the curve to the
9. To close the manual curve fit toolbox click Exit
in the toolbox.
3.7. Video Motion Analyzer
3.7.1.
Overview
MultiLab’s Video Motion Analyzer enables you to capture position and time from
video movies, convert this to data sets and analyze the data with all of MultiLab’s
analysis tools the same way you would analyze data from the data logger. You can
capture one-body motion or two-body motion. You can select the origin and rotate
the coordinate system.
With the Video Motion Analyzer you can also capture video movies either directly
from video camera connected to the computer or from an external video source such
as VCR.
3.7.2.
Getting Started
1. Video Motion Analyzer Basics
Open the Video Motion Analyzer module
Click Video Analysis
on the main toolbar
Open a movie from MultiLab’s movie library or capture a new movie
Capture position and time
86
•
Scaling – Scale the video to the real world dimensions
•
Coordinate system – Set origin and axes direction
•
Step – Set the number of frames you will capture position and time
•
Marking – Mark the position of the body on the frames. MultiLab will
automatically convert it to numerical data
Chapter 3 MultiLab Software
Analyze the data
The captured data is automatically displayed in the graph and table windows.
Analyze it as you would normally with MultiLab’s projects.
2. Saving a New Movie
1. After you have finished capturing a new video movie click Analyze
movie
to begin capturing position and time.
2. MultiLab prompts to save the movie.
3. Type a name in the File name box and click Save.
3. Opening a Stored Movie
1. Click Video Analysis
2. Click Open Movie
toolbar).
on the main toolbar.
on the Video Motion Analyzer toolbar (lower
3. Double click the movie you want to open.
4. Saving a Video Motion Analyzer Project
1. Click Save
on the main toolbar.
2. Type a name in the File name box and click Save.
5. Opening a Video Motion Analyzer Project
1. Click Video Analysis
2. Click Open
on the main toolbar.
on the main toolbar.
3. Double click the Project you want to open.
3.7.3.
Capturing a New Movie
There are two basic options for capturing video onto your computer from:
•
A device attached to your computer
•
An external source through a video capture board
1. From a Device Attached to your Computer
From a device attached to your computer (such as a Web cam), you can capture
video directly from the camera to your computer. Web cams are intended primarily to
Chapter 3 MultiLab Software
87
feed video over some connection (the Internet, for example). They generally produce
lower video quality. With a Web cam, you can only record when the Web cam is
attached to the computer. If quality and versatility are not your main concern, this
may be the best solution for you.
To capture video from a Web cam:
1. Connect the Web cam to the computer.
2. Click Video on the menu bar, and then click Enable video.
3. Click Video Analysis
Motion Analyzer module.
on the main toolbar to open the Video
4. Click Capture new movie
toolbar.
on the Video Motion Analyzer
5. To begin recording click Record
toolbar.
6. To finish recording click Stop
7. Click Analyze movie
on the Capture new movie
.
to begin capturing position and time.
8. MultiLab prompts to save the movie before processing it.
2. From an External Source through a Video Board
Many video capture boards offer video-in/video-out features. A video capture card
can be used with a wide variety of video sources and through a number of digital
connections. Video from a VCR or video camera can be captured through video-out
ports.
To capture video from a videotape through a VCR:
1. Insert the tape into the VCR. Go to the point you want to capture
and then stop the tape.
2. Find the video-out on the back of the VCR and connect one end of
the appropriate cable. Connect the other end of the cable to the
video-in on your video capture board.
3. Click Video on the menu bar, and then click Enable video.
4. Click Video Analysis
Motion Analyzer module.
5. Click Capture new movie
toolbar.
88
Chapter 3 MultiLab Software
on the main toolbar to open the Video
on the Video Motion Analyzer
6. To begin capturing click Record
toolbar.
on the Capture new movie
7. Play the video. Make sure that you start the video after you start the
capture to make sure nothing gets cut off from the beginning.
8. To finish capturing stop the VCR and click Stop
9. Click Analyze movie
.
to begin capturing position and time.
MultiLab prompts to save the movie before processing it.
3.7.4.
Capturing Position and Time
1. Scaling
In order to scale your project you must tell MultiLab the real world dimensions. When
you film a new movie make sure to measure the dimension of a dominant object in
the frame. Try to find an object that's dimensions are in the magnitude of the whole
scene.
Scaling is done in two steps – you need to mark the object in the video frame and to
type in the real dimensions:
1. Click scale
Scale dialog:
on the Video Motion Analyzer toolbar to open the
2. Click one end of the scaling object.
3. Click the body’s other end.
MultiLab will display two markers on the points you clicked.
4. You can drag the markers to change their position.
5. Type in the body’s actual dimension in the Actual dimension edit
box (in cm).
6. Click OK.
You can change the scaling anytime by clicking Scale
procedure.
and repeating the
Chapter 3 MultiLab Software
89
2. Set Coordinate System
To set the coordinate system you must specify the origin position and the x axis
direction. You can do it either by a click of the mouse or by entering it manually to the
coordinate system dialog.
Unless you specify otherwise MultiLab will use its default: the origin is in the lower left
side of the frame and the axes are parallel to the window’s sides.
Set origin
on the Video Motion Analyzer toolbar to open
1. Click Set origin
the Coordinate system dialog:
2. Click a point in the frame where you want the origin to be.
MultiLab automatically updates the X and Y origin coordinates edit
boxes and moves the axes on the frame to the new origin.
3. You can move the origin by clicking another point in the frame.
4. You can enter the origin coordinates manually by typing them in the
corresponding edit boxes (in pixels).
5. You can type in the x axis direction (in degrees) in the X axis
direction edit box.
6. Click OK.
Set X-axis direction
on the Video Motion Analyzer toolbar to
1. Click Rotate origin
open the Coordinate system dialog:
2. Click a point in the frame where you want the x axis to be placed.
90
Chapter 3 MultiLab Software
MultiLab automatically updates the X axis direction edit box and
rotates the axes on the frame to the new direction.
3. You can keep rotating the axes by clicking another point in the
frame.
4. You can type in the x axis direction (in degrees) in the X axis
direction edit box.
5. You can change the origin coordinates by typing them the X and Y
origin coordinates edit boxes (in pixels).
6. Click OK.
You can change the coordinate system origin and direction anytime by clicking Set
origin
or Rotate origin
and repeating the procedure.
3. Set Step
In the marking process, MultiLab automatically steps the video to the next frame
every time you click to add a marker.
To change the step to more then one frame at a time:
1. Click Video analysis on the menu bar and click Frame transition
to open the Frame transition dialog:
2. In the Step edit box, type in the number of frames you want
MultiLab to advance in one step.
3. Click OK.
4. Mark the Video
One-body motion
1. Click Play
the motion.
on the Video Motion Analyzer toolbar and observe
2. Decide what will be the marking point – the exact point on the
moving object that you want to mark.
Tip: Try to choose a clear and sharp point that is visible throughout the entire movie
3. Click Go to first
to roll the film back to the beginning.
Chapter 3 MultiLab Software
91
4. Click Next frame
to start the capture.
until you reach the frame with which you want
5. Click the marking point on the moving object.
MultiLab automatically marks the point on the screen and creates two new data sets
(one for x coordinates and one for y coordinates). It then adds the point’s coordinates
and time to the corresponding data sets and updates both the graph and the table,
then automatically moves to the next frame.
Note: You don’t see the mark because the display had already moved to the next
frame.
6. Continue clicking the marking point on every frame until you
capture all the data you need or until the video doesn’t step
anymore.
Observe that the graph and table are updated with each mouse click.
Note: In order for MultiLab to automatically move to the next step after one mouse
click, the Consecutive option in two-body motion must be selected (the default
option).
Two-body motion
Use the left mouse button to mark the first body and the right mouse button to mark
the second body.
You can mark two-body motion in two ways: simultaneously or consecutively. In the
simultaneous method you mark the two bodies alternately on every step of the
marking process. In the consecutive method you finish marking the whole motion of
the first body and then repeat the process with the second body.
Simultaneous marking
1. Click Video Analysis on the menu bar, point to Two-body motion,
and then click Simultaneous.
2. Proceed as in one body motion except that in step 5 right click to
mark the first body and left click to mark the second body.
MultiLab waits for both right and left mouse clicks before moving to the
next frame.
3. Keep clicking alternately with the right and left mouse button at
every step.
Consecutive marking
1. Click Video Analysis on the menu bar, point to Two-body motion,
and then click Consecutive.
2. Proceed as in one body motion until you finish marking the first
body.
3. Click Go to first
4. Click Next frame
to roll the film back to the beginning.
until you see a marker on the first body.
5. Right click the second body to mark it.
6. Keep right clicking on every step to mark the second body’s track.
92
Chapter 3 MultiLab Software
Viewing markings
You can view the markings frame by frame. You can also view the markings on the
video in parallel with the graph’s cursor so that the marker and the cursor are
synchronized.
To view just the markings:
Use the Next frame
and Previous frame
Analyzer toolbar to view the desired frame.
buttons on the Video Motion
To view the markings in parallel with the cursor:
1. Display the cursor on the graph.
MultiLab automatically displays the corresponding frame with the
marker.
2. To scroll through the frames you can either use the Next frame
buttons on the Video Motion Analyzer
and Previous frame
toolbar or drag the cursor on the graph or use the left and right arrow
keys on the keyboard.
Editing the data
You can change the position of the marker at a specific frame. MultiLab will
automatically update the corresponding point in the data set.
1. Display the frame you want to edit.
2. Click and drag the marker to the new position.
Erasing markings
You can erase a marker from a specific frame. MultiLab will automatically delete the
corresponding point in the data set.
1. Display the frame you want to edit.
2. Click Delete point
on the Video Motion Analyzer toolbar.
3. Click the marker.
Chapter 3 MultiLab Software
93
5. Changing the Colors of the Marker and the Axes
1. Click Color settings
open a dialog:
on the Video Motion Analyzer toolbar to
2. Select the desired colors.
3. Click OK.
To restore default colors click Restore defaults.
3.7.5.
Analyzing the Data
Once you have finished capturing position and time you can apply MultiLab’s
analysis tools to the data. MultiLab converts the body’s track into two data sets X
position (x coordinates) and Y position. By default the two data sets are displayed in
the graph as a function of the time, but you can use the edit graph tool to display the
track (Y vs. X).
In Video Motion Analyzer mode the video is usually displayed in the main window. To
display the graph in the main window select View selection from the View menu.
Before applying analysis functions you may find it helpful to smooth the data with the
smoothing tool on the graph toolbar.
At anytime you can change the origin and direction of the coordinates system
You can also change the coordinates of individual points by relocating them on the
video frame.
94
Chapter 3 MultiLab Software
3.8. Workbook
3.8.1.
Working with Workbook
The Workbook is an online library of experiment manuals called worksheets that
appear in the format of a Web page. Each worksheet includes an experiment
template that automatically configures both MultiLab and the data logger at the push
of a button. To begin recording, all you need to do is click Run.
Every time you run an experiment from a worksheet, MultiLab opens a new project
file with the same predefined setup.
You can use Fourier-produced worksheets, or create your own. You can also modify
Fourier’s existing worksheets to meet your own specifications.
3.8.2.
Opening a Worksheet
1. Click Workbook on the menu bar, and then click Open worksheet.
2. Navigate to the folder in which the worksheet is stored.
3. Double click the file name to open the worksheet.
Figure 28: Worksheet
4. Follow the on-screen instructions and use the scroll bar, hyperlinks
and the Back and Forward buttons to navigate throughout the
document.
5. Click Launch to configure MultiLab and the data logger.
6. Click Close to return to MultiLab.
Chapter 3 MultiLab Software
95
7. Click Run
3.8.3.
on the main toolbar to begin recording.
Create Your Own Worksheet
Creating a worksheet consist of two steps. First, create an HTML document using
your HTML editor (For example, Word or Front Page). This file should include the
Lab manual and the experiment instructions (see below). The second step is to use
the MultiLab software to create a configuration file, which is a file that will store the
specific settings you wish to define for the experiment. These include the USBLink or
MultiLogPRO setup, MultiLab’s layout, the recording mode, the graph format desired,
special preset graph scaling, sensors measurement, etc.
1. Create an HTML Document with Word
Create a new Web page
1. Open Word.
2. In the File menu, click New.
3. Do one of the following:
•
On the General tab, click Web Page to open a blank Web page.
•
On the Web Pages tab, click the template that you would like to
base your Web page on.
4. Enter your texts and pictures.
5. Click Save on the toolbar.
6. Navigate to C:\Program Files\Fourier Systems\MultiLab\Workbook.
7. Click Save.
Create a Web page from an existing Word document
1. Open the existing file with Word.
2. In the File menu, click Save as Web Page.
3. Navigate to C:\Program Files\Fourier Systems\MultiLab\Workbook.
4. Click Save.
2. Create a Configuration File
1. Open the MultiLab program.
2. Click Workbook on the menu bar, and then click create new
worksheet.
3. Double click the file you want to configure to open it:
96
Chapter 3 MultiLab Software
Figure 29: Creating a worksheet
4. Click Enter experiment settings to open the Setup wizard.
5. Use the Setup Wizard to preset MultiLab and data logger just as
with the normal setup process (see page 64).
6. When you’ve finished entering the settings, click Finish to update
the worksheet.
7. Click OK.
8. Click Close.
Chapter 3 MultiLab Software
97
3.9. Special Tools
3.9.1.
Predicting
The Predict tool enables you to draw predictions directly on the graph, prior to
displaying the real data:
1. Click Run
on the main toolbar to start recording.
2. Click Pause/Continue
graph.
on the graph toolbar to freeze the
Data transmitted from the data logger while the graph is frozen, is
stored onto the PC but is not displayed.
3. Click on the end of the curve and move the mouse according to your
predictions. Click to draw a straight-line segment. Move the mouse
again and click where you want the second segment to end, and so
on.
4. Click Add prediction
prediction.
on the graph toolbar to create another
a second time to resume live data
5. Click Pause/Continue
display and to compare your predictions with the real data.
3.9.2.
The Timing Wizard
1. Overview
The Timing Wizard enables you to easily measure and calculate many types of time
events, including velocity and acceleration with one or two photogates.
Connect one photogate to input 1 or connect two photogates to input 1 and input 2 of
the USBLink or MultiLogPRO and perform the experiment. The Timing Wizard will
then guide you through the analysis.
With the Timing Wizard you can measure sequences of time events at gate one
and/or at gate two, or time events between the two gates. MultiLab can then
calculate the velocity and acceleration. Special options make it easy to measure
velocities in collisions and the time period of a pendulum or any other oscillating
body.
The Timing Wizard can handle multiple events. For example, when a body is
crossing a photogate several times, applying the Timing Wizard will result in a series
of measurements that match the number of crossings.
Note: If you wish to measure fast timing events with photogates only use
MultiLogPRO's accurate timer module (see page 45).
98
Chapter 3 MultiLab Software
2. Working with the Timing Wizard
1. Display the data that you wish to analyze in the graph window.
2. Click Analysis on the menu bar, then click Timing Wizard to open
step 1 of the Timing Wizard dialog:
3. Click an option to select measurement: Time, Velocity or
Acceleration.
4. Click Next to move to step 2:
5. Click an option to select the measuring method.
6. If required enter the body’s width, or the distance between the gates
in cm in the appropriate edit box (in velocity and acceleration
measurements only).
7. Click Finish to display the results.
8. If you want to change the method or measurement, click Back to
return to the Timing Wizard. To exit the Timing Wizard click OK.
Chapter 3 MultiLab Software
99
3. Measuring Methods
The Timing Wizard offers you various methods of analyzing the different
measurements. In some measurements you will be asked to enter the dimension of
the moving body, or the distance between the two photogates to allow for the
calculation of velocity and acceleration.
The methods depend on the selected measurement:
Time
•
At one gate
Measures the time it takes the
body to cross the photogate
(between
blocking
and
unblocking the infrared beam).
•
Between gates
Measures the time it takes the
body to move from one
photogate to the second
photogate (between blocking
the first and blocking the
second infrared beams).
•
Pendulum
Measures the time period of an
oscillating body
(the time
interval between the first and
the third blockings of the
beam).
Velocity
•
At one gate
Measures the time it takes the
body to cross the photogate
(between
blocking
and
unblocking the infrared beam)
and returns the velocity.
You should enter the body’s
width.
100
Chapter 3 MultiLab Software
•
Between gates
Measures the time it takes the
body to move from one
photogate to the second
photogate (between blocking
the first and blocking the
second infrared beams) and
returns the average velocity.
You should enter the distance
between gates.
•
Collisions
Measures the crossing time
intervals at each gate and
returns
the
corresponding
velocities.
You should enter the bodies’
width (the width of the two
bodies must be identical)
Acceleration
•
At one gate
A card with two flags must be
attached to the moving body
(see figure to the left). The
Timing Wizard measures the
crossing time intervals of the
two flags and returns the
acceleration.
You should enter the flags
width.
•
Between gates
Measures the crossing time at
the first gate, the time it takes
the body to move from one gate
to the second gate and the
crossing time at the second
gate and returns the average
acceleration.
You should enter the body’s
width.
Chapter 3 MultiLab Software
101
4. Time Schemes and Calculations
Time measurements
At one gate
t2
t1
Δt = t 2 − t1
Result:
Between gates
t2
Input 1
t1
t3
Input 2
t4
Δt = t 3 − t1
Result:
Pendulum (one gate)
t5
t2
t1
t3
t4
Result:
102
Δt = t 5 − t1
Chapter 3 MultiLab Software
Velocity
At one gate
Required parameters: w – The body’s width
t1
t2
Result:
v=
w
; Δt = t 2 − t1
Δt
Between gates
Required parameters: L – The distance between gates
t2
Input 1
t1
t3
Input 2
t4
Result:
v=
L
; Δt = t 3 − t1
Δt
Collision (two gates)
Required parameters: w – The bodies’ width (must be identical)
t2
t1
Input 1
t3
t4
Chapter 3 MultiLab Software
103
t6
t5
Input 2
t7
t8
u1 =
w
w
; v1 =
t 2 − t1
t 4 − t3
u2 =
w
w
; v2 =
t6 − t5
t8 − t 7
Result:
Acceleration
At one gate
Required parameters: w – The flags’ width
Δt
t2
t1
Input 1
t3
t4
v1 =
Result:
104
w
w
; v2 =
t 2 − t1
t 4 − t3
t 4 + t 3 − t 2 − t1
2
v −v
a= 2 1
Δt
Δt =
Chapter 3 MultiLab Software
Between gates
Required parameters: w – The body’s width
Δt
t2
Input 1
t1
t3
Input 2
t4
v1 =
Result:
w
w
; v2 =
t 2 − t1
t 4 − t3
t 4 + t 3 − t 2 − t1
2
v −v
a= 2 1
Δt
Δt =
5. Tips on using the Timing Wizard
• Attach a flag to the moving body
When measuring the motion of a moving cart it is convenient to attach a vertical flag
to the cart (see picture below). You can mount a slotted wooden block on the cart
and insert the flag onto the slot, or use masking tape to attach the flag to one side of
the cart.
Use a double flag to measure acceleration at one gate. The width of the two flags
must be the same.
• Use the cursors
Use the cursors (see page 54) to select the graph and data range to which you want
to apply the Timing Wizard.
Chapter 3 MultiLab Software
105
• Time resolution
The time resolution depends on the sampling rate. Use the table below to select a
rate that meats your needs.
Rate
(samples per
second)
10
25
50
100
500
1000
2000
10000
20800
Resolution
0.1 s
0.04 s
0.02 s
0.01 s
2 ms
1 ms
0.5 ms
0.1 ms
0.05 ms
• Use the Trigger
For fast events and high sampling rates use the Trigger tool (see page 68) to initiate
the data logging.
3.9.3.
Crop Tool
The Crop tool enables you to trim the edges of a data set. Use it to remove unwanted
data or to apply manual curve fitting to a desired range of data points.
The time scale of the trimmed data is shifted so that it will start at t = 0 .
If you want the automatic curve fit equation to start at t = 0 , apply the crop tool before
any type of curve fitting.
After applying the crop tool, the trimmed data set replaces the original set on the
graph display and a new icon is added to the Data Map under cropped data.
1. To Trim all Data up to a Point
1. Position a cursor (see page 54) on the data point.
2. Click on the Graph menu, and then click Crop.
2. To Trim all Data Outside a Selected Range
1. Use the cursors to select the range you want to keep.
2. Click on the Graph menu and then click Crop.
3.9.4.
Capture Tool
The Capture tool enables you to capture and record specific data points from the
data logger’s stream of data, like taking snapshots of the dynamic process. For
example, you can design a light refraction experiment that will record the angle of the
106
Chapter 3 MultiLab Software
refracted beam only when the light intensity is maximal, and then plot the angle of
refraction vs. the manually entered column of the angle of the incident beam.
In capture mode, when you start recording, the data in the graph window appears as
it normally does, but every time you click Capture, MultiLab enters the most recently
recorded value into a new entry in the capture table.
When you have finished capturing data, you can add manual columns to the table
and display the data in the graph window.
1. Preparing the Capture Table
1. Click Table on the menu toolbar, and then click Capture mode to
open the Capture dialog box:
Figure 30: Capture dialog box
2. In the Available Sensors list, select the sensors you want to
capture by clicking their name and then click Add.
3. If you want to insert a manual column into the table, click Insert
manual column to open the dialog box:
Figure 31: Manual Column dialog box
4. Enter the column’s name and unit, then click OK.
The new column is added to the Current Columns list.
Note: You can always add manual columns later by clicking Add manual column on
the Table menu.
5. Click OK.
MultiLab opens a new table with the columns you defined.
6. Enter values into the manual column by clicking a cell and typing the
number, then press Enter or the down arrow key to move to the next
cell:
Chapter 3 MultiLab Software
107
Figure 32: Capture table
2. Capturing Data
1. Click Run
process.
on the main toolbar to start the data recording
2. Watch the online graph, and when the graph reaches a point you
on the table toolbar. MultiLab
wish to capture, click Capture
enters the momentary data to the capture table sequentially.
3. If logging stops, simply click Run to continue the data recording and
capturing.
4. After you’ve finished capturing the desired data, click Table on the
menu toolbar, and then click Capture mode to exit capture mode.
3. Displaying the Captured Data on the Graph
1. Click Edit graph
dialog box:
on the graph toolbar to open the Graph edit
Figure 33: Using Graph edit dialog box to display captured data
108
Chapter 3 MultiLab Software
2. Choose the data set that you wish to display on the X–axis from the
X–Axis list by clicking its name.
3. Choose the data set or sets you wish to display on the Y–axis from
the Y–Axis list by clicking its name (or names).
4. Click OK.
3.10. Toolbar Buttons
3.10.1.
Main (Upper) Toolbar
New
Start new project
Open
Open saved project
Save
Save project
Print
Select print options
Run
Start a data recording session. Click on the down arrow to
select recording mode
Stop
Stop recording
Download
Download the data from the most recent recording
session (for MultiLogPRO only)
Setup
Open the Setup dialog box (for MultiLogPRO)
Setup
Open the Setup dialog (for USBLink)
Meter setup
Open the Meter setup dialog box
Data map
Display the Data Map
Graph
Display the graph window
Table
Display the table window
Video
Display and enable the video window
Video
Analysis
Open Video Motion Analyzer module
Chapter 3 MultiLab Software
109
Analysis
Open the Analysis wizard
Linear fit
Draw a line of linear fit of the selected data set
Derivative
Draw a line of the derivative of the selected curve
Stop
Stop video recording or video replay
Play
Replay video and/or data
Pause
Pause replaying
Record
Record video
3.10.2.
110
Graph Toolbar
Add annotation
Add new annotation to the graph
Move annotation
Relocate the annotation on the graph
Autoscale
Display all the data
Zoom to selection
Zoom in to a selected area
Pan
Pan in all directions while in zoom mode
More smoothing
Smooth (average) the selected curve
Less smoothing
Reverse the most recent smoothing operation
1st Cursor
Display or remove the first cursor
2nd Cursor
Display or remove the second cursor
Split graph
Switch to a split graph display
Edit graph
Select the data to display on the axes
Graph properties
Graph formatting, scaling and units selection
Chapter 3 MultiLab Software
Add to project
Add the displayed graph to the project
Export to Excel
Export the displayed graph to Excel
Pause/Continue
Pause/continue displaying online data on the graph
Add prediction
Add a prediction onto the graph
Erase prediction
Erase the selected prediction
3.10.3.
Table Toolbar
Edit table
Add/remove columns from the table
Table properties
Format fonts and units
Add to project
Add the current table to the project
Capture
Capture the momentary data
3.10.4.
Video Motion Analyzer Toolbar
Open
Open movie
Capture
Capture new movie
Set origin
Set the origin of reference frame
Rotate axes
Set direction of reference frame
Scale
Scale the data to real dimensions
Delete point
Delete a point and point’s coordinates
Color settings
Select colors of markers and axes
Go to start
Go to first frame
Previous frame
Move to previous frame
Play
Play the movie
Next frame
Move to next frame
Go to end
Go to last frame
Chapter 3 MultiLab Software
111
3.10.5.
112
Capture New Movie Toolbar
Record
Start video capture
Stop
Stop video capture
Analyze movie
Return to Video Motion Analyzer mode
Chapter 3 MultiLab Software
Chapter 4
Working with a TI Calculator
4.1. Overview
MultiLab for TI calculator is a data collection and analysis software that enables you
to operate Fourier Systems MultiLogPRO data logger via TI–83 Plus. Together they
constitute a portable, handheld, battery operated data collection system. The
collected data can be than viewed and analyzed by the TI calculator.
4.2. Installing the Software
To send the MultiLab application to your TI–83 Plus calculator:
1. Connect the TI calculator to a computer.
2. Insert the MultiLab CD into your PC’s CD-ROM drive. The MultiLab
Installation application will launch.
3. From the main menu, click Installing MultiLab Software, then
MultiLab for TI83+ Installation. In the next menu, click MultiLab
for TI83+ Installation and the application file folder will open.
4. Run the TI Connect program on your computer.
5. Follow Sending application to a TI–83 Plus instructions.
6. When asked to select the application you want to install, select the
multilab.8xk file located in the application folder launched from the
MultiLab CD Installation wizard.
4.3. Getting Started
1. Prepare MultiLogPRO
1. Connect the stereo plug of the serial communication cable to the
serial COM input on the bottom of the TI calculator.
2. Connect the 9 pins plug of the serial communication cable to the
serial comm. socket on the left side of MultiLogPRO.
3. Turn on MultiLogPRO.
4. Configure MultiLogPRO to work with a TI calculator (see page 27).
5. Plug in any external sensors.
Note: MultiLogPRO must be in Auto ID mode (see page 27)
Chapter 4 Working with a TI Calculator
113
2. Run MultiLab on a TI Calculator
1. Turn on TI calculator.
to see the complete list of applications that come with
2. Press
your calculator.
button to navigate to MultiLab and press
3. Use the down arrow
(or press MultiLab's number key).
After showing the opening screen for a few seconds, MultiLab displays
the main menu:
Figure 34: MultiLab for TI main menu
3. Setup MultiLogPRO
1. In the main menu screen press
to open the setup screen:
MultiLab displays a list of the connected sensors and the current
sampling mode.
to return to the main menu or press
2. Press
sampling mode menu:
to enter the
The default mode is TIME GRAPH that is the normal logging mode.
3. Press
4. Press
press
114
to open the timing setup screen:
to accept the settings and return to the setup screen or
to change the settings:
Chapter 4 Working with a TI Calculator
5. Use the numeric keypad in the TI calculator to enter sampling time
interval in seconds.
Tip: If you have entered a wrong value you can always press
number.
and enter a new
6. Press
Note: The allowed time intervals are: 0.04, 0.1, 1, 10, 60, 600, 1800 and 3600
seconds. If you will enter another number MultiLab will automatically round it to the
nearest allowed time interval.
7. Enter the total number of sampling point (maximum of 1000 samples
unless otherwise indicated on the screen).
to return to the setup screen.
8. Press
9. Press
to accept the setup and return to the main menu.
The system is now ready to begin data logging.
4. Start Recording
1. Press
in the main menu to begin data logging.
For time intervals of 1 second or more, MultiLab displays the data
online. If the time interval is less than 1 second, data is retrieved by
MultiLab after logging ends.
MultiLab than displays the SELECT GRAPH screen:
2. You can stop logging anytime by pressing
.
Chapter 4 Working with a TI Calculator
115
5. View the Data
and Down
1. On the SELECT GRAPH screen use the Up
keys to select the graph you wish to display, then press
.
, select a graph and press
2. To display another graph press
a second time.
Note: You can view the graph by pressing
from the main menu.
6. Downloading Data
To download data that is store in MultiLogPRO:
1. Press
on the main menu.
2. Press
on the Tools menu.
3. Enter the number of the experiment you wish to download.
4. MultiLab will retrieve the data and will display the SELECT GRAPH
screen.
and Down
5. Use the Up
to display, then press
.
keys to select the graph you wish
4.4. The Graph Display
1. The Cursor
1. Use the cursor in the graph display to read data points values.
2. Press
to display the cursor.
3. Press
or
to move the cursor through the graph points.
The point coordinates are displayed at the bottom of the screen.
2. Zooming
1. From the graph screen press
menu.
2. Press
116
to return to the SELECT GRAPH
to select the region into which you wish to zoom in.
Chapter 4 Working with a TI Calculator
3. Press
to select the left bound, keep pressing to move the left
cursor to the desired point.
4. Press
.
5. Press
to select the right bound, keep pressing to move the left
cursor to the desired point.
6. Press
.
and Down
7. Use the Up
to display, then press
.
keys to select the graph you wish
Note: Data outside the zoom region will be trimmed and lost. To gain the data back
download it from MultiLogPRO.
3. Rescaling
1. From the graph screen press
menu.
2. Use the Up
to rescale.
3. Press
and Down
to return to the SELECT GRAPH
keys to select the graph you wish
to open the rescaling options menu.
4. Auto Scaling
1. Press
and Down
2. Use the Up
to display, then press
keys to select the graph you wish
Chapter 4 Working with a TI Calculator
117
5. X – Axis Scaling
1. Press
2. Enter the minimum value, then press
3. Enter the maximum value, then press
4. Enter the scale unit, then press
and Down
5. Use the Up
to display, then press
keys to select the graph you wish
6. Y – Axis Scaling
1. Press
.
2. Enter the minimum value, and then press
.
3. Enter the maximum value, and then press
.
4. Enter the scale unit, and then press
and Down
5. Use the Up
to display, and then press
118
.
keys to select the graph you wish
.
Chapter 4 Working with a TI Calculator
7. Choosing the X–axis
Normally MultiLab displays the sensors data as a function of the time, but you can
choose to display a sensor's data on the x axis from the SELECT GRAPH screen.
1. One of the options in this menu is IO-2 VS. IO-1. If you select this
option MultiLab will display the data from input 2 vs. the data from
input 1.
2. For more options press
and Down
3. Use the Up
4. Press
.
keys to select the desired option.
.
4.5. Analyzing the Data
MultiLab offers you several types of analysis tools. You can apply built-in or userdefined curve fit to your data, you can integrate a data set to find the area or you can
display a statistics screen.
1. Applying an Analysis Tool
1. Go the main menu.
Chapter 4 Working with a TI Calculator
119
2. Press
to display the Select Analysis screen.
and Down
3. Use the Up
keys to select the desired option.
.
4. Press
2. Curve Fit
1. Press
120
from the Select Analysis screen.
2. Use the Up
and Down
axis, then press
.
keys to select the data for the X –
3. Use the Up
and Down
axis, then press
.
keys to select the data for the Y –
4. Use the Up
press
.
keys to select the fit type, then
and Down
Chapter 4 Working with a TI Calculator
MultiLab displays the fit formula:
5. Press
to display the curve fit on the graph screen.
3. User Curve Fit
This option allows you to create your own curve fit formula.
1. Enter your equation to the Y= editor of your TI calculator.
2. Run MultiLab and display the Select Analysis screen.
3. Press
from the Select Analysis screen.
4. Use the Up
press
.
5. Use the Up
then press
and Down
keys to select a sensor, and then
and Down
keys to select a coefficient, and
.
6. Enter a new value for that coefficient, then press
.
MultiLab calculates the new fit equation and displays it together with
the analyzed data.
You can repeat the process in order to change the coefficient value or
to edit another coefficient.
4. Statistics
You can select a region of a data set and display statistics of the data range:
MINIMUM – The smallest value in the range
MAXIMUM – The largest value in the range
MEAN – The average of all the numbers in the range
STD. DEVIATION – The standard deviation
n – The number of data points in the range
Chapter 4 Working with a TI Calculator
121
1. Press
from the Select Analysis screen.
2. Use the Up
then press
and Down
keys to select the sensor, and
.
3. Press
to select the left bound, keep pressing to move the left
cursor to the desired point.
.
4. Press
5. Press
to select the right bound, keep pressing to move the left
cursor to the desired point.
.
6. Press
MultiLab displays the statistics results screen:
7. Press
to return to the main menu.
5. Integral
This option allows you to calculate the area of a selected range on the graph
1. Press
from the Select Analysis screen.
and Down
2. Use the Up
then press
keys to select the sensor, and
.
3. Press
to select the left bound, keep pressing to move the left
cursor to the desired point.
4. Press
.
5. Press
to select the right bound, keep pressing to move the left
cursor to the desired point.
6. Press
122
.
Chapter 4 Working with a TI Calculator
MultiLab displays the Integral results screen.
7. Press
to return to the main menu.
4.6. Data Collection Modes
MultiLab offers you several types of data collection modes. The default mode is TIME
GRAPH where data is collected in a predefined rate and then displayed on a graph
as a function of the time.
The other data collection modes are:
LOG DATA – Downloading the last experiment from MultiLogPRO.
EVENTS WITH ENTRY – In this mode you can capture specific data points from
MultiLogPRO stream of data, like taking snapshots of the dynamic process. After
each capture MultiLab prompts you to enter a corresponding X value. When
capturing ends, MultiLab displays the data vs. the manually entered X values.
SINGLE POINT – The system collects 10 samples in 10 seconds and then displays
the average value.
SELECTED EVENT – Much like EVENTS WITH ENTRY except that the data is
displayed as a function of the time (no need to enter X values).
To select a certain data mode:
1. Press
on the main menu to display the Setup menu then press
to enter the SELECT MODE menu:
2. Use the Up
then press
and Down
keys to select the collection mode,
.
Working with the various collection modes:
1. Log Data
1. From the SELECT MODE menu select EVENTS WITH ENTRY, and
.
then press
Chapter 4 Working with a TI Calculator
123
2. Press
to return to the main menu.
3. Press
to start.
MultiLab will retrieve the data from the last experiment store in
MultiLogPRO.
2. Time Graph
This is the default data collection mode. See Getting Started on page 113 for details.
3. Events with Entry
1. From the SELECT MODE menu select EVENTS WITH ENTRY, and
then press
.
2. Press
to return to the main menu.
3. Press
to start recording.
MultiLab displays the sensors' values and the number of captured
samples up to now.
4. Press
anytime you want to capture a sample.
MultiLab prompts you to enter a corresponding X value.
.
5. Enter the desired X value, and then press
6. After you finish capturing the data press
and Down
7. Use the Up
to display a graph.
.
keys to select a sensor, then press
4. Single Point
1. From the SELECT MODE menu select EVENTS WITH ENTRY, and
then press
.
2. Press
to return to the main menu.
3. Press
to start recording.
The system will collect data for 10 seconds, and then will display the
averaged result:
Press any key to return to the main menu.
124
Chapter 4 Working with a TI Calculator
5. Selected Event
1. From the SELECT MODE menu select EVENTS WITH ENTRY, and
.
then press
2. Press
to return to the main menu.
3. Press
to start recording.
MultiLab displays the sensors' values and the number of captured
samples up to now.
anytime you want to capture a sample.
4. Press
5. After you finish capturing the data press
and Down
6. Use the Up
to display a graph.
.
keys to select a sensor, then press
4.7. Conditioned Data Collection
MultiLogPRO enables you to start the data collection only when a specific
measurement condition has been met (triggering).
1. To Enable Triggering
1. Navigate to the timing setup screen (see Setup MultiLogPRO on
page 114).
2. Press
.
and Down
keys to select a sensor, then press
3. Use the Up
to display the TRIGGER TYPE screen:
4. Select a trigger type:
a) INCREASING – Data collection begins once the measured
value is HIGHER than the threshold level.
Chapter 4 Working with a TI Calculator
125
b) DECREASING – Data collection begins once the measured
value is LOWER than the threshold level.
.
5. Press
6. Enter the triggering threshold level, and then press
7. Press
to return to the main menu.
8. Press
to start.
.
Data collection will begin once the triggering condition is has been met
2. To Disable the Triggering Condition
1. Navigate to the timing setup screen (see above)
2. Use the Up
.
and Down
keys to select none, then press
4.8. Calibrating the Sensors
Every sensor has a unique conversion function that converts the sensor's output to
the calibrated values. The two point calibration process sets the slope and offset
(intercept) of the conversion function.
1. To Calibrate a Sensor
1. Connect MultiLogPRO to the TI calculator.
2. Press
from the main menu to display the setup screen.
and Down
keys to select a sensor,
3. Press , Use the Up
then press
to display the CALIBRATION OPTIONS screen.
4. Press
to begin calibrating.
MultiLab displays the current slope and offset. You should enter two
actual values and the corresponding read values (the read values are
126
Chapter 4 Working with a TI Calculator
the values displayed by MultiLab when measuring the two actual
values) .
5. Enter the 1st actual value, then press
6. Enter the 1st read value, then press
.
.
7. Repeat the last two steps for the other value.
MultiLab will calculate the new slope and offset and will return to the
setup screen.
2. To Restore the Default Calibration Values
1. Navigate to the CALIBRATION OPTIONS screen (see above).
2. Press
.
MultiLab will restore the default slope and offset and will return to the
setup screen.
Chapter 4 Working with a TI Calculator
127
Chapter 5
Troubleshooting Guide
Symptom
I pressed the ON key on
MultiLogPRO and it did not turn
on.
Cause of Problem
•
•
•
MultiLab was unable to connect
to MultiLogPRO.
•
•
•
•
•
MultiLab was unable to connect
to USBLink.
•
•
I downloaded unexpected data
from the MultiLogPRO.
While running with an active
trigger, MultiLogPRO does not
complete the data logging.
128
•
•
•
•
Try charging the battery, it may be
weak.
You are using an unsuitable AC/DC
adaptor (see page 14).
The internal 3V disk battery is
dead.
MultiLogPRO is turned off.
The communication cable is not
connected properly.
The communication cable is not
connected to the correct PC COM
Port.
There is no available Serial COM
Port.
The Logger USB driver was not
installed.
The USB communication cable is
not connected properly.
The communication cable is not
connected to the correct PC COM
Port.
The USB driver is not installed
There may be up to 100
experiments
stored
in
the
MultiLogPRO.
Performing
a
Download means loading one of
them in sequential order. You have
probably loaded an old experiment
accidentally. Try using Selective
download from MultiLab (see page
44)
The trigger condition has not been
fulfilled.
The trigger condition was fulfilled,
but the time period was too short
(less than 300μS).
Chapter 5 Troubleshooting Guide
I see voltage units when
sampling using the microphone.
•
I started a new logging session
and the data logger stopped
immediately afterwards.
First check if the sampling rate was so fast
that the experiment began and ended in less
than a second. If this is not the reason,
recharge the 7.2 V battery of the MultiLogPRO
and try again. MultiLogPRO monitors the
battery power during the logging. If the battery
voltage is less then 5V, the logging is stopped
automatically.
The recorded data is noisy
•
•
The microphone is monitoring the
sound wave shape, which is
displayed in voltage units. The
sound level, measured in decibel
values, is another mathematical
description of the sound amplitude.
With voltage or current sensors,
use short connections between the
circuit being tested and the sensor.
In some cases it is advisable to
connect the (-) of the current
sensor to the ground terminal
Avoid working near strong
electromagnetic fields. (e.g.
engines, fluorescent lights)
I turned the calibration screw but
did not obtain the accurate
calibration
The calibration screw is of high-resolution type
and has 15 turns. Try to continue turning the
screw, or change the direction of rotation.
I can’t see a video of the
experiment
•
•
•
The video window is closed. Click
Display video on the main toolbar
to open it.
The video is disabled, select
Enable video from the Video
menu.
The camera driver is not properly
installed.
I can’t record voice comments
The microphone volume is muted. Open
Window’s volume control and uncheck the
Mute check box at the bottom of the Mic
volume column.
MultiLogPRO’s memory is empty
– there are no stored files or
experiment notes.
The internal 3 V disk battery is dead.
Replace the battery.
Chapter 5 Troubleshooting Guide
129
I opened MultiLab but the
application immediately closed
down.
During MultiLab installation, the
component Windows Media Encoder
(WME) is installed. Without WME,
MultiLab cannot run.
1. In the Control Panel, open Add or
Remove Programs. Check if WME is
installed on your PC.
2. If WME is installed, check the WME
version number.
MultiLab v1.4.06 and higher supports
up to WME Series 9. If you are running
WME 9, make sure your MultiLab
version is compatible. If not, contact
your Fourier vendor for a MultiLab
upgrade.
3. If WME is not installed then:
a. Open Windows Explorer and
right-click Explore on your CD drive.
b. Locate the Windows Media
Encoder installer file in the MultiLab
folder and double click this file.
c. Follow the on-screen instructions
to install WME. You will now be able
to run MultiLab.
If you have WME 9 installed on a noncompatible version of MultiLab, you
can always uninstall WME 9 and install
WME 7 located on the MultiLab CD.
I opened MultiLab. An error
message opened up stating that I
needed Quicktime in order to run
the MultiLab software.
130
Quicktime is a required component for
MultiLab software to operate and is
installed during initial MultiLab
installation.
If Quicktime has since been removed
from your system, you may install it
again from your MultiLab Installation
CD:
1. Place the CD in your PC’s CD drive
and click Cancel to stop automatic
MultiLab installation.
2. Open Windows Explorer and rightclick Explore on your CD drive.
3. Locate the Quicktime installer file in
the MultiLab folder and double click
this file.
4. Follow the on-screen instructions to
install Quicktime. You will now be able
to run MultiLab.
Chapter 5 Troubleshooting Guide
Chapter 6
Specifications
6.1. The USBLink Data Logger
Input
4 Mini-Din sensor port interface
Auto ID mode:
Any combination of digital and analog inputs, with maximum of 4 digital
inputs and 4 analog inputs
Automatic sensor identification across 4 inputs
8 inputs mode:
Any combination of digital and analog inputs, with maximum of 4 digital
inputs and 8 analog inputs
Outputs
Mini USB (Type B) port, USB 1.1 (1.5 Mbit/s) specification compliant
4 Digital Control Outputs
Sampling
Analog sampling rate: From one sample per hour to 10,000 samples per
second
Digital sampling rate: >200 kHz
Resolution
12-bit (4096 Levels)
Features
• Automatic or manual sensor identification
• LED indicators for power and logging status
• Saving and loading of last setup
• Trigger: programmable or manual
• Automatic calibration of offset sensors
• Screen contrast control
• Event recording
• Post experiment graphical analysis
Power Supply
Powered by PC USB port
Operating temperature range: 0 °C to 50 °C
Dimensions: 57 x 57 x 30 mm
Weight: 73 g
Chapter 4 Troubleshooting
131
6.2. The MultiLogPRO Data Logger
Input
4 Mini-Din sensor port interface
Auto ID mode:
Any combination of digital and analog inputs, with maximum of 2 digital
inputs and 4 analog inputs
Automatic sensor identification across 4 inputs
8 inputs mode:
Any combination of digital and analog inputs, with maximum of 2 digital
inputs and 8 analog inputs
Outputs
RS-232 PC Host Interface at 19,200 bps
USB 1.1 specification compliant
4 Digital Control Outputs
Sampling
Capacity: Up to 100,000 Samples
Analog sampling rate: From one sample per hour to 20,800 samples per
second
Digital sampling rate: >200 kHz
Resolution
12-bit (4096 Levels)
Timer Module
Time velocity and acceleration
Range: 0.0014 s to 6.5535 s
Resolution: 0.1 mS
Card width: 0 to 59 mm
Distance between gates: 0 to 99 cm
Stopwatch
Range: 0 to 99.99 s
Resolution: 10 mS
Man-machine Interface
• Full keypad operation enabling manual programming of the MultiLogPRO
• Graphic LCD
• Display uses: displaying the logger setup, displaying experiment instructions and
notes and displaying the data measurements in graphs, meters, tables or digital
display
Features
• Standalone operation - Working and sampling without connection to a PC.
• Automatic or manual sensor identification
• Saving and loading of last setup
• Automatic self-test that reports system status to the user including battery level in
percentage of power remaining.
• Trigger: programmable or manual
132
Chapter 6 Specifications
•
•
Automatic calibration of offset sensors
Backup memory battery: 3V replaceable Lithium battery saving samples data for
up to 10 years
• Automatic data recovery if there is a power failure
• Built in clock & calendar that keeps track of time and date for each data recording
• Built in battery charger for charging the 7.2V internal battery
• Automatic shut off after 15 minutes
• Screen contrast control
• Event recording
• 10 user defined sensors
• Online notes editing
• Post experiment graphical analysis
Power Supply
Internal rechargeable 7.2V NiCad battery or external 9V to 12V DC input
Battery life: 750 mAH, 24 hours between charges
Operating temperature range: 0 to 50 °C
Dimensions: 182 x 100 x 28 mm
Weight: 450 gr
Standards compliance: CE, FCC
Chapter 6 Specifications
133
6.3. Supported Sensors
This section lists all sensors compatible with the USBLink and MultiLogPRO.
Together with the MultiLab software these sensors are used for data collection and
data analysis.
For third-party sensors from Vernier and Data Harvest check availability with your
local Fourier reseller.
6.3.1.
P/N
Supported Fourier Systems Sensors
Type
Range
DT138
Acceleration
± 5g
AC020A
Ammonium Electrode
0.1 to 18,000 ppm
Physics
Wind speed: 4 to 280
km/h
AC012A
Anemometer
Wind direction: 0 to 360
AC019A
Calcium Electrode
0.02 to 40,000 ppm
DT040
Carbon Dioxide (CO2)
350 to 5,000 ppm
DT261A
Charge
± 0.25 uC to ± 0.025 uC
AC018A
Chloride Electrode
1.8 to 35,500 ppm
DT185A
Colorimeter
Three
colors;
green, red
DT035A
Conductivity
0 to 20 mS
DT110
Control Switch - Closed
Normally closed
DT111
Control Switch - Open
Normally open
DT005
Current 2.5 A
± 2.5 A
DT006
Current 250 mA
± 250 mA
DT020-1
Distance
0.2 to 10 m
DT293
Drop Counter
0 to 4096
DT189A
EKG
0 to 5 V
DT254
Flow Rate
0 to 4 m/s
DT272
Force
± 10 N; ± 50 N
DT116
Geiger Muller
0 to 4096 Bq
DT298A
Heart Rate (Exercise)
0 to 200 bpm
DT155A
Heart Rate (Pulse)
0 to 200 bpm
DT014
Humidity
0 - 100%, 5% accuracy
DT009-1
Light
0 to 300 lux
DT009-4
Light Triple-range
0-600, 0-6000, 0-150,000
lux
DT156
Magnetic Field
0 to 10 mT, 0 to 0.2 mT
Microphone
± 2.5 V
Frequency range:
DT008
134
Chapter 6 Specifications
blue,
Biology
Chemistry
P/N
Type
Range
Physics
Biology
Chemistry
35 Hz to 10,000 Hz
AC017A
Nitrate Electrode
0.1 to 14,000 ppm
Oxygen Adapter
0 to 12.5 mg/L
0 to 25%
DT118
Oxygen Electrode
0 to 12.5 mg/L
0 to 25%
DT017
pH Adapter
0 to 14 pH
DT018
pH Electrode
0 to 14 pH
DT137
Photo Gate
0 to 5 V (Digital)
AC008A
Potassium Electrode
90 to 39,000 ppm
DT015
Pressure
150 to 1150 mbar
DT015-1
Pressure
0 to 700 Kpa
DT015-2
Pressure
0 to 10 Kpa
AC013
Rain Collector
0 to 819 mm
DT148A
Rotary Motion
± 128°
DT122A
Smart Pulley
0 - 99 m/s
DT171
Soil Moisture
0 to 200 cbar
DT320
Sound Level
45 to 110 dB
DT037A
Spirometer
(Respiration)
± 315 L/min
± 5.25 L/sec
DT025
Temperature
(Thermocouple)
0 to 1200 °C
DT027
Temperature (PT-100)
-20 °C to 400 °C
DT029
Temperature
-25 °C to 110 °C
DT095A
Turbidity
0 to 200 NTU
DT001
Voltage 25V
± 25 V
DT002
Voltage 2.5 V
± 2.5 V
DT003
Voltage 5 V
0-5V
DT004A
Voltage 50 mV
± 50 mV
DT019
Voltage Triple Range
± 1 V, ± 10 V and ± 25 V.
DT222A
6.3.2.
Supported Vernier Sensors
Using an adapter available from Fourier Systems, the following Vernier sensors may
be connected to the Fourier sensor interface. To use these sensors they must first be
defined in MultiLab.
Note: Only Vernier Analog linear sensors are supported. Digital sensors are not
compatible with Fourier data loggers.
Chapter 6 Specifications
135
Sensor
Accelerometer
3 axis
Accelerometer
Low g
Barometer Hg
Barometer atm
Barometer mm Hg
Barometer mbar
CO2
Colorimeter
Magnetic Field
0.3 mT in millitesla
Magnetic Field
6.4 mT in millitesla
Microphone
ORP
Oxygen gas
pH
Minimum
Output
Voltage
Minimum
Real Value
Maximum
Output
Voltage
Maximum
Real Value
5
m/s
2
m/s2
Hg
atm
mm Hg
mbar
ppm
%
Current ± 0.6A
Differential Voltage
Dissolved Oxygen
Dual Range Force 10N
Dual Range Force 50N
Flow Rate
Force 10N
Force 50N
Gas Pressure kPa
Gas Pressure atm
Gas Pressure mm Hg
Light Sensor
0 - 600 Lux
Light Sensor
0 – 6000 Lux
Light Sensor
0 – 150,000 Lux
Magnetic Field 6.4 mT
in gauss
Magnetic Field
0.3 mT in gauss
136
Units
A
V
mg/L
N
N
m/s
N
N
kPa
atm
mm Hg
0
0
0
0
0
0
0
0
0
0
0
0
0
0
0
0
0
0
0
0
lx
-51.6
5
-51.8
24.2
0.8
614.8
819.5
0.0
0.0
0.625
6.3
-0.3
12.3
61.3
0.0
12.25
61.25
0.0
0.0
0.0
lx
Chapter 6 Specifications
5
5
5
5
5
5
5
5
5
5
5
5
5
10000.0
142.9
-0.625
-6.3
16.0
-12.3
-61.3
5.0
-12.25
-61.25
232.4
2.2935
1743.2
770.0
0.0
8460.0
5
0.0
0
192120.0
5
-80.6
0
80.6
5
-3.2
0
4.8
5
-8.1
0
0
0
0
0.942
62.9
35.7
1.2
907.4
1209.5
5
0
Hi
gauss
Low
millitesl
a
Hi
millitesl
a
V
mV
%
pH
5
5
5
5
5
0.0
0
lx
Low
gauss
63.0
8.1
5
-0.3
0
-559.8
0
10.01
5
5
5
2.45
0.5
5
1774.6
32.8125
4.01
Sensor
Units
Relative Humidity
Salinity
Thermocouple
UVA
UVB
%
ppt
C
mW
mW
Voltage ± 6 V
X-Long Temp
X-Long Temp
Direct Connect
6.3.3.
Minimum
Output
Voltage
0
0
0
0
0
0
V
C
F
C
Minimum
Real Value
-23.8
0.0
-188.9
0.0
0.0
6.25
-53.1
-63.5
-17.8
0
0
0
Maximum
Output
Voltage
Maximum
Real Value
5
5
5
5
5
5
140.7
81.5
1393.0
19700.0
19700.0
5
5
5
-6.25
238.6
461.5
260.0
Supported Data Harvest Sensors
Data Harvest sensors are able to connect directly to the Fourier sensor interface,
without the need of any custom adapters.
To use the following Data Harvest sensors they must first be defined in MultiLab.
Note: Only Data Harvest Analog linear sensors are supported. Digital sensors are
not compatible with Fourier data loggers.
Sensor
Current ± 100 mA
Current ± 1 A
Current ± 10 A
Photogate 0-5 V
pH 0-14 pH
Relative Humidity
0-100 %
Light 100 klux
0-100,000 lux
Sound level
40 to 110dBA
Slope
55.807
0.6233
5.547
1
4.3405
-3.838
Intercept
-139
-1.559
-13.73
0
-3.982
Units
m/s2
m/s2
Hg
atm
mm Hg
13.72 mbar
0 Volts
5 Volts
(Min Output
Voltage)
(Max Output
Voltage)
-139
-1.559
-13.73
0
-3.982
140.035
1.55755
14.005
5
17.7205
13.72
-5.47
MultiLab
Name
DH-100mA
DH-1A
DH-10A
DH-Photogate
DH-pH
DH-RH
177.52
-87.515 ppm
-87.515
800.06
DH-Light100K
118.56
-276.66 %
-276.66
316.14
DH-Sound
Chapter 6 Specifications
137
6.4. Accessories
DT011
Input Splitter
Splits one I/O into two inputs
Enables simultaneous use of 8 inputs (analog or digital)
Sensor Cable
Connects data logger to the sensors
DT022
DT023
Vernier Sensor Adaptor
Enables the connection of all the VERNIER analog sensors (with DIN plugs) to
the data logger
DT135
Serial Communication Cable
Connects MultiLogPRO to a serial port on the PC
DT180
USB Communication Cable
Connects MultiLogPRO to a USB port on the PC
12655
Mini USB Communication Cable
Connects USBLink to a USB port on the PC
DT177
Weather Box
Sealed box, meets IP-65 standards
Used to store the MultiLogPRO while operating in rain or in dusty conditions
AC029 (2 units needed)
Solar cell
Connects to MultiLogPRO’s external DC input. Produces 12V @ 5W output
power. Used for when MultiLogPRO is required to work for a long period of time
in the field.
DT245
220V EUR AC/DC adapter
Connects MultiLogPRO to European mains power
DT246
110V USA AC/DC adapter
Connects MultiLogPRO to USA mains power
DT282
220V UK AC/DC adapter
Connects MultiLogPRO to UK mains power
138
Chapter 6 Specifications
6.5. MultiLab Software (Windows and Mac OS)
•
•
•
•
•
•
•
•
•
•
•
•
•
•
•
•
•
•
•
•
•
•
•
Windows support for USBLink and MultiLogPRO data loggers
Mac support for MultiLogPRO
Graph, video, table and meter displays
True multimedia reports of your experiment with data, video, audio and
text files
Online or recorded video stream of the actual experiment
Recording audio comments
Automatic COM port recognition
Online data transfer and display of data in real time
Automatic and manual data download
Stores data on disk files
Quick export of samples data to EXCEL
Import data from other applications
Programs the data logger (instead of using the data logger keypad)
Data Analysis:
o Automatic curve fitting including Linear, polynomial, power
and exponential
o Integral
o Derivative
o Statistics
o Smoothing (averaging)
o Manual curve fitting
o Mathematical and trigonometric functions
o Timing wizard for easy analysis of timing events including
velocity, acceleration, pendulum period and collisions
Video Motion Analyzer
o Capturing video movies
o Capturing position and time
o Analyzing with MultiLab’s analysis tools
Measurement readings facilitated by locating cursors on the graphic
display
Advanced zooming and panning tools
Predict tool – Enables you to graphically predict results
Capture tool – Enables you to capture and record specific data points
from the stream of data downloaded from the data logger
Crop tool – Enables you to trim the edges of a data set
Workbook – Lab manuals with quick data logger setup programming
Calibration of the data logger sensors
Capability of interfacing with sensors from other vendors
Chapter 6 Specifications
139
6.6. MultiLab Software (TI-83 PLUS Calculator)
•
•
•
•
•
•
•
•
•
Graphic display
Online data transfer and display of data in real-time
Automatic and manual data download
Programs the data logger (instead of using the data logger keypad)
Triggering
Data Analysis:
o Automatic curve fitting: linear, quadratic, power and
exponential
o Integral
o Statistics
o User curve fitting
Measurement readings facilitated by locating cursors on the graphic
display
Zoom tool
Calibration of the data logger sensors
140
Chapter 6 Specifications
Appendix A: Figures
Figure 1: USBLink external connections ......................................................................4
Figure 2: Frequency Aliasing .......................................................................................8
Figure 3: Contents of the MultiLogPRO system.........................................................12
Figure 4: MultiLogPRO external connections.............................................................13
Figure 5: MultiLogPRO front panel.............................................................................15
Figure 6: Frequency Aliasing .....................................................................................29
Figure 7: MultiLab window layout...............................................................................40
Figure 8: Video properties dialog box ........................................................................44
Figure 9: View selection dialog box............................................................................53
Figure 10: Edit graph dialog box ................................................................................56
Figure 11: Edit table dialog box..................................................................................59
Figure 12: Setup wizard step 1 of 3 ...........................................................................64
Figure 13: Setup wizard step 2 of 3 ...........................................................................64
Figure 14: Setup wizard step 3 of 3 ...........................................................................65
Figure 15: X-axis properties dialog box......................................................................68
Figure 16: Triggering dialog box ................................................................................68
Figure 17: Edit experiment notes dialog box..............................................................70
Figure 18: Define new sensor dialog box...................................................................72
Figure 19: Communication setup dialog box (Windows)............................................73
Figure 20: Communication setup dialog box (Mac OS) .............................................73
Figure 21: Analysis wizard – curve fit.........................................................................76
Figure 22: Analysis wizard – averaging......................................................................77
Figure 23: Analysis wizard – functions .......................................................................78
Figure 24: Analysis Wizard – online functions............................................................83
Figure 25: Using graph edit dialog to display online functions ...................................84
Figure 26: Online envelope function ..........................................................................84
Figure 27: Manual curve fit toolbox ............................................................................85
Figure 28: Worksheet.................................................................................................95
Figure 29: Creating a worksheet ................................................................................97
Figure 30: Capture dialog box..................................................................................107
Figure 31: Manual Column dialog box .....................................................................107
Figure 32: Capture table ..........................................................................................108
Figure 33: Using Graph edit dialog box to display captured data ............................108
Figure 34: MultiLab for TI main menu ......................................................................114
Figure 35: I/O socket configuration. .........................................................................142
Appendix
141
Appendix B: Adding a Code Resistor
to a Custom Sensor
In order for the data logger to automatically identify a sensor, it must have a code
resistor. Figure 35 shows the input socket configuration for the USBLink and
MultiLogPRO.
You must connect the resistor between the Auto recognition resistance input and the
GND input.
Figure 35: I/O socket configuration.
Mini DIN female. Data logger panel view.
When you define a custom sensor in the MultiLab program you must choose one
sensor from the list provided. Note its position in the list and look in Table 1 to find
the resistance.
Table 1: Auto recognition resistors
142
Position in Define
sensor dialog box
drop down menu
Resistance
(kΩ)
Max
Resistance
(kΩ)
Min
Resistance
(kΩ)
1
372
384.1
360.9
2
410
424.8
396.5
3
455
472.9
437.8
4
508
530.9
486.6
5
573
601.9
544.8
6
653
691.1
615.6
7
754
806.5
703.4
8
888
961.9
814.6
9
1071
1183.0
959.2
10
1337
1524.4
1151.2
Appendix
Index
A
D
H
acceleration · 98
adaptor · 14, 138
analysis · 74, 119
averaging · 77
carve fit · 76, 120
derivative · 75
function · 78
integral · 76
manual curve fit · 85
online · 83
smoothing · 74
time events · 98
wizard · 76
area · 122
automatic identification ·
6, 16
autoscale · 55
averaging · 77
data map · 61
delayed start · See
triggering
delete · 62
derivative · 75
display
control the display · 61
data map · 61
graph · 53
meters · 61
options · 53
properties · 67
select · 18
table · 59
video · 43
Do2 · 28
download · 44, 45, 116
hardware calibration · 10,
32
E
C
cable · 5, 6, 12, 13, 16,
138
calculator · 113
calibration · 10, 11, 28,
32, 33, 71, 126
capture · 106, 123
clear
data · 62
memory · 70
online function · 85
code resistor · 71, 142
COM port · 72
communication setup · 72
configuration · 27
connect · 73
continuous · 8, 9, 30, 31
contrast · 28
control · 69
coordinates · 22, 54
copy · 63
crop · 106, 116
cursor · 22, 54, 116
curve fit · 75, 76
icon · 20
import · 50
input · 5, 13
input mode · 27
integral · 76
K
keypad · 15
L
B
battery · 14
I
edit
data values · 59
graph · 56
notes · 70
table · 59
enter · 17, 19
escape · 20
event recording · 69
Excel · 63
experiment notes · 70
export · 63
external DC power · 14
F
format
graph · 57
table · 60
functions · 78, 79
G
gain · 10, 32
getting started · 41
graph · 22, 53
layout · 15
load
experiment notes · 70
last setup · 27
M
manual
curve fit · 85
sampling · 8, 30, 43
table column · 107
measurement · 65
memory · 30
clear · 28, 70
menu · 19
meter · 20, 61
N
notes · See experiment
notes
number
graph · 57
of samples · 18, 20, 65
table · 60
O
offset · 10, 32
online
analysis · 83
Index
143
communication · 45
video · 43
open · 50
P
panel · 15
panning · 56
pH sensor · 11, 33
port · 14
predict · 98
preset · 67
print · 51
programming
MultiLog Pro · 64
rules · 9, 30
USBLink · 64
project · 41, 50
properties
graph · 55, 57
sensor · 65
table · 60
video · 44
R
rate · 7, 9, 17, 20, 29, 31,
45, 65, 129, 131, 132
recording
data · 18, 42
options · 42
rate · See rate
start · 70
stop · 70
time · 18, 20, 65
video · 43
regression · See curve fit
replay · 43
requirements · 34
run · 42, 43, 70
144
Index
S
sampling Points · 8, 30
sampling rate · See rate,
See rate
save · 50
scale · 55
screen contrast · 28
scroll · 65
sense & control · 69
sensor · 5, 13, 17
assign to input · 64
Auto ID · 6, 16, 27
calibration · 10, 32, 71
custom · 71
measurement · 65
plug in · 17
properties · 65
setup · 7, 17, 20, 26, 27,
29, 64, 114
slope · See derivative
smoothing · 74
snapshot · 106
socket configuration · 142
spreadsheet · 63
stand alone · 15
start · 18, 20, 42
statistics · 121
stop · 18, 20, 42
system configuration · 27
triggering · 68, 125
trim · See crop
troubleshooting · 128
U
units
graph · 57
table · 60
USBLink · 1
layout · 4
V
value · 22, 54
velocity · 98
video · 43
view · 53
voice comments · 43
W
wizard
timing · 98
workbook · 95
worksheet · 95
creating · 96
opening · 95
T
X
table · 20, 59
temperature
compensation · 11, 33
TI · See calculator
time events · 98
timer delay · 69
timing · 98
toolbar
graph · 110
main · 109
table · 111
X-axis · 57, 67
Y
Y-axis · 53, 56
Z
zoom · 22, 55