1
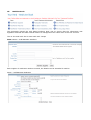
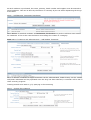
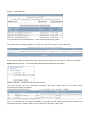
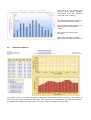
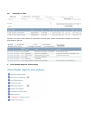
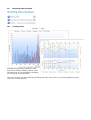
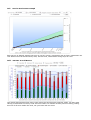
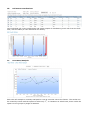
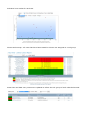
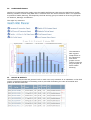
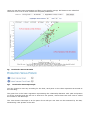
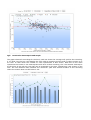
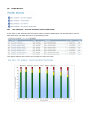
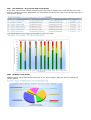
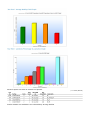
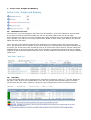
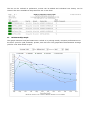
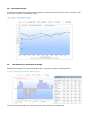
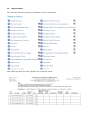
USER GUIDE
Version 3
www.thecis.co.uk
[email protected]
01923 695 319
CONTENTS
Introduction
1. Login Area
a. Member Login
b. Advisor Login
2. Herd Management Menu
a.
b.
c.
d.
Add/Record Animal Events
Medicine Book
Production Planner
Animals For Sale
3. Herd Health Reports and Analysis
a. Breeding Data/Analysis
i. Fertility Chart
ii. Service Performance Graph
iii. 100 Day In-Calf Report
b. Cell Count Contributions
c. Urea Data/Analysis
d. Health Test Analysis
e. Health Wall Planner
f.
Ketosis & Acidosis
g. Production Versus Protein
i. Production Intercept Graph
ii. Production Intercept Trend Graph
h. Heath Monitor
i. SCC Analysis – Current Lactation with Trend Graph
ii. SCC Analysis – Dry Period with Trend Graph
iii. Mobility Trend Graph
4. Action Lists, Graphs and Ranking
a. Rankable Herd List
b. Day2Day
c. Brinkmanship Graph
d. Benchmark Graph
e. Benchmark Key Performance Graph
f.
Reports Menu
5. Data Download
INTRODUCTION
Historically milk recording has been seen as a way to get official milk production records, and this is
important especially when marketing cows, but The Cattle Information Service provides so much
more. Fertility, health, conformation and ancestry of cows are all important factors that determine if
a cow is an asset to the herd or a liability. However, with free time and income on farms being
limited at present, it is not always easy for farmers to get the time to make important management
decisions concerning the future of individual animals.
CIS has tackled this problem head on by developing the web based ‘Your Herd’ management
program, that includes systems and tools that allow the farmer and advisors to view the complete
picture of the herd and investigate individual cows, allowing essential management decisions to be
made without the need to spend valuable time wading through information from several different
sources.
Farmers can also use the data entry area to input events when they happen and all the records are
completed. For instance, when entering a calving not only are the milk records updated with a new
lactation and the calf added to the youngstock report but, by placing a tick in the box, farmers can
apply for BCMS passports and, if needed, pedigree registrations. The new birth is also automatically
added to the movement book, ensuring the records meet legislative requirements. All dairy herd
events can be added in the same manner, thus eradicating the need for duplication.
Inputting data is fast and efficient, but it is when accessing the information that the system comes
into its own. As CIS is part of the Centre of Dairy Information, a wealth of data can be viewed and,
as a large part of the website is interactive, users can quickly pinpoint cows that need attention. The
fertility, health and cell count sections highlights problem cows, allowing farmers to take immediate
action. There is also the facility to print out paper reports, not only those associated with milk
recording such as milk statements and lactation certificates, but action lists for outside use. One of
the great benefits is the website can be used as a stand alone tool or be used in conjunction with
software that is already present on farm, with the facility to download data files to update farm or
vet programs such as Orchid, Sum-It, Uniform and Interherd.
All the information is kept in a secure environment, which gives the farmer the peace of mind that if
there are computer problems on his farm, his records will not be affected. The data can only be
accessed using a password and PIN, therefore the farmer chooses who sees the herd’s information.
Users can also register a mobile phone number to receive a text message when milk records are
updated, allowing farmers and advisors to view important cell count information without relying on
posted paper reports.
There is no extra cost to use the service, so whether the farmer chooses to view only after each
milk-recording test or to use the data entry options. ‘You Herd’ offers real time and financial
benefits.
1
Login
All Milk recording customers and there advisors can access herd data through the login on the home
page.
1a.
Member Login
1b.
Advisor Login
Advisor access and farmer data transfer permission forms are also available here
2.
Herd Management Menu
The interactive area of ‘Your Herd’ is under the banner of Herd Management Menu, here users can
access all management tools, including pedigree society breeding tools if applicable
2a.
Herd Data Entry
Add/Record Animal Events
In this area users can record routine events on farm by either single entry or by batch. Recent user
driven enhancements now include the ability to record mobility scores and weights and height for
youngstock. (further detail in our mobility monitoring and data entry handbooks)
2b.
Medicine Book
The philosophy behind the web based medicine book was to ensure that the information met
legislation and that the data entered became a management tool rather than a tick box exercise.
The on-line med book has 3 areas each with 3 steps
Area 1 Setup – Add/Maintain Suppliers
Each supplier of medicines needs to entered, the details can be amended if need be.
Setup – Add/Maintain Medicines
As each medicine is purchased, the name, quantity, batch number and supplier must be entered to
meet legislation. This can be done by the farmer or remotely by the vet when dispatching the drugs
to the farm.
Setup – Add/Maintain Treatments/Conditions
There are list of standard condition and treatments, but farmers may wish to add their own reason
for treatment. If this is the case the farmer must assign the reason to a category.
Area 2 Drug Treatment and Administration – Add/Update Treatment
Once an animal is selected a single treatments can be administrated, health history can be viewed,
milk/meat withdrawal will be populated once the drug has been selected, A reminder will be set to
check recovery progress.
Treating animals as a batch e.g. fly spraying or foot trimming
Step 1 - Choose the treatment
Step 2 – Select animals
Drug Treatment and Administration – View Actions/Outstanding Tasks
All animals that are treated appear on a due list, when they require further attention.
If the animal needs no further treatment the farmer can mark them as clear or reset the reminder.
Area 3 Report & Prints – View Milk/Meat Withdrawal and Medicine Purchases
Reports & Prints – Treatment & Drug Usage History
Vets and farmers can now interrogate treatment and drug usage history to ascertain which
treatments have been successful
This is an example of the reports available, the screen can be filtered by treatment reason and
parameters set for a specific dates. This is mirrored in the drug usage area.
This graph in the ‘Health Wall
Planner’, area brings together
information from the medicine
book and milk recording.
The blue lines depict the somatic
cell count levels in the herd.
The blue bars are the amount of
cases mastitis treated each
month
The purple line is the mean
average
Date notes can also be added
that could influence performance
2c.
Production Planner
The graph is built using past production information and fertility data to ascertain the number of
cows in the herd each month and their daily yield. The farmer can also tailor the production planner,
if fundamental changes are planned for the future, such as selling or buying cows.
2d.
Animals For Sale
Farmers can mark whole herds or individual cows for sale, these animals then appear on the CIS
and Holstein UK site.
3
Herd Health Reports and Analysis
3a.
Breeding Data/Analysis
3ai.
Fertility Chart
Animals are plotted by the days in milk
and colour coded to fertility status, users
can drill down to see individual cow detail,
by clicking on any of the dots.
The cow overview can be viewed by selecting dots from any of the ‘Your Herd’ graphs and under
‘view’ link in herd ranking
3aii.
Service Performance Graph
Each service is plotted; positive services go up hill, giving a conception rate on farm. Parameters are
user defined and can be filtered by date, service sires, inseminators and groups of cows
3aiii. 100 Day In-Calf Report
This graph demonstrates how many cows within the herd become pregnant within 100 days post
calving. It describes how many cows will calve within 13 months of their previous calving, taking
account of all cows within the herd, not just cows with an event.
3b.
Cell Count Contributions
View individual cell count contributions and assess impact of withdrawing cow’s milk from the bulk
tank, with the ability to view individual cow history.
3c.
Urea Data/Analysis
Each CIS milk sample is routinely analysed for urea at no extra cost to the farmer. The results can
be viewed by trends with the option to select only 1st, 2+ lactations or whole herd, there is also the
option to view groups by stage of lactation.
Individual cow tests are also plotted against protein levels, users can set the parameters for the
shaded areas.
3d.
Health Test Analysis
Four production disease Jones, IBR, BVD and Lepto analysis can be done on routine milk samples for
either individual cows or the bulk tank. Below is an example of one of the reports, this is for the
Herdcare accreditation scheme, that CIS participate in.
Individual cow results for each test.
Johnes Risk Groups - All cows that have been tested for Johnes are assigned to a risk group.
Action lists and data entry screens are updated to reflect the risk group of each individual animal.
3e.
Health Wall Planner
CIS have incorporated eight graphs into the Health Wall Planner that meet the defra Farm Health
Planning initiative criteria using data that is collected from the online medicine book. The approach
to proactive health planning, developed by the FHP working group is based on three key principles
of: Measure, Manage, and Monitor.
The eight key areas are
The Mastitis &
Milk Hygiene
Graph below is
an example on
how these
graphs can be
used to meet the
key principles of
Farm Health
Planning
3f.
Ketosis & Acidosis
The imbalance of butterfat and protein levels in milk is an early indicator of an imbalance in the feed
regime. Graphical illustration of lactating cows is provided illustrating the ratio of butterfat and
protein at the last milk test.
Users can set there own parameters and filter to see specific groups, drill down to see individual
cows and view a list of cows outside the accepted parameters.
3g.
3gi.
Production Versus Protein
Production Intercept Graph
You can choose to view any recording for the herd, each point on the chart represents an animal at
the recording.
The green line is the linear regression representing the relationship between milk yield and protein
% at the recording and the red line is fixed at 3.2% protein, where these two lines cross is called
the 'Protein 3.2% Intercept'.
The 3.2% Protein Intercept is at the point of KG milk per cow that can be sustained by the diet,
maintaining 3.2% protein in the milk.
3gii.
Production Intercept Trend Graph
The graph shows all recordings for the herd, each bar shows the average milk yield at the recording,
if you float over the bar it will display the milk yield at recording and the milk kg where protein % is
at 3.2%. In both cases the number of cows represented is also shown. Each dot on the chart
represents the Protein 3.2% Intercept KG milk value at that recording, the 3.2% Protein Intercept is
at the point of KG milk per cow that can be sustained by the diet, maintaining 3.2% protein in the
milk. The line between dots indicates the maximum yield that animals achieve at the recording
where the protein does not fall below 3.2%
3h.
3hi.
Heath Monitor
SCC Analysis – Current Lactation with Trend Graph
A list of all in milk animals with there SCC status, the SCC parameters can be tailored to suit the
farm and users can filter the list to view specific groups.
This graph displays the trend in the number of cows over time
3hii.
SCC Analysis – Dry Period with Trend Graph
A list of all newly calved animals comparing their first test of lactation SCC with the last test of the
previous lactation, the SCC parameters can be tailored to suit the farm and users can filter the list to
view specific groups.
This graph displays the trend in the number of cows over time
3hiii. Mobility Trend Graph
Mobility scores can be entered by the farmer or the milk recorder, data can then be viewed in a
variety graphs.
Several reports can also be viewed and printed
Further details are available in the CIS Mobility Scoring Booklet
4
4a.
Action Lists, Graphs and Ranking
Rankable Herd List
The first time you visit the page it will show you all animals in your herd ordered by Line Number.
If you want to look for specific animals you can use the filter fields at the top of the page.
If for example you wish to view only Females then select Females from the drop down list and click
filter. Equally if you want to view only animals with 'STAR' in their name, type STAR in the Animal
Name box and click filter.
The £ per day is the lifetime financial value divided by the number of days the animal has been
alive. The financial value is worked out by taking total kg of yield between tests and multiplying by
the pence per litre at each test, divided by 102.97 to convert the value to litres. All test values are
added together to give the financial value for the lactation. All lactation financial values are added
together to give the total lifetime financial value. Further details for individual cows is also available
under view.
4b.
Day2Day
In this area action lists can be generated for Cows Due to Oestrous, Due for 1st Service, Ready to
PD, Not in Calf, Due to Calve and Ready to Dry Off. Any animal that has had single or multiple
Johnes milk test are colour coded by risk group. The example below refers to cows due to PD
The list can be ordered to preference, events can be added and individual cow history can be
viewed. The list is available to be printed for use on the farm.
4c.
Brinkmanship Graph
This graph monitors herd performance as a whole or by calving month, compare performance over
the last 3 years for yield, butterfat, protein, SCC and urea. The graph below demonstrates average
yield for cows that calved in April.
4d.
Benchmark Graph
A benchmark graph demonstrates herd production performance over the previous 12 months, with
the facility to select a comparison group
4e.
Benchmark Key Performance Graph
Illustrates a snapshot of herd performance and a comparison against contemporaries.
The benchmarking graphs are accompanied by herd values and comparisons
4f.
Reports Menu
All usual milk recording reports are available on line in pdf format.
Also within this area are extra reports such as TB test charts
and the animal movement book with BCMS references
Type Classification Herd List
Parlour Sheets
5
Data Download
Electronic files can be downloaded here free of charge to update or populate farm and vet programs
such as Orchid, Sum-It, Uniform and Interherd.
Notes
The Cattle Information Service
Scotsbridge House, Scots Hill, Rickmansworth, Herts
Tel: 01923 695 319 email: [email protected] Web: www.thecis.co.uk