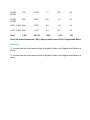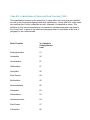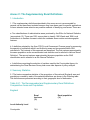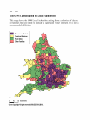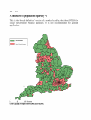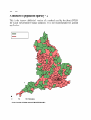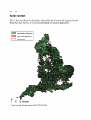
1
Urban and rural area definitions: a user guide
On 5th May 2006 the responsibilities of the Office of the Deputy Prime Minister (ODPM) transferred to the Department for
Communities and Local Government.
Department for Communities and Local Government
Eland House
Bressenden Place
London SW1E 5DU
Telephone: 020 7944 4400
Website: www.communities.gov.uk
Documents downloaded from the www.communities.gov.uk website areCrown Copyright unless otherwise stated, in
which case copyright is assigned to Queens Printer and Controller of Her Majestys Stationery Office.
Copyright in the typographical arrangement rests with the Crown.
This publication, excluding logos, may be reproduced free of charge in any format or medium for research, private
study or for internal circulation within an organisation. This is subject to it being reproduced accurately and not
used in a misleading context. The material must be acknowledged as Crown copyright and the title of the
publication specified.
Any other use of the contents of this publication would require a copyright licence. Please apply for a Click-Use
Licence for core material at www.opsi.gov.uk/click-use/system/online/pLogin.asp or by writing to the Office
of Public Sector Information, Information Policy Team, St Clements House, 2-16 Colegate, Norwich NR3 1BQ.
Fax: 01603 723000 or e-mail: [email protected].
This publication is only available online via the Communities and Local Government website: www.communities.gov.uk
Alternative formats under Disability Discrimination Act (DDA):if you require this publication in an alternative format
please email [email protected]
Contents
Introduction
Section 1: Summary of definitions
Section 2: Quick reference guide
Section 3: Description & statistics for the urban settlement
Annex A: Statistics and maps for 1991 Urban Settlements
Annex B: The classification of 1998 administrative areas
Annex C: The Supplementary Rural Definitions
Annex D: Contacts
$SSHQGL[ PDSV IURP $QQH[HV $ WR &
Introduction
Background and objectives
1. In 2001, the Office of the Deputy Prime Minister (ODPM) - then the Department of
Transport, Local Government & the Regions (DTLR) - commissioned a consortium led by
the South East Regional Research Laboratory (SERRL) at Birkbeck College (see endnote
1), to undertake a review of the definitions of urban and rural areas in use for policy
purposes and statistical reporting. The need for such a study had been recognised for
some time and was reinforced during preparation for the Urban and Rural White Papers
(see endnote 2). In particular there was a clear need for a more consistent approach to the
use of definitions.
2. The main objectives of the Review of Urban and Rural Definitions were:
• to undertake a literature review of approaches to defining urban and rural areas,
• to conduct consultations with government users of urban and rural definitions to identify
the strengths and weaknesses of existing definitions,
• to identify government needs for definitions of urban and rural areas,
• to identify as small a set of definitions as possible, to meet a range of user needs, and
• the review was also required to make recommendations on improvements to existing
definitions and, if necessary, to outline approaches to the creation of new definitions.
3. The full research report and the recommendations have been published electronically at
http://www.statistics.gov.uk/geography/urban_rural.asp
4. One of the main conclusions was that no single existing definition of urban and rural
areas could meet the needs of all users. There was also a lack of clarity in the main central
government departments around definitions in current use and around choosing a definition
for particular policy and analysis purposes.
5. Therefore, whilst the research report recognised that more work needed to be done on
spatial analysis to solve some of the problems of the existing definitions, it recommended
that a user guide be written on the definitions currently in use.
6. The main Project Report identifies a number of different types of definitions of urban and
rural areas that could be said to be 'core' in the sense that they meet a range of user needs
and are more widely used than others. This document constitutes a User Guide to
these definitions.
7. This User Guide serves five main purposes:
• to present and explain the recommended definitions with a view to encouraging their use
wherever they are suitable to user needs,
• to describe a supplementary set of definitions as background information,
• to present key summary statistics on the population and land area covered by the
definitions,
• to present maps to illustrate the definitions, and · to indicate characteristics of the
definitions that might impinge upon the work of users.
Meeting different user needs
8. The need for an urban/rural division tends to have arisen from the need to identify either
the urban or the rural environment and thus the approaches taken to definitions are from
either a predominately urban or rural point of view.
9. Those dealing with urban issues are primarily concerned with conditions in our towns
and cities. As these have developed historically as the sites of human settlements and the
associated man made infrastructure, the natural view of urban areas is one of built up
'settlements'. The boundaries of these settlements are determined by the outer limits of the
physical structures and this approach consciously avoids the constraints of administrative
area boundaries.
10. Whilst physical settlements, particularly smaller ones, are of considerable interest to
those concerned with rural issues, the concept of rurality has often been more tied up with
the social, economic and other circumstances associated with rural life. Of the options
currently available, rural policy makers prefer to use a socio-demographic classification of
administrative areas in order to identify rural areas.
The definitions covered in this guide
11. The recommended set of definitions is set out in detail and a supplementary set is
included as background information:
• Recommended set: a narrow set of definitions which best meet most user needs.
These are presented with practical guidance to avoid ambiguity in application. The set
comprises two basic types:
a. Urban settlements and
b. Administrative area classifications
• Supplementary set: several alternative definitions that have been used for specific
applications or have been considered by users in the past are described.
12. Section 1 summarises all the definitions in the recommended and supplementary sets.
Section 2 gives a practical usage guide to the recommended set and section 3 gives a full
description of the recommended set with statistical summaries. The supplementary
definitions are more fully described in Annex C.
Next Steps
13. ODPM , ONS and Ordnance Survey are currently working on the updated version of
the 1991 Urban Settlements (previously called urban areas). These 2001 Urban
Settlements will be based on 2001 boundaries of urban land and population data from the
2001. They will form the basis of urban output from the 2001 Census, due out in 2003.
14. As touched on above, there is a mismatch between the urban approach and rural
approach to definitions. Rural policy makers have found that to simply consider all areas
outside urban settlements as rural does not satisfactorily meet their requirements; hence
the development of the socio-economic classification of administrative areas to try to
identify areas with rural characteristics.
15. The Countryside Agency, DEFRA, ODPM and ONS will be developing a new definition
of rural areas that will better reflect current needs for the development of rural policy and
be more consistent with the land-use based definition of urban areas. This is expected to
be available in Summer 2003.
Endnotes
1. The other members of the consortium were the Centre for Urban and Regional
Development Studies at the University of Newcastle and the Department of Town and
Regional Planning at the University of Sheffield.
2. Our Towns and Cities: the Future. Delivering an Urban Renaissance Cm 4911 TSO
2000, Our Countryside: the Future. A Fair Deal for Rural England, Cm 4909, TSO 2000
Section 1: Summary of definitions
Recommended set
There are two basic recommended definitions. Section 2 gives a practical guide to their
use, Section 3 gives a full description with summary statistics and Annex A and Annex B
identify the defined areas and illustrate them with maps.
1. Urban Settlement definition based on land use (England & Wales)
This is the ODPM (DTLR) definition of 1991 Urban Settlements. They have in the past
been called "Urban Areas" but to avoid confusion the term "Urban Settlements" will now be
used. The basis of the definition is land with an irreversibly urban use and it is independent
of administrative area boundaries. The 1991 Urban Settlements will be replaced by the
2001 Urban Settlements and these will be used from 2003.
The definition appears as computer readable boundaries of all built up settlements with a
minimum population of 1,000 and a minimum land area of 20 hectares. The user can
choose a settlement size above which land is treated as urban for their purposes.
To produce consistency in statistical reporting a cut off population of 10,000 is
recommended for general purpose use. Adoption of this standard is encouraged where
there are no particular reasons for setting a different level. Using this standard, all
settlements of over 10,000 are treated as urban areas. All smaller settlements, together
with all other land, are treated as rural areas.
The Urban Settlement boundaries can be used in conjunction with any other geographically
referenced data, such as postcodes and any digitised boundaries.
2. Administrative Area Classification definition based on socioeconomic
variables (England)
This is the Countryside Agency classification of rural and urban administrative areas based
on a range of socio-economic characteristics of the population at local authority and ward
levels.
A county level classification, based on the ward level classification, is recommended with
the reservation that it should be used only where there is no other choice. At a high
geographical level it is less meaningful to describe an area as urban or rural, so this
definition has limited use.
Supplementary set:
Three other definitions, appropriate for their designated purpose but not recommended for
general use, are described in Annex C:
3. ONS Area Classifications
4. Local Government Finance sparsity measures
5. Countryside Agency Rural Services Survey Parishes
Statistical comparison of the recommended definitions
England
Definition
Urban
population
(millions)
Rural population Urban land area Rural land area
(millions)
(hectares,
(hectares,
millions)
millions)
42.4
4.6
1.1
12.0
37.8
9.2
0.9
12.1
Administrative
area
classification
35.6
13.9
1.7
11.3
Wards
35.6
13.9
3.0
10.0
Local Authorities 24.3
(Districts)
16.9
2.7
9.5
Urban
Settlements
Over 1,000+
population
Over 10,000+
population
Counties *
* The county classification does not include the Unitary Authorities, which are included in
the local authority (district) level classification.
The Urban Settlement population is based on the 1991 Census.
The administrative area population is based on the 1998 mid year estimates of population.
Section 2: Quick reference guide
This section provides practical summary advice for users to help them choose a definition.
Full descriptions of the recommended definitions are given in section 3, together with maps
and statistical summaries.
1. Urban Settlement definition based on land use:
Description
Purpose made boundaries for areas of built up land at least 20 hectares in area and with a
population (1991 Census) of 1,000+.
Recommended uses
• To define the boundaries of urban settlements: the settlements defined have a
population associated with them and thus different sizes of settlements can be selected
to meet user needs by adjusting the cut-off point.
• To produce a division of the country into urban and rural areas: this definition
should be used where possible, i.e. when the user is not dependent on using
administrative areas.
Settlement size cut-off
The population threshold of urban settlements that are treated as urban areas can be set
anywhere from a minimum of 1,000 persons, to meet particular policy purposes.
As a standard for general purposes a threshold population of 10,000 is recommended, with
all settlements of over 10,000 treated as urban areas and smaller settlements, together
with all other land, treated as rural.
Coverage
England and Wales. See contacts for other UK countries in Annex D.
Combining with other data
Once the user has chosen a population threshold, any data with a spatial reference (e.g.
census enumeration district centroids, postcode or grid-referenced data or digital
boundaries) can be used with the urban settlement boundaries on Geographic Information
Systems.
Maps and basic statistics
Map A1 and map A2 in Annex A illustrate the urban settlements of more than 1,000 and
10,000 population size respectively for England and Wales. The web version of the guide
provides the electronic 1991 Urban boundaries.
The tables in Section 3 show summary statistics for Urban Settlements. The Urban
Settlements with populations of 10,000 or more are listed in Annex A with their population
counts. A list of all Urban Settlements (population 1,000+), with their population counts, is
available with the web version of the User Guide.
Access to further statistics
Statistics are available for Urban Settlements (and Scottish Settlements) in Great Britain in
a published volume: 1991 Census, Key Statistics for Urban and Rural Areas: Great Britain,
ONS/GROS, 1997. Other volumes for non-standard regions cover England and Wales in
more detail.
Updates
The 1991 Urban Settlements will be superseded by the 2001 Urban Settlements later in
2002 and these will form the basis of the Urban Settlements output from the 2001 Census
in 2003. The minimum settlement size of the 2001 Urban Settlement boundaries and of the
associated census outputs are under discussion.
Other Comments
This definition has been widely used, is simple in concept and fits well with the popular
perception of urban areas as land that has been built upon. As the definition does not use
administrative areas (except for sub-divisions), the Urban Settlements are a good
representation of built up settlements of population. Depending on size, they typically
include a number of, and/or bisected parts of, local authorities and wards.
Rural policy makers often find that regarding all land outside the Urban Settlements as
rural areas, is insufficient to meet their needs. Hence the development of the Area
Classification method which was developed primarily to identify rural areas of England.
However in terms of land use, the settlement method is the most effective way to obtain an
Urban/Rural split of the country.
2. The administrative area classification definition based on socio-economic
variables
Description
This definition operates on three geographical levels: ward, local authority and county. As
stated earlier, the county level classification is only recommended when no alternative
geographical level can be used. The overall method for the administrative areas
classification was designed to identify those areas with certain social and economic
conditions that were considered to give them a rural character. By default the remainder
are considered urban, providing a classification of all areas as either urban or rural.
Ward level definition
This is derived from the LA definition below. A range of socio-economic variables was
identified that produced similar results to the classification of rural areas at the local
authority level. These variables were then applied to the 1998 wards, producing a
classification of rural wards.
Local Authority level definition
The rural local authorities were identified for the Rural Development Commission by
combining and amending three earlier classification systems. Further changes were then
made to prepare a rural class of post 1998 Local Authorities. At the time of publication
there are 145 rural LAs.
County level definition
A classification of the 1998 counties as urban or rural, according to the number of urban
and rural wards as determined by the Countryside Agency ward level definition.
Recommended uses
• To identify rural areas for rural policy purposes: of the definitions currently available
to identify rural areas, this is recommended and is regarded by those responsible for
rural policy as best meeting their needs.
• To produce a division of the country into urban and rural areas using
administrative areas: this should be used when the user needs to identify
administrative areas (i.e. wards and districts) as urban/rural, usually so that other data
can be attached. For example, to calculate the waste recycling rate in urban/rural areas
as the recycling rate is only available at district level.
Coverage
England. See contacts for other UK countries in Annex D.
Combining with other data
Any data that are arranged by local authority or ward (or can be assigned to these areas)
can be matched to the classification.
Maps and basic statistics
Summary statistics appear in Section 3. The Rural Local Authorities are listed in Table B1,
Annex B. The Rural Local Authorities and Rural Wards are illustrated in Map B1 and map
B2, Annex B. The rural wards identified in the maps are as classified shortly before going
to print. Minor recent changes are shown in the list on the web version. The Rural Counties
(recommended with reservation) are listed in Table B2, Annex B.
Access to further statistics
Use of standard administrative areas means that a huge range of statistics is available
from many sources. Lists of Rural Wards and Rural Local Authorities are available
electronically with the web version of the User Guide.
Other Comments
Of the definitions currently available, those working on rural policy favour a system that
identifies a class of administrative authorities as being rural in nature. The classifications
recommended here are those currently used by the Countryside Agency for the State of
the Countryside reports. The ward-level classification, sometimes known as 'Oxford- CA',
was developed by the Social Disadvantage Research Centre, Oxford University.
Section 3: Description & statistics for the urban settlement
This section gives a more detailed description and consideration of the recommended
definitions with statistical summaries. Parts 1 and 2 deal respectively with the urban
settlements and the administrative area classifications. Part 3 provides a visual comparison
of the two approaches to highlight the differences in outcome.
Part 1: The 1991 urban settlements definition
Introduction
1. There are three main approaches that can be adopted in the definition of urban areas:
• A land use approach: identifies the closely built up area of settlements, i.e. the bricks
and mortar 'footprint' of urban areas,
• A functional area approach: identifies the hinterland over which a town is important in
the provision of jobs, services and facilities, and
• A density approach: uses the density of some phenomenon on the ground - usually
population - but it could, for example, be households or buildings.
2. None of the methods is without its difficulties, whether in the conceptualisation of what
we choose to regard as 'urban' or in the availability of data of the right type and in the right
form to implement the definition. The actual settlement geography of a country also creates
difficulties in applying and interpreting definitions. Decisions on the definition and
delineation of urban settlements seldom work well in all circumstances and 'towns',
however defined, tend in certain places, to merge physically and functionally with
neighbouring towns and hinterlands.
Historical development of the Urban Settlements approach
3. The land use approach used to derive the Urban Settlement definition can be seen as
coming into use in the early 1980s. It was then that the Statistical Office of the European
Communities requested a definition of urban agglomerations of 100,000 or more people in
relation to the 1980 round of censuses. The then Office of Population Censuses and
Surveys (OPCS) and the Department of the Environment (DOE) selected the land use
approach to defining towns and cities.
4. A land use approach offered advantages in terms of comparability between countries
(i.e. using an established base in topographic mapping). It also had a working antecedent
in the 'developed areas' map produced by DOE and modelled on the National Land Use
Classification (see endnote 3). As a result of this work a set of national and regional reports
of statistics was produced by OPCS, derived from 1981 Census information (e.g. 1981 Key
Statistics for Urban Areas, Great Britain, HMSO 1984).
5. The exercise was repeated for the 1991 Census using the same definition but updated
for inter-censal changes in the extent of urban settlements (ONS/GROS 1991 Census Key
Statistics for Urban and Rural Areas, HMSO 1997) (see endnote 4). This Urban Settlement
definition as devised by the DOE, OPCS, OS and the Welsh Office for 1991, is the most
widely and frequently used of any definition of urban England and Wales (see endnote 5).
How the definition works
6. The Urban Settlements definition is based on '... the identification of areas with a land
use that is irreversibly urban in character.' For urban land to qualify as an Urban Settlement
it must extend for 20 hectares or more and have a population of at least 1,000.
7. It is useful to distinguish between the two elements of the process of obtaining a set of
urban settlements and their associated statistical (census) information: the definition of
tracts of urban land use, and the identification of urban settlements.
Urban land use
8. In the 1991 exercise urban land was identified under the following categories:
• permanent structures and the land on which they are situated (a 'built up' site); (see
endnote 6)
• transportation corridors (e.g. roads, railways and canals), which have built up sites on
one or both sides, or which link up built up sites which are less than 50 metres apart,
• transportation features such as airports and operational airfields, railway yards,
motorway service areas and car parks,
• mine buildings (but mineral workings and quarries are excluded),
• any area completely surrounded by built-up sites, and
• playing fields and golf courses that are surrounded by a built up area (otherwise they
are excluded).
Size and population limits
9. A pre-requisite for the identification of an urban settlement is that an area of urban land
(as defined in paragraph 8 above) should extend for 20 hectares or more. Separate areas
of urban land are aggregated if they are less than 200 metres apart.
10. For an area of urban land to qualify as an Urban Settlement it must have a minimum
population of 1000. However, as there was no prior information on the 1991 populations of
areas of urban land, a proxy threshold was applied by excluding areas with less than four
1991 Census Enumeration Districts (EDs).
Steps in the identification process
11. The process of identifying urban areas thus involved the following stages:
i. updated digital versions of the extent of urban land were produced using 1:10,000 scale
Ordnance Survey field office data,
ii. census EDs were assigned to tracts of urban land if their centroids were within the area
of urban land or within a buffer zone 150 metres from its boundary,
iii. those areas of urban land with four or more such EDs whose populations summed to
1000 were classified as urban settlements,
iv. areas of urban land of 20 hectares or more and less than 200 meters apart which also
had an aggregate of four or more EDs were linked together to form continuous urban
settlements,
v. agglomerations or 'multi-centre' areas were divided into 'sub-divisions', usually based on
local authority boundaries.
The end product
12. The definition leads to the creation of 1,859 distinct Urban Settlements in England and
Wales (1,682 in England) with a population of just over 44 million or 90 per cent of the total.
In England they comprise 1.1m hectares of land in aggregate (8.3 per cent of the surface
area). The largest urban settlement is Greater London with a resident population of 7.7
million, whilst the smallest are defined to have around 1,000 persons.
13. The Urban Settlements for populations of 1,000+ and 10,000+ are shown on Map A1
and Map A2 respectively. Tables 3.1.1 and 3.1.2 below summarise the corresponding
populations and land cover associated with these two cut-off points.
Table 3.1.1: Population and land area for Urban Settlements over 1,000
population (this is the smallest settlement size available)
England &
Wales
1991
population
(millions)
% of total
population
Land area
(hectares,
millions)
% of total
area
Total land
49.9
100
15.1
100
Urban
Settlements
44.7
90
1.1
8
Rural Areas
5.1
10
14.0
92
Separate figures for England and for Wales are given in Annex A.
Table 3.1.2: Urban areas over 10,000 population: the recommended basis of
an urban/rural division
England &
Wales
1991
population
(millions)
% of total
population
Land area
(hectares,
millions)
% of total
area
Total land
49.9
100
15.1
100
Urban
Settlements
39.6
79
1.0
7
Rural Areas
10.3
21
14.1
93
Separate figures for England and for Wales are given in Annex A.
14. Table 3.1.3 gives a summary of the Settlements with population of 750,000 or more.
The Urban Settlement of West Yorkshire includes Leeds, Bradford, Wakefield,
Huddersfield and a number of other 'towns' that are merged into a single Urban Settlement
(see Map A3). The West Midlands Urban Settlement includes, among other places,
Birmingham, Solihull, Walsall, West Bromwich and Wolverhampton. The largest settlement
in Wales is Cardiff with a population of some 308,000.
Table 3.1.3 Urban Settlements Over 750,000 Resident Population 1991
1991 population % of total Urban Land area
(millions)
(hectares,
Population
(England)
thousands)
% of total Urban
land area
(England)
Greater London
7.7
18.0
162
14.9
West Midlands
2.3
5.4
60
5.5
Greater
Manchester
2.3
5.4
53
4.9
West Yorkshire
1.4
3.4
36
3.3
Tyneside
0.9
2.1
21
1.9
Liverpool
0.8
2.0
19
1.7
Total
15.4
36.3
350
32.2
Using the Urban Settlements definition
15. The wide acceptance and varied usage of the Urban Settlements definition is due to its
transparency, the existence of a set of high resolution digital boundaries suitable for use
with Geographic Information Systems (see endnote 7) and the availability of a range of
census and other statistics.
Names, codes and sub-divisions
16. Larger urban settlements are internally sub-divided and have Census statistics reported
for them. Sub-divisional boundaries are usually based upon local authority district 16
boundaries. Urban areas and their sub-divisions are coded in the digital version of the data
set using a six-character code in the form: D84100 (Liverpool). The first four elements of
this Urban Area Serial Number or 'UASN' indicate entire urban areas. The final two digits
can be used to indicate sub-divisions of larger urban areas. For example, Liverpool
comprises eight sub-divisions numbered from D84101 (Crosby) to D84108 (Prescot). Freestanding urban areas with no sub-divisions should have a UASN terminating in two zeros
(00).
17. Areas separated by less than 200 metres are treated as being the same urban
settlement and their codes share the same first four characters. If the areas are separated
by less than 50 metres they are given the same full six character codes.
18. Both individual urban settlements and aggregations of urban settlements are assigned
names. In the case of aggregations some are familiar town names (e.g. Leeds), whilst
others are less obviously associated with a conventional 'town' (e.g. Thanet). There are
also composite names such as 'Scarborough/Scalby'. This form of naming stems, in many
circumstances, from the operation of the '200m rule' for creating contiguous urban areas
(see endnote 8).
19. Map A2 shows agglomerations of urban settlements whose populations sum to at least
10,000. Sub-divisions are discernible within many urban areas of this size. Many urban
settlements appear familiar (drawn at this scale), as large and major cities: for example
Plymouth, Bristol, Leicester, Liverpool, Leeds, etc. Others may be less familiar as 'towns',
for example Chesterfield/Staveley/Wingerworth Urban Settlement and Thanet Urban
Settlement (comprising Broadstairs, Margate and Ramsgate). Such aggregations may or
may not relate to the policy analysis task in hand.
The effects of rules on close neighbours
20. In the vast majority of cases the 200m contiguity rule which 'joins' otherwise separate
urban areas together produces results that are intuitively plausible in terms of what is
accepted, with some local knowledge, as an urban 'place'. In some instances, however, the
rule can lead to less obvious results. Map A3 shows the West Yorkshire Urban Area, which
comprises no fewer than 25 components forming a convoluted chain, some parts of which
are linked by only a few houses.
21. Map A4 looks at the eastern edge of the Greater Manchester Urban Area, which
includes the separate settlement of Longdendale - they are merged according to the rules
for defining Urban Areas. The Urban Area of Glossop/Hollingworth is separated from
Greater Manchester (including Longdendale) by a slightly bigger gap, and is treated as a
separate Urban Area. The inset shows the gap in detail, to demonstrate how this could
change with only small scale development.
Comparison with administrative area boundaries
22. Although Urban Settlements are simple in concept and seemingly straightforward in
definition, users should be conscious of the underlying definition and their independence
from administrative area boundaries. The rules for defining tracts of urban land can, for
example, lead to highly irregular and intricate patterns. Visual inspection of mapped
boundaries provides a much better appreciation of urban morphology and the differences
between urban and administrative boundaries.
23. Map A5, Map A6 and Map A7 show the relationship between urban settlements and
other administrative units at different geographic scales and for different sizes of Urban
Settlement. This relationship is significant when calculating the amount of land in an Urban
Settlement that falls within a local authority boundary and when deriving certain kinds of
information for Urban Settlements. The figures emphasise the importance of having a 'map
view' of Urban Areas.
24. Map A5 shows the West Midlands and Coventry/Bedworth Urban Settlements
alongside current local authority districts. The main Urban Settlement boundaries are very
different to the local authority boundaries, though the latter are in many cases followed by
the boundaries of the Urban Settlement sub-divisions.
25. In Maps A6 and A7 the scale changes to show the relationship between ward and
urban settlement boundaries for a medium sized Urban Settlement (Norwich), and for a
small Urban Settlement (Braintree). The boundaries related to them are 1998 wards. In the
case of Norwich Urban Settlement, selected wards might make an acceptable boundary for
the Urban Settlement for some purposes, whereas for Braintree they might be less
acceptable. Visual inspection of this kind might be advised when gathering ward related
data for smaller Urban Settlements.
26. Map A8 depicts the pattern of Urban Settlements and urban land for part of East
Anglia. The grey areas represent urban land that does not qualify as an Urban Settlement.
Failure to qualify can result from the way in which the capture of census Enumeration
Districts is affected by the size and/or the configuration of the urban land or ED boundaries.
Reliance only on Urban Settlements as an indicator of very small rural settlement is thus
likely to be misleading.
Small settlements and specific applications
27. Some policy areas, for example in meeting local housing needs through urban housing
capacity studies, require a more flexible approach to the identification of small urban areas.
For such purposes the term 'urban' can embrace all settlements that can contribute to a
sustainable pattern of development. This could include Urban Settlements with a
population below 3,000, referred to as 'rural' in Planning Policy Guidance 3 (Circular 6/98),
and could potentially include settlements that are smaller than the 1,000 minimum
threshold of the Urban Settlement definition.
28. Some applications involve the identification of small 'rural settlements'. This can be to
apply policy measures in support of rural services that tend to be based in such
settlements and serve a wider area. In such cases rural policy can be applied by means of
identifying the smaller settlements within the Urban Settlement definition, rather than by
identifying the broader rural areas.
Limitations with very small settlements
29. The effect of excluding urban land if the population of the four EDs allocated to them
did not sum to 1000 has some significance for those interested in small settlements.
OPCS/GROS suggest that this resulted in ' ... the exclusion of some areas of urban land
with more than 1,000 population but very few above 2,000' (OPCS/GROS, 1997,
paragraph 4.15). So far as can be ascertained, no assessment was made of the impact of
this rule in terms of the number and location of small settlements not identified as Urban
Settlements.
Land outside the Urban Settlements
30. The Urban Areas definition has sometimes been used to give information for 'rural'
England and Wales by subtracting Urban Area populations and land areas from some
larger population/area either nationally or within smaller areas, e.g. counties (see endnote
9). This 'residual' approach is transparently simple, and straightforward to understand, but
it has a number of limitations as a way of defining rurality and tends not to be a definition of
choice for those with rural policy interests.
Urban land boundaries
31. Digital boundary sets are available for both Urban Settlements and urban land. Where
these are held together care is needed to distinguish one from the other. Urban land may,
of course, be of policy interest as part of the total urban land cover.
Endnote
3 Department of the Environment, National Land Use Classification, HMSO 1975. In fact, in
the period 1955- 1975, land use/land intensity methods were the most prevalent in official
definitions of urban areas. One of the rare official attempts to depict urbanism as a set of
functional (commuting) areas appears in Royal Commission on Local Government in
England 1966-69, Vol 3, Cmnd 4040 II, HMSO June 1969 (Maps) and illustrates well the
problems involved.
4 Statistics for Scottish urban localities are included in the volume though they are based
on an approach to definition that does not focus on land use as such.
5 There is a different approach to defining urban areas and assigning their population
levels in Scotland. See Scottish Settlements, Urban and Rural Areas in Scotland, GROS
2001 and 1991 Census, Key Statistics for Urban and Rural Areas: Great Britain,
ONS/GROS, 1997 paragraphs 4.21-4.36
6 For this purpose 'land' is defined as the ground covered by a permanent structure and
any ground enclosed by, or closely associated with, such a structure.
7 Ordnance Survey, Urban Areas_91, User Manual, 1994 (mimeo)
8 Areas of urban land not qualifying as Urban Areas are not named.
9 See, for example, Summary Tables 1-14 in 1991 Census, Key Statistics for Urban and
Rural Areas, ONS/GROS, 1997.
Part 2: The rural administrative area definitions
Further information on Rural Areas
Introduction
1. The approach to defining Rural Areas has been very different from that used in
identifying Urban Settlements. Rather than focusing on settlements, there has been a
tradition of classifying administrative and other areas based upon a range of characteristics
deemed to indicate the various social and economic dimensions of 'rurality'.
2. Rural Areas defined in this way have the advantage of being based in a wide range of
nationally consistent data (often derived from the census), and of relating directly to agents
of rural policy delivery such as local authorities, but have generally lacked important
dimensions associated with 'rurality' such as the size, form and pattern of settlement. (see
endnote 10) Such dimensions are only imperfectly captured by, for example, measures of
population density. They also raise the question of geographic scale in relation to rural
definitions: at national, district and local scales, for example, different aspects of
rurality/rural settlement become important in both definitional and policy terms.
Historical Development of the rural classifications
3. Of the various methods used to classify rural administrative areas, three systems are
recommended. These operate at the ward, local authority (district) and the county levels.
Whilst the methodologies differ, they are related in a manner that produces results with
many features in common. The following sequence of descriptions reflects the
chronological relationship of the ward level classification, firstly to the earlier Local
Authority classification whose effect it seeks to emulate, and secondly to the recent
aggregation of the ward level results to reach a classification of counties.
The underlying local authority district classification
4. Developed for the Rural Development Commission, this method relied on a combination
of three earlier classifications which relied on a range of socio-economic variables: the
National Council of Voluntary Organisations (Redefining Rural Districts in England), the
ONS 1991 Classification of Local and Health Authorities (see supplementary definitions)
and a DoE list of additional rural authorities prepared for the 1995 Rural White Paper.
A ward level model to replicate the local authority system
5. The ward level definition takes a range of socio-economic variables, selected to produce
similar results to the local authority level classification, and applies these to the 1998
wards. It was developed in 2000 for the Countryside Agency by the Social Disadvantage
Research Centre (SDRC), at the Department of Social Policy and Social Work, Oxford
University.
Using the ward system to aggregate to counties
6. This is a recent application of the ward level classification to the post 1998 Counties,
created to cover circumstances in which an urban/rural distinction at that level of
geography cannot be avoided.
Identifying the rural administrative areas
Ward level methodology
7. A range of socio-economic variables was identified that corresponded well to the division
of rural and non-rural authorities in the Local Authority level definition. This was then
applied to the 1998 English Wards to identify those that were rural. By this means, the
proportion of the population of England that is captured as rural is similar (28%) at the two
geographical levels. The classification, sometimes known as the 'Oxford-CA' was then
amended slightly by the Countryside Agency following consultation with interested parties.
8. The definition was calculated by applying a logistic regression model to a range of socioeconomic variables in order to: firstly, identify which variables were associated with the
Countryside Agency's district level definition; and secondly, to use those with a significant
association to predict which wards were rural. The variables used in the model are set out
below.
Variables used at the ward level
9. The following data were used in the ward level classification.
• Population Density: ratio of ward level population size (from IMD 2000) to ward area in
hectares
• Ratio of economically active population to the economically inactive population: ratio of
ward level population aged 16 to 59 to the sum of the population aged 15 and below
and aged 60 and over. All population estimates from IMD 2000.
• Percentage of people who use public transport: ward level numbers of people who use
trains or buses to travel to work. The denominator is the ward-level number of
economically active people aged 16 and over. Both variables from the 1991 Census.
• Percentage of people in agriculture/forestry/fishing: ward level numbers of people in
agriculture, forestry and fishing. The denominator is the ward level number of
economically active people aged 16 and over. Both variables from the 1991 Census.
• Percentage of people in primary production (mining/energy /water): ward level numbers
of people in mining, energy and water. The denominator is the ward level number of
economically active people aged 16 and over. Both variables from the 1991 Census.
• Percentage of people who are ethnically non-white: ward level numbers of people who
describe their ethnic group as a category other than white. The denominator is the ward
level population. Both variables from the 1991 census.
Evolution of the local authority classification
10. As described above (under Historical Development), this classification was built from a
combination of three previous systems. Broadly speaking, inclusion in two of these lists
qualifies an area as rural. The Countryside Agency made further changes to take account
of local government re-organisation up to 1998. The recommended definition for the
classification of local authorities was used by the Countryside Agency for the State of the
Countryside Reports and is sometimes known as SOCCODE (no connection to Standard
Occupational Classification).
Aggregating wards to counties
11. This classification assigns an urban or rural status to each of the 1998 counties,
according to the proportion of urban and rural wards within the area, as determined by the
ward level classification. Counties in which the majority of wards are rural are themselves
classified as rural.
The end products
12. Under the ward level classification, 4,076 of the 8,414 wards in England are defined as
rural (48%). A population of approximately 13.9 million people live in these rural wards,
which is over one-quarter (28%) of the total population in England (1998 based population
estimates). The spread of Rural Wards in England is illustrated in Map B1. A list of rural
and urban wards is included in the web version of the guide.
13. The local authority level definition identifies 145 Rural Local and Unitary Authorities. As
with the ward level classification, 28% of the population live in the rural local authorities.
These are listed in Annex B, Table B1. Their distribution across the country is illustrated in
Map B2.
14. The County level classification produces 28 rural counties and 13 urban counties. The
rural counties contain 41% of the total county population and 78 % of the total county land
area. This division does not include the Unitary Authorities, which are covered in the local
authority (district) level classification.
Summary of statistics for administrative area classifications
15. The following table provides some summary information comparing the population and
land area covered by the classifications of administrative areas of England at different
geographical levels.
England
Administrative
Area
Classification
Wards
1998
population
(millions)
% of total
population
Land area
(hectares,
millions)
% of total
land area
Total land
49.5
100.0
13.0
100.0
Rural Areas
13.9
28.1
11.3
86.8
Urban Areas 35.6
71.9
1.7
13.2
49.5
100.0
13.0
100.0
13.9
28.2
10.0
76.9
Urban Areas 35.6
71.8
3.0
23.1
Local Authority Total land
Districts/Unitar
y Authorities
Rural Areas
Counties
Total land
41.2
100.0
12.1
100.0
Rural Areas
16.9
41.0
9.5
77.9
Urban Areas 24.3
59.0
2.7
22.1
Using the rural classification definition
16. The recommended classification of Local Authorities offers the most broadly inclusive
definition of rurality. The ability of this classification to separate 'urban' from 'rural' areas
has been improved by the designation of some of the urban Unitary Authorities but there
are, inevitably, a range of Local Authorities that are difficult to classify particularly where
there are single urban centres surrounded by predominantly rural hinterlands.
17. The Ward level variant of the Countryside Agency classification, modelled on the Local
Authority level division of rural and urban areas, reduces these difficulties, but care is
needed when applying this classification at detailed local scales in predominantly rural
areas.
Ward level
18. The two main scales of delineation - whole wards and whole local authorities - differ in
the proportion of the total land area that is classified as rural (at ward level 86.8%,
compared to 76.9% for local authorities). This is because, at the ward scale, it is easier to
separate urban centres from their surrounding rural areas. Thus, in the case of Carlisle, the
urban centre stands out as non-rural in a setting of almost completely rural surrounding
wards. This is not achieved with the local authority classification (see below).
19. The national pattern of rural and urban wards produced by the classification clearly
identifies the main conurbations and cities as clusters of urban wards. The classification is,
however, more problematic when applied to more generally rural areas at a local scale.
Map 3.5 shows the Countryside Agency's classification of rural wards with urban 23
settlements superimposed upon them for a part of the Eastern Region centred roughly on
Cambridge. Also shown are tracts of urban land (see Section 3, part 1).
20. Many areas of urban land shown on Map 3.5 are in fact small settlements that do not
meet the population size threshold required for recognition as an urban settlement. A
number of cases can be seen where small settlements 'weight' the profile of the ward into
the non-rural category, whereas some of the larger named centres are contained within
rural wards.
Local authority district level
21. As Map B1 indicates, this definition of rural areas excludes the main conurbation areas
and many district and unitary local authorities that are closely defined around urban areas.
Thus Exeter, Torbay and Plymouth stand out as tightly defined urban authorities in the
predominantly rural South West. Cambridge, Norwich, Ipswich and Great Yarmouth are
similarly defined as urban in predominantly rural East Anglia.
22. The scale of delineation of this definition - i.e. whole local authorities - creates
anomalies when classifying authorities characterised by a significant amount of open
countryside and one or more relatively large service centre. An example is Carlisle. Carlisle
District is not 'rural' under this definition despite containing a single large centre set in an
extensive rural hinterland. The urban area of Carlisle accounts for approximately three
quarters of the District's 103,000 residents but the population density of the District as a
whole, at 99 persons per sq km, is about the same as that of Mid Suffolk.
23. In contrast, the largest urban settlement in Mid Suffolk (Stowmarket), contributes only
just over 13,000 residents to a district total of 81,000. Thus, although the rural part of Mid
Suffolk has a higher settlement density than the rural part of Carlisle, the size of the urban
centre places Carlisle District as non-rural while Mid Suffolk is firmly in the rural category.
County level
24. At the higher geographical level it becomes very difficult to produce a classification that
gives a meaningful representation of the urban/rural nature of the areas, many of which
contain a considerable rural expanse whilst also including substantial components of a
clearly urban nature. This classification is inevitably crude and is only included in the
recommended list of definitions for use where there is no alternative to describing areas at
this level in terms of an urban/rural split.
A cautionary note
25. One definition that has received recent attention is that created by Tarling et al (1993)
for the Rural Development Commission. This was used in the Performance and Innovation
Unit Report on Rural Economies (1999) and in the Cabinet Office Report 'Sharing the
Nation's Prosperity' (2000). This classified all English Local Authority districts into five
classes: remote rural, accessible rural, coalfield areas, urban districts and metropolitan
districts. The Tarling definition is not recommended. It is mentioned here to prevent
confusion with the recommended definition, with which it shares some characteristics.
Endnote
10 Applied to its full logical extent within the 'rural domain' the 'urban land use' approach to
definition would be used to identify settlements below 1000 population up to and including
isolated dwellings. This is essentially the approach taken in the Housing Corporation/Rural
Development Commission Rural Settlements Gazetteer, 1998. See also the approach to
rural settlement/rural area definition in Scotland: Scottish Settlements, Urban and Rural
Areas in Scotland, GROS 2001 20
Part 3: A visual comparison of the two main definitions
As described earlier the two main definitions, with their different bases, do not match.
When put together, the areas of land identified as urban in the land use/urban settlements
definition and the areas identified as rural in the administrative area classification definition
do not cover the total land area, and in some places they overlap. This is illustrated in Map
3.3, which shows Urban Settlements (10,000+) overlaid on the 1998 Local Authorities
classified as rural and urban. Map 3.4 shows how the urban wards are a better reflection of
the Urban Settlement boundaries than the urban local authorities.
A more detailed illustration is given in Map 3.5 which shows the classification of rural wards
with urban settlements superimposed for a part of the Eastern Region around Cambridge.
Also shown are tracts of urban land that do not qualify as Urban Settlements.
The recommended means of dividing the country into urban and rural areas is the
Urban Settlement definition with a 10,000+ population cut-off. Use of an area
classification definition to produce a general urban/rural distinction (rather than as a
means of looking at specific rural issues) is only suggested where the distinction
must be made for administrative areas.
Annex A: Statistics and maps for 1991 Urban Settlements
Table A1; Urban/Rural land area summary for Settlements of 1,000+
Country
total for urban Settlements with
population 1000+
Corresponding Rural areas
land area Percent of total (see
(hectares, Endnote 11)
thousands)
land area Percent of total
(hectares,
thousands)
England
1,087
8.3
11,957
91.7
Wales
62
3.0
2,014
97.0
England & Wales
1,149
7.6
13,971
92.4
Urban/Rural land area summary for Settlements of 10,000+
Country
Urban Settlements with
population 10,000+
Corresponding Rural areas
land area Percent of total (see
(hectares, Endnote 12)
thousands)
land area Percent of total
(hectares,
thousands)
England
939
7.2
12,104
92.8
Wales
47
2.3
2,030
97.7
England & Wales
986
6.5
14,134
93.5
Table A2 Urban/Rural population summary for Settlements of 1,000+
Country
Total for urban Settlements with
population 1000+
Corresponding Rural areas
1991
Percent of total
population
(thousands)
1991
Percent of total
populations
(thousands)
England
42,443
90.2
4,611
9.8
Wales
2,300
81.1
534
18.9
England & Wales
44,744
89.7
5,146
10.3
Urban/Rural population summary for Settlements of 10,000+
Country
Total for urban settlements for
population 10,000+
Corresponding Rural areas
1991 population
(thousands)
Percent of
total
1991 populations Percent of total
(thousands)
England
37,807
80.3
9,247
19.7
Wales
1,776
62.6
1,059
37.4
England &
Wales
39,583
79.3
10,306
20.7
Table A3 Summary for Urban Settlements (1,000+) by size of population:
England and Wales
Population
Number of
Range (1991settlements
resident
persons)
1991
population
(thousands)
Percent of
total urban
poulation
Land area
(hectares,
thousands)
Percentage of
total urban
land area
covered
750,000+
6
15,359
34.4
350
30.5
250, 000 749,999
19
7,020
15.7
174
15.2
100,000 249,999
37
5,470
12.2
142
12.4
50,000 99,999
61
4,336
9.7
114
9.9
25,999 49,000
100
3,439
7.7
94
8.2
10,000 24,999
254
3,923
8.8
111
9.7
3,000 - 9,999 684
3,685
8.2
111
9.7
1,000 - 2,999 698
1,476
3.3
52
4.5
Total
44,744
100.0
1,150
100
1,859
Table A4: Urban Settlements (1991) with population over 10,000: England and Wales
Endnotes
11. In each case the total comprises that for England, Wales, and England and Wales as a
whole.
12. In each case the total comprises that for England, Wales, and England and Wales as a
whole.
Annex B: The classification of 1998 administrative areas
Table B1: classification of 1998 administrative areas: the rural LAs
Region
Local Authority District
North East
Darlington UA
Hartlepool UA
Middlesbrough UA
Redcar & Cleveland UA
Stockton-on-Tees UA
Chester-le-Street
Derwentside
Durham
Easington
Sedgefield
Teesdale
Wear Valley
Alnwick
Berwick-upon-Tweed
Blyth Valley
Castle Morpeth
Tynedale
Wansbeck
Gateshead
Newcastle-upon-Tyne
North Tyneside
South Tyneside
Sunderland
Blackburn with Darwen UA
Blackpool UA
Halton UA
Warrington UA
Chester
Congleton
Crewe and Nantwich
Ellesmere Port and Neston
Macclesfield
Vale Royal
Allerdale
Barrow-in-Furness
Carlisle
Copeland
Eden
South Lakeland
Bolton
Bury
Manchester
Oldham
Rochdale
Salford
Stockport
North West
Rural areas
Rural
Rural
Rural
Rural
Rural
Rural
Rural
Rural
Rural
Rural
Rural
Rural
Rural
Rural
Rural
Yorksire & Humberside
East Midlands
Tameside
Trafford
Wigan
Burnley
Chorley
Fylde
Hyndburn
Lancaster
Pendle
Preston
Ribble Valley
Rossendale
South Ribble
West Lancashire
Wyre
Knowsley
Liverpool
St Helens
Sefton
Wirral
East Riding of Yorkshire UA
City of Kingston upon Hull UA
North East Lincolnshire UA
North Lincolnshire UA
York UA
Craven
Hambleton
Harrogate
Richmondshire
Ryedale
Scarborough
Selby
Barnsley
Doncaster
Rotherham
Sheffield
Bradford
Calderdale
Kirklees
Leeds
Wakefield
Derby UA
Leicester UA
Nottingham UA
Rutland UA
Amber Valley
Bolsover
Chesterfield
Derbyshire Dales
Erewash
High Peak
North East Derbyshire
South Derbyshire
Blaby
Charnwood
Harborough
Hinckley and Bosworth
Melton
North West Leicestershire
Rural
Rural
Rural
Rural
Rural
Rural
Rural
Rural
Rural
Rural
Rural
Rural
Rural
Rural
Rural
Rural
Rural
Rural
Rural
Rural
Rural
West Midlands
East
Oadby and Wigston
Boston
East Lindsey
Lincoln
North Kesteven
South Holland
South Kesteven
West Lindsey
Corby
Daventry
East Northamptonshire
Kettering
Northampton
South Northamptonshire
Wellingborough
Ashfield
Bassetlaw
Broxtowe
Gedling
Mansfield
Newark and Sherwood
Rushcliffe
County of Herefordshire UA
Stoke-on-Trent UA
Telford and Wrekin UA
Bridgnorth
North Shropshire
Oswestry
Shrewsbury and Atcham
South Shropshire
Cannock Chase
East Staffordshire
Lichfield
Newcastle-under-Lyme
South Staffordshire
Stafford
Staffordshire Moorlands
Tamworth
North Warwickshire
Nuneaton and Bedworth
Rugby
Stratford-on-Avon
Warwick
Birmingham
Coventry
Dudley
Sandwell
Solihull
Walsall
Wolverhampton
Bromsgrove
Malvern Hills
Redditch
Worcester
Wychavon
Wyre Forest
Luton UA
Peterborough UA
Southend-on-Sea UA
Rural
Rural
Rural
Rural
Rural
Rural
Rural
Rural
Rural
Rural
Rural
Rural
Rural
Rural
Rural
Rural
Rural
Rural
Rural
Rural
Rural
Rural
Rural
Rural
Rural
London
Thurrock UA
Bedford
Mid Bedfordshire
South Bedfordshire
Cambridge
East Cambridgeshire
Fenland
Huntingdonshire
South Cambridgeshire
Basildon
Braintree
Brentwood
Castle Point
Chelmsford
Colchester
Epping Forest
Harlow
Maldon
Rochford
Tendring
Uttlesford
Broxbourne
Dacorum
East Hertfordshire
Hertsmere
North Hertfordshire
St Albans
Stevenage
Three Rivers
Watford
Welwyn Hatfield
Breckland
Broadland
Great Yarmouth
Kings Lynn and West Norfolk
North Norfolk
Norwich
South Norfolk
Babergh
Forest Heath
Ipswich
Mid Suffolk
St Edmundsbury
Suffolk Coastal
Waveney
Camden
City of London
Hammersmith and Fulham
Kensington and Chelsea
Wandsworth
Westminster
Hackney
Haringey
Islington
Lambeth
Lewisham
Newham
Southwark
Tower Hamlets
Rural
Rural
Rural
Rural
Rural
Rural
Rural
Rural
Rural
Rural
Rural
Rural
Rural
Rural
Rural
Rural
Rural
Rural
Rural
Rural
Rural
Rural
South East
Barking and Dagenham
Bexley
Enfield
Greenwich
Havering
Redbridge
Waltham Forest
Bromley
Croydon
Kingston upon Thames
Merton
Sutton
Barnet
Brent
Ealing
Harrow
Hillingdon
Hounslow
Richmond-upon-Thames
Bracknell Forest UA
Brighton and Hove UA
Isle of Wight UA
Medway UA
Milton Keynes UA
Portsmouth UA
Reading UA
Slough UA
Southampton UA
West Berkshire UA (Newbury)
Windsor and Maidenhead UA
Wokingham UA
Aylesbury Vale
Chiltern
South Buckinghamshire
Wycombe
Eastbourne
Hastings
Lewes
Rother
Wealden
Basingstoke and Deane
East Hampshire
Eastleigh
Fareham
Gosport
Hart
Havant
New Forest
Rushmoor
Test Valley
Winchester
Ashford
Canterbury
Dartford
Dover
Gravesham
Maidstone
Sevenoaks
Shepway
Rural
Rural
Rural
Rural
Rural
Rural
Rural
Rural
Rural
Rural
Rural
Rural
Rural
Rural
Rural
Rural
Rural
Rural
South West
Swale
Thanet
Tonbridge and Malling
Tunbridge Wells
Cherwell
Oxford
South Oxfordshire
Vale of White Horse
West Oxfordshire
Elmbridge
Epsom and Ewell
Guildford
Mole Valley
Reigate and Banstead
Runnymede
Spelthorne
Surrey Heath
Tandridge
Waverley
Woking
Adur
Arun
Chichester
Crawley
Horsham
Mid Sussex
Worthing
Bath and North East Somerset UA
Bournemouth UA
City of Bristol UA
North Somerset UA
Plymouth UA
Poole UA
South Gloucestershire UA
Swindon UA
Torbay UA
Caradon
Carrick
Kerrier
North Cornwall
Penwith
Restormel
Isles of Scilly
East Devon
Exeter
Mid Devon
North Devon
South Hams
Teignbridge
Torridge
West Devon
Christchurch
East Dorset
North Dorset
Purbeck
West Dorset
Weymouth and Portland
Cheltenham
Cotswold
Rural
Rural
Rural
Rural
Rural
Rural
Rural
Rural
Rural
Rural
Rural
Rural
Rural
Rural
Rural
Rural
Rural
Rural
Rural
Rural
Rural
Rural
Rural
Rural
Rural
Rural
Rural
Rural
Rural
Rural
Rural
Rural
Forest of Dean
Gloucester
Stroud
Tewkesbury
Mendip
Sedgemoor
South Somerset
Taunton Deane
West Somerset
Kennet
North Wiltshire
Salisbury
West Wiltshire
Rural
Rural
Rural
Rural
Rural
Rural
Rural
Rural
Rural
Rural
Rural
Rural
Table B2: A classification of Urban and Rural Counties (1998)
This classification is based on the proportion of wards within the county that are identified
as rural by the Countryside Agency ward level classification. If more than 50% of the wards
are rural then the County is classified as rural, otherwise it is classified as urban. This
definition is only recommended where it is essential to consider urban and rural areas at
the County level. In general, the practice of assigning urban or rural labels at this level of
geography is not recommended.
Rural Counties
% of wards in
County that are
rural
Buckinghamshire
51
Lancashire
56
Leicestershire
57
Staffordshire
57
Derbyshire
58
West Sussex
59
Bedfordshire
60
Northumberland
62
Hampshire
63
Warwickshire
63
Northamptonshire
64
East Sussex
67
Oxfordshire
69
Cheshire County
72
Cumbria
73
Worcestershire
74
Wiltshire
80
Cambridgeshire
81
Gloucestershire
82
Suffolk
82
Norfolk
82
Devon
88
North Yorkshire
89
Dorset
90
Lincolnshire
91
Somerset
91
Shropshire
93
Cornwall and Isles of Scilly
99
Urban Counties
% of wards in County that are rural
Tyne and Wear
0
London
0
West Midlands
1
Greater Manchester
1
Merseyside
4
South Yorkshire
7
West Yorkshire
8
Hertfordshire
19
Surrey
28
Durham County
41
Nottinghamshire
45
Essex
45
Kent
48
Annex C: The Supplementary Rural Definitions
1. Introduction
1.1 The supplementary definitions described in this annex are not recommended for
general use but have been included because they have been used for specific applications
or have attracted some attention as possible methods of identifying rural areas. These are:
a. Two classifications of administrative areas produced by the Office for National Statistics
(see endnote 13). These use 1991 census data to classify 1991 Wards and 1998 Local
Authorities in to families of areas in which the residents share certain sociodemographic
features.
b. A definition adopted by the (then DTLR) Local Government Finance group for measuring
the sparsity of population within Local Authority areas and incorporated within SSA
calculations. Two variants of this approach are described. The first captures approximately
the same population as the recommended rural definition and is referred to here as 'Broad
Definition'. The second captures approximately the same population as the ONS
classification and is referred to as the 'Narrow' Definition.
c. A definition comprising the selection of parishes used by the Countryside Agency for
administering the Rural Services Survey and some other aspects of policy analysis.
2. Summary Statistics
2.1 The basic comparative statistics of the proportions of the national (England) area and
populations covered by each of the selected definitions are shown in the following table.
The definitions are presented according to their geographic level of delineation.
Table A3.1: The Recommended and Supplementary Rural Definitions:
Comparative Areas and Populations
England
Rural
land area
(%)
Rural population
(%)
76.9
28.2
Local Authority Level
Countryside
Agency
Local Government
Finance (Broad
Definition)
78.7
28.0
ONS'98
38.8
9.7
Local Government
Finance (Narrow
Definition)
45.1
9.8
Countryside
Agency (1998
Base)
86.8
28.1
ONS Wards (1991 base)
47.6
11.2
Approx 85
Approx 15
Ward Level
Parishes
Countryside
Agency Rural
Services Survey
3. The ONS Area Classifications
3.1 The ONS classifications of administrative and health authority areas are fundamentally
different in approach from that taken by the Countryside Agency in that they are produced
as part of a broader exercise to characterize all areas of the country into a range of families
or groups using socio-demographic variables from the 1991 Census of Population.
3.2 The classifications were not designed to define urban or rural areas. Some users have,
however, used them as such. This is more a result of the way the families and groups have
been named (providing a likely choice for someone in search of a definition), than an
indication that the classifications are seen as suitable means of defining urban and rural
areas.
3.3 The families or groups cover a much broader range of types than simply 'urban' or
'rural' and are derived empirically from the evidence of patterns of association ('similarity')
amongst the selected socio-demographic indicators.
District Clusters
3.2 This form of classification was first carried out for local authorities and health authorities
using data from the 1991 Census (see endnote 14). A subsequent classification of
authorities followed which took account of 1998 'post re-organisation' administrative
boundaries (see endnote 15). In this classification there are seven 'families', one of which
is designated as:Rural (I) alongside Urban Fringe (II), Coast and Services (III), Prosperous
England (IV), Mining Manufacturing and Industry (V), Education Centres and Outer London
(VI), and Inner London (VII). The Rural family is then broken down into two 'groups' Rural
Amenity (A) and Remoter Rural (B).
3.3 The ONS district level of 'rural and 'non-rural' areas is shown in Map C1. The range of
alternative types within the classification greatly reduces the land area and population
included in the 'Rural' classification in comparison with the Countryside Agency's simpler
and broader definition. In England only 9.7% of the population is included, which is about
one third of that included by the Countryside Agency selection of authorities. This level of
rural population is repeated exactly in Wales.
3.4 Within the ONS family structure there are two particular groups that subsume areas
that might otherwise be considered to be 'open countryside' (Map C2) One is the so-called,
'Coastal and Service' family. This is strongly represented in Wales, the South West and
parts of the South East, including many local authorities that have quite extensive rural
components. However, this family contains within it significant variations in the character of
its constituent authorities. Thus, although many members of this family have rural
tendencies, others do not. Thus it is difficult to see such members as Leeds, Darlington
Bristol and Cardiff, as a supplement to the more directly identified 'Rural' family.
3.5 The other family accounting for significant areas of what the Countryside Agency's
definition would classify as rural is the 'Prosperous England' family. Concentrated largely in
south and central England, this grouping includes the ring of commuter areas immediately
beyond the Greater London boundary, growing towns in the South East and substantial
swathes of areas in East Anglia and the Midlands.
3.6 'Prosperous England' reflects accurately the fact that these are parts of the country that
have been under the most intense development pressure for the last twenty or thirty years
as jobs and residents have dispersed into the towns and villages of the 'core' area of south
and central England. Again, however, this family does not form a credible extension to the
relatively small Rural family. 'Prosperous England' includes many of the quite densely
developed authorities on the fringes of London, in addition to many of the urban unitary
authorities in the South East, East and Midlands. It is a genuinely mixed group of
commuter areas, free-standing towns and areas of open countryside.
Ward Clusters
3.7 The ONS clustering approach has a ward-level variant that complements the local
authority classification discussed above. The ward boundaries used are for 1991, matching
those used in the 1991 Census of Population. Wards whose data are suppressed to
maintain anonymity within the 1991 Local Base Statistics are not included in the
classification.
3.8 Although the broad approach and data used at the ward scale are similar to those used
in the reclassification of the 1998 Local Authorities, the range of area types differs in detail.
For the earlier exercise two rural 'groups' were identified: Rural Areas and Rural Fringe.
These are combined together in Map C3. The range of 'competitor' groups is also different
but there is a 'Prosperous Areas ' group and a 'Middling Britain' group that contain some of
the areas classified as 'Prosperous' in the 1998 LA level re-classification. However, there is
no group that is directly comparable to the Coast and Service family found in the 1998 LA
version.
3.9 The outcome of the ward-based approach is a classification that includes a slightly
larger population and area in comparison with the local authority scale. About 11.2% of
England's population is captured as 'rural' at the ward level compared with only 9.7% for
1998 local authorities.
3.10 Despite these detailed differences in classificatory structure, the broad regional
pattern of rural wards has quite strong similarities with the local authority scale. The
strongest concentrations of rural wards are still in Devon, Dorset, Norfolk, Lincolnshire,
N.Yorkshire and the Welsh Borders. There are still relatively few rural wards in the South
East, particularly in those areas relatively close to Greater London.
Summary
3.11 The key characteristic of both ONS classifications is that their purpose is not to act as
a definition of rurality that is based on any prior concept of what rurality represents. Rural
clusters are only produced because their members share similar profiles on the selected
range of social, economic, demographic and housing variables and that, taken together
(and when represented on a map), these members 'appear' to an informed observer to be
'rural'.
3.12 There are, however, many variables over which similarity may be measured and it is
clear, particularly in the 1998 analyses, that the presence of relatively large numbers of
well educated and relatively affluent residents serve to link many potentially 'rural' areas
with neighbouring urban areas in the key growth zones of the country.
3.13 In essence, in the ONS classifications, 'growth' has dominated 'rurality' which, in itself,
may be an interesting reflection of what is happening to the English countryside. By
subtracting growth areas that may be 'rural', this classification produces a restricted
definition of what is rural i.e. it is 'weighted' towards the relatively poor rural authorities and
wards.
4. Local Government Finance 'Sparsity' Measures
4.1 As the name implies this approach to identifying rural areas is a byproduct of the
formulae used to determine central government support to local authorities. However,
although specialist in nature, they represent - via the notion of low levels of habitation
relative to land area - one widely accepted approach to defining rurality.
4.2 A key component of these formulae is a measure of sparsity based on aggregating
Enumeration District (ED) resident populations, classified by their sparsity and grouped into
local authority units. There are two definitions: between 4 and 0.5 persons per hectare EDs
are classified as 'sparse', whilst those with less than 0.5 pph are classified as 'supersparse'. The score for a local authority is the sum of its population in sparse EDs plus twice
the sum of its population in super-sparse EDs.
4.3 In itself, however, this numerical approach does not classify authorities into 'rural' or
'non-rural'. Rather, it produces a ranking of EDs according to their relative 'sparseness'. To
illustrate two variants based on this approach a 'broad' and a 'narrow' definition have been
defined. The 'broad' definition selects the top 150 authorities that include approximately the
same population as the Countryside Agency local authority definition. The 'narrow'
definition captures a population similar to the ONS classification of 1998 local authorities.
Interestingly, this requires only the top 62 sparsely populated local authorities to 'capture'
the equivalent level of population.
4.4 The two classifications are illustrated in Map C4 and Map C5. Both maps show that the
strong underlying link between both the Countryside Agency and ONS classifications and
relative sparsity. In comparison with the Countryside Agency definition, there are a number
of marginal changes. Thus in the case of Carlisle discussed earlier there 63 is a shift from
non-rural to rural using the sparsity approach. Overall, however, the same broad pattern of
authorities emerges from both classifications.
4.5 The 'narrow' sparsity definition is also quite similar to the ONS family of Rural Areas.
The main differences arise in parts of the East Midlands and the East where some
relatively sparse areas in Cambridgeshire, Suffolk, Leicestershire and Northamptonshire
are included in the ONS Prosperous Areas family.
Summary
4.6 Measures of 'sparsity' can clearly serve as effective discriminators between rural and
non-rural authorities and can go a long way towards reproducing the classifications
determined by methods based on socio-demographic measures. The main problem is that
no established classification of rurality makes use of this measure. A wide range of
classifications of areas could be produced using different types of sparsity measure and
different sparsity threshold values. It would, however, be difficult to judge which was the
most appropriate for any particular purpose.
5. Countryside Agency Rural Services Survey Parishes
5.1 An Urban Settlement population of 10,000 has been used in the past by the Rural
Development Commission and by the Countryside Agency as a broad threshold value
distinguishing urban settlements from smaller 'rural' settlements and the remaining rural
land. For the Rural Services Survey 2000 (RSS2000)16, the same population cutoff point
was applied to parishes but the population within the parish boundary was taken, with no
use being made of Urban Settlement boundaries or their population counts.
5.2 Map C6 shows the parishes selected for participation in the survey - areas shown as
blank on the map do not have parishes. Selected parishes are those whose resident
population in 1991 did not exceed 10,000. In addition, the Countryside Agency consulted
widely with County authorities and Rural Community Councils to identify parishes which
were felt not to meet the spirit of being truly 'rural'. A very small number of parishes with
populations slightly over the 10,000 threshold were re-introduced following this
consultation.
5.3 The 1997 base of selected parishes was re-used in RSS2000 incorporating all those
parishes surveyed in 1997 that can be traced through to the current set of boundary
definitions. In a small number
5.4 The RSS2000 parishes constitute a further definition of rurality focused on an important
level of administration and policy in rural areas. It is a broad definition of rural covering
approximately 85 percent of the land area of England (about the same as the Countryside
Agency Ward Level Classification) and containing about 15 percent of the resident
population. It is instructive to compare this with the Countryside Agency ward classification
population level of 28 percent which arises from the specific exclusion of the more
populous parishes which removes many small towns in predominantly rural areas from the
survey.
5.5 The main operational problem with parish-based classifications is that there is little
contemporary data collected for these units outside the Rural Services Surveys and the
system of agricultural returns. Much of the contextual social and economic data thus dates
back to the 1991 Census.
Endnote
13 Office for National Statistics, The ONS Classification of Local and Health Authoroties of
Great Britain: revised for authorities in 1999, GSS 1999.
14 Wallace M and C Denham, The ONS Classification of Local and Health Authorities of
Great Britain, HMSO 1996
15 Bailey, S, J Charlton, G Dollamore and J Fitzpatrick, The ONS Classification of Local
and Health Authorities of Great Britain, H<SO 1999.
16 The Countryside Agency asks Parish Clerks to provide a wide range of information for
its surveys of rural service provision undertaken every three years. Not all parishes are
included in the Survey and not all areas of the country have parishes defined for
administrative purposes. 64 of cases parishes will show as 'non-selected' in places where
boundaries have been disrupted by recent revisions.
Annex D: Contacts
Office for National Statistics
General enquiries: [email protected]
Information on the work of ONS Geography and geography of the UK:
http://www.statistics.gov.uk/geography/default.asp
Information on the availability of census data: [email protected]
Office of the Deputy Prime Minister
Simon Connell
Office of the Deputy Prime Minister
3/K10 Eland House
Bressenden Place
London SW1E 5DU
Tel: 0207 944 5505
[email protected]
Department of the Environment, Food and Rural Affairs
Chris Gibbins
Rural Statistics Unit
Room 146, Foss House
King's Pool 1-2 Peasholme Green
York YO1 7PX
Tel: 01904 455 414
[email protected]
Countryside Agency
Justin Martin
Research, Data and Information Branch
Countryside Agency
Cheltenham GL50 3RA
Tel: 01242 533 268
[email protected]
Scotland
General Registrars Office for Scotland
For settlement statistics, boundaries and other boundary products see: http://www.groscotland.gov.uk/grosweb/grosweb.nsf/pages/scosett
Scottish Executive, Survey Manager
For the Scottish Household Survey, which provides an urban rural division by combining
settlements with data on remoteness from urban centres, see:
http://www.scotland.gov.uk/stats/bulletins/00115/00115-00.asp and a more detailed bulletin
at http://www.scotland.gov.uk/shs/docs/shsb-00.asp
For more information on the Scottish Household Survey, contact the survey manager at the
Scottish Executive: http://www.scotland.gov.uk/shs/
Wales
Stuart Neil
Agriculture and Rural Affairs Statistician
Welsh Assembly Government
Tel: 029 2082 6822
[email protected]
Northern Ireland
Chris Morris
Statistics and Research Branch
Department for Social Development
Block 3, The Village
Castle Buildings
Stormont
BELFAST, BT4 3UD
Tel: 028 905 2280
[email protected]
Appendix: maps from Annexes A to C