1
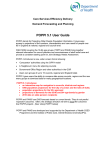
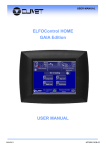
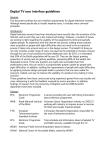
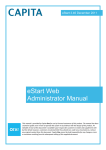
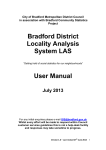
County Durham
Area Action Partnership
2011 Profiles
InstantAtlas User Guide
Introduction
The Area Action Partnerships were formed to tackle the various issues affecting the people living
in the AAPs and to work to improve their quality of life. Each year the AAPs set various priorities
in each of their areas; these can be viewed on the main AAP web pages on the Durham County
Council website at www.durham.gov.uk/aap.
The information within this profile is intended to provide the background against which these
priorities are set and can be used to inform the process for setting the priorities for 2012/13.
Data Construction Method
The figures quoted in this profile for the AAPs and sub communities have been constructed from
lower geographical areas through a process of aggregation. In the case of the community data,
lower super output areas (LSOAs) were used whereas the AAPs were constructed using census
wards for greater accuracy (unless otherwise stated). In some cases LSOA figures are rounded to
the nearest 5. Therefore the sum of the community data will not necessarily match the AAP
figures. The various indicators have then been grouped into 7 themes including the Councils’ 5
‘Altogether’ priority themes.
Other variances in totals are due to rounding errors and differences in aggregations of sub
categories within the dataset, for example age groups. Differences in household/dwelling counts
are due to using different databases both locally and nationally.
Altogether Better Durham – Priority Themes
The council has developed a new vision to reflect the views and aspirations of the community and
opportunities for improvement. This is focused around an Altogether Better Durham. This vision
is comprised of two components, being to have an Altogether Better Place which is Altogether
Better for People.
This vision helps to provide a framework which guides all of our detailed plans and programmes
which will turn our vision into a reality. This is achieved through organising our improvement
actions into a structure comprised of five priority themes:
Altogether Wealthier: Focusing on creating a vibrant economy and putting regeneration
and economic development at the heart of all our plans.
Altogether Healthier: Improving health and wellbeing.
Altogether Safer: Creating a safer and more cohesive county.
Altogether Better for Children & Young People: Enabling children and young people to
develop and achieve their aspirations and to maximise their potential in line with Every
Child Matters.
Altogether Greener: Ensuring an attractive and 'liveable' local environment, and
contributing to tackling global environment challenges.
To enhance this annual document and make it easier to access the data used within it an
interactive report has been created using InstantAtlas™ software. This document describes this
interactive report and explains how to access and use the data in it.
InstantAtlas™ AAP Profile Report
InstantAtlas is an interactive web-based tool that combines statistical and geographical information
into a portable report which allows users to explore spatial, statistical or indicator-based data using
linked tables, charts and maps and provides presentation quality reports and profiles.
To view one of these stand-alone, dynamic reports you need an internet browser compatible with
the Adobe Flash Player (for example, Internet Explorer, Firefox or Opera).
You will also need to ensure that ActiveX controls are enabled as well as enabling scripting within
your browser. This setting can usually be accessed through the Tool Menu > Internet Options >
Security > Custom Level button in Internet Explorer. This location may vary in different browsers.
The latest version of the Adobe Flash Player plug-in is available from the Adobe website.
The AAP Profile interactive report for County Durham can be accessed via the Durham County
Council website and takes the following form:
Figure 1: AAP interactive report
The report contains a wide range of indicators used in the AAP profile, along with comparison data
for the county, region and England & Wales where available. Where available, data for multiple
time periods have been included for some indicators.
To further enhance the report indicators can be displayed at two geographical levels:
•
Area Action Partnerships (AAPs) – This is the top geographical level of the report and is
comprised of the 14 AAPs used in the main AAP profile documents.
•
AAP sub-Communities – To provide further detail within the AAPs a sub-Community
geography was developed by aggregating Lower Super Output Areas from the 2001
Census geography set (see above).
Note: Due to availability of data and disclosure issues not all indicators are available for all
geographical levels, or for all time periods.
Layout
The report is made up of different elements which are all linked so that any change to one is then
displayed in the other elements of the report:
Figure 1: AAP profile interactive report layout
1
2
3
4
5
7
6
1. Indicator Text
The text below the report title shows the theme and indicator that is currently being
displayed in the report; and the time period covered by the indicator where more than one
time period is available. The indicator and time period can be selected using the Data
button described below.
2. Buttons
Each report can be customised and extra functionality added by adding additional buttons
which allow the user to select options within the report. Some buttons only become
available when other options are selected:
•
Data Button
Selecting this button opens the ‘Data Browser’ window (below) which allows the
user to select the theme, indicator and time period to display in the report. The
number of indicators available in this window is determined by the geography
selected as not all indicators are available for all geographies (see above). Click
the ► at the left hand side to expand/collapse the theme/indicator to see more
options. Once selected the changes are made to the report automatically.
•
Metadata Button
Selecting this button opens a window that displays any associated supplement
information attached to the data indicator being displayed. This window appears in
the bottom left corner of the report covering the ‘Legend’ box. To display the
‘Legend’ box again select the ‘Metadata’ button once more.
•
Geography Button
This button allows the user to select the geography to be used in the report. There
are two geographies used in this report as detailed above:
This button changes the view in the report to the selected geography. Selecting the
AAP sub-Communities makes available the filter button described below.
•
Filter Button
For lower level geographies within the report it is possible to filter the results so that
a smaller area can be focused on. A filter by AAP has been added, when selected,
change the view of the report to that specific area.
Selecting the ‘Filter’ button opens the ‘Filter Box’ as shown below. Use the mouse
to select the area required.
To remove the filter either, select the ‘Remove Filter’ option in the filter box or
change the display geography using the ‘Geography’ button.
Selecting one of these areas will change the focus of the report to this area and if
the supporting AAP contextual layer (see ‘element 5’ – Legend box below), is
turned on the map will zoom into the area:
•
Download Data Button
This button opens a new window which displays an Excel spreadsheet of the
data/indicators used in this report which can then be saved for further analysis:
•
AAP Profile Button
This opens a new window to the current AAP profiles on the website:
•
About Button
Opens this document, in a new window, from within the interactive report.
•
Help Button
Opens a new window with basic InstantAtlas help:
3. Data Table
The data table displays the data for the currently selected indicator and the areas to which
it applies:
The data table has 6 columns:
1 2 3
4
5
6
•
Column 1 – Legend Colours: Small circles shaded in the colour of the class which
the data value of this area is within in the legend. This helps to get a better visual
impression of the data.
•
Column 2 - Notes Icons: Click these icons to link to additional geographical
information where available.
•
Column 3 - Magnifying Glass Icons: Click the magnifying glass icons to make the
map zoom to individual geographic features.
•
Column 4 – Geography name.
•
Column 5 – Indicator value used in report.
•
Column 6 – Supplemental indicator data for information only.
It is possible to make changes to the data table:
•
Adjust column width: Hold your mouse pointer over the divider between column
headers and lateral arrows will appear. Click and drag the divider to adjust column
width.
•
Change column order: Click a column header and drag it to change the location of
this column within the Data Table. E.g. if you want the notes icons to appear right of
the data columns you can simply drag the whole column with the notes icons to the
right border of the data table.
•
Sort Columns: Click a column header to sort the table ascending/descending. Note
that the Name column and the Indicator column of categoric indicators will sort
alphabetically while the Indicator column of numeric indicators will sort numerically.
Associate values (typically shown in columns to the right of indicator values) always
sort as if they were text unless the administrator has defined otherwise.
It is also possible to select one or more rows in the table. These selections are then
highlighted in both the map and histogram.
•
Click the name of a geographic feature to select the feature. A selected geographic
feature will be shaded light blue. Alternatively, hold 'Ctrl' to select multiple features
or 'Shift' to select a range of features. Holding the 'Ctrl' key and clicking on a
selected feature allows you to deselect it.
4. Map
The map provides a visual representation of the indicator values for the selected
geography along with background maps that provide location information.
The map is linked to other elements in the report so that any selection in the other
elements is automatically displayed in the map.
It is also possible to select one or more geographic areas in the map. These selections are
then highlighted in both the table and histogram.
•
Click the geographic feature with the mouse. A selected geographic feature will be
shaded light blue. Alternatively, hold 'Ctrl' to select multiple features or 'Shift' to
select a range of features. Holding the 'Ctrl' key and clicking on a selected feature
allows you to deselect it.
As with other elements, the map has additional functionality allowing users to alter and
amend the display of the map, including:
•
Zoom – in the top left corner of the map is a ‘zoom’ bar which allows users to zoom
in and out. The magnifying glass beneath this bar can be used to zoom out to the
full map after zooming in.
•
Menu – the ► opens a context menu with options to:
o
o
o
o
o
o
o
clear any selected areas
apply a filter to focus only on selected areas
clear any filters
print the current display
export the current display or any part of the display to an image file, e.g.
jpeg
reset the display back to the original setting, (refreshing the browser will also
reset the report)
add text or shapes to the map to annotate the map
Export Options
Text Editor
Print Preview
Shape Editor
The background map can be turned on/off using the checkbox in the Legend Box as can
supplemental boundaries. The colours and data intervals can also be changed in the
Legend Box, (full details for the Legend Box, element 7, are below).
5. Legend Box
The Legend Box displays the data intervals and colour scheme applied to the displayed
indicator along with the supplementary boundaries and background mapping option boxes.
These boundaries and maps can be turned on/off by checking/un-checking these boxes.
By holding your mouse pointer over a class in the legend, geographic features in the other
elements are highlighted that fall into that class. Or click a class to select the geographic
features that fall within that class.
Clicking on the ‘pencil’ icon in the top left hand corner opens the Legend Settings box which
allows changes to be made in the way the indicator data is displayed.
The options available in this box are:
•
Border colour: The colour of the border around each geographical feature on the
map.
•
Transparency: By sliding the bar the transparency of the shaded features in the map
can be altered.
•
Palette: You can change the colour palette used to shade geographic features in the
map by clicking on a new palette.
•
Reverse Palette: By checking this box you can reverse the colour palette used to
shade geographic features in the map.
•
No. Classes: You can increase or decrease the number of classes by clicking the
Increase or Decrease buttons (labelled with black arrows). The administrator may
have fixed the maximum number of classes.
•
Classifiers: Select a classifier from the drop-down. This will decide how the ranges
are calculated.
o
Equal Interval: The intervals between class breaks are equal. Class breaks
are calculated on-the-fly and will update if you change the number of classes.
Geographic features in the same class are given the same shade. The
administrator may have configured the report so that the class breaks are the
same across all indicators in the report. The advantage of the equal-interval
classification is that many map users will find it simple to understand.
However, a disadvantage is that only the minimum and maximum data values
are used when determining class breaks for the intervals (rather than the way
the data is spread).
o
Quantile: Each class in the legend contains an approximately equal number of
geographic features. Class breaks are calculated on-the-fly and will update if
you change the number of classes. Geographic features in the same class are
given the same shade. Two advantages of the quantile classification are that it
is appropriate for ordinal data (as data are rank-ordered) and that it can help
make map comparisons (assuming that the same number of classifications is
used for all maps). A disadvantage of the quantile classification is that it does
not consider how the data are distributed. If the data distribution is highly
skewed, data observations will be forced into the same class (either the lowest
or highest) where this may not be appropriate. As a result, the quantile
classification may give a false impression that there is a relatively normal data
distribution.
o
Natural Breaks: This classification method is also known as Optimal Breaks
and Jenks’ Method. Class breaks are calculated on-the-fly and will update if
you change the number of classes. Data are assigned to classes based upon
their position along the data distribution relative to all other data values. An
iterative algorithm is used to assign values to classes such that the variances
within all classes are minimized whereas the variances among classes are
maximized. The advantage of this classification is that the data distribution is
explicitly considered for determining class breaks. However, the disadvantage
is that map users may not understand the classification method used and that
class breaks may not be immediately intuitive.
o
Continuous: Each geographic feature is shaded a different shade using a
continuous scale. This legend type is useful for identifying extremely high or
low values. Where an indicator has only a small number of unique data values
(say 5 or less) this may be the most appropriate legend type to apply.
o
Standard Deviation: Class breaks reflect the number of standard deviations
from the data average (or mean). Geographic features are classified according
to how many standard deviations above or below the average their indicator
value falls. Geographic features in the same class are given the same shade.
You cannot change the number of classes for this legend type.
Any changes made in the box are then applied to the others elements of the report.
6. Comparison Table
This table shows any associated comparison data for other areas for the indicator. These
areas are County Durham, North East, England and England & Wales where available.
7. Chart
The report also displays the indicator data as a histogram chart. As with other elements this
chart automatically updates when switching between indicators, changing geographies or
applying filters. If indicators have been supplied with upper and lower confidence interval
data this is displayed as vertical bars on the chart, each bar representing a single area.
Any changes to other elements in the report are made to this chart and any selections made
are highlighted in the chart.
‘Hovering’ the mouse pointer over any bar in the chart will display the relevant information for
that area.
Additional Features
•
Use the ‘F11’ key to maximise the report to use the full screen and again to return to normal
view.
•
Using the ‘CTRL’ key and the mouse one or more features can be selected. This selection
can be done in the Data Table, Map, Legend Box or Chart element of the report. The same
feature(s) will be highlighted in the other elements of the report automatically.
•
The report can be customised by using the mouse to drag or resize each element (in the
same way application windows can in MS Windows). Additionally in the top right corner of
each element there is a hidden menu which appears when the mouse pointer hovers over it:
o
The first option allows the element to be dragged around the report; the second
maximises the element to fill the full screen and the last closes the element. These
features allow users to customise the report to meet their needs. For example the chart
could be removed and the map increased in size to show more detail.
o
Any changes made can be un-done by either refreshing the browser or by ‘right clicking’
anywhere in the report and selecting ‘Reset Layout’ from the context menu along with
settings options for Adobe flash Player.