1
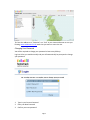
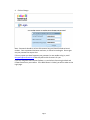
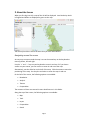
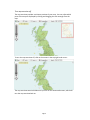
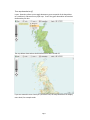
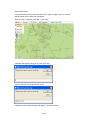
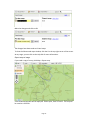
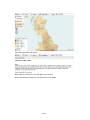
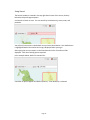
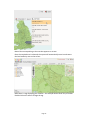
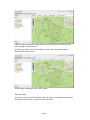
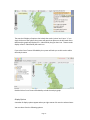
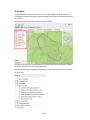
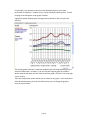
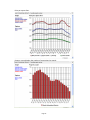
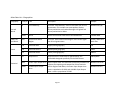
Housing Intelligence System
User Guide
Table of Contents
1. Introduction – About Hometrack
About this User Guide
2. Accessing the Housing Intelligence System (HIS)
Logging In
Changing Your Password
3. About the Screen
Navigating around the screen
Turn map overview off
Turn map boundaries off
Turn map backgrounds off
Save current map
Show saved maps
Export map as image
Using Search
Display Options
4. Map Boundaries
5. Analysis
Property Prices
Options > Show all data
Save graph as image
Prices by bed count and type
New build property prices
6. Themes
Turning Themes On
Saving Thematic Maps
Save current map
Show saved maps
7. Meta Data List
Meta Data List – Geographies
8. Getting Help
9. Logging Out
Appendix A – Analysis
Appendix B – Themes
1
1
2
2
3
5
5
6
7
8
10
11
12
14
17
22
31
32
36
36
37
39
42
42
47
47
48
49
53
54
55
56
59
1. Introduction – About Hometrack
Hometrack is the UK’s leading provider of residential property and housing
information. Established in 1999, the business has developed into a market leader in
the provision of information and analysis, which enables clients to manage their risks
and enhance the way that they do business.
Hometrack provides information solutions to the UK housing and mortgage industries.
These services deliver accurate and reliable information which is vital for enhanced
decision making and improved efficiency in highly complex and competitive markets.
A range of innovative applications are available to organisations across the residential
sector including Local & Central Government, Developers, Housing Associations,
Corporate Investors and Estate Agents.
About this User Guide
This user guide explains how to use the Housing Intelligence System (HIS), which
enables rapid access to a whole range of housing data and analysis. Whether you are a
developer or an investor reviewing an opportunity in a specific location or a policy
maker wanting to monitor trends across a certain area or region, you will find HIS
essential in enabling you to have the most well-informed and up to date intelligence
available.
As HIS is web based, you can gain access to it from anywhere.
Note: You will need to have Flash enabled on your PC to be able to view the Housing
Intelligence System.
Page 1
2. Accessing the Housing Intelligence System (HIS)
Logging In
Hometrack will have set up each user within your organisation with an individual
account in order to access HIS.
1. Open your Internet Browser
2. Type www.realdemand.co.uk in the address bar.
You will be directed to the login page for the Hometrack Housing Intelligence System:
3. Type in your Username and Password.
4. Click on Login:
When you log in to HIS, a map of England and Wales will be displayed. Areas in green
on the map are the areas subscribed to and your default area will be highlighted with a
blue outline. A tag at the top of the screen will also display your default area.
Page 2
Tip: Save the address as a “Favourite” or a “Link” in your Internet Browser to save you
locating www.realdemand.co.uk each time you want to access the site.
Changing Your Password
You will be required to change your password at least every 90 days.
Log into HIS as you would normally and you will automatically be prompted to change
your password:
1.
Type in your Current Password
2.
Enter your New Password
3.
Confirm your new password
Page 3
4.
Click on Change.
Note: Passwords should be at least 6 characters long and should include at least 1
number. Once a password has been used once, it cannot be used again. Do not give
out your password to anyone else.
If for any reason you have forgotten your password, or are unable to log in, email
[email protected] and they will be able to reset it for you.
If you are using Microsoft Internet Explorer, try and refrain from using the Back and
Forward buttons on your toolbar. If the Back button is clicked, you will be taken to the
Login page.
Page 4
3. About the Screen
When you first log into HIS, a map of the UK will be displayed. Local Authority Area’s
in England and Wales are displayed in green on the map:
You will only be able to access the areas that you have subscribed to.
Navigating around the screen
An easy way to move around the map is to use the arrow keys on the keyboard to
move up, down, left and right.
Use the ‘ + ’ and ‘ – ‘ keys on your keyboard to zoom in and out. Or if you have a
scroller on your mouse, you can use this to zoom in and out of the map.
Alternatively, use the slider bar on the left of the map. Click the arrows to move the
positioning of the map. Use the plus and minus to zoom the map in and out.
On the left of the screen, the following options are available:
•
Boundaries
•
Analysis
•
Themes
•
Comparables
The contents of these are covered in more detail later on in this Guide.
Along the top of the screen, the following options are available:
•
Map
•
Tools
•
Layers
•
Comparables
•
Search
Page 5
Turn map overview off
The map overview provides a miniature preview of your map: You can adjust which
parts of the map are displayed by clicking and dragging the red rectangle over the
map.
To turn the map overview off, click on the arrows in the top right hand corner:
The map overview remains hidden until you click on the downward arrows, which will
turn the map overview back on.
Page 6
Turn map boundaries off
Layers - Boundary allows you to toggle between a green map with all the boundaries
to a traditional, ordnance survey style map. To turn the green boundaries off unselect
the Boundary tick box.
The map below shows where the boundaries have been turned off:
If you are zoomed in more closely to a particular area, the map boundaries can display
more detail, for example roads:
Page 7
And the same map with the Map Boundaries switched off:
Turn map backgrounds off
To turn the map backgrounds off select layers and unselect the background option
Page 8
When map backgrounds are switched off, maps will be displayed as follows:
Note: Turning off the map backgrounds is best used when using Themes to see the
colours of the thematic map
Page 9
Save current map
If you have tailored a map and will need to use it again and again, you can save the
map and even share it with your colleagues.
Once the map is complete, click Map > Save map
A window will appear asking you to name your map:
Type the name for the map and click on OK:
A Map saved successfully window will appear. Click OK to close it.
Page 10
Show saved maps
Click Map > Saved Maps.
Saved Maps are split into Private Maps and Shared maps.
You can edit the name of Private maps and also delete them.
The following screen will be displayed:
In the following example, Edit
be changed:
has been clicked as the name of the Private map is to
Page 11
Make the changes and click on OK:
The changes have been made to Private maps.
To close the Show saved maps window, click the X in the top right corner of the screen.
At any stage, you can click on the Help link for more information.
Export map as image
If you need a copy of a map, click Map > Export map:
A File Download window will be displayed. Select Open, Save or Cancel. The map will
be saved as a JPEG file.
Page 12
The following window will appear:
When finished, click the X in the top right corner to close.
More information on Themes can be found later in this Guide.
Page 13
Using Search
The Search window is situated in the top right hand corner of the screen, directly
below the Help and Logout options.
Use Search to locate an area. You can search by Local Authority, street, town, and
postcode.
You will only have access to the default area you have subscribed to. Your default area
is highlighted with a blue outline and a tag is displayed when you log in.
Start typing the area you require in the Search box and a list of matches will be
displayed. Click the matching option required.
In the example below, Oxford is searched for:
A number of options appear and Oxford (District) - Local Authority is selected.
Page 14
Note a blue arrow pointing to the area also appears on screen.
Once the required area is selected, the system will automatically zoom in and centre
the local authority area on the screen:
Note there is a tag displaying your location – the example above shows City of London.
Double click on the area to change the tag.
Page 15
A blue line appears around the edge of the area and the tag of the location has now
been changed to Oxford (District).
By clicking once with your left mouse button on the map, a data tag will appear
displaying the different areas:
The data flags will disappear after a few seconds.
Search for Data
You can also use the search to find data within the system. For example if you want to
find data for private rents – type this into the search box
Page 16
The search will display all options that include the words ‘private’ and ‘rents’. If you
single click one of the options the system will open that option on the left hand menu.
Note Analysis graphs will display first – identified by the pye chart icon. Themes result
display second – identified by the easel icon.
If you select Cross-Tenure Affordability the system will take you to this section within
the analysis menu.
Double click on Cross-Tenure Affordability to load the analysis graph.
Display Options
A number of display options appear when you right mouse click over the selected area:
You can select from the following options:
Page 17
1. Zoom In & Zoom Out – this is the same as using the scroller on your mouse, the ‘+’
(plus) and ‘–‘ (minus) buttons on the slider and the ‘+’ (plus) and ‘–‘ (minus) buttons on
the keyboard.
2. Original Zoom – this option will take you back to how the map was displayed in the
previous screen, or when you logged in.
3. Centre Here – Centre Here will reposition the Local Authority Area to the middle of
the screen.
Page 18
The example above shows the Local Authority area in the top left of the map. Right
mouse click and select Centre Here to reposition the local authority area to the middle
of the map:
4. Center & Zoom On
By clicking Center & Zoom On, the selected area will reposition itself to the middle of
the screen.
And at the same time, zoom into the selected local authority area:
Page 19
The options below Center & Zoom On change depending on which Map Boundary is
selected.
For example, when LAs and Wards is selected as the Map Boundary, Wards is displayed
when you right mouse click over a local authority area.
You can also use the Tools menu to zoom in, zoom out and return to your original
zoom. Pan map allows you to drag the map around the screen automatically reloading
the areas you move to.
Page 20
Zoom Box allows you to draw a box over the map and the map will automatically zoom
into the boxed area.
5. Help
If you require any help or assistance at any stage, click Help and a new window will
open redirecting you to a comprehensive list of help topics:
Page 21
4. Map Boundaries
There are 7 levels of Geographies:
1. Government Office Regions (GORs);
2. Local Authorities (LAs);
3. Wards;
4. Statistical;
5. Middle Super Output Area (MSOA);
6. Lower Super Output Area (LSOA); and
7. Output Area (OU).
The Housing Intelligence System defaults to Local Authority (LA) areas. For more
information on the levels of Geographies, please refer to the Meta Data List –
Geographies later on in this guide.
To change the level of Geography, click Map Boundaries on the left.
Map Boundaries are made up of the following:
•
LAs and Wards
•
GORs, LAs and Wards
•
Statistical
Double click on the level of geography required.
Page 22
1. LAs and Wards:
LAs and Wards include the Local Authority and Wards within that local authority.
Right mouse click over the area and select Ward:
The boundaries for each ward within the Local Authority area will be displayed:
The Wards are displayed in blue, with clear boundary lines.
To switch Wards off, right mouse click over the area and un-tick Wards:
Page 23
2. GORs, LAs and Wards
Double click on GORs, LAs and Wards to view the Government Office Region:
In the above example, as Oxford was previously selected as the local authority area,
this comes under the South East Government Office Region.
Different options are available when you right mouse click over the GOR:
Page 24
Once Local Authority is selected, you can click over a local authority area and display
the Wards:
Page 25
Use the Zoom In options to view the map more closely.
To remove the Wards from being displayed, right mouse click over the local authority
area’s and select Wards.
Page 26
3. Statistical
Statistical covers Local Authorities (LAs), Output Areas which are small areas of
approximately 125 households, Lower Super Output Areas covering a population of
1000, and Middle Super Output Areas covering a population of 5000.
To display the Output Area’s, right mouse click over the local authority area. You will
first only be able to select Middle Super Output Area
Once the Middle Super Output Area is selected, you can further refine your statistical
information to display the Lower Super Output Area:
And again, once the Lower Super Output Area is selected, you can refine the map
further by displaying the Output Area:
Page 27
The map below shows:
•
The Middle Super Output Area in purple)
•
The Lower Super Output Area in blue
•
The Output Area in yellow
Page 28
4. Postal
Postal includes the Postcode Area and Postcode District.
The example above shows the Oxford Local Authority selected within the Postcode
Area of OX.
Once Postcode District is selected, the map is displayed as follows:
Page 29
Once the area is selected, either by GORs, LAs, Wards or Output areas and the map is
displayed as required, you can then use Analysis and Themes to search for housing
data on the area.
Page 30
5. Analysis
The data within the Analysis section is pre-set. Depending on the area that you are
investigating, a graph, bar chart or table will display the results you require at the click
of a mouse.
Click the Analysis menu option on the left of the screen:
All other menu options on the left hand side of the screen will automatically collapse.
By default, the Area Overview will be displayed.
A data tree will appear allowing you to choose the type of analysis you wish to look at
for your area:
Page 31
Click the ‘+‘ (plus) and ‘–‘ (minus) buttons to expand and collapse the data you wish to
analyse.
Property Prices
Property Prices are divided into the following:
•
•
•
•
•
•
Key Facts Property Prices
Prices based (by quartile over time)
Prices (Average only for comparison)
Prices (Lower Quartile only for comparison)
Prices by bed count and type
New build property prices
When you click on Prices (by quartile over time), Average and Lower Quartile only for
comparison, sub-categories will appear for the following property types:
•
•
•
•
•
Overall prices
Terraced prices
Semi-detached prices
Detached prices
Flat/Maisonette prices
The Key Facts displays an overview of the analysis section for the area you have
selected. The Key Facts is text only and is available to print.
Page 32
For example, if you wanted to view how semi-detached property prices have
performed, click Analysis > Property Prices > Semi-Detached property prices. A small
rotating arrow will appear as the graph is loaded.
A graph will appear displaying the Average price by default for the area you have
selected:
The analysis graph will load in a separate window and is self-sizing depending on the
amount of data there is to display. You can click and drag the graph to position it
where required and when you have finished with the graph, click the X in the top right
corner to close.
There are usually other options which you can select for the graph. In this example of
Semi-detached property prices for the Oxford area, you can change the graph to:
Price per square metre:
Page 33
Page 34
Price per square foot:
Property count displays the number of transactions by month:
Page 35
Options > Show all data
Show all data allows you to view each of the graphs (Average price, Price per square
metre, Price per square foot and Property count) in one go. Use the scroll bar on the
right to view each one.
Options > Print
Options, Print will print out all images or tables available.
Save graph as image
With each graph that is displayed, there is a link at the bottom of the screen that
allows you to save the graph as an image in order that it can be put into a report or
presentation. Within the terms & conditions of use, graphs should only be used for
internal purposes. If any graphs generated from HIS need to be in the public domain,
please contact Hometrack for approval.
Use the scroll bar to move down and an explanation of the graph can be found
together with where the source data has been taken from.
A list of all the graphs available within HIS can be found within Appendix A – Analysis.
When you have finished with the graph, click minimise button or the X in the top right
corner to close.
Page 36
Prices by bed count and type
Click on Analysis > Prices by bed count and type
Prices by bed count and type are divided into:
•
Average; and
•
Lower Quartile
For Lower Quartile property prices, this means the lower end of the market or ex
housing association properties in order that a comparison can be obtained for
affordability purposes.
Double click on Average and a graph will be displayed as follows:
When you hover your mouse over each bar, a popup will appear displaying the actual
figure.
Click Table > Price by bed count and type and the same information is displayed
differently:
Page 37
Click Options > Compare areas to compare one area with up to 20 other areas:
Click mini mode at the top of the screen to display a map which you can then select
other areas for comparison:
Page 38
In this example, four surrounding areas have been selected for comparison.
Finally, click run your comparison:
New build property prices
New build properties are usually at a premium and therefore a New build property
prices category is included in HIS.
Click Analysis > Property prices > New build property prices. There are 2 options:
•
New build premium
•
Prices of new build housing over time
Double click on New build premium and a table will be displayed:
Page 39
Again, you can click Export table and the underlying data can be opened in Excel.
You can also compare up to 20 areas.
Double click on Prices of new build housing over time and a graph for your selected
area will be displayed:
Page 40
Note that the graph displays Flats by default and the lines on the graph relate to:
•
•
•
Upper Quartile – top end of the market
Mean – average new build price
Lower Quartile – bottom end of the market
Click Houses to view how the data can differ:
For an overall table of data, click Table > Prices of new build housing over time:
Click the X in the top right corner to close the tables and graphs.
We have just scratched the surface with the Analysis tools available within the Housing
Intelligence System. For a complete list of options available, please refer to Appendix
A – Analysis.
Page 41
6. Themes
Themes are more visual than Analysis, if that is possible! Themes are colour coded
hotspots which allow you to see results quickly and easily, at a glance. The Data
behind Themes can be exported to Excel.
Turning Themes On
To turn on a Theme, select Themes on the left hand menu:
By default, No Theme will be displayed yet:
For a full list of available Themes, please refer to Appendix B – Themes.
Click the ‘+‘ (plus) and ‘–‘ (minus) buttons to expand and collapse the Theme you wish
to view.
For example, if you wanted to look at property price changes in the last 2 years, click
the plus to expand Property prices, followed by Price change (overall) last 2 years.
Page 42
Alternatively right click with your mouse button and select open – the theme will then
display on the map.
A rotating circle will indicate the theme is loading.
When the theme is loaded, the map will change colour displaying a thematic map:
Page 43
Use the zoom control options to change the scale of the map for a comparison with
surrounding areas, or England and Wales.
The scale of the theme is loaded in the bottom left of the map. For each theme, you
will find that the scale is different.
Click on different areas of the map to display data flags with actual percentage changes
displayed:
The data behind the theme can be exported directly into Excel by clicking Map on the
toolbar at the top of the screen and selecting Export Theme:
Page 44
A dialog box will appear asking if you wish to open, save or cancel the file download:
Click Open and Excel will launch and display the data:
Page 45
Save and close Excel once you have finished.
Page 46
Saving Thematic Maps
Thematic maps can also be saved as an image by clicking Map Options on the toolbar
at the top of the screen, followed by Export map as image:
A File Download dialog box will appear asking if you wish to Open or Save the image:
Click Save and select the file location the image is to be saved to. Images are saved as
.jpg files.
Save current map
If you have tailored a map and will need to use it again and again, you can save the
map and even share it with your colleagues.
Once the map is complete, click Map > Save map
A window will appear asking you to name your map:
Type the name for the map and click on OK:
Page 47
A Map saved successfully window will appear. Click OK to close it.
Show saved maps
Click Map > Saved Maps.
Saved Maps are split into Private Maps and Shared maps.
The following screen will be displayed:
To close the Show saved maps window, click the X in the top right corner of the screen.
At any stage, you can click on the Help link for more information.
For a complete list of available Thematic maps, please refer to Appendix B – Themes.
Note: Very occasionally, a Theme is unable to be displayed. This is due to there being
insufficient data available.
Page 48
7. Meta Data List
Each user has access to an up to date full Meta Data list. The Meta Data list is a fully
comprehensive catalogue of all the information in the Hometrack Housing Market
Evaluation System. It contains detailed information about the data source, level of
geography, nature and scope of all the data which comprises the system.
Suppliers of data incorporated into the Housing Intelligence System include:
•
ASHE (Annual Survey of Hours and Earnings)
The Annual Survey of Hours and Earnings (ASHE) provides granular data on the
level and distribution of earnings and hours worked for employees in all
industries and occupations across the UK. ASHE replaces the New Earnings
Survey (NES) from 2004 onwards.
HIS displays average gross weekly pay for full time workers at local authority
level. This data is updated annually.
Source: www.statistics.gov.uk
•
British Crime Survey
The British Crime Survey (BCS) is an in-home survey run by the Home Office and
measures the amount of crime in England and Wales for people aged 16 and
over living in private households.
HIS displays the data at local authority level for six categories of crime
expressed as the number of offences per 1000 population. This data is updated
annually.
Source: www.homeoffice.gov.uk
•
Bank of England
•
CACI Paycheck / Household Incomes
CACI are a leading provider of marketing solutions and information systems.
The business has developed PayCheck, a database that provides gross
household income estimates across the UK. It allows for an understanding of
income patterns at detailed levels of disaggregation. The system propfiles
household incomes at all 1.7 million postcodes, using information on over 7.7
million households from CACI’s lifestyle database, in conjunction with detailed
statistics from the previous census and market research data to increase
statistical reliability.
HIS uses the PayCheck data in conjunction with the Hometrack property price
data for the various measures of housing affordability shown at a range of
geographies. The PayCheck data is updated annually whilst the house price
data changes more frequently.
•
Census
In England and Wales, the Census is planned and carried out by the Office for
National Statistics. The last Census took place in 2001, with the next one being
planned for 2011.
The Census contains important data on housing based on population with the
most common unit by person. Further bases of viewing data including
dwellings or communal establishments is also available.
Page 49
HIS currently displays a broad range of Census data to highlight key trends in
the profile of the population, household types and the housing market.
Source: www.statistics.gov.uk/census
•
CORE (Housing Corporation)
The COntinuous REcording of Lettings and Sales (CORE) is an on-going survey of
sales and lettings of stock owned by housing associations and is run throughout
the year. Since 2004, local authorities have also participated in the survey.
The information is collected through logs including age, gender, economic
status of each household member, ethnicity, household income, source of
referral, reason for housing, location and type or property, rent etc.
HIS displays a range of analysis of the CORE data at local authority level and is
updated annually.
Source: www.core.ac.uk
•
Council Tax
The Department for Communities and local government and the Welsh
Assembly provide data on the level of band D council tax by local authority in
England and Wales.
There are standard ratios that can be applied to the average band D figure to
calculate the council tax for other bands which are displayed in HIS. This data is
updated annually.
Sources: www.communities.gov.uk / www.wales.gov.uk
•
Department for Education and Skills
The Department for Education and Skills provide information on a range of
measures on the levels of achievement and attainment in both Primary and
Secondary schools in England.
HIS currently displays data at local authority level which is updated annually.
Source: www.dfes.gov.uk
•
Deprivation
The Index of Multiple Deprivation 2004 (IMD 2004) is a measure of multiple
deprivation at the small area level for England. The indices are built at the
output area level. HIS displays the data at local authority level using an
aggregated series.
HIS contains data for four deprivation measures:
1. The Local Concentration measure is the population weighted average of the
ranks of a district’s most deprived SOAs that contain exactly 10% of the
district’s population.
2. The Extent measure is the proportion of a district’s population living in the
most deprived SOAs in the country.
3. The Income Scale measure is the number of people who are Income
deprived.
4. The Employment Scale measure is the number of people who are
Employment deprived.
Source: www.communities.gov.uk
•
Hometrack
Hometrack have a significant amount of unique data on house prices and
Page 50
housing market trends which is updated monthly.
The house price data in HIS is sourced from Hometrack’s Realtime Automated
Valuation Model (AVM). The Hometrack AVM delivers on-line residential
property valuations to the UK mortgage industry. The valuations are created by
an advanced computer model built from a database containing over 22 million
units of property data. This database is based on surveyor valuations and data
on individual property sales from the Land Registry. The database grows every
month as new data from the Land Registry and mortgage lenders becomes
available.
In addition to the data held in the AVM, Hometrack conduct a monthly survey
of estate agents which provides other indicators of market activity. All this
data is collected for each of the 2,200 postcode districts in England and Wales.
Source: www.hometrack.co.uk/business
•
Hometrack Agent’s index
•
HM Land Registry
The Land Registry registers title to land in England and Wales and records
dealings with registered land (for example, sales and mortgages). As a result it
is a primary source of data on house prices and transaction volumes across
England and Wales.
HIS uses Land Registry data for comparison of new build and second hand
property prices as well as data on transaction levels by area, type and price
range at a range of different geographies. The Land Registry data in HIS is
updated quarterly.
Source: www.landreg.gov.uk
•
Housing Register
Each year the Department for Communities and Local Government collects a
large amount of data covering a wide range of housing areas from each of the
354 local authorities across England.
HIS displays data on the size of the Housing Register at local authority level
based on these returns. The Homelessness Act 2002 has removed the statutory
duty to maintain a housing register, but now most local authorities continue to
keep a register or list of housing applicants in housing need. This data is
updated annually.
Source: www.communities.gov.uk
•
Office for National Statistics
Source: www.ons.gov.uk
•
Population Projects
HIS contains data on the latest population projections at local authority level.
The Government Actuary’s Department produce ‘full’ population projections by
age and sex for the United Kingdom and constituent countries every two years.
Full sets of projections are based on a review of all the underlying assumptions
regarding fertility, mortality and net migration.
In future the responsibility for the production of national population
projections has been transferred to the Office for National Statistics (ONS).
Source: www.ons.gov.uk
Page 51
•
Regulatory Statistical Return
The Regulatory and Statistical Return (RSR) is annual census of the stock and
activities of all housing associates, conducted by the Housing Corporation. The
survey provides essential information about the size and shape of the sector,
rents, vacancy rates etc. It is a regulatory requirement that all housing
associations complete the RSR, since it provides the basis for the Corporation’s
risk-based regulatory system.
HIS displays a range of data from the RSR on the amount and type of stock
owned and managed by housing associations at the local authority level. This
data is updated annually.
Source www.rsrsurvey.co.uk
For access to the most up to date Meta Data List, click Help in the top right corner of
the screen and select Meta Data and Geographies on the Help Sections menu on the
left of the screen.
Click on Meta Data, followed by:
Click here to download a PDF version of our full Meta Data list
Providing you have Adobe Acrobat Reader installed, the file will automatically launch.
The Meta Data List is constantly being updated and uploads are available on a regular
basis. The date of the Meta Data list can be found on the front page of the file.
Page 52
Meta Data List – Geographies
Geography
Acronym
Title
Description
Example
LA
Local Authority
The term ‘Local Authority’ refers to the lower tier of local
government. This includes non-metropolitan districts,
unitary authorities and London Boroughs in England and
unitary authorities in Wales.
Wandsworth (LB)
Wards
Ward
Wards are electoral areas within Local Authorities.
Fairfield Ward
GOR
Government Office
Region
The term ‘Government Office Region’ refers to the higher
tier of local government.
London, Wales and
North East
PCA
Postcode Area
Higher postal geography
SW
PCD
Postcode District
Middle postal geography
SW18
PCS
Postcode Sector
Lower postal geography
SW18 1
OA
Output Area
Output Areas are small areas of approximately 125
households designed specifically for the 2001 Census
00BJGQ0006
LSOA
Lower Super Output Area
MSOA
Middle Super Output
Area
Super Output Areas are small areas specifically introduced to Wandsworth 010D
improve the reporting and comparison of local statistics.
Wandsworth 010
Within England and Wales, the Lower Super Output Area
covers a population of 1000, and a Middle Super Output
Area is covers a population of 5000.
LAs and
Wards
GORs, LAs
and Wards
Postal
Statistical
Page 53
8. Getting Help
For access to the Quick Start Guide, Frequently Asked Questions, more information on
the Data Sources and Meta Data Listing, click on Help in the top right corner of the
screen, to the left of Logout:
The Help function is comprehensive and has a number of contact emails for support
from Hometrack.
Page 54
9. Logging Out
In the top left hand corner, you have a Help function and Logout. If there is inactivity,
you will automatically be logged out of HIS after 2 hours.
It is essential that you log out of the Housing Intelligence System when you have
finished using it, or at the end of the day.
The following dialog box will be displayed:
Click OK and you will be returned to the Login screen:
Page 55
Appendix A – Analysis
The following is a list of all the graphs available within the Analysis section of HIS:
•
Property Prices
o Key Facts
o Prices (by Quartile over time)
Overall property prices
Terraced property prices
Semi-detached property prices
Detached property prices
Flat / Maisonette property prices
o Prices (Average only for comparison)
Overall prices (Avg only)
Terraced prices (Avg only)
Semi-detached prices (Avg only)
Detached prices (Avg only)
Flat / Maisonette prices (Avg only)
o Prices (Lower Quartile only for comparison)
Overall prices (LQ only)
Terraced prices (LQ only)
Semi-detached prices (LQ only)
Detached prices (LQ only)
Flat / Maisonette prices (LQ only)
o Prices by bed count and type
o Latest Data for Comparison
Average
Lower Quartile
o Data over time
Average
Lower Quartile
o New build property prices
•
Affordability
•
Key Facts
New build premium
Prices of new build housing over time
o Affordability by income bands
o Cross-tenure affordability
o Shared Ownership affordability
Page 56
•
Housing sales
•
Key Facts
o
o
o
o
o
o
Lower Quartile Prices
Upper Quartile Prices
Mean Prices
Median prices
Overview of housing turnover
Profile of all housing sales by value
Terraced housing sales by value
Semi-detached housing sales by value
Detached housing sales by value
Flat sales by value
•
Housing supply
•
Key Facts
o Profile of housing stock
o Occupancy
o Housing Association supply
•
Housing demand
•
Key Facts
o Supply and Demand
o Market Indicators
o Affordable housing demand
Housing Register
General Needs tenants
Supported Housing tenants
Shared Ownership buyers
•
People and society
•
Key Facts
o
o
o
o
o
o
o
o
o
•
Population
Age profile
Marital status
Religion
Ethnicity
Crime
Car Ownership
Household composition
Education
Key Stage 2
GCSE
Economy
o Macroeconomic trends
Page 57
o Local economic indicators
o Unemployment rate
Page 58
Appendix B – Themes
The following is a complete list of available Thematic maps:
•
Property Prices
o Average prices
Avg price (overall) current
Avg price (overall) 1 year ago
Avg price (overall) 2 years ago
Avg price (overall) 3 years ago
Avg price (overall) 4 years ago
Avg price (terraced) current
Avg price (semi) current
Avg price (detached) current
Avg price (flat/mais) current
Avg price per square metre
Avg price per square foot
o Price change
Price change (overall) last year
Price change (overall) last 2 years
Price change (overall) last 3 years
Price change (overall) last 4 years
Price change (terraced) last 2 years
Price change (semi) last 2 years
Price change (detached) last 2 years
Price change (flat/mais) last 2 years
o Lower Quartile prices
LQ price (overall) current
LQ price (overall) 1 year ago
LQ price (overall) 2 years ago
LQ price (overall) 3 years ago
LQ price (overall) 4 years ago
LQ price (terraced) current
LQ price (semi) current
LQ price (detached) current
LQ price (flat/mais) current
LQ price per square metre
LQ price per square foot
o Rents
RSL Rents
• 1 Bed
• 2 Bed
• 3 Bed
Page 59
•
Affordability
o House price to incomes ratio
House price to incomes ratio (mean)
House price to incomes ratio (median)
House price to incomes ratio (lower quartile)
o House price to earnings ratio
House price to earnings ratio (median)
House price to earnings ratio (lower quartile)
•
Housing sales
o
o
o
o
o
o
•
Housing turnover as a percentage of stock
o
o
o
o
o
o
•
Annual turnover 2008
Annual turnover 2007
Annual turnover 2006
Annual turnover 2005
Annual turnover 2004
Annual turnover 2003
Annual turnover 2008
Annual turnover 2007
Annual turnover 2006
Annual turnover 2005
Annual turnover 2004
Annual turnover 2003
Housing supply
o Type
% detached houses
% semi-detached houses
% terraced houses
% flats (purpose built)
% flats (converted)
o Tenure
% owner occupied outright
% owner occupied with mortgage
% shared ownership
% rented (private landlord/agency)
% other social rented
% rented from council
o Size
% 1 room
% 2 rooms
Page 60
% 3 rooms
% 4 rooms
% 5 rooms
% 6 rooms
% 7 rooms
% 8 or more rooms
o Occupancy
% occupancy rating +2 or more
% occupancy rating +1
% occupancy rating 0
% occupancy rating -1
% occupancy rating -2 or less
o Density
Dwellings per hectare
•
Housing demand
o Supply and Demand
Avg viewings per sale
Avg time to sell (weeks)
Avg sale price to asking price
o Affordable housing demand
•
Average void period for GN
People and society
o Population
% aged under 16
% aged 16 - 19
% aged 20 - 29
% aged 30 - 34
% aged 35 - 59
% aged 60 - 69
% aged 70 - 79
% aged over 80
o Ethnicity
% White
% Mixed
% Asian or Asian British
% Black or Black British
% Chinese or Other Ethnic Group
o Crime
Crimes per 1000 population
o Education
Page 61
Key Stage 4
• % Level 4 or Above English
GCSE
• % 5+ A* to C
• % 5+ A* to G
• % Any Passes
o Car ownership
% households with 0 vehicles
% households with 1 vehicle
% households with 2 vehicles
% households with 3 vehicles
% households with 4 or more vehicles
o Household composition
% one person households
% married households
% cohabiting households
% lone parent households
% full time student households
o Deprivation - England
Rank of local concentration
Rank of average of SOA scores
Rank of extent scores
Rank of income scores
Rank of employment scores
o Deprivation - Wales
•
Rank of income scores
Rank of employment scores
Rank of health
Rank of access to social services
Rank of physical environment scores
Rank of community safety scores
Rank of overall index scores
Economy
o Economic status
% economically active
% full time employees
% full time students
% retired
Page 62
o % by each socio economic status
Higher managerial and professional
Lower managerial and professional
Intermediate occupants
Small employers / own account
Lower supervisory and technical
Semi-routine occupations
Routine occupations
Never worked / long term unemployed
o Earnings
Avg gross weekly earnings
o Unemployment rate
Quarter 1 – 2006
Quarter 2 – 2006
Quarter 3 – 2006
Quarter 4 – 2006
Quarter 1 – 2007
Quarter 2 – 2007
Page 63