1
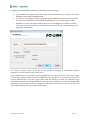
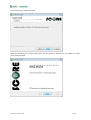
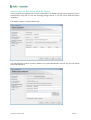
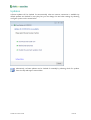
SCORE 2014 User Guide
Version 14.02
05 November 2014
Innovative Solutions for Education Management
www.drakelane.co.uk
System requirements ................................................................................................................................................. 3
Installation .................................................................................................................................................................... 4
Special notes for SQL Server 2008 R2 Express ............................................................................................................. 8
Updates ....................................................................................................................................................................... 10
Uninstallation ........................................................................................................................................................... 11
Unlock and licence ................................................................................................................................................... 12
Performing a build ................................................................................................................................................... 13
External data sources ............................................................................................................................................................13
Setting options ........................................................................................................................................................................13
Organisation structure .........................................................................................................................................................13
Build .............................................................................................................................................................................................14
Selecting reports ...................................................................................................................................................... 15
Navigation.................................................................................................................................................................................15
Favourites and selections ....................................................................................................................................................16
Column layout and order ....................................................................................................................................................16
Filtering ......................................................................................................................................................................................17
Sorting ........................................................................................................................................................................................17
Grouping ....................................................................................................................................................................................17
Dynamic department grouping .........................................................................................................................................17
Viewing report content .......................................................................................................................................... 18
Printed report ...........................................................................................................................................................................18
Data grid ....................................................................................................................................................................................20
Chart ............................................................................................................................................................................................21
Utility ..........................................................................................................................................................................................22
Funding changes between current and previous ILR (195) .....................................................................................................22
Adjusting report content ....................................................................................................................................... 24
Excluding data .........................................................................................................................................................................24
Adding notes ............................................................................................................................................................................24
Maintaining exclusions and notes ....................................................................................................................................25
Ribbon menu ............................................................................................................................................................. 26
Home tab...................................................................................................................................................................................26
Help and support tab ............................................................................................................................................................27
SCORE 2014 User Guide
2 of 28
System requirements
·
·
·
SCORE 2014 is designed as a standalone PC-based application.
It consists of a .NET client application attached to a local SQL database.
It requires Administrative rights to install (but not to run the application).
An overview of the system requirements are shown below:
Item
Minimum
Recommended
Operating system
Windows XP SP3
Windows 7 or above
Hard disk
1 GB free space
Memory
1 GB
2 GB
Graphics
32-bit graphics with 1024*768
resolution
32-bit graphics with1280*800
resolution
Database
SQL Server Express 2008 R2 or above
Note this is downloaded as part of the install if
necessary.
Other
.NET Framework 4 Client Profile
Note this is downloaded as part of the install if
necessary.
2014/15 Funding Information System
(FIS) export database
Microsoft Excel (or equivalent)
Adobe Acrobat Reader (or equivalent)
Note that these are optional but will facilitate
the viewing of exported data.
2013/14 Funding Information System
(FIS) export database
SQL Server Express R2 and the .NET
Framework 4 Client Profile must be
installed as a minimum. If
unavailable then the prerequisites
wizard will download and install
these components for you.
In most circumstances the default
settings can be accepted but
System Administrators should read
the SQL Server Express R2 section
of this document.
SCORE 2014 User Guide
3 of 28
Installation
The installation package is distributed for download from our website as a zip file. Download the zip file,
extract all files to a folder on your PC and run setup to begin the installation.
If you are using Windows Vista or above you will probably see a User Account Control warning similar
to that shown below.
The files are digitally signed by us (the verified publisher) so you can click Yes. Once setup begins
simply follow each of the wizard stages through as shown.
SCORE 2014 User Guide
4 of 28
Once you have read the licence agreement, if you accept the terms click Next to continue.
Select the installation folder (the default is recommended).
SCORE 2014 User Guide
5 of 28
Configure the SQL database connection by selecting the server and login.
·
·
If you installed SQL express as part of the setup then by default the server will be in the format
NAMEOFYOURCOMPUTER\DRAKELANE.
If you have FIS (Funding Information System) software installed then the server will normally
be in the format NAMEOFYOURCOMPUTER\SQLEXPRESS. If you are placing the SCORE
database on the FIS SQL Express instance then you must be logged in to Windows with the
same user account used when you installed FIS otherwise the correct permissions may not be
assigned to the database.
You may see network servers on the list but this product is designed as a standalone desktop
application so we recommend using a local server.
Login credentials are set to Windows trusted by default but you may wish to use the SQL server login.
To avoid any potential issues caused by insufficient user permissions we recommend using the sa
(System Administrator) SQL server login rather than the Windows trusted. The connection login
credentials are stored in an encrypted format. If you are using the default server (with the DRAKELANE
instance) you may be able to use the username sa and password DrakeLan3. If you do not know the
login credentials please ask your System Administrator.
SCORE 2014 User Guide
6 of 28
Once everything is ready click Install.
When the installation is complete click Finish, with the option to subscribe on our website for email
news (recommended).
SCORE 2014 User Guide
7 of 28
Special notes for SQL Server 2008 R2 Express
If this prerequisite is required then in most circumstances the default settings can be accepted. System
Administrators may wish to note the following settings specific to the SQL Server 2008 R2 Express
installation.
The default instance is named DRAKELANE.
The authentication mode is mixed by default. The system administrator account (sa) has the default
password DrakeLan3.
SCORE 2014 User Guide
8 of 28
The database used for data analysis and reporting needs to reside on SQL Server 2008 R2 or above. The
product is designed as a standalone desktop application so we recommend that one of the SQL Express
editions is used on the client.
If you do not have SQL Server installed locally on your computer then the application installer can
download this for you.
Although it is technically possible for the database to reside on a network SQL server instance the
application is currently not designed to operate in a shared multi-user environment.
SCORE 2014 User Guide
9 of 28
Updates
Software updates will be checked for automatically when an internet connection is available. By
default updates are checked for every day but you can change this and other settings by selecting
configure options on the screen below.
Alternatively, software updates can be checked for manually by selecting check for updates
from the Help and support menu ribbon.
SCORE 2014 User Guide
10 of 28
Uninstallation
To uninstall the client application software, go via Windows Control Panel.
Use Programs and Features
in Windows 7
Use Add/Remove
Programs in Windows XP
To completely remove the SCORE database from the SQL server instance connect using SQL Server
Management Studio and delete the database.
Please note that this guide is written with reference to SQL
Server 2012 but similar processes apply to other versions.
Expand the Databases node, right-click the appropriate database and
select Delete from the context menu.
SCORE 2014 User Guide
11 of 28
Unlock and licence
You will not be able to use the software until an unlock code is entered. You unlock the software the
first time it is run by contacting us with your UKPRN and computer fingerprint. We can then provide
you with an unlock code.
Your licence is for your specific UKPRN, and each computer where the software is installed will require
a different unlock code:
·
·
The unlock codes consist of two separate 8-character sections separated by a dash (hyphen) for
example 1234ABCD-567890EF.
When entering your unlock code the dash (hyphen) is entered automatically so there is no
need to type it in. Any alpha characters entered are converted to UPPERCASE automatically.
SCORE 2014 User Guide
12 of 28
Performing a build
You will need to perform a build to process your data before viewing reports and other information.
The build is managed by a wizard that will lead you through the necessary steps.
You don’t have to follow the wizard through every step. To skip to a specific step, just click on the
appropriate tab or select it from the main menu ribbon, though some steps must be completed in order
(for example, you can’t complete a build without first selecting a current year FIS export database file).
To move between the wizard steps do any of the following:
·
·
·
Click on the appropriate tab
Click the Back or Next buttons
Type B (back) or N (next) on your keyboard
After the introductory page there follows a series of simple steps that allow your data to be analysed
and a series of reports produced.
External data sources
Select the external data sources. For the current academic year the FIS export and LARS
Microsoft Access databases are required.
Optionally, you can also select the FIS export database for the previous year. Doing so provides access
to several additional reports that analyse data between the academic years.
Setting options
Options set during the build can affect what data is shown on your reports.
Include only learner aims generating FE funding in appropriate reports?
Ensures only funded aims are included on reports where appropriate. For example, some reports
deal specifically with non-funded aims. This option is selected by default.
Remove exclusions from all reports?
You can exclude specific records from reports at aim or learner level (as and where
appropriate). Selecting this option permanently removes all previously set exclusions data for
all reports.
Remove notes from all reports?
You can add notes to specific report records at aim or learner level (as and where appropriate).
Selecting this option removes all previously entered notes for all reports.
Organisation structure
The structure of your organisation can be displayed or used to group data on many of the
reports. A 2-tier hierarchy of department and course can be reflected by using the Learning
Delivery Provider Specified elements of the ILR.
SCORE 2014 User Guide
13 of 28
Optionally, you can also select the FIS export database for the previous year. Doing so provides access
to several additional reports that analyse data between the academic years.
Department and course definitions are set by selecting which XML elements and which characters
contain the department or course code. In the example above, the first 3 characters of the
ProvSpecDelMonB XML element are selected as identifying the course code. There is no restriction on
how many of the available XML elements you can select to define your organisation structure.
In addition, departments also allow names to be entered manually against each department
code generated. Optionally, a prompt can be shown at the end of the build to name any new
departments generated by checking Prompt me to name new Departments on the
Organisation tab of the wizard.
Any changes you make to course code definitions, department code definitions of department names
will take immediate effect. If they are changed after a build has been done, the changes will be applied
retrospectively to the data generated during that build.
Build
The build process allows SCORE to prepare data and reports based on the options selected. To start the
build do any of the following:
·
·
·
Click the SCORE logo (shown here on the left)
Press F8 on your keyboard
Click the Build button
Overall progress is shown on the green horizontal bar. During the build, the
current optimisation figures are shown.
A potential under claim (positive) or zero is shown in black.
A potential over claim (negative) is shown in red.
Once the build is completed, the reports grid becomes available to investigate, view and output reports.
SCORE 2014 User Guide
14 of 28
Selecting reports
The list of available reports is presented in a highly flexible grid view. It is deliberately designed to look,
feel and behave like a familiar Microsoft Excel style spreadsheet. If you already use our 4cast curriculum
planning solution then this type of view will be very familiar to you.
You will find grids used in many places throughout the software. They may
have a right-click context menu associated with them too which replicates
many commands available elsewhere to provide you with different ways of
performing the same task.
Changes can be made to the report list grid layout, including applied filters and sort order, and they will
remain in place next time you start the application.
Navigation
To move between and within records you can select the required cell with the mouse or use the
keyboard cursor, page up and page down keys.
The record selector on the left of the screen shows which record is currently selected. The record
is also highlighted.
To open specific reports on screen do any of the following:
Click the icon to open the printed report view.
Click the icon to open the interactive chart view.
Click the icon to open the spreadsheet-like datasheet view.
Click the icon to open the form utility view.
SCORE 2014 User Guide
15 of 28
Double-click the row to open the default view for that report.
You can open more than one report at a time and switch between report windows in the usual way on
the Windows taskbar.
The navigation panel to the left of the reports list datasheet allows quick access to specific groups of
reports and other commands.
Items in the show group allow you to view specific categories of report. Any filters you have already
applied to the reports list datasheet are removed.
All shows all reports.
Favourites shows reports you have marked as favourites.
Selections shows reports you have marked as selected.
Optimisation shows reports that have a funding impact calculated.
Chart available shows reports that have an associated interactive chart view.
Utility available shows reports that have a form-based utility.
Already open shows reports that are already open.
Have data shows reports that have data.
Items in the actions group allow you to perform actions on the reports currently shown in the reports
list grid.
Batch PDF exports all of the reports to PDF.
Batch Excel exports all of the reports to Microsoft Excel in the file format currently selected on
the ribbon menu.
Favourites and selections
You can mark specific reports as favourites or selections for easy access to frequently used reports.
Click the favourites column to toggle on and off.
Click the selections column to toggle on and off.
Column layout and order
You can decide which columns are shown by clicking the field selector button at the top-left
corner. To simply remove a field you can also drag the column heading away from the datasheet.
To change the order of fields, simply drag-and-drop the column headings into the position you require.
To change the width of a column place the mouse between headings, then click and drag to the
required width. Double-click between columns to automatically fit the widest entry.
SCORE 2014 User Guide
16 of 28
Filtering
Filtering allows you to see just the reports you are interested in. The top two rows of the grid
coloured light blue are used for filtering.
To apply a filter select a filter rule from the drop-down list and enter criteria in
the box below or select from a list of existing values (where applicable).
The clear filter button on the far left removes the filter for the entire scenario or filters can be
removed for individual columns.
Alternatively just select the remove filters button from the grid section of the main menu
ribbon.
Sorting
To sort a column just click on the column heading. The direction of the arrow shows whether it is
sorted ascending or descending. Hold down Shift to select multiple columns for sorting.
Grouping
Grouping the reports provides an alternative view of the grid by arranging records into groups which
have the same value in specified columns.
To group by a column, click and drag the column
heading to the box at the top left.
You can group by multiple columns by continuing to add column headings as required. Each group can
be sorted as required.
Individual groups can be expanded and collapsed by clicking the + and - buttons.
To remove a grouping, click and drag the column heading away until the X is shown.
Dynamic department grouping
Where available, the data on individual reports can be optionally grouped on the printed report.
Select the Group by Department checkbox on the reports list grid.
The grouping is set at individual report level and is off by default.
SCORE 2014 User Guide
17 of 28
Viewing report content
A standard report has two default views when opened, the datasheet
and printed report (shown by default) views. Each view is available on
a separate tab. The additional chart and utility views are available
where indicated for specific reports.
Both default views also show summary information toolbar at the top of the screen with optimisation
and exclusion information where applicable.
Printed report
The report view shows the report as it will appear when printed. Standard navigation, print,
export and other commands are on the ribbon.
If a filter is applied (via the datasheet) then this is shown on the first page. Depending on the report, it
may not be possible to reflect the datasheet filter on the printed report. For example, you may filter for
a specific course code but the report identifies its source data at learner level and a learner may be
enrolled to several courses.
Where available, by selecting the checkbox on the reports grid printed reports can also be grouped
dynamically by Department.
If there are exclusions then they are indicated in the page footer.
Print
Print selects a printer, number of copies and other options before printing.
Quick print sends the document directly to the default printer without making changes.
Page setup
Scale stretches or shrinks the printed output to a percentage of its actual size.
Margins sets the margin sizes for the entire document.
Orientation switches the pages between portrait and landscape layouts.
Size chooses the paper size of the document.
Navigation
Find shows the Find dialog to find text in the document.
SCORE 2014 User Guide
18 of 28
First page navigates to the first page of the document.
Previous page navigates to the previous page of the document.
Next page navigates to the next page of the document.
Last page navigates to the last page of the document.
Zoom
Show the mouse pointer.
Invoke the Hand tool to manually scroll through pages.
Invoke the Magnifier tool.
Many pages to select the page layout to arrange the document pages in preview.
Zoom out to see more of the page at a reduced size.
Zoom changes the zoom level of the document preview.
Zoom in to get a close-up view of the document.
Background
Page colour chooses a colour for the background of the document pages.
Watermark inserts a ghosted text or image behind the content of a page.
Export
Export the current document in one of the available formats, and save it to the file on a disk.
Export the current document in one of the available formats, and attach it to the email.
Close
Click this button or press F3 to close the report.
SCORE 2014 User Guide
19 of 28
Data grid
The data grid view shows the report source data in a grid format with similar functionality to
the reports list in that you can change column layout and order, apply filters, sort columns and
group data. There are however some important differences:
·
Columns can be frozen in position by clicking on the pin shown in the column header. Frozen
columns remain in place when scrolling left and right.
Exclusion related columns are always fixed at the left.
·
Some items on the ribbon menu are common to the report view but those relating specifically to the
datasheet are shown below:
Filters
Save the current filter.
Apply a saved filter.
Clear all current filters.
Exclusions
Remove all exclusions for the report.
Restore all exclusions for the report to those at the end of the last build.
Notes
Toggle viewing the notes field.
Remove all notes for the report.
Restore all notes for the report to those at the end of the last build.
Layout
Show the column chooser so you can select which fields are shown on the datasheet.
Automatically size all columns to fit the widest content.
Save the current layout.
Apply a layout that has already been saved.
Reset any changes made to the current layout since it was last saved.
Set the current layout to be your favourite layout for the report. Your favourite layout is used as
the default.
SCORE 2014 User Guide
20 of 28
Export
Export to PDF.
Export to Microsoft Excel with Excel 2007(*.xlsx) format as default.
Report
Print the printed report view.
Help
View the latest help documentation at www.drakelane.co.uk (or press F1).
Close
Close the report (or press F3).
Chart
Where available, the chart view shows summarised report source data as an interactive chart.
To drill-down to a specific subset of data just hover over the chart and click. You will then be
taken to the data grid view filtered for the specific subset of data selected. The chart formats
are predefined but numerous settings may be adjusted via the ribbon menu:
Grouping
The data grouping allows you to select how to categorise the chart data.
Format
You can select from the available chart types and where to position the legend.
Show data labels.
Hide data labels.
Show in 3D.
Show in 2D.
Gridlines
Set the visibility of both horizontal and vertical gridlines (major or minor) on the chart.
SCORE 2014 User Guide
21 of 28
Zoom
Drag the slider controls to zoom in or out horizontally or vertically. Check the box to maintain the
existing aspect ratio.
Export
Export the graph directly to PDF.
Utility
Where available, the utility view presents information separately in a dedicated screen. Utilities
are primarily used to present summary financial or statistical data rather than information
about individual learners or enrolments. Once presented, the data can normally be organised,
viewed and exported to different formats if required.
Funding changes between current and previous ILR (195)
Continuous changes to the ILR mean that funding output can vary significantly between consecutive
ILR files and it’s not always obvious what has caused any change in funding.
This utility allows a comparison to be made quickly and easily between funding generated by the
current ILR with that from the previous ILR, summarised at different levels (it is not designed to give a
full audit trail of changes to individual ILR records).
Up to a maximum of three summary levels are available, dependent on the funding model selected:
EFA
SFA
Notes
FundLine
FundLine
Funding line type, taken from the respective FIS data tables LearnerEFAFunding
and LearningDeliverySFAFund.
LearnRefNumber
LearnRefNumber
Learner reference number.
LearnAimRef
Learning aim reference.
Course
Course code, as defined in organisation settings. Not available for EFA as
funding is at learner level.
Department
Department code, as defined in organisation settings. Not available for EFA as
funding is at learner level.
Select the summary levels required from the grouping drop-down lists and click refresh to see
your selections reflected in the grid.
A minimum of two builds with current year data must have been completed before the system
functions as intended. When new current year data is generated during the build, a copy of funding and
enrolment data is taken. During subsequent builds, this process is repeated with existing data from the
previous build still stored. A comparison can then be made between the two consecutive sets of data.
Data is presented in the familiar grid format, with the standard sorting, filtering and field selector
functions available.
SCORE 2014 User Guide
22 of 28
Even without any changes, the summary data is always shown at the bottom of the screen:
Select to display all records, even
those where there are no changes.
SCORE 2014 User Guide
Select to display only those records where
there is a change.
23 of 28
Adjusting report content
Excluding data
Exclusions allow data from individual reports at learner or enrolment level being discounted.
Though not applicable to all reports, exclusions work at learner or enrolment level, not both. In
this way, you can prevent data being reported which you don’t want shown. For example, it
may be that action has already been taken or you are aware of the reasons for it showing on
the report. On some reports we cannot say with certainty that data is wrong or requires
correction, just that further investigation may be required on your part.
Exclusions are stored permanently and are retained between builds, so they only have to be set once.
Exclusions are set at report level on the
datasheet view. The exclude flag is
fixed in place and is always the
leftmost column on the datasheet.
Once excluded the records affected are
coloured yellow. When excluding a
learner all records for that learner on
the report are excluded, as shown in
this example.
When an individual report has exclusions set it is indicated in the report
information bar below the report ribbon menu. The number of exclusions is
also shown on the page footer of the report.
For an overall view, when exclusions are set on any report it is also shown
on the information bar below the main menu ribbon. The numbers of
exclusions are also shown in a separate column on the reports list datasheet.
The setting (or removing) of exclusions is reflected in the learner and enrolment counts in addition to
the optimisation calculations both overall and at individual report level immediately. There is no need
to perform the build again.
Select remove exclusions from the report datasheet ribbon toolbar to remove all exclusions for
the report or just use the excluded flag on individual datasheet rows.
Restores all exclusions for the report to those at the end of the last build.
Adding notes
Notes are optional and can be entered against records on individual reports at learner or
enrolment level. Though they operate independently of exclusions, they could, for example,
indicate the reason why specific records are excluded.
Notes operate in a similar way to exclusions; they are not applicable to all reports and are available to
be entered either at learner or enrolment level, not both.
SCORE 2014 User Guide
24 of 28
This image indicates that a record does not have an associated note. Clicking the image toggles
viewing the notes column, allowing you to add a note.
This image indicates that a record has an associated note. Clicking the image toggles viewing the
notes column.
In addition, selecting show or hide notes from the datasheet ribbon menu toggles viewing the
notes field. When applying notes to a learner the note is automatically repeated against all
records for that learner on the report.
Select remove notes from the report datasheet ribbon toolbar to remove all notes for the report.
You can remove just notes that have associated exclusions, notes without associated exclusions,
or both.
Restores all notes for the report to those at the end of the last build.
Maintaining exclusions and notes
A common screen manages exclusions and notes on an overall basis for every report. Select
exclusions and notes from the maintenance section of the home ribbon toolbar.
In addition to standard menu items, the exclusions and notes data can be imported and
exported in CSV format if required.
SCORE 2014 User Guide
25 of 28
Ribbon menu
The main application menu is in the style of a modern Microsoft Office ribbon toolbar, split into two
tabs:
Home tab
Maintenance
Access the definitions and maintenance for departments and courses within your organisation.
Open the exclusions and notes maintenance screen.
Open reports
This set of buttons performs actions on all currently open reports:
Export to the selected file format.
Close all reports.
Navigation
Navigate to the previous tab in the build process.
Navigate to the next tab in the build process.
Filter
Save the current filter.
Apply a saved filter.
Clear all current filters.
Layout
Apply a layout that has already been saved.
Save the current layout.
Reset any changes made to the current layout since it was last saved.
SCORE 2014 User Guide
26 of 28
Set the current layout to be your favourite layout for the grid. Your favourite layout is used as
the default.
Grid
Remove any filters applied to the reports list grid.
Export the reports list grid to Microsoft Excel.
Exit
Exit the application (or press F3).
Drake Lane Associates
Click to visit our website www.drakelane.co.uk.
Help and support tab
Logs
We may request log files file to assist with any support cases you have open.
Open the latest build log file.
Open today’s application log file.
Help
View the latest help documentation at www.drakelane.co.uk (or press F1).
Send an email to [email protected] using your default email client. Don’t forget there’s
also the feedback option.
SCORE 2014 User Guide
27 of 28
Open the online feedback form to:
·
·
·
·
·
Send us general feedback on the software.
Make a suggestion to change existing features or functionality.
Request a new feature that would help you or other customers.
Report a software bug.
Send some other kind of feedback.
You can also add attachments to any feedback you send. You can still call (sometimes it’s
more appropriate) or email, but this way makes sure we can easily track the many responses
we get.
Application
Check manually for application updates. Application updates are also normally checked for
automatically each day.
Show software version and licensing information.
SCORE 2014 User Guide
28 of 28