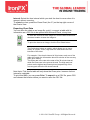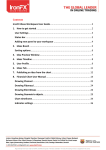
1
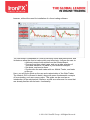
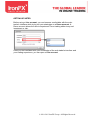
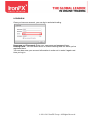
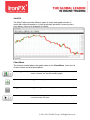
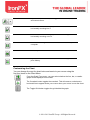
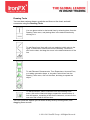
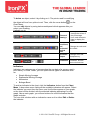
WEB TRADER USER MANUAL © 2010-2013 IronFX Group. All Rights Reserved. Web Trader ..................................................................................................................................................................................... 2 Getting Started ............................................................................................................................................................................... 4 Logging In......................................................................................................................................................................................... 5 The Workspace .............................................................................................................................................................................. 6 Main menu ....................................................................................................................................................................................... 7 File .................................................................................................................................................................................................. 7 Instruments ................................................................................................................................................................................ 8 View ............................................................................................................................................................................................... 8 Quotes View ........................................................................................................................................................................... 9 Advanced View ...................................................................................................................................................................11 Accounts View ....................................................................................................................................................................11 Position View ......................................................................................................................................................................12 Orders View .........................................................................................................................................................................13 History View ........................................................................................................................................................................13 Alerts View ...........................................................................................................................................................................14 Charts View ..........................................................................................................................................................................14 Themes .......................................................................................................................................................................................16 Window ......................................................................................................................................................................................16 Help ..............................................................................................................................................................................................17 Drag and drop...............................................................................................................................................................................18 To place View A inside View B (creation a new tab in existing View): ............................................................18 To change the position of a View:....................................................................................................................................18 Removing an individual View from a tabbed View ..................................................................................................19 Add Instruments .........................................................................................................................................................................20 Managing Positions ....................................................................................................................................................................21 Opening a position .................................................................................................................................................................21 Modifying the position .........................................................................................................................................................21 Closing the position...............................................................................................................................................................22 Managing Orders .........................................................................................................................................................................23 Placing an order ......................................................................................................................................................................23 Modifying and Deleting an order .....................................................................................................................................24 Managing Alerts...........................................................................................................................................................................25 Setting an alert ........................................................................................................................................................................25 Modifying and deleting an alert .......................................................................................................................................25 Charts ...............................................................................................................................................................................................26 Chart Menu ...............................................................................................................................................................................26 Customizing the Chart..........................................................................................................................................................27 Drawing Tools .........................................................................................................................................................................28 Indicators ..................................................................................................................................................................................29 Simple Moving Average ..................................................................................................................................................30 Exponential Moving Average .......................................................................................................................................30 Momentum ...........................................................................................................................................................................30 Bolinger Band .....................................................................................................................................................................31 Adding and Closing ................................................................................................................................................................31 Exporting Chart Data ............................................................................................................................................................32 WEB TRADER Thank you for your interest in the web-based forex trading platform. This trading platform allows you to trade in FX from the convenience of a web- © 2010-2013 IronFX Group. All Rights Reserved. browser, without the need for installation of a forex trading software. The web-trader is adaptable to a user's individual needs and preferences, and its features allow the user to trade quickly and effectively. It allows the user to: • Add and remove Instruments from the Quotes Board. • Choose from three chart types, and use a wide selection of tools and indicators to assist in your technical analysis. • Set alerts, and receive them. • Synchronize the web trader with our Mobile Trader, and trade on-the-go. Here, you will find a guide on the use and customization of the Web Trader. The trader's GUI is covered in detail, along with some fundamental concepts of forex trading, such as currency pairs. This guide can be used as an introduction to the web trader's interface, as well as a reference for users that are already familiar with its basic functionality. © 2010-2013 IronFX Group. All Rights Reserved. GETTING STARTED Before using a Live account, you can become comfortable with the webtrader's interface while trying out your strategies on a Demo account. A Demo account allows the user to experience Forex trading without any real investment or risk. Once you feel confident with your knowledge of the web trader's interface and your trading experience, you can open a Live account. © 2010-2013 IronFX Group. All Rights Reserved. LOGGING IN Once you have an account, you can log in and start trading. Username and Password: Enter your username and password here. Dealing Desk: You can select a live or a demo dealing desk for which you've registered here. You can also save your account information in order not to enter it again next time you log in. © 2010-2013 IronFX Group. All Rights Reserved. THE WORKSPACE The application gives you wide possibilities of customization for your convenience and getting the most of your online trading. You can use default application settings or you can customize it the way you prefer. Customizable interface of Web Trader allows the trader to adjust the look of the application. By modifying the look of the application you can adjust windows, charts and toolbars the way it is convenient for you. You can customize application color, Views sizes, chart type and period, according to your personal requirements. You can also arrange the Views of application as you like by drag-and-drop, customize their locations, place View near each other or in a tabbed View or even hide the ones you don't need. After you customized the application the way you like you can save a Workspace and open it the same way on the different computer. If all open Views do not fit in the application window you can open a new Tab by pressing the “+” button. Write the name of a new Tab. In case you save your workspace all tabs will be saved. © 2010-2013 IronFX Group. All Rights Reserved. MAIN MENU The Main Menu contains the most commonly-used actions. These include creating orders, positions, opening a new chart, subscribing to instruments, loading a desktop profile. File Using File menu you can Reset Workspace, Save Workspace and Logout. Workspace is a great tool for organizing your trading application. It allows you to display and arrange application view according to your needs and preferences. Customize your application appearance and choose Save Workspace. It allows you to have your saved Workspace on any other computer. Reset workspace deletes your saved configurations and takes you to default company’s Workspace. © 2010-2013 IronFX Group. All Rights Reserved. Instruments Menu Instruments allows you to Add or Remove Instruments. Choose Add Instruments and a window will appear, where you can choose which instruments are visible in your application. View The View menu contains commands related to views in the application. From this menu you can open Quote View, Advanced View, Accounts View, Position View, Orders View, History View, Alerts View and Charts View. Note: Clicking any of context popup View menu will open that View. If the view is already open, the new (second, third ect.) view will be open. © 2010-2013 IronFX Group. All Rights Reserved. Quotes View The Quotes tab of the Quota View contains various instrument panels, which can be added to or removed from the board at the user's discretion. © 2010-2013 IronFX Group. All Rights Reserved. About Currency Pairs: A Currency Pair is a quotation describing two currencies valued relative to one another. One is called the base currency, and the other is called the quotation or counter currency. When buying a currency pair, a trader buys the base currency and sells the counter currency. When selling a currency pair, a trader sells the base currency and buys the counter currency. The prices or exchange rates you see are amounts of counter currency needed to buy one unit of the base currency. An instrument panel represents one currency pair, providing some basic information about it: The number's appearing directly below Buy and Sell are the quotations of the current price of buying and selling the currency pair, respectively. Low: The lowest Sell price that the currency attained during the day. High: The highest Buy price that the currency attained during the day. Spread: The difference between the current Buy and Sell price. One click trade – lets you activate one-lick mode. It means that every time you buy or sell, you will not receive confirmation window. You can set amount you want to trade before clicking on the price. To open a buy or sell position, simply click on the "Buy" or "Sell" price for the currency pair you want. You can set the number of lots you want to trade in the dealing rates box before clicking on the price. To switch One Click Trade off just press on its button again. How to add or remove instruments look at paragraph Instruments in Main Menu. You can expand the Quota View to contain two or more columns of quotes. (For more detailed description look at Paragraph Drag and Drop) © 2010-2013 IronFX Group. All Rights Reserved. Advanced View You can view dealing rates in the Advanced View. Here you can see Instruments, Sell and Buy rates and time. Instrument: Chosen currency Sell: Current price for selling Buy: Current price for buying Time: Current time. Accounts View All necessary information about your account(s) can be found in the Account View. The View allows you to view Account number, Trader’s name, Base instrument, Balance, Equity, Margin and Free Margin, Commission, Swap and Profit. Account: A unique number ID assigned to each account. Trader: The name of the person trading. Base Instrument: The currency in which all the information above is displayed. Balance: The total amount of funds in the account, without taking into consideration equity or margin. Equity: Equity is the balance plus the Gross Profit or Loss. This is the same as the Balance if there are no open positions. Margin: The used margin. This represents the amount of funds currently used on the lots of all open positions. If the equity falls below this number, a margin © 2010-2013 IronFX Group. All Rights Reserved. call will be issued. In this situation, you will either need to add to your funds, or liquidate your positions. Free Margin: The amount of money available to open and maintain your positions. Commision: The total money charged for buying and selling lots in all of the account's open positions. Swap: A type of foreign exchange swap consisting of two parts, completed at the same time. One part is a foreign exchange spot trade, and the other is a foreign exchange forward transaction. Profit: The gross profit/loss of the account's positions. Position View Positions View lists all the open positions under the accounts listed in Accounts. Here is a description of each of its columns. Position: The unique ID assigned to the position. Time: The time at which t his position was opened. B/S: Identifies the position as a Buy (B) or a Sell (S) position. Account: The account under which the position is open. Instrument: The Instrument representing the currency pair of the position. Lot: The number of lots involved in the position. Open: The price at which the position was opened. Close: The current price of the instrument, or the price at which the position can be closed currently. Stop Loss: As the name says, it is a price level at which you should stop or limit your loss in a position. Take profit: price at which Web Trader will close your position, to lock in your profit. Commision: The total money charged for buying and selling lots in this position. Swap: A type of foreign exchange swap consisting of two parts, completed at the same time. One part is a foreign exchange spot trade, and the other is a foreign exchange forward transaction. Profit: The gross profit/loss of the position. © 2010-2013 IronFX Group. All Rights Reserved. Orders View Order View lists all the orders placed under the accounts listed in Accounts. Here is a description of each of its columns. Order: A unique ID assigned to each order. Account: The account under which the order is issued. Instrument: The instrument representing the ordered currency pair. Type: The type of order - ES (Entry Stop Order) or EL (Entry Limit order). Lot: The number of lots involved in the order. B/S: Identifies whether the order is to Buy (B) or to Sell (S). Open: The price of the currency pair at the time the order was placed. Stop Loss: As the name says, it is a price level at which you should stop or limit your loss in a position. Take profit: price at which Web Trader will close your position, to lock in your profit. Time: The time and date in which the order was confirmed. You can change the order price by right-clicking on an order, and selecting 'Change Order Rate' from the context menu. Here, enter the new price into the Your Price field, and press Ok. You can also cancel or remove and order by right-clicking it and selecting 'Remove Order'. History View History View lists all the already closed positions under the accounts listed in Accounts. Here is a description of each of its columns. Position: The unique ID assigned to the position. Account: The account under which the position is open. Instrument: The Instrument representing the currency pair of the position. Lot: The number of lots involved in the position. B/S: Identifies the position as a Buy (B) or a Sell (S) position. Open: The price at which the position was opened. Time: The time at which t his position was opened. © 2010-2013 IronFX Group. All Rights Reserved. Close: The current price of the instrument, or the price at which the position can be closed currently. Time: The time at which t his position was closed. Stop Loss: As the name says, it is a price level at which you should stop or limit your loss in a position. Take profit: price at which Web Trader will close your position, to lock in your profit. Commision: The total money charged for buying and selling lots in this position. Swap: A type of foreign exchange swap consisting of two parts, completed at the same time. One part is a foreign exchange spot trade, and the other is a foreign exchange forward transaction. Profit: The final profit of the position. Alerts View Alert View allows you to set the Web Trader alert. It will inform you when a currency pair reaches a certain price. For more detailed information look paragraph Alerts. Alerts: The Alert’s number Instrument: The Instrument that you want Web Trader to alert you about Price: The Price at which you want the Web Trader to send the alert Type: The Buy or Sell type Time: The time at which this Alert was set. Charts View The Web Trader provides different types of charts and graphical tools to assist with technical analysis. A chart graphically presents a currency pair's price history. Here is an example of a chart: © 2010-2013 IronFX Group. All Rights Reserved. For more detailed information look paragraph Charts. © 2010-2013 IronFX Group. All Rights Reserved. Themes You can select one of the six color schemes (Spark, Sky, Cobalt, Desert, Sage or Graphite) by pressing Themes in main menu. You can see what each theme looks like by selecting it and referring to the preview grid. Window Menu Window allows you to create new tabs. To create a Tab, go to the Main Menu and choose New Window. You can also click on a cross button near existing tab. © 2010-2013 IronFX Group. All Rights Reserved. When prompted, give the workspace a name: Click OK to create the new Tab. The new (empty) Tab will appear as a tab underneath the Main Menu: You can now populate the workspace with views. To remove a View from a tabbed group view click on the black “X” button of the application view’s below the Logout button. This will close the current tab. Click yes to confirm closing the Tab. Hint: Once you are done configuring your workspaces, you should save your layout. Help The Help menu contains a link to the user manual, as well as information about the application. © 2010-2013 IronFX Group. All Rights Reserved. DRAG AND DROP To place View A inside View B (creation a new tab in existing View): 1. Move the cursor over the Tab of View A (the left lower corner). Leftclick on the Tab, and hold down the left mouse button. 1. While holding down the left mouse button, drag View A across the screen. The View itself will remain in place; you will be dragging an orange outline of the view with a pointed copy of Tab picture and gray arrow as it is shown on the picture. 2. While still holding the right mouse button, position the cursor near or between existing Tabs of View B. The small orange outline will appear. This indicates that View A is ready to be dropped into View B. 2. Release the mouse button. View A and B are now grouped into one View, with View A on top. Use the tabs to toggle between the Views. You may combine an unlimited number of views into one tabbed view. To change the position of a View: 1. Move the cursor over the Tab of View. Left-click on the Tab, and hold down the left mouse button. © 2010-2013 IronFX Group. All Rights Reserved. 2. While holding down the left mouse button, drag View across the screen. The View itself will remain in place; you will be dragging an orange outline of the View with a pointed copy of Tab picture and gray arrow as it is shown on the picture. 3. While still holding the right mouse button, position the cursor in the desired place of application window. The orange outline will become smaller and “snap” into the new position of application window. This indicates that View is ready to be dropped in a new position. 4. Release the mouse button. Now the View is placed in a different position. It might be small and show not entire information. 5. To adjust the View size place cursor between the borders of Views in a place where you can see sign showed on the picture below. Left-click on this sign and move the cursor in the desired place. Release the mouse button. Removing an individual View from a tabbed View To remove a View from a tabbed group View click on the black “X” button of the view’s header. This will close the selected View. © 2010-2013 IronFX Group. All Rights Reserved. Add Instruments If you want to add or remove an instrument, please go to Instruments of the Main Menu, then select Add Instruments of the context popup menu. In the opened window tick the boxes of the instruments you would like to add to your Quotes View. Once selected the instruments, click on the Save button. © 2010-2013 IronFX Group. All Rights Reserved. MANAGING POSITIONS Positions lists all the open positions under the accounts listed in Accounts. A description of each of its columns you can find in the paragraph Main Menu – View - Positions. Opening a position To open a position from the Quote View, double-click on a buy or sell rate, this will open the New Order dialog. Choose Instant Execution tab, select your account number, Instrument (Symbol), Volume, Stop Loss and Take Profit prices and click Buy or Sell. Account: This allows you to select the account under which to place the order. Symbol: Here, you can select the instrument you want to trade. Volume: Enter the number of lots you want to trade. Stop Loss: Enter the target price at which the position will be closed if the Stop loss level is hit. Take profit: Enter the target price at which the position will be closed if the Take profit level is hit. Modifying the position You can modify the Stop Loss/Stop Order price by double clicking the position, selecting Modify Position and entering the new price for Stop Loss/Stop Profit at any time. To modify a position's limit price, just like for stop loss, double click the position again, select Modify Position and enter the new price for Take Profit/Limit Order. © 2010-2013 IronFX Group. All Rights Reserved. Account: The account under which your position is placed. Symbol: The instrument you trade. Open: The price at which the position was opened. Type: Type of the position (Buy or Sell position). Volume: The number of lots you trade. After Volume you can see a current price Stop Loss: Enter the target price at which the position will be closed if the Stop loss level is hit. Take profit: Enter the target price at which the position will be closed if the Take profit level is hit. Closing the position Suppose you want the Web Trader to sell your currency pair if the price drops to a certain point, to protect you from increasing losses. You can have the Web Trader close your position automatically if the price falls to a certain point by placing a Stop order on your position. To do this, double click on a position in the Positions View, you will see a Position Operation Window, where you can enter the number of lots you want to close. Click OK to close the position. Account: The account under which your position is placed. Symbol: The instrument you trade. Open: The price at which the position was opened. Type: Type of the position (Buy or Sell position). Volume: Enter the number of lots you want to close. After Volume you can see a current price © 2010-2013 IronFX Group. All Rights Reserved. MANAGING ORDERS Orders lists all the open orders under the accounts listed in Accounts. A description of each of its columns you can find in the paragraph Main Menu – View - Orders. Placing an order To place an order on a currency pair, double-click on the corresponding instrument panel. You will see a New Order Window. Press Place to place an order. Account: This allows you to select the account under which to place the order. Symbol: Here, you can select the instrument you want to trade. Volume: Enter the number of lots you want to trade. Stop Loss: Enter the target price at which the position will be closed if the Stop loss level is hit. Take profit: Enter the target price at which the position will be closed if the Take profit level is hit. Type Buy Stop: An order to buy the currency pair at a specified price that is above the current market price. Sell Stop: An order to sell the currency pair at a specified price that is below the current market price. Buy Limit: An order to buy the currency pair at a specified price that is below the current market price. Sell Limit: An order to sell the currency pair at a specified price that is above the current market price. Open Price: The price at which you would like the order to be executed. © 2010-2013 IronFX Group. All Rights Reserved. Modifying and Deleting an order You can modify the Stop Loss/Stop Order price by double clicking the order, selecting Stop Loss/Stop Profit and entering the new price at any time. To modify a orders's limit price, just like for stop loss, double click the order again, select Take Profit/Limit Order and enter the new price. In the same window you can change the price at which the order will be executed. Press OK to apply Modifying. To Delete an Order Press Delete Order. Account: This allows you to select the account under which to place the order. Symbol: Here, you can select the instrument you want to trade. Volume: Enter the number of lots you want to trade. Stop Loss: Enter the target price at which the position will be closed if the Stop loss level is hit. Take profit: Enter the target price at which the position will be closed if the Take profit level is hit. © 2010-2013 IronFX Group. All Rights Reserved. MANAGING ALERTS You can have the Web Trader alert you when a currency pair reaches a certain price. Setting an alert To set an alert, go to the Quotes View and double click the button with the price. You will see the New order window appear: Go to Alert tab to set a new alert. Symbol (Instrument): The Instrument that you want Web Trader to alert you about. Price: The Buy or Sell price at which you want the Web Trader to send the alert. Modifying and deleting an alert You can edit the alert by double clicking on the Alert in Alert View and changing the Alert Price to the desired. After you are satisfied with the alert's parameters, press 'Ok'. To remove an alert, double click on the Alert in Alert View and press Delete. Symbol (Instrument): The Instrument that you want Web Trader to alert you about. Price: The Buy or Sell price at which you want the Web Trader to send the alert. © 2010-2013 IronFX Group. All Rights Reserved. CHARTS The Web Trader provides different types of charts and graphical tools to assist with technical analysis. A chart graphically presents a currency pair's price history. Here is an example of a chart: Chart Menu The buttons located above the graph make up the Chart Menu. Here is a list of their names and brief descriptions: Graph Type A menu for selecting the type of graph displayed on the chart. Contains line, bar and candle graphs. Crosshair Toggles the display of a crosshair beneath the cursor. Toggle Grid Toggles the grid behind the graph. Draw Tools A menu containing various tools for drawing and placing comments onto the chart. © 2010-2013 IronFX Group. All Rights Reserved. Indicators Opens a list of indicators, allowing you to customize, use, and remove them. Zoom In Makes the time interval displayed on the chart shorter, horizontally zooming into it. Zoom Out Makes the time interval displayed on the chart longer, horizontally zooming out of it. Save Saves a PNG image of the chart in its current state to your computer. Print Prints a picture of the chart in its current state. Database Opens a table with information about the currency pair's price history. Customizing the Chart You can change the way the chart looks and reacts to your cursor using the first four items on the Chart Menu. From the Graph Type menu, you can select whether the line, bar, or candle graph will be displayed on the chart. The Crosshair button toggles the crosshair. This will cause a vertical and a horizontal line to appear under your cursor when your cursor is over the chart. The Toggle Grid button toggles the grid behind the graph. © 2010-2013 IronFX Group. All Rights Reserved. Drawing Tools You can draw various shapes, symbols and lines on the chart, and add comments using the Drawing Tools. You can place vertical or horizontal lines by selecting them from the Drawing Tools menu, and placing them in the desired location by clicking on it. To add Gann lines (lines with only one endpoint, which point to the right), or trend lines, select them from the Drawing Tools menu, click on the chart, and drag the cursor in the desired direction of the line. To add Fibonacci Retracements, Time Expansions, Arcs and Fans, or to add a geometric shape, or a symbol, select them from the Drawing Tools menu, click on the chart, and drag to expand the object. To add a comment, select 'Comment' from the Drawing Tools menu, click on the chart and drag to expand the comment box. A form will appear, containing a field for the comment, a menu for the text color and a field for the text size. You can move the objects you've drawn at any time by clicking them, and dragging them around. © 2010-2013 IronFX Group. All Rights Reserved. To delete an object, select it by clicking on it. The points used for modifying the object will turn from yellow to red. Then, click the cross button on the Chart Menu. You can edit objects by using instrumental panel which appears after you select your Drawing. It allows you to: Fibonacci drawings Change lines width, change the colors of the percentage lines, and choose to hide or display the label. Gann lines, trend lines, and horizontal/ vertical lines Change the color and line width. Geometric shapes Change color and transparency. Comments Change the comment, and the text color and size. Indicators Indicators are various ways of representing the raw data of a currency pair's price history. In Web Trader, you can open various types of indicators such as: Simple Moving Average Exponential Moving Average Momentum Bolinger Band To add an indicator to the chart, click the Indicators button from the Chart Menu. A drop-down menu listing all the available indicators will appear. Select the indicator you want from the menu, and it will either appear on your graph, or the chart will be divided, with the selected indicator appearing in a new graph. Above each graph, you will see buttons for all the indicators that the graph includes. You can click a button with an indicator's name on it to either Edit or Delete the indicator. © 2010-2013 IronFX Group. All Rights Reserved. Clicking Edit will allow you to customize the appearance of the indicator graph. Delete will remove the indicator. Simple Moving Average Moving Average is an indicator that shows the average price within a defined time period. There are two types of Moving Averages: Simple MA, Exponential MA. They differ from each other only in terms of the weight coefficients that are assigned to the latest data. A simple, or arithmetic, moving average that is calculated by adding the closing price of the security for a number of time periods and then dividing this total by the number of time periods. Short-term averages respond quickly to changes in the price of the underlying, while long-term averages are slow to react. Methods of use Moving Average Indicator: 1. When the instrument price rises above its MA, it is a signal to buy 2. When the price falls below its MA it is a signal to sell. 3. The direction of MA gives an idea of whether there is a bearish or bullish trend on the market. Exponential Moving Average Moving Average is an indicator that shows the average price within a defined time period. There are two types of Moving Averages: Simple MA, Exponential MA. They differ from each other only in terms of the weight coefficients that are assigned to the latest data. A type of moving average that is similar to a simple moving average, except that more weight is given to the latest data. The exponential moving average is also known as "exponentially weighted moving average" . Methods of use Moving Average Indicator: 1. When the instrument price rises above its MA, it is a signal to buy 2. When the price falls below its MA it is a signal to sell. 3. The direction of MA gives an idea of whether there is a bearish or bullish trend on the market. Momentum Momentum is an indicator/oscillator that measures the rate of change in currency prices. It evaluates the difference between today's closing price and the closing price ”n” days ago. Usually a 10-days period is used for the calculation of this indicator. In this case momentum is calculated by taking the © 2010-2013 IronFX Group. All Rights Reserved. current closing price, subtracting the price 10 days ago, and plotting the results around the zero line. The results plotted can be negative when the current price is lower than oldest price or positive when the current price is greater than the oldest price. Momentum also can be used as a trend-following indicator. A signal to buy occurs when the indicator reaches the bottom of a downward curve and then begins to grow; a signal to sell occurs when the indicator reaches the top of an upward curve and then begins to decline. As a forerunning indicator it can be used when the proximity of the market to top/bottom is accompanied by the drastic surge of the indicator, following by a decline in the value of the indicator while the rates continue to rise/fall or move horizontally. In such a case divergence takes place. Methods of use: 1. When the indicator reaches the bottom of a downward curve and begins to grow, it is a signal to buy. 2. When the indicator reaches the top of an upward curve, it is a signal to sell. Bolinger Band Bollinger Bands (BB) is an indicator that compares volatility and relative price levels over a period of time. Bollinger Bands adjust to the market conditions. As soon as the market becomes more volatile, the bands widen; they contract during less volatile times. The use of Bollinger Bands is based on the fact that prices usually remain within the limits of upper and lower borders. BB are mostly used for determining if the current value of a data field is behaving normally or breaking out in another direction. BB can also be used for identifying when trend reversals should be expected. The variable width of BB is caused by the volatility of prices. Methods of use: 1. Sharp changes in price take place after the channel narrows. 2. If prices cross the border, it is a signal that the current trend will continue(A). 3. A price move that originates at one border tends to go all the way to the other border(B). Adding and Closing To open a new chart, go to Main Menu and choose Charts. This will allow you to select the Instrument and Interval of your chart, and create a new chart with a bar graph. You can open more than one chart at a time. All your charts will be accessible either through tabs in the bottom of the chart View or will be placed near each other or any other position you choose. Instrument: Select the instrument which you wish to open a chart for. © 2010-2013 IronFX Group. All Rights Reserved. Interval: Select the time interval which you wish the chart to cover when it is opened, without zooming. To close the chart, press the Close Chart (the 'X') on the top right corner of the Charts View. Exporting Chart Data You can save the chart as an image file, print it, or export a table with its information as a CSV file to be opened with Microsoft Excel, at any time. To save the chart as a PNG image file, click the Save button and choose a location to save the image to. To print the chart as an image, click the Print Chart button. The final button brings up a table, which allows you to view a history of a Open, Close, High and Low rates within the time intervals of the chart. For example, if the chart's interval is 30 minutes, each row of the table will contain the information about 30 minutes of the currency pair's price history. The Open rate is the rate at the start of the 30 minute interval, while the Close rate is the price at its end. The High and Low prices are the highest and lowest prices (respectively) of the currency pair within the 30 minute interval. Note that a Tick chart's table will only show the Close price, because its time interval is negligible. To print this table, you can press Print. To export it as a CSV file, press CSV and choose the location where you want to save the CSV file. © 2010-2013 IronFX Group. All Rights Reserved.