1
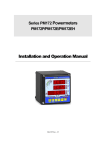
Series PM175 Powermeter and
Power Quality Analyzer
Installation and Operation Manual
BG0415 Rev. A2
LIMITED WARRANTY
The manufacturer offers the customer a 24-month functional warranty on the instrument for
faulty workmanship or parts from date of dispatch from the distributor. In all cases, this
warranty is valid for 36 months from the date of production. This warranty is on a return to
factory basis.
The manufacturer does not accept liability for any damage caused by instrument
malfunction. The manufacturer accepts no responsibility for the suitability of the instrument
to the application for which it was purchased.
Failure to install, set up or operate the instrument according to the instructions herein will
void the warranty.
Only a duly authorized representative of the manufacturer may open your instrument. The
unit should only be opened in a fully anti-static environment. Failure to do so may damage
the electronic components and will void the warranty.
The greatest care has been taken to manufacture and calibrate your instrument. However,
these instructions do not cover all possible contingencies that may arise during installation,
operation or maintenance, and all details and variations of this equipment are not covered
by these instructions.
For additional information regarding installation, operation or maintenance of this
instrument, contact the manufacturer or your local representative or distributor.
WARNING
Read the instructions in this manual before performing installation, and take note of the
following precautions:
Ensure that all incoming AC power and other power sources are turned
OFF before performing any work on the instrument. Failure to do so may
result in serious or even fatal injury and/or equipment damage.
Before connecting the instrument to the power source, check the labels
on the back of the instrument to ensure that your instrument is equipped
with the appropriate power supply voltage, input voltages and currents.
Under no circumstances should the instrument be connected to a
power source if it is damaged.
To prevent potential fire or shock hazard, do not expose the
instrument to rain or moisture.
The secondary of an external current transformer must never be allowed
to be open circuit when the primary is energized. An open circuit can
cause high voltages, possibly resulting in equipment damage, fire and
even serious or fatal injury. Ensure that the current transformer wiring is
secured using an external strain relief to reduce mechanical strain on
the screw terminals, if necessary.
Only qualified personnel familiar with the instrument and its associated
electrical equipment must perform setup procedures.
Do not open the instrument under any circumstances when it is
connected to a power source.
Do not use the instrument for primary protection functions where failure
of the device can cause fire, injury or death. The instrument can only be
used for secondary protection if needed.
Read this manual thoroughly before connecting the device to the current carrying circuits.
During operation of the device, hazardous voltages are present on input terminals. Failure
to observe precautions can result in serious or even fatal injury or damage to equipment.
All trademarks are property of their respective owners.
Copyright © 2006
2
Series PM175 Powermeters
Chapter 1 General Information
Table of Contents
Chapter 1
General Information......................................................... 6
Chapter 2
Installation...................................................................... 10
Mechanical Installation ................................................................................... 10
Panel Mounting ........................................................................................................ 10
DIN Rail Mounting .................................................................................................... 13
Remote Display Installation............................................................................ 14
Mechanical Installation ............................................................................................. 14
Electrical Connection ................................................................................................ 16
Electrical Installation....................................................................................... 17
Typical Installation ................................................................................................... 17
Terminals ................................................................................................................ 18
Power Source Connection ......................................................................................... 18
Chassis Ground Connection....................................................................................... 18
Wiring Diagrams ...................................................................................................... 19
I/O Connections ............................................................................................... 24
Relay Outputs .......................................................................................................... 24
Digital Inputs ........................................................................................................... 24
Analog Outputs ........................................................................................................ 25
Analog Inputs .......................................................................................................... 25
Communications Connections....................................................................... 26
COM1
COM1
COM1
COM1
COM2
RS-232 Connection ......................................................................................... 26
RS-422/485 Connection .................................................................................. 27
Dial Up Modem Connection ............................................................................. 28
Ethernet Connection ....................................................................................... 28
RS-422/485 Connection .................................................................................. 29
Chapter 3
Display Operations ........................................................ 31
Indicators and Controls .................................................................................. 31
Numeric LED Display ................................................................................................ 31
Load Bar Graph........................................................................................................ 31
Energy Pulse LED ..................................................................................................... 31
Port Activity LEDs.....................................................................................................32
Navigation Buttons ................................................................................................... 32
Data Display ..................................................................................................... 32
Display Features ...................................................................................................... 32
Navigation Buttons ................................................................................................... 33
Simple Reset of Accumulated Data ............................................................................ 33
Common Measurements Display................................................................................ 34
Min/Max and Max. Demands Display ......................................................................... 35
Power Quality/Harmonics Display .............................................................................. 35
Energy Display ......................................................................................................... 36
Status Display .................................................................................................. 38
Using the Menus .............................................................................................. 39
Navigation Buttons ................................................................................................... 39
Selecting Menus ....................................................................................................... 39
Entering the Password.............................................................................................. 39
Selecting a Menu Entry............................................................................................. 40
Viewing and Changing Setup Items ........................................................................... 40
Menu Operations ............................................................................................. 41
Basic Device Settings................................................................................................ 41
Device Options......................................................................................................... 43
Communication Ports ............................................................................................... 43
Series PM175 Powermeters
3
Chapter 1 General Information
Network Address...................................................................................................... 45
Counters Setup ........................................................................................................ 45
Control Setpoint Setup.............................................................................................. 46
Analog Inputs Setup................................................................................................. 47
Analog Outputs Setup............................................................................................... 48
Timers Setup ........................................................................................................... 48
Display Setup........................................................................................................... 49
Meter Security.......................................................................................................... 50
Setting the Device Clock ........................................................................................... 51
Resetting Accumulators and Maximum Demands........................................................ 52
Chapter 4
PAS Application Software............................................. 53
Configuration Database .................................................................................. 53
Setting up Communications........................................................................... 53
Communicating through a Serial Port ........................................................................ 54
Communicating through a Dial-up Modem ................................................................. 55
Communicating through the Internet......................................................................... 55
Setting Up the Meter........................................................................................ 56
Downloading Setup to the Meter ............................................................................... 56
Uploading Setup from the Meter ............................................................................... 56
Authorization.................................................................................................... 56
Configuring Communications in your Meter ................................................ 57
Setting Up Communication Ports ............................................................................... 57
Setting Up the Ethernet ............................................................................................ 57
General Meter Setup........................................................................................ 58
Basic Meter Setup .................................................................................................... 58
Device Options......................................................................................................... 60
Local Settings .......................................................................................................... 62
Using Digital Inputs.................................................................................................. 63
Using Relay Outputs ................................................................................................. 64
Programming Analog Inputs ..................................................................................... 66
Programming Analog Outputs ................................................................................... 67
Using Counters ........................................................................................................ 69
Using Periodic Timers ............................................................................................... 70
Using Control Setpoints ............................................................................................ 70
Configuring Summary Energy and TOU Registers ...................................... 74
Setting up Total and Tariff Registers ......................................................................... 74
Configuring the Daily Tariff Schedule......................................................................... 75
Configuring the Season Tariff Schedule ..................................................................... 76
Configuring Recorders.................................................................................... 78
Configuring
Configuring
Configuring
Configuring
Device Memory ...................................................................................... 78
the Event Recorder................................................................................. 80
the Data Recorder .................................................................................. 80
the Waveform Recorder.......................................................................... 83
EN50160 Evaluation and Recording .............................................................. 86
EN50160 Background ............................................................................................... 86
Evaluation Techniques.............................................................................................. 87
Methods of Evaluation .............................................................................................. 88
Configuring the EN50160 Recorders .......................................................................... 93
EN50160 PQ Recorder Setup..................................................................................... 94
EN50160 Harmonics Limits Setup .............................................................................. 96
EN50160 Advanced Setup......................................................................................... 96
Clearing EN50160 Evaluation Counters ...................................................................... 98
Remote Device Control ................................................................................... 98
Remote Relay Control............................................................................................... 98
Event Flags.............................................................................................................. 99
Device Diagnostics ................................................................................................. 100
Updating the Clock ................................................................................................. 100
Resetting Accumulators and Clearing Log Files......................................................... 100
4
Series PM175 Powermeters
Chapter 1 General Information
Administration ............................................................................................... 101
Changing a Password ............................................................................................. 101
Upgrading Device Firmware ......................................................................... 102
Monitoring Devices........................................................................................ 104
Viewing Real-time Data .......................................................................................... 104
Viewing Min/Max Log ............................................................................................. 104
Viewing Real-time Waveforms................................................................................. 104
Retrieving Log Files ...................................................................................... 105
Retrieving Recorded Data ....................................................................................... 105
Retrieving EN50160 Statistics Files .......................................................................... 105
Viewing Recorded Files ................................................................................ 106
Viewing
Viewing
Viewing
Viewing
Viewing
Options ..................................................................................................... 106
the EN50160 Power Quality Event Log ........................................................ 107
the EN50160 Compliance Report ................................................................ 109
the EN50160 Online Statistics Report .......................................................... 112
the EN50160 Harmonics Survey Report ....................................................... 112
Appendix A
Technical Specifications.......................................... 113
Appendix B
Parameters for Analog Output ................................ 118
Appendix C
Setpoint Triggers and Actions ................................ 119
Appendix D
Parameters for Monitoring and Data Logging ....... 123
Appendix E
EN50160 Statistics Log Files ................................... 132
Series PM175 Powermeters
5
Chapter 1 General Information
Mechanical Installation
Chapter 1 General Information
The PM175 is a compact, multi-function, three-phase AC powermeter and
power quality analyzer specially designed to meet the requirements of users
ranging from electrical panel builders to substation operators.
Bright 3-row LED display provides easy local meter readings. The display
module is freely detachable and can be located at a distance of up to 1000
meters from the device.
Two communication ports allow local and remote automatic meter readings
and setup though the supplemental communication or user data acquisition
software. Different communication options are available for remote
communications with the meter including public telephone lines, LAN and the
Internet.
Features:
6
•
3 voltage and 3 current transformer-isolated AC
inputs for direct connection to power line or via
potential and current transformers
•
Multi-function 3-phase meter (true RMS, volts, amps,
power, power factor, neutral current, voltage and
current unbalance, frequency)
•
Embedded harmonic analyzer, voltage and current
THD, current TDD and K-Factor, inter-harmonics
THD, up to 50th order harmonic
•
Voltage and current harmonic spectrum and angles
•
Ampere/Volt/THD/TDD demand meter
•
Class 0.2 four-quadrant energy meter
•
Time-of-Use (TOU), 8 totalization and tariff
energy/demand registers x 8 tariffs, 4 seasons x 4
types of days, 8 tariff changes per day, easy
programmable tariff schedule
•
Automatic daily profile for energy and maximum
demand readings (total and tariff registers)
•
Embedded programmable controller; 16 control
setpoints; programmable thresholds and delays; relay
output control; 1/2-cycle response time
•
Event recorder for logging internal diagnostics
events, control events and I/O operations
Series PM175 Powermeters
Chapter 1 General Information
Mechanical Installation
•
16 data recorders; programmable data logs on a
periodic basis and on any internal and external
trigger
•
Two waveform recorders; simultaneous 6-channel
AC recording in a single plot; sampling rate of 32, 64
and 128 samples per cycle; 20 pre-fault cycles; up to
30 seconds of continuous recording at a rate of 32
samples per cycle
•
EN50160 Power Quality recorder (EN50160
compliance statistics, EN50160 harmonics survey
statistics, onboard power quality analyzer;
programmable thresholds and hysteresis; ready-foruse reports)
•
Real-time waveform capture and monitoring;
simultaneous 6-channel 4-cycle capture at 128
samples per cycle
•
Easy to read 3-row (2x4 characters + 1x6 characters)
bright LED display, adjustable update time, autoscroll option with adjustable page exposition time,
auto-return to a default page
•
LED bar graph showing percent load with respect to
user-definable nominal load current
•
Detachable display module with a 3-wire RS-485
interface; up to 1000 meters operation
•
2 digital inputs for monitoring external contacts, and
receiving pulses from energy, water and gas meters
•
2 relay outputs for alarms and controls, and for output
energy pulses
•
2 optional optically isolated analog outputs with an
internal power supply; options for 0-20mA, 4-20mA,
0-1mA, and ± 1mA output
•
2 optional optically isolated analog inputs with an
internal power supply; options for 0-20mA, 4-20mA,
0-1mA, and ± 1mA input
•
50/60 Hz operation
•
Precise internal clock with battery backup
•
1 Mbyte RAM with battery backup for long-term data
and waveform recording
•
Two communication ports; communications options
available:
COM1:
RS-232/RS-422/RS-485
56K Dial-up modem
Ethernet 10/100BaseT, eXpertPower™
enabled
COM2:
RS-422/RS-485
Series PM175 Powermeters
•
Modbus RTU, Modbus ASCII and Modbus/TCP
communication protocols
•
Easy field upgrading device firmware through any
communication port
7
Chapter 1 General Information
Mechanical Installation
Measured Parameters
Parameter
1-cycle Real-time Measurements
RMS Voltage per phase
RMS Current per phase
kW per phase
kvar per phase
kVA per phase
Power Factor per phase
Total kW
Total kvar
Total kVA
Frequency
Neutral Current
Total Power Factor
Voltage & Current unbalance
1-sec Average Measurements
RMS Voltage per phase
RMS Current per phase
kW per phase
kvar per phase
kVA per phase
Power Factor per phase
Total kW
Total kvar
Total kVA
Total Power Factor
Frequency
Neutral Current
Voltage & Current unbalance
Amps & Volt Demands
Ampere & Volt Demand per phase
Ampere Maximum Demand per phase
Voltage Maximum Demand per phase
Power Demands
kW Accumulated Demand Import & Export
kvar Accumulated Demand Import & Export
kVA Accumulated Demand
kW Demand Import & Export
kvar Demand Import & Export
kVA Demand
kW Sliding Demand Import & Export
kvar Sliding Demand Import & Export
kVA Sliding Demand
kW Predicted Demand Import & Export
kvar Predicted Demand Import & Export
kVA Predicted Demand
kW Maximum Demand Import
kW Maximum Demand Export
kvar Maximum Demand Import
kvar Maximum Demand Export
kVA Maximum Demand
Total Energy
Total kWh Import & Export
Total kvarh Import & Export
Total kvarh Net
Total kVAh
Energy per Phase
kWh Import per phase
kvarh Import per phase
kVAh per phase
TOU Registers
8 TOU energy registers (kWh and kvarh
import & export, kVAh, 2 pulse sources)
8 TOU maximum demand registers
8 tariffs, 4 seasons x 4 types of day
8
Display Comm. Analog Pulse Alarm
3
3
3
3
3
3
3
3
3
3
3
3
3
3
3
3
3
3
3
3
3
3
3
3
3
3
3
3
3
3
3
3
3
3
3
3
3
3
3
3
3
3
3
3
3
3
3
3
3
3
3
3
3
3
3
3
3
3
3
3
3
3
3
3
3
3
3
3
3
3
3
3
3
3
3
3
3
3
3
3
3
3
3
3
3
3
3
3
3
3
3
3
3
3
3
3
3
3
3
3
3
3
3
3
3
3
3
3
3
3
3
3
3
3
3
3
3
3
3
3
3
3
3
3
3
3
3
3
3
3
3
3
3
3
3
3
3
3
3
3
3
3
3
3
Series PM175 Powermeters
Chapter 1 General Information
Parameter
Harmonic Measurements
Voltage THD per phase
Current THD per phase
Current TDD per phase
K-factor per phase
Voltage harmonics per phase up to order 50
Current harmonics per phase up to order 50
Voltage harmonic angles up to order 50
Current harmonic angles up to order 50
Fundamental Component
Voltage and Current per phase
kW, PF per phase
kvar, KVA per phase
Total kW, PF
Total kvar, KVA
Min/Max Logging
Min/Max A, V, total kW, kvar, kVA, PF
Min/Max Frequency, Neutral current
Min/Max THD, TDD, K-Factor per phase
Phase Rotation
Voltage and Current Phase Angles
Day and Time
Pulse Counters
Analog Inputs (optional)
Digital Inputs
Relay Outputs
Remote Relay Control
Alarm Triggers/Setpoints
Self-diagnostics
Series PM175 Powermeters
Mechanical Installation
Display Comm. Analog Pulse Alarm
3
3
3
3
3
3
3
3
3
3
3
3
3
3
3
3
3
3
3
3
3
3
3
3
3
3
3
3
3
3
3
3
3
3
3
3
3
3
3
3
3
3
3
3
3
3
3
3
3
3
3
3
3
3
3
3
3
9
Chapter 2 Installation
Mechanical Installation
Chapter 2 Installation
Mechanical Installation
Panel Mounting
Figure 2-1 Dimensions
Figure 2-2 STEP 1 (ANSI 4" round cutout): Mount the display module in cutout
10
Series PM175 Powermeters
Chapter 2 Installation
Mechanical Installation
Figure 2-3 STEP 1 (DIN 92x92mm square cutout): Mount the display module in cutout
Figure 2-4 STEP 2: Assemble the four locating studs
Series PM175 Powermeters
11
Chapter 2 Installation
Mechanical Installation
Figure 2-5 STEP 3: Slide and position the meter on locating studs
Figure 2-6 STEP 4: Affix the meter using the thumb nuts
12
Series PM175 Powermeters
Chapter 2 Installation
Mechanical Installation
DIN Rail Mounting
The PM175 can be mounted on a 35-mm DIN rail. The display module is
mounted separately on the switchboard panel and is connected to the meter
by a communication cable (see Remote Display Installation).
FRONT VIEW
SIDE VIEW
BG0386-1
Figure 2-7 Dimensioons
DIN RAIL
BG0386-2
Figure 2-8 DIN rail mounting
Series PM175 Powermeters
13
Chapter 2 Installation
Remote Display Installation
Remote Display Installation
Mechanical Installation
Standard Cutouts
(ANSI 4" round or DIN 92x92 mm square)
Figure 2-9 Display cutout dimensions
STEP 1: Insert the display module into cutout.
STEP 2: Fasten washers and nut on screws.
Figure 2-10 ANSI 4" or DIN 92x92 mm display mounting
14
Series PM175 Powermeters
Chapter 2 Installation
Remote Display Installation
Special Cutout
Figure 2-11 Panel cutout dimensions
Figure 2-12 Display mounting
Series PM175 Powermeters
15
Chapter 2 Installation
Remote Display Installation
Electrical Connection
The remote display is connected to the meter via a 3-wire or 5-wire
communication cable provided with two 15-pin D-type connectors.
At distances of up to 100 m, the display receives power through the
communication cable directly from the meter. Connect pins 1 and 8 on both
sides as shown in Figure 2-13.
At distances above 100 m, supply power from a separate 12V DC power
source (a 12V AC/DC adapter can be used). Connect the positive wire to pin
1 and the negative wire to pin 8 as shown in Figure 2-14.
Pin
1
5
7
8
15
Signal
+12V
RS-485 + (plus)
RS-485 – (minus)
GND
Chassis ground
Figure 2-13 Self-powered remote display connection
Figure 2-14 Remote display powered from a 12V DC power source
16
Series PM175 Powermeters
Chapter 2 Installation
Electrical Installation
Electrical Installation
Before installation ensure that all incoming power sources are shut OFF.
Failure to observe this practice can result in serious or even fatal injury and
damage to equipment.
Typical Installation
DIGITAL INPUTS
+ - + 2
1
ANALOG INPUTS
ANALOG OUTPUTS
COM.1
RELAYS
COM.2
Figure 2-15 Typical Installation
Series PM175 Powermeters
17
Chapter 2 Installation
Electrical Installation
Terminals
Relay Outputs
Analog Inputs/Outputs
AC Current Inputs
Digital
Inputs
18 19 20
1 2
DIGITAL INPUTS
26 27 28 29
1
2
21 22 23 24 25
+ - + 2
1
ANALOG INPUTS
ANALOG OUTPUTS
RELAYS + 1
1
- 3
2
V1
5
V2
8
V3
AC Voltage
Inputs
COM1 Port
11
VN
COM2 Port
O 1A CT. 690V
P 5A CT. OPT.U
POWER SUPPLY
CALIBRATED AT :
90-264VAC
T
50/60Hz
25 Hz
50 Hz
STANDARD
I 60 Hz 400 Hz
85-290VDC
10W
O ANALOG IN/OUT :
(12) 10-16VDC
+1mA
LOW DC N
(24) 18-36VDC
0-20mA
S 0-1mA
(48) 36-72VDC
S/N
COM.1 :
4-20mA
RS-232/422/485 STANDARD
ETHERNET
MODEM
PROFIBUS
COM.1
5
9
1
6
+ 4
2
- 6
+ 7
3
- 9
ATTENTION
Static-Sensitive
Devices
Handle Only at
Static-Safe
Workstations
N/- 10
POWER SUPPLY
COM.2
L/+ 12
RS-422/RS-485
-TX -RX +TX +RX
13 14 15 16 17
Chassis Ground
Power Supply
Figure 2-16 Terminals - Rear View
Power Source Connection
Before connecting your meter to the power source, check the label on the
back of the device to ensure that it is equipped with the appropriate power
supply.
The power source can be dedicated-fused, or from a monitored voltage if it is
within the instrument power supply range.
AC power supply: connect the line wire to terminal 12 and the neutral wire to
terminal 10.
DC power supply: connect the positive wire to terminal 12 and the negative
wire to terminal 10.
Chassis Ground Connection
Connect the chassis ground of the device to the switchgear earth ground
using a dedicated wire greater than 2 mm2/14 AWG.
18
Series PM175 Powermeters
Chapter 2 Installation
Electrical Installation
Wiring Diagrams
For AC input ratings, see “Technical Specifications” in Appendix A.
The following wiring configurations are available in the meter:
Wiring Configuration
(See Basic Device Settings in Chapter 3)
Setup Code
Figure
3-wire 2-element Direct connection using 2 CTs
3dir2
2-17
4-wire Wye 3-element direct connection using 3 CTs
4Ln3 or 4LL3
2-18
4-wire Wye 3-element connection using 3 PTs, 3 CTs
4Ln3 or 4LL3
2-19
3-wire 2-element Open Delta connection using 2 PTs, 2 CTs
3OP2
2-20
4-wire Wye 2½ -element connection using 2 PTs, 3 CTs
3Ln3 or 3LL3
2-21
3-wire 2½ -element Open Delta connection using 2 PTs, 3 CTs
3OP3
2-22
4-wire 3-element Delta direct connection using 3 CTs
4Ln3 or 4LL3
2-23
3-wire 2½-element Broken Delta connection using 2 PTs, 3 CTs
3bLn3 or 3bLL3
2-24
Figure 2-17 3-Wire 2-Element Direct Connection Using 2 CTs.
Wiring Mode = 3dir2
Series PM175 Powermeters
19
Chapter 2 Installation
Electrical Installation
Figure 2-18 4-Wire Wye 3-Element Direct Connection Using 3 CTs.
Wiring Mode = 4LL3 or 4Ln3
Figure 2-19 4-Wire Wye 3-Element Connection Using 3 PTs, 3 CTs.
Wiring Mode = 4LL3 or 4Ln3
20
Series PM175 Powermeters
Chapter 2 Installation
Electrical Installation
Figure 2-20 3-Wire 2-Element Open Delta Connection Using 2 PTs, 2 CTs.
Wiring Mode = 3OP2
Figure 2-21 4-Wire Wye 2½-Element Connection Using 2 PTs, 3 CTs.
Wiring Mode = 3LL3 or 3Ln3
Series PM175 Powermeters
21
Chapter 2 Installation
Electrical Installation
This configuration provides accurate power measurements only if the voltages are balanced.
Figure 2-22 3-Wire Open 2½-Element Delta Connection Using 2 PTs, 3 CTs.
Wiring Mode = 3OP3
Figure 2-23 4-Wire 3-Element Delta Direct Connection Using 3 CTs.
22
Series PM175 Powermeters
Chapter 2 Installation
Electrical Installation
Wiring Mode = 4LL3 or 4Ln3
Figure 2-24 3-Wire 2½-Element Broken Delta Connection Using 2 PTs, 3 CTs.
Wiring Mode = 3bLn3 or 3bLL3
Series PM175 Powermeters
23
Chapter 2 Installation
I/O Connections
I/O Connections
For I/O ratings, see “Technical Specifications” in Appendix A.
Relay Outputs
LOAD
LOAD
N
10A FUSE LINE
18 19 20
21 22 23 24 25
+ - + 2
1
ANALOG INPUTS
ANALOG OUTPUTS
1 2
DIGITAL INPUTS
26 27 28 29
1
2
RELAYS + 1
1
- 3
2
V1
S/N
O 1A CT. 690V
+
P 5A CT. OPT.U
CALIBRATED AT :
T 25 Hz
50 Hz
STANDARD
I 60 Hz 400 Hz 10W
O ANALOG IN/OUT :
4
POWER SUPPLY
5
V2
90-264VAC
50/60Hz
85-290VDC
2
6
Figure 2-25 Relay Output Connection
Digital Inputs
18 19 20
1 2
DIGITAL INPUTS
21 22 23 24 25
+ - + 2
1
ANALOG INPUTS
ANALOG OUTPUTS
26 27 28 29
1
2
RELAYS + 1
V1
S/N
POWER SUPPLY
5
V2
1
- 3
2
90-264VAC
50/60Hz
85-290VDC
STANDARD
10W
O 1A CT. 690V
P 5A CT. OPT.U
CALIBRATED AT :
T 25 Hz
50 Hz
I 60 Hz 400 Hz
O ANALOG IN/OUT :
+ 4
2
- 6
Figure 2-26 Digital Input Connection
24
Series PM175 Powermeters
Chapter 2 Installation
I/O Connections
Analog Outputs
LOAD
SHIELD
_
+
+
PROTECTIVE
GROUND
_
21 22 23 24 25
+ - + 2
1
ANALOG INPUTS
ANALOG OUTPUTS
18 19 20
1 2
DIGITAL INPUTS
26 27 28 29
1
2
RELAYS + 1
1
- 3
2
V1
S/N
POWER SUPPLY
90-264VAC
50/60Hz
5
V2
STANDARD
10W
85-290VDC
O 1A CT. 690V
+
P 5A CT. OPT.U
CALIBRATED AT :
T 25 Hz
50 Hz
I 60 Hz 400 Hz O ANALOG IN/OUT :
4
2
6
Figure 2-27 Analog Output Connection
Maximum current loop load:
510 Ohm for 0-20 mA and 4-20 mA options
5 kOhm for 0-1 mA and ±1 mA options
Analog Inputs
SENSOR
SHIELD
+
_
+
PROTECTIVE
GROUND
_
18 19 20
1 2
DIGITAL INPUTS
21 22 23 24 25
+ - + 2
1
ANALOG INPUTS
ANALOG OUTPUTS
26 27 28 29
1
2
RELAYS + 1
V1
S/N
POWER SUPPLY
5
V2
1
- 3
2
90-264VAC
50/60Hz
85-290VDC
STANDARD
10W
O 1A CT. 690V
P 5A CT. OPT.U
CALIBRATED AT :
T 25 Hz
50 Hz
I 60 Hz 400 Hz
O ANALOG IN/OUT :
+ 4
2
- 6
Figure 2-28 Analog Input Connection
Series PM175 Powermeters
25
Chapter 2 Installation
Communications Connections
Communications Connections
Several communication options are available for the PM175:
COM1 (check the label on the back of your meter):
RS-232/RS-422/RS-485
56K Dial-up modem
Ethernet 10/100BaseT
COM2:
RS-422/RS-485
The RS-232/RS-422/RS-485 port is a standard port for COM1. Other options
are ordered separately. Connections to the Ethernet RJ45 connector and to
the telephone RJ11 connector are made through a cable adaptor provided
with your meter (if ordered).
A full description of the communication protocols is found in the PM175
protocol guide provided with your meter.
COM1 RS-232 Connection
V2
(12) 10-16VDC
LOW DC
(24) 18-36VDC
(48) 36-72VDC
8
COM.1 :
RS-232/422/485 STANDARD
ETHERNET
3
MODEM
PROFIBUS
N
S
ANALOG IN/OUT :
+1mA
+ 7
0-20mA
3
0-1mA
4-20mA
- 9
ATTENTION
V
5
9
VN
N/- 10
POWER SUPPLY
COM.2
L/+ 12
RS-422/RS-485
COM.1
11
Static-Sensitive
Devices
Handle Only at
Static-Safe
Workstations
1
-TX -RX +TX +RX
6
13 14 15 16 17
5
1
9
6
Connector 9-pin D-type female:
Pin
1
2
3
4
5
PM175
RS232MALE CON.
26
RS-232
RS-232
RS-232
RS-232
RS-232
Signal
RTS
RxD
TxD
CTS
Signal ground
PM175
RS-232
MALE CON.
Series PM175 Powermeters
Chapter 2 Installation
PM175
RS232
MALE CON.
Communications Connections
IBM PC/COMPATIBLE
25-PIN DB25
FEMALE CON.
PM175
RS232
MALE CON.
RS-232 SIMPLE 3-WIRE
CONNECTION 25-PIN
IBM PC/COMPATIBLE
9-PIN DB9
FEMALE CON.
RS-232 SIMPLE 3-WIRE
CONNECTION 9-PIN
Figure 2-29 COM1: RS-232 Cable Drawings
COM1 RS-422/485 Connection
V2
(12) 10-16VDC
LOW DC
(24) 18-36VDC
(48) 36-72VDC
8
N
S
COM.1 :
RS-232/422/485 STANDARD
ETHERNET
3
MODEM
PROFIBUS
ANALOG IN/OUT :
+1mA
+ 7
0-20mA
3
0-1mA
4-20mA
- 9
ATTENTION
V
Static-Sensitive
Devices
Handle Only at
Static-Safe
Workstations
COM.1
11
5
9
VN
N/- 10
POWER SUPPLY
COM.2
L/+ 12
RS-422/RS-485
1
6
-TX -RX +TX +RX
13 14 15 16 17
5
1
9
6
Connector 9-pin D-type female:
Pin
6
7
8
9
RS-422/485
RS-422/485
RS-422/485
RS-422/485
Signal
+RxD
+TxD
–TxD
–RxD
DB9
(MALE)
RS-422
-R
5
9
1
+R
2
-T
3
-R
4
-T
4
PM172
COM1
+T
8
+T
3
7
TO SATEC
CONVERTER
+R
2
5
6
1
RS-422 CABLE
Figure 2-30 COM1: Connection to the RS-422/485-RS-232 Converter
Series PM175 Powermeters
27
Chapter 2 Installation
Communications Connections
COM1 Dial Up Modem Connection
AC0140
05-12001-3
Figure 2-31 COM1: Telephone Line Connection
COM1 Ethernet Connection
AC0139
RJ45
05-12001-4
Figure 2-32 COM1: Ethernet Connection
28
Series PM175 Powermeters
Chapter 2 Installation
Communications Connections
COM2 RS-422/485 Connection
V2
(12) 10-16VDC
LOW DC
(24) 18-36VDC
(48) 36-72VDC
8
V3
N
S
COM.1 :
RS-232/422/485 STANDARD
ETHERNET
MODEM
PROFIBUS
5
9
VN
ATTENTION
Static-Sensitive
Devices
Handle Only at
Static-Safe
Workstations
N/- 10
POWER SUPPLY
COM.2
L/+ 12
RS-422/RS-485
COM.1
11
ANALOG IN/OUT :
+1mA
+ 7
0-20mA
3
0-1mA
4-20mA
- 9
1
-TX -RX +TX +RX
6
13 14 15 16 17
5
1
9
6
Connector removable, captured-wire, 5 terminals:
Terminal
13
14
15
16
17
V2
Signal
-TxD
-RxD
+TxD
+RxD
Ground
(12) 10-16VDC
LOW DC
(24) 18-36VDC
(48) 36-72VDC
8
COM.1 :
RS-232/422/485 STANDARD
ETHERNET
3
MODEM
PROFIBUS
N
S
ANALOG IN/OUT :
+1mA
+ 7
0-20mA
3
0-1mA
- 9
4-20mA
ATTENTION
V
11
VN
10
POWER SUPPLY
COM.2
L/+ 12
RS-422/RS-485
COM.1
5
9
Static-Sensitive
Devices
Handle Only at N/Static-Safe
Workstations
1
-TX -RX +TX +RX
6
13 14 15 16 17
-
+
RS-485
(PLC)
PC
DEVICES
RS-485 COMMUNICATION PORT
2 WIRE CONNECTION
Series PM175 Powermeters
29
Chapter 2 Installation
Communications Connections
RS-485 MULTI-DROP CONNECTION
PM172-N2 (1)
PM172-N2 (2)
PM172-N 2 (32)
CONVERTER
RS485/422-232
SHLD
TX ENABLE
TXD
RXD
POWER
RS-422 / RS-485
RS-232
TXD
RXD
MASTER
SHLD
L N
POWER
SUPPLY
COMMUNICATION CONVERTER
Rt 1
RS232
-
SHLD
+
-
+
SHLD
+
-
+
Rt 2
RS485
R t 1, R t 2=200-500 Ohm, 0.5W
CABLE MAXIMUM LENGTH 1000M
UP TO 32 POWERMETERS
Figure 2-33 COM2: RS-485 2 Wire Connection
V2
(12) 10-16VDC
LOW DC
(24) 18-36VDC
(48) 36-72VDC
8
COM.1 :
RS-232/422/485 STANDARD
ETHERNET
3
MODEM
PROFIBUS
V
11
VN
COM.1
5
9
1
6
N
S
ANALOG IN/OUT :
+1mA
+ 7
0-20mA
3
0-1mA
4-20mA
- 9
ATTENTION
Static-Sensitive
Devices
Handle Only at N/Static-Safe
Workstations
10
POWER SUPPLY
COM.2
L/+ 12
RS-422/RS-485
-TX -RX +TX +RX
13 14 15 16 17
_
Tx
TO COMMUNICATION
SYSTEM
Rx
+
_
+
RS-485/422 COMMUNICATION PORT
4 WIRE CONNECTION
Figure 2-34 COM2: RS-422/485 4 Wire Connection
30
Series PM175 Powermeters
Chapter 3 Display Operations
Indicators and Controls
Chapter 3 Display Operations
Displayed Parameters
Load Bar Graph
Wh/varh Pulse LED
Measurement Units
Navigation Buttons
Port Activity LEDs
Indicators and Controls
Numeric LED Display
The meter has a simple user interface that allows you to view numerous
measurement parameters by scrolling through different display pages. The
numeric LED display shows up to three parameters at a time. Small
rectangular or triangular LEDs at right and below the display indicate the
displayed parameters and their measurement units.
The display layout may change depending on the meter type and mode of
operation. There are three modes of display operation: data display, status
display, and programming mode display.
Load Bar Graph
The load bar graph displays the amount, in percent (40% to 110%), of the
present current load with respect to user-defined nominal load current. The
reference nominal current can be set up in amps through the Display Setup
menu. If it is set to 0 (default), the current load is referenced to the specified
CT primary current.
Energy Pulse LED
The PM175 has a red “Energy Pulse” LED. It flashes at a constant rate when
a load is applied to the meter. There are two modes of LED operation:
normal and test. In normal mode, the LED pulses indicate imported Wh at a
rate of 1,000 pulses per kWh. In test mode, the LED pulses indicate either
imported Wh, or imported (inductive) varh at a rate of 10,000 pulses per
kWh/kvarh. The energy test mode can be enabled through the Display Setup
menu. When in test mode, the energy and demand accumulators do not
account for consumed energy.
Series PM175 Powermeters
31
Chapter 3 Display Operations
Data Display
Port Activity LEDs
The meter has two yellow LEDs “COM1” and “COM2”, which indicate activity
on the two communication ports. The port’s LED flashes when the port is
receiving or transmitting data. With the Ethernet option, the “COM1” LED
flashes constantly regardless of the port activity.
When the display module is connected remotely through a 3-wire RS-485
interface, the “COM1” LED indicates the display port activity, while the
“COM2” LED is not operational.
Navigation Buttons
The PM175 is provided with six push buttons that are normally used to
navigate between different measurement displays. In programming mode,
the buttons access the device setup menus and the default factory-set
device settings can be changed.
Data Display
In data mode, the display is normally updated once per second; you can
adjust the display update rate via the Display Setup menu.
Display Features
Measurement Units
Currents are always displayed in amperes with two decimal places.
Measurement units for voltage and power depend on the connection scheme
of the meter:
•
When direct wiring is used, voltages are displayed in
volts with one decimal place, and power in kilowatts
with three decimal places.
•
When wiring via PT is used, for the PT ratio up to and
including 4.0, voltages are displayed in volts, and
power in whole kilowatts
•
For the PT ratio above 4.0, voltages are displayed in
kilovolts, and power in megawatts with three decimal
places.
The small round “Kilo” and “Mega” LEDs light up showing the appropriate
measurement units for a displayed page.
Primary and Secondary Volts
Volts can be displayed in primary (default) or secondary units. The volts
display mode can be changed through the Display Setup menu.
Phase Power Readings
In configurations with the neutral wire, in addition to total three-phase
powers, the meter can show per-phase power readings. By default, they are
disabled. See Display Setup on how to enable per-phase power readings in
your meter.
Fundamental Component
The meter can display total power factor and active power for the
fundamental component if it is enabled through the Display Setup menu.
Whenever phase power readings are allowed, the PM175 also displays perphase power factor and active power for the fundamental component.
32
Series PM175 Powermeters
Chapter 3 Display Operations
Data Display
Auto Return
If no buttons are pressed for 30 seconds while the display Auto Return option
is enabled, the display automatically returns to the main screen from any
other measurement display or programming mode.
The Auto Return option can be enabled through the Display Setup menu
Auto Scroll
If no buttons are pressed for 30 seconds while in the common
measurements display, and the Auto Scroll option is enabled in the meter,
the display automatically scrolls through all available pages. The scroll
interval can be adjusted through the Display Setup menu.
To stop auto scrolling, press briefly the SCROLL button.
Navigation Buttons
MIN
MAX
PQ
ESC
S
T
SELECT
ENERGY
ENTER
In Data Display mode, the navigation buttons function as follows.
The MIN/MAX button switches to the Min/Max - Maximum Demands display
pages. When briefly pressed again, it switches back to the common
measurements display.
The PQ button switches between different power quality/harmonic displays:
Total Harmonics, Individual Voltage and Current Harmonics, and Power
Quality parameters – short-term (Pst) and long-term (Plt) flicker, and voltage
and current negative sequence unbalance. When briefly pressed once again,
it switches back to the common measurements display
The UP and DOWN arrow buttons, labeled by arrowheads, scroll forwards
and backwards through the display pages. Pressed briefly, they move one
page forward or backward. If you hold down the button the display pages are
scrolled at rate of a twice per second.
Pressing both the UP and DOWN arrow buttons together returns to the first
page within the current display.
The SELECT button operates once it’s released. The button has two
functions:
•
When pressed briefly, it switches to programming mode.
•
When pressed together with the ENTER button for more
than 5 seconds, it resets Min/Max records, maximum
demands, or energies depending on the currently displayed
page. If the meter is password protected, and a simple reset
of data from the display is not allowed, the action has no
effect.
The ENERGY button switches to the Energy display. If TOU registers are
configured in the meter, you can repeatedly press this button to scroll
through all available TOU registers. When briefly pressed once again, it
switches back to the common measurements display
Simple Reset of Accumulated Data
When the meter is not password protected, or the simple reset of data is
allowed from the display regardless of the security setting (see Display
Setup), the meter allows the simple “two-button’ reset of the Min/Max
registers, maximum demands, energies, and counters from the data display
mode without entering the reset menu:
Series PM175 Powermeters
33
Chapter 3 Display Operations
Data Display
1.
Select a display page where the data
you want to reset is displayed:
Min/Max log - select a Min/Max page from the Min/Max Display.
Ampere and volt maximum demands - select the ampere or volt
maximum demand page from the Min/Max Display.
Power maximum demands - select the power maximum demand page
from the Min/Max Display.
Total and phase energies - select a total energy, or phase energy page
from the Energy Display.
Counters – select a counter page from the Status Display
2.
While holding the SELECT button, press and hold the
ENTER button for about 5 seconds. The displayed data
is reset to zero.
Common Measurements Display
Scroll through pages with the UP and DOWN arrow buttons.
1
L
2
P
3
4
5
S
T
6
7
8
9
10
11
12
13
14
15
34
Common Measurements (Main Display)
V12
Line-to-line volts
V23
V31
Line-to-neutral volts (in configurations
V1
with a neutral wire: 4LN3, 3LN3,
V2
3BLN3, 4LL3, 3LL3, and 3BLL3)
V3
Amps
I1
I2
I3
Total VA
kVA/MVA
Total PF
PF
Total W
kW/MW
Neutral current
In
Frequency
Hz
Total var
kvar/Mvar
Phase L1 powers
Ph.L1
(if enabled)
PF
kW/MW
kVA/MVA
Phase L1 powers
Ph.L1
(if enabled)
kvar/Mvar
Ph.L2
Phase L2 powers
PF
(if enabled)
kW/MW
Phase L2 powers
kVA/MVA
(if enabled)
Ph.L2
kvar/Mvar
Phase L3 powers
Ph.L3
(if enabled)
PF
kW/MW
Phase L3 powers
kVA/MVA
(if enabled)
Ph.L3
kvar/Mvar
Fundamental total powers
H01
(if enabled)
PF
kW/MW
Fundamental phase L1 powers
H1.L1
(if enabled)
PF
kW/MW
H1.L2
Fundamental phase L2 powers
PF
(if enabled)
kW/MW
Fundamental phase L3 powers
H1.L3
(if enabled)
PF
kW/MW
Series PM175 Powermeters
Chapter 3 Display Operations
Data Display
Common Measurements (Main Display)
Analog inputs (optional)
An.In
AI1
AI2
16
Min/Max and Max. Demands Display
Press the MIN/MAX button. The MIN/MAX LED, or MAX DEMAND LED in
the PM175, is illuminated when in the MIN/MAX display. Use the UP and
DOWN arrow buttons to scroll through the Min/Max and Max. Demand
pages.
Note that volts readings are line-to-neutral in 4LN3, 3LN3 and 3BLN3 wiring
modes, and line-to-line in other modes.
MIN
MAX
1
Lo
2
Lo
3
Lo
4
Lo
5
Hi
S
6
T
7
Hi
Hi
8
Hi
9
Hd
10
Hd
11
Hd
Min/Max and Maximum Demands
Minimum volts
V1/V12
V2/V23
V3/V31
Minimum amps
I1
I2
I3
Minimum total VA
kVA/MVA
Minimum total PF (absolute)
PF
Minimum total W
kW/MW
In
Minimum neutral current
Hz
Minimum frequency
kvar/Mvar
Minimum total var
Maximum volts
V1/V12
V2/V23
V3/V31
Maximum amps
I1
I2
I3
Maximum total VA
kVA/MVA
Maximum total PF (absolute)
PF
Maximum total W
kW/MW
Maximum neutral current
In
Maximum frequency
Hz
Maximum total var
kvar/Mvar
V1/V12
Maximum volt demands
V2/V23
V3/V31
Maximum ampere demands
I1
I2
I3
Maximum VA demand
kVA/MVA
PF at maximum VA demand
PF
Maximum W demand
kW/MW
Power Quality/Harmonics Display
Press the PQ/ESC button. The THD/TDD LED is illuminated. Press the
button again to move to the individual harmonics, or to the flicker and
unbalance displays. Use the UP and DOWN arrow buttons to scroll through
harmonics and power quality measurements.
Note that voltage harmonics readings are line-to-neutral in the 4LN3, 3LN3
and 3BLN3 wiring modes, and line-to-line in all other modes.
PQ
ESC
1
thd.
Series PM175 Powermeters
V1/V12 THD
V2/V23 THD
V3/V31 THD
Total Harmonics
Voltage THD
35
Chapter 3 Display Operations
Data Display
2
S
T
thd.
3
tdd.
4
HF
PQ
ESC
T
Current K-Factor
40H
03H
40H
I1 HD%
I2 HD%
I3 HD%
02H
2
39
S
2
T
3
4
V% unb
C.Unb
Pst
Plt
Order 40 harmonic distortion
Flicker/Unbalance
Short term flicker
V1 Pst
V2 Pst
V3 Pst
V1 Plt
V2 Plt
V3 Plt
U.Unb
1
Order 40 harmonic distortion
Individual Current Harmonics
Order 2 harmonic distortion
HD%
HD%
HD%
Order 3 harmonic distortion
HD%
HD%
HD%
I1
I2
I3
I1
I2
I3
1
PQ
ESC
Current TDD
V1/V12 HD%
V2/V23 HD%
V3/V31 HD%
39
T
Total Harmonics
Current THD
03H
2
PQ
ESC
S
THD
THD
THD
TDD
TDD
TDD
K-Factor
K-Factor
K-Factor
Individual Voltage Harmonics
Order 2 harmonic distortion
V1/V12 HD%
V2/V23 HD%
V3/V31 HD%
Order 3 harmonic distortion
V1/V12 HD%
V2/V23 HD%
V3/V31 HD%
1
02H
S
I1
I2
I3
I1
I2
I3
I1
I2
I3
Long term flicker
I% unb
Voltage negative sequence unbalance,
percent
Current negative sequence unbalance,
percent
Energy Display
Press the ENERGY button. The MVAh, Mvarh, or MWh LED is
illuminated. If TOU registers are configured in the meter, press
the button again to scroll through all active TOU registers. Use
the UP and DOWN arrow buttons to scroll through energy pages.
Along with total energies, per phase energy accumulators are displayed if
phase energy calculation is enabled in the Device Options menu.
ENERGY
ENTER
36
1
Ac.En.
IP.
MWh
Total and Phase Energies
Total Wh import
Series PM175 Powermeters
Chapter 3 Display Operations
2
3
4
5
6
S
T
7
8
9
10
11
12
13
14
ENERGY
ENTER
S
T
ENERGY
ENTER
S
T
Series PM175 Powermeters
1
2
Data Display
rE.En.
IP.
Mvarh
AP.En.
MVAh
Ac.En.
EP.
MWh
rE.En.
EP.
Mvarh
Ac.En.
IP.L1.
MWh
rE.En.
IP.L1.
Mvarh
AP.En.
L1.
MVAh
Ac.En.
IP.L2.
MWh
rE.En.
IP.L2.
Mvarh
AP.En.
L2.
MVAh
Ac.En.
IP.L3.
MWh
rE.En.
IP.L3.
Mvarh
AP.En.
L3.
MVAh
rEG.1
trF.1
MWh
rEG.1
trF.2
MWh
8
rEG.1
trF.8
MWh
1
rEG.8
trF.1
MWh
rEG.8
trF.2
MWh
2
8
rEG.8
trF.8
MWh
Total and Phase Energies
Total varh import
Total VAh
Total Wh export
Total varh export
Phase L1 Wh import
Phase L1 varh import
Phase L1 VAh
Phase L2 Wh import
Phase L2 varh import
Phase L2 VAh
Phase L3 Wh import
Phase L3 varh import
Phase L3 VAh
TOU Energy Register 1
Tariff 1 reading
Tariff 1 reading
Tariff 8 reading
TOU Energy Register 8
Tariff 1 reading
Tariff 1 reading
Tariff 8 reading
37
Chapter 3 Display Operations
Status Display
Status Display
SELECT
The meter has separate status information pages accessible through the
primary device menu. The Status Display shows rarely used information that
is especially helpful when connecting the meter inputs and outputs to
external equipment. For information on navigating in the menus, see Using
the Menus.
StA
To enter the Status Display:
OPS
1.
CHG
2.
ENERGY
ENTER
From the Data Display, press the SELECT button to enter
the primary device menu. The “StA” window is highlighted.
Press ENTER to enter the Status Display. Use the UP
and DOWN arrow buttons to scroll through the status
pages.
To exit the Status Display:
1.
2.
Press ESC to return to the primary device menu.
Press ESC to return to the Data display.
1
2
3
4
S
5
T
6
PhS
rot
POS/nEG/Err
V1 angle
V2 angle
AG. V3 angle
I1 angle
I2 angle
AG. I3 angle
rEL
1.2.
00
St.In
1.2.
00
Cnt.1
7
Counter #1
Cnt.2
8
Counter #2
Cnt.3
9
Counter #3
Cnt.4
10
Counter #4
batt
Status Display
Phase rotation order
Voltage angles (±180°, referenced to
V1)
Current angles (±180°, referenced to
V1)
Relay status
Status inputs
Backup battery status (Normal/Low)
nor/Lo
38
Series PM175 Powermeters
Chapter 3 Display Operations
Using the Menus
Using the Menus
Navigation Buttons
THD/TDD
ESC
S
T
SELECT
ENERGY
ENTER
The PM175 has a menu-driven setup. To enter the menus, press and
release the SELECT button.
The SELECT button selects (highlights) an active window in which you can
select or change a desired menu item. The button operates once it’s briefly
pressed and released.
The UP and DOWN arrow buttons scroll through menu items in the
highlighted window forwards and backwards, and allow changing a
highlighted item when entering numbers.
The ENTER button confirms the selection of a menu item or a number in the
highlighted window, thus allowing to enter a submenu or to store a changed
item.
The ESC button is “Escape” leaving the highlighted item unchanged or
returning to the upper level menu.
Selecting Menus
To access the meter menus, press and release the SELECT button. The
primary meter menu is open as shown below. The menu has three entries:
•
StA - Status Display entry (see ”Status Display” above)
•
OPS – Main setup menu entry allowing to review setup
options
•
CHG – Main setup menu entry allowing to change setups
StA
SELECT
OPS
StA
SELECT
CHG
OPS
ENERGY
ENTER
CHG
To enter the Status Display:
1.
2.
If the StA window is not highlighted, use the SELECT
button to activate it.
Press the ENTER button to enter the Status Display
To review the meter setup options:
1.
2.
Press the SELECT button to activate the OPS window.
Press the ENTER button to enter the main menu.
To change the meter setup, or to clear the accumulated values:
1.
2.
Press the SELECT button to activate the CHG window.
Press the ENTER button to enter the main menu.
Entering the Password
The Setup Change menu can be secured by a four-digit user password. The
meter is primarily shipped with the password preset to 0 and password
Series PM175 Powermeters
39
Chapter 3 Display Operations
Using the Menus
protection disabled. You can change the password and enable password
protection through the Access Control menu (see Meter Security).
If authorization is not required, just press the ENTER button to move to the
Main menu; otherwise you should enter a correct password to be authorized
to access the meter setup.
PASS
PASS
S
0000
0201
ENERGY
ENTER
To enter the password:
1.
2.
3.
4.
Adjust the first digit with the UP and DOWN arrow
buttons.
Press the SELECT button to advance to the next digit.
Adjust the remaining password digits in the same manner.
Press ENTER to confirm the password.
If the password entered is correct, you move to the Main menu, otherwise
you return to the previous menu.
Selecting the OPS or CHG entry moves you to the Main menu that is
represented by two entries: the upper window displays a secondary menu
list, while the bottom item is an assisting exit window.
Selecting a Menu Entry
To select a menu entry from the menu list:
1.
Highlight the upper item by pressing the SELECT button.
rSt
S
ESC
2.
3.
bASc
ENERGY
ENTER
ESC
Scroll through the menu list by pressing briefly the UP and
DOWN arrow buttons until the desired menu entry
appears.
Press the ENTER button.
Viewing and Changing Setup Items
A second level menu normally consists of three items: the upper static
window indicates the menu name, while the middle window represents a list
of setup parameters you can scroll through, and the lower item shows the
present parameter value.
To select a parameter you want to view or change:
1.
Highlight the middle window by pressing the SELECT
button.
bASc
ConF
4Ln3
2.
40
S
bASc
Pt
1.0
Scroll through the parameter list with the UP and DOWN
buttons until the desired parameter name appears.
Series PM175 Powermeters
Chapter 3 Display Operations
Menu Operations
To change the selected parameter:
1.
Press the SELECT button to highlight the lower item.
bASc
Pt
SELECT
bASc
S
Pt
200.0
1.0
2.
bASc
ENERGY
ENTER
Pt
THD/TDD
ESC
200.0
If a number represents the parameter, adjust it to the
desired value with the UP and DOWN arrow buttons.
When briefly pressed, the button increments or
decrements the number by one. When the button is
pressed continuously, the number is changed
approximately twice per second.
If a name represents the parameter, select the desired
option with the UP and DOWN arrow buttons.
To store your new selection, press the ENTER button.
To leave the parameter unchanged, press the ESC
button.
3.
4.
5.
You will return to the parameter list to select another parameter or return to
the main menu.
To exit the menu, press ESC.
Menu Operations
Basic Device Settings
This menu allows you to configure the basic meter settings that define the
general operating characteristics of the device. To enter the menu, select the
“baSc” entry from the main menu, and then press the ENTER button.
bASc
ConF
To select a setup option:
4Ln3
1.
2.
Press the SELECT button to activate the middle window.
Use the UP and DOWN arrow buttons to scroll to the
desired option.
To change the option:
1.
2.
Press the SELECT button to activate the lower window.
Use the UP and DOWN arrow buttons to select the
desired option.
Press ENTER to confirm your changes and to store your
new setting, or press ESC to discard changes.
3.
To exit the menu, press ESC.
The following table lists available options.
Label
Parameter
Options
Default
Description
ConF
Wiring connection
(configuration) mode
See “Basic
Meter
Setup” in
Chapter 4
4Ln3
The wiring connection of the
device
Pt
PT ratio
1.0-6500.0
1.0
The phase potential
transformer’s primary to
secondary ratio
Series PM175 Powermeters
41
Chapter 3 Display Operations
Label
Menu Operations
Parameter
Options
Default
Description
Pt.F
PT Ratio multiplier
×1, ×10
×1
PT Ratio multiplication factor.
Used in extra high voltage
networks to accommodate the
PT ratio for 500 kV and higher
networks.
U.SEC
Nominal secondary
voltage
10-690 V
120 V
The nominal secondary line-toneutral (in 4LN3, 3LN3 and
3BLN3 wiring modes) or line-toline (in 4LL3, 3LL3, 3BLL3,
3OP2, 3OP3 and 3DIR modes)
voltage. Used as a reference
voltage for the EN50160
evaluation.
Ct
CT primary current
1-10000 A
5A
The primary rating of the phase
current transformer
d.P
Power block demand
period
1, 2, 5, 10,
15, 20, 30,
60 min,
E=external
sync
30 min
The length of the demand
period for power demand
calculations. If the external
synchronization is selected, a
pulse front on the digital input
DI1 denotes the start of the
demand interval.
nd.P
The number of blocks in 1-15
the sliding window
1
The number of blocks to be
averaged for sliding window
demands
Ad.P
Ampere, volt and THD
demand period
900 sec
The length of the demand
period for ampere, volt and
THD demand calculations
Freq
Nominal frequency
50,60 Hz
60 Hz
The nominal line frequency
LoAd
Maximum demand load
current
0-10000 A
0
The maximum demand load
current (0 = CT primary)
0-1800 sec
Ì
Always specify the wiring mode and transformer ratings prior to setting up
setpoints and analog outputs.
Ì
The maximum value for the product of the phase CT primary current and PT ratio
is 57,500,000. If the product is greater, power readings are zeroed.
42
Series PM175 Powermeters
Chapter 3 Display Operations
Menu Operations
Device Options
OPtS
P.cAL
rEAc
This menu allows you to change the user-configurable device options or put
the meter into energy test mode. To enter the menu, select the “OPtS” entry
from the Main menu, and then press the ENTER button.
To select a setup option:
1.
2.
Press the SELECT button to activate the middle window.
Use the UP and DOWN arrow buttons to scroll to the
desired option.
To change the option:
1.
2.
3.
Press the SELECT button to activate the lower window.
Use the UP and DOWN arrow buttons to select the
desired option.
Press ENTER to confirm your changes and to store your
new setting, or press ESC to discard changes.
To exit the menu, press ESC.
The following table lists available options.
Label Parameter
Options
P.cAL
Power
calculation
mode
rEAc (reactive power), Reactive
nAct (non-active
power)
Default
Description
roLL
Energy roll
valueE
10.E4=10,000
10.E5=100,000
10.E6=1,000,000
10.E7=10,000,000
10.E8=100,000,000
10.E9=1,000,000,000
10.E9
The value at which
energy counters roll
over to zero
Ph.En
Phase energy
optionE
diS = disabled
En = enabled
Disabled
Enables phase energy
calculations
bAtt
Backup battery
mode
OFF = switched OFF
On = switched ON
OFF
Allows to conserve a
battery while the meter
is out of operation
tESt
Energy test
mode
OFF = disabled
Ac.Ei = Wh pulses
rE.Ei = varh pulses
Disabled
Setting this option puts
the meter into the
energy test mode
The method used for
calculating reactive and
apparent powers
Communication Ports
These two menus allow you to configure parameters for communication
ports COM1 and COM2. To enter the menu, select “Prt.1” for COM1 or
“Prt.2” for COM2 from the main menu, and then press the ENTER button.
To select a setup option:
Prt.1
Prot
1.
2.
rtu
Press the SELECT button to activate the middle window.
Use the UP and DOWN arrow buttons to scroll to the
desired option.
To change the option:
1.
2.
3.
Press the SELECT button to activate the lower window.
Use the UP and DOWN arrow buttons to select the
desired option.
Press ENTER to confirm your changes and to store your
new setting, or press ESC to discard changes.
To exit the menu, press ESC.
Series PM175 Powermeters
43
Chapter 3 Display Operations
Menu Operations
The following tables list available port options.
COM1 Settings
Label
Parameter
Prot
Communications rtu = Modbus RTU
Modbus
protocol
ASCII =Modbus ASCII RTU
Options
rS
Port interface
232 = RS-232
485 = RS-485
422 = RS-422
dial = Dial-up Modem
Eth.= Ethernet
Depends
on the
order
For non-serial interfaces
- not changeable;
automatically detected
by the meter
Addr
Device address
Modbus: 1-247
1
Device network address
bAud
Baud rate
300-115200 bps
19200 bps The port baud rate
dAtA
Data format and 7E, 8N, 8E
parity
H.Sh
Handshaking
(flow control)
nonE=no flow control None
SOFt=software
(XON/XOFF)
HArd=hardware (CTS)
rtS
RTS mode
nonE = not used
None
Forc = RTS is
permanently asserted
CtrL = RTS is asserted
during the
transmission
1
Default
8N
Description
The communications
protocol supported by
the port
7E data format should
not be used with the
Modbus RTU protocol
1
The meter automatically detects a replaceable communication module and does
not allow you to change the interface, baud rate or data format for the Dial-up
modem, and for the Ethernet port.
COM2 Settings
44
Label
Parameter
Default
Description
Prot
Communications rtu = Modbus RTU
protocol
ASCII = Modbus
ASCII
Options
Modbus
RTU
The communications
protocol supported by
the port
rS
Port interface
485 = RS-485
422 = RS-422
RS-485
Addr
Device address
Modbus: 1-247
1
bAud
Baud rate
300-115200 bps
19200 bps The port baud rate
dAtA
Data format and 7E, 8N, 8E
parity
8N
Device network address
7E data format should
not be used with the
Modbus RTU protocol
Series PM175 Powermeters
Chapter 3 Display Operations
Menu Operations
Network Address
A. 192.
168.
000.203
This menu allows you to configure the device IP address and the default
gateway address for the Ethernet port. To enter the menu, select “nEt” from
the main menu, and then press the ENTER button.
To change the IP Address and Default Gateway:
1.
G. 192.
168.
000.001
2.
3.
4.
5.
6.
To change the device IP address, select the “A” entry in
the upper window with the UP and DOWN arrow buttons.
To change the default gateway address, select the “G”
entry.
Press the SELECT button to activate the first address
digit.
Use the UP and DOWN arrow buttons to adjust the digit.
Press the SELECT button to advance to the next digit.
Adjust the remaining address digits.
Press ENTER to confirm your new setting, or press ESC
to discard changes.
To exit the menu, press ESC.
Counters Setup
Cnt.1
Inp.1
1
The PM175 has four six-digit counters that can count pulses delivered
through the device digital inputs with a programmable scale factor, or events
that trigger setpoint operations. This menu allows you to link digital inputs to
the counters and define a pulse multiplier for each counter. To enter the
menu, select the “Cnt” entry from the main menu and press the ENTER
button.
The menu uses three entries:
1. The upper window indicates a counter number.
2. The middle window selects a digital input to be linked to
the counter.
3. The lower window defines a counter multiplier.
Use the UP and DOWN arrow buttons to scroll to the desired counter.
To change the counter options:
1.
2.
3.
4.
5.
6.
Press the SELECT button to activate the middle window.
Use the UP and DOWN arrow buttons to link a digital
input to the counter or to disable the counter input.
Press the SELECT button to activate the lower window.
Use the UP and DOWN arrow buttons to enter the desired
multiplier.
Press ENTER to confirm your changes and to store the
new settings, or press ESC to discard changes.
You are returned to the upper window to select another
counter or exit the menu.
To exit the menu, press ESC.
The following table lists available counter options.
Series PM175 Powermeters
45
Chapter 3 Display Operations
Menu Operations
Parameter
Options
Default Description
Pulse source
None = disabled
Inp.1 = DI1
Inp.2 = DI2
None
Links a digital input to the counter
Multiplier
1-9999
1
The value added to the counter
when a pulse is detected on the
pulse source input, or the counter is
incremented through a setpoint
action
Control Setpoint Setup
SEtP
ESC
SP.1
trG.1
rtHi.C1
SP.1
On.1
200
SP.1
OFF.1
180
SP.1
LOG.2
Or
The PM175 provides 16 control setpoints with programmable operate and
release delays. Each setpoint evaluates a logical expression with up to four
arguments using OR/AND logic. Whenever an expression is evaluated as
“true”, the setpoint performs up to four concurrent actions that can send a
command to the output relays, increment or decrement a counter, or trigger a
recorder. For more information on setpoints operation, see Using Control
Setpoints in Chapter 4.
This menu configures setpoints through the front display. To enter the menu,
select the “SEtP” entry from the main menu, and press the ENTER button.
The menu uses three entries:
1. The upper window indicates a setpoint number.
2. The middle window selects a setup parameter to view or
change.
3. The lower window displays the parameter value.
Use the UP and DOWN arrow buttons to scroll to the desired setpoint.
To select a setpoint parameter:
1.
2.
To change the parameter value:
1.
2.
3.
4.
SP.1
trG.2
rtHi.C2
On.2
200
Press the SELECT button to activate the lower window.
Use the UP and DOWN arrow buttons to select the
desired value.
Press ENTER to confirm the new parameter setting, or
press ESC to discard changes.
You are returned to the middle window to select and
configure another parameter, or confirm the setpoint
settings and exit the menu.
To store your new setpoint settings after you configured all setpoint
parameters:
1.
SP.1
Press the SELECT button to activate the middle window.
Use the UP and DOWN arrow buttons to scroll to the
desired parameter.
2.
When the middle window is highlighted, press the ENTER
button.
You are returned to the upper window to select another
setpoint or exit the menu.
To exit the menu, press ESC.
The following table lists available setpoint options. For a list of available
setpoint triggers and actions, see Using Control Setpoints in Chapter 4.
46
Series PM175 Powermeters
Chapter 3 Display Operations
SP.1
OFF.2
Menu Operations
Label
Parameter
LGC.2LGC.4
Logical operator OR, AND
TrG.1-TrG.4 Trigger
parameter #1#4
Options
See
Appendix C
Operate limit
The threshold (in primary units) at
which the conditional expression
would be evaluated to true. Not
applicable for digital triggers.
OFF.1OFF.4
Release limit
The threshold (in primary units) at
which the conditional expression
would be evaluated to false. Defines
the hysteresis for analog triggers.
Not applicable for digital triggers.
Act.1-Act.4
Setpoint action
#1-#4
See
Appendix C
The action performed when the
setpoint expression is evaluated to
true (the setpoint is in operated
state)
On d
Operate delay
0-999.9 sec
The time delay before operation
when the operate conditions are
fulfilled
OFF d
Release delay
0-999.9 sec
The time delay before release when
the release conditions are fulfilled
Act.1
rEL.1
The analog or digital value that is
used as an argument in a logical
expression
On.1-On.4
180
SEtP
Description
Combines setpoint triggers in a
logical expression
Analog Inputs Setup
A.In.1
This entry appears only if the meter is ordered with optional analog inputs.
For more information on configuring analog inputs in your meter, see
Programming Analog Inputs in Chapter 4.
ESC
To enter the menu, select the “A.In.1” or “A.In.2” entry from the main menu
for the AI1 and AI2 inputs respectively, and press the ENTER button.
A.In.1
Lo
0
To change the analog input options:
1.
2.
3.
A.In.1
Hi
230
A.In.1
dEc.P
1
4.
5.
Use the UP and DOWN arrow buttons to scroll to the
desired parameter.
Press the SELECT button to activate the lower window.
Use the UP and DOWN arrow buttons to adjust the
parameter value.
Press ENTER to confirm the new parameter setting, or
press ESC to discard changes.
You are returned to the middle window to select another
parameter, or store your new settings and exit the menu.
To store new settings and exit the menu:
1. When the middle window is highlighted, press the ENTER
button.
2. You return to the Main menu.
To exit the menu without saving your changes, press ESC.
The following table lists available analog input options.
Series PM175 Powermeters
47
Chapter 3 Display Operations
Menu Operations
Label
Parameter
Options
Description
Lo
Zero scale
0-999,999
The low engineering scale (in
primary units) for the analog input
corresponding to a lowest (zero)
input current (0 or 4 mA)
Hi
Full scale
0-999,999
The high engineering scale (in
primary units) for the analog input
corresponding to a highest input
current (1 or 20 mA)
dEc.P
Number of
decimal places
0-3
The number of decimal digits in a
fractional part of the scaled
engineering value
Analog Outputs Setup
A.Ou.1
ESC
A.Ou.1
OutP
rt.U1
A.Ou.1
Lo
0
This entry appears only if the meter is ordered with optional analog outputs.
For more information on configuring analog inputs in your meter, see
Programming Analog Outputs in Chapter 4.
To enter the menu, select the “A.Ou.1” or “A.Ou.2” entry from the Main menu
for the AO1 and AO2 output respectively, and then press the ENTER button.
To change the analog output options:
1.
2.
3.
4.
5.
A.Ou.1
Hi
230
Use the UP and DOWN arrow buttons to scroll to the
desired parameter.
Press the SELECT button to activate the lower window.
Use the UP and DOWN arrow buttons to adjust the
parameter value.
Press ENTER to confirm the new parameter setting, or
press ESC to discard changes.
You are returned to the middle window to select another
parameter, or store your new settings and exit the menu.
To store new settings and exit the menu:
1. When the middle window is highlighted, press the ENTER
button.
2. You return to the Main menu.
To exit the menu without saving your changes, press ESC.
The following table lists available analog output options. For a list of the
available output parameters and their scales, see Programming Analog
Outputs in Chapter 4.
Label
Parameter Options
Description
OutP
Output
parameter
Selects the measured parameter to
be transmitted through the analog
output channel.
Lo
Zero scale
Low engineering scale (in primary
units) for the analog output
corresponding to a lowest (zero)
output current (0 or 4 mA)
Hi
Full scale
High engineering scale (in primary
units) for the analog output
corresponding to a highest output
current (1 or 20 mA)
See Appendix B
Timers Setup
The PM175 is provided with four interval timers. When enabled, a timer
generates periodic events in predefined intervals that can trigger setpoints to
48
Series PM175 Powermeters
Chapter 3 Display Operations
Menu Operations
produce periodic actions like periodic data trending. To enter the menu,
select the “t-r” entry from the main menu and press the ENTER button.
t-r
t-r.1
0
Use the UP and DOWN arrow buttons to scroll to the desired timer.
To change the time period for the timer:
1.
2.
3.
4.
Press the SELECT button to activate the lower window.
Use the UP and DOWN arrow buttons to enter the desired
interval value in seconds. Intervals from 1 to 9999
seconds are allowed. Resetting the interval to 0 disables
the timer.
Press ENTER to confirm your changes and to save the
new settings, or press ESC to discard changes.
You are returned to the middle window to select another
timer or exit the menu.
To exit the menu, press ESC.
Display Setup
diSP
This menu allows you to configure options for the meter display, and view
display and device firmware versions. To enter the menu, select the “diSP”
entry from the main menu and press the ENTER button.
UPdt
To select a setup option:
1.0
1.
2.
Press the SELECT button to activate the middle window.
Use the UP and DOWN arrow buttons to scroll to the
desired option.
To change the option:
1.
2.
3.
Press the SELECT button to activate the lower window.
Use the UP and DOWN arrow buttons to select the
desired option.
Press ENTER to confirm the changes and to save your
new setting, or press ESC to discard changes.
To exit the menu, press ESC.
The following table lists available options.
Label
Parameter
Options
UPdt
Display update rate
0.1-10.0 sec 1 sec
Defines the interval between
display updates
ScrL
Auto scroll interval
None,
2-15 sec
None
Defines the scroll interval for
the main data display or
disables auto scroll
rEtn
Auto return to the
main screen
diS =
disabled,
En =
Enabled
Enabled
Enables automatic return to
the main display if no buttons
are pressed for 5 minutes
bAr
Reference load
current for LED bar
graph
0-10,000A
(0 = CT
primary
current)
0
Defines the nominal load
(100%) level for the bar
graph display
Uolt
Primary/Secondary
volts units
Pri, SEc
Primary
Selects primary or secondary
units for volts display
Ph.P
Phase powers
display mode
diS, En
Disabled
Disables or enables phase
powers in the main display
Fund.
Fundamental
component display
mode
diS, En
Disabled
Disables or enables
fundamental values in the
main display
Series PM175 Powermeters
Default
Description
49
Chapter 3 Display Operations
Menu Operations
Label
Parameter
Options
Default
dAtE
Date order
dnY, ndY,
Ynd
(d=day,
n=month,
y=year)
mm.dd.yy Defines the date order in the
RTC display
Description
rSt
Simple reset mode
PASS =
password
required
En =
enabled
PASS
PASS = the simple reset is not
allowed when password
protection is enabled
En = enables the simple reset
buttons regardless of
password protection
SoFt.
Display firmware
version
N/A
N/A
Shows display firmware
version, like 1.2.8
SoFt.
Device firmware
version
N/A
N/A
Shows device firmware
version, like 15.01.09
Meter Security
The Access Control menu allows you to change the user password and
enable or disable password protection. To enter the menu, select the “AccS”
entry from the main menu and press the ENTER button.
AccS
The password in your meter is preset to 0 at the factory, and password
protection is disabled.
To change the password:
ESC
1.
2.
PASS
0000
3.
4.
5.
6.
Select the “PASS” entry in the upper window with the UP
and DOWN arrow buttons.
Press the SELECT button to activate the first password
digit.
Use the UP and DOWN arrow buttons to adjust the digit.
Press the SELECT button to advance to the next digit.
Adjust the remaining password digits.
Press ENTER to confirm your new password.
Ì Your new password is effective for both the display and communication ports.
To enable or disable password protection:
CtrL
On
1.
2.
3.
4.
Select “CtrL” in the upper window using the UP and
DOWN arrow buttons.
Press the SELECT button to activate the middle window.
Use the UP and DOWN arrow buttons to select the
desired option. “On” enables password protection, “OFF’
disables password protection.
Press ENTER to confirm your new setting, or ESC to
discard changes.
To exit the menu, press ESC.
Ì When password protection is enabled in your meter, you are not able to change
the device settings through the display or communications unless you provide a
correct password. If you cannot provide a proper password, contact your local
distributor for the appropriate password to override password protection.
50
Series PM175 Powermeters
Chapter 3 Display Operations
Menu Operations
Setting the Device Clock
To enter the menu, select the “rtc” entry from the main menu and press the
ENTER button. This menu allows you to set up the device clock and to
configure your local time zone settings.
hour
17.43.
To select a setup option, use the UP and DOWN arrow buttons from the
upper window.
25.
To change the time, date, or daylight savings setting:
dAtE
1.
01.23.
05.
2.
3.
4.
Highlight an item you want to change by pressing briefly
the SELECT button. When you enter the time setup
display, the hours and minutes are frozen to allow you to
adjust them.
Adjust the selected item with the UP and DOWN arrow
buttons.
Highlight the next item you want to change and adjust it in
the same manner.
Press ENTER to confirm your changes, or press ESC to
leave the clock settings unchanged. If you confirm the
time change while the seconds are highlighted, the
seconds are zeroed; otherwise they stay unchanged.
To exit the menu, press ESC.
The following table lists available options.
Label
Option
Format/Range
Description
hour
Time
hh.mm.ss
The time is displayed as hh.mm.ss, where
the hours and minutes are shown in the
middle window separated by a dot, and
the seconds - in the lower window.
dAte
Date
YY.MM.DD,
MM.DD.YY,
DD.MM.YY
The date is displayed as per the user
definition, where the first two items are
shown in the middle window, and the last
one - in the lower window. For
instructions on how to select the date
format, see “Display Setup”.
dAY
Day of week
Sun = Sunday
Πon = Monday
tuE = Tuesday
UEd = Wednesday
thu = Thursday
Fri = Friday
Sat = Saturday
The day of the week is displayed in the
lower window. It is set automatically
when you change the date.
dSt
Daylight savings diS = disabled
time option
En = enabled
When DST is disabled, the RTC operates
in standard time only. When enabled, the
device automatically updates the time at
2:00 AM at the pre-defined DST switch
dates.
dSt.S
DST start date
Month-weekweekday
Week = 1st, 2nd, 3rd,
4thor LSt (last week
of the month)
The date when Daylight Savings Time
begins. The DST switch point is specified
by the month, week of the month and
weekday. By default, DST starts at 2:00
AM on the first Sunday in April of each
year.
dSt.E
DST end date
Month-weekweekday
Week = 1st, 2nd, 3rd,
4thor LSt (last week
of the month)
The date when Daylight Savings Time
ends. The DST switch point is specified by
the month, week of the month and
weekday. By default, DST ends at 2:00
AM on the last Sunday in October of each
year.
Series PM175 Powermeters
51
Chapter 3 Display Operations
Menu Operations
Resetting Accumulators and Maximum Demands
rSt
Lo.Hi
do
To enter the menu, select the “rst” entry from the main menu, and then press
the ENTER button.
The Reset menu allows you to separately reset minimum/maximum log
records, maximum demands and counters.
To reset the desired registers:
1.
2.
3.
4.
5.
Highlight the middle window by pressing briefly the
SELECT button.
Select the desired entry by scrolling through the list with
the UP and DOWN arrow buttons until the desired entry
appears.
Press the SELECT button briefly to highlight the lower
item.
Press and hold the ENTER button for 5 seconds.
Release the button. The “do” entry is replaced with “done”
showing the operation is complete.
The following table shows available options.
Label
Description
Lo.Hi
Clears Min/Max log
A.dnd
Clears maximum ampere, volt and harmonic demands
P.dnd
Clears maximum power demands
dnd
Clears all maximum demands
Enr
Clears all total energies
tOU.d
Clears summary and TOU maximum demands
tOU.E
Clears summary and TOU energy registers
Cnt
Clears all counters
Cnt1 – Cnt4 Clears counter #1-#4
52
Series PM175 Powermeters
Chapter 4 PAS Application Software
Configuration Database
Chapter 4 PAS Application Software
Supplemental PAS software can be used for configuring the PM175 through
communication ports, for retrieving real-time and recorded data, and for
remote upgrading device firmware.
For information on how to install PAS on your PC, see the “PAS Getting
Started” guide supplied on the installation CD.
Configuration Database
To communicate with your meters, create a separate site database for each
device. All communication and configuration data for your meter is stored in
this database. During configuration store all setup data to the site database
so that PAS recognizes device properties regardless of whether the device is
online or offline.
To create a new database for your meter:
1.
Select Configuration from the Tools menu, and then click
the Sites button on the right-hand-side.
2.
From the “Look in” box, select the directory where a new
database will be stored. By default, it will be the “Sites”
directory. Type a site name for your device in the “File
name” box, click New, and then click OK.
3.
On the Instrument Setup tab, select “PM175” in the
“Model” box. PAS automatically selects the appropriate
instrument options for your meter.
4.
Select a correct CT secondary current (5A or 1A) for your
meter.
5.
If you wish to add any comments for your meter, type
them into the “Comment” box.
Setting up Communications
You can communicate with the meter via a changeable COM1
communication port, or through a second factory set serial RS-485/RS-422
COM2 port. Depending on what was ordered, your meter’s COM1 port can
be equipped with an RS-232/RS-422/RS-485 serial interface, with a dial-up
modem for communicating through public telephone lines, or with an
Ethernet module for communicating through the Internet.
Series PM175 Powermeters
53
Chapter 4 PAS Application Software
Setting up Communications
To configure your communications with the PM175:
1.
2.
3.
Select Configuration from the Tools menu. Under the
Communication group on the Instrument Setup tab, select
the type of connection for your device.
Set the device communication address you assigned to
the PM175.
In the “Sampling Rate” box, select a rate at which PAS
updates data on your screen when you continuously poll
the device in the PAS Data Monitor.
The communication protocol and port settings in PAS must match the
settings made in your device.
Communicating through a Serial Port
Select Serial Port/Modem Site on the Configuration tab, and then click on the
Connection tab to configure your serial port settings.
Configuring a Serial Port
1.
On the Connection tab, select a COM port from the
“Device” box, and then click Configure.
2.
Specify the baud rate and data format for the port.
Choose the same baud rate and data format as you have
set in the device, and then click OK. The default settings
for the local RS-232 and RS-422/485 ports are 19200
baud, 8 bits with no parity.
Selecting the Communications Protocol
1.
54
On the Connection tab, click Protocol.
Series PM175 Powermeters
Chapter 4 PAS Application Software
2.
Setting up Communications
In the “Protocol” box, select the same communications
protocol as you have in your meter. The default protocol
setting in your meter for all ports is Modbus RTU.
For more information on configuring the protocol parameters, refer to the
“PAS Getting Started” guide.
Communicating through a Dial-up Modem
Configuring a Modem
1.
2.
3.
4.
On the Connection tab, select a local modem installed on
your PC.
Click on Phones to add the phone number of the remote
meter to the phone list.
Type the phone number in the “Phone number” box, add
comments if you desire, click Add, and then click OK.
From the “Phone number” box on the Connection tab,
select the phone number from the list, and then click OK.
Selecting the Communications Protocol
On the Connection tab, click Protocol, and then select the protocol settings
as shown above for a serial port.
Communicating through the Internet
If you are communicating through the Ethernet port, you should define the IP
address of your meter on the network.
1.
2.
On the Instrument Setup tab, select Internet Site.
Click on the Connection tab.
3.
Click on the “IP address” and type in the IP address of
your meter. The default IP address preset at the factory is
192.168.0.203.
In the “Protocol” box, select the communications protocol
for the TCP port. The meter provides Modbus/TCP
connections on TCP port 502. The host port is set
automatically as you select the protocol. Select “Modbus
RTU” for Modbus/TCP.
4.
Series PM175 Powermeters
55
Chapter 4 PAS Application Software
5.
Setting Up the Meter
In the “Wait for answer” box, adjust the time that PAS
waits for a connection before announcing an error and the
number of retries PAS uses to receive a response from
the device if communications fail.
Setting Up the Meter
PAS allows you to prepare setup data for the meter off-line without the need
to have it connected to your PC.
Select the device site from the list box on the PAS toolbar, and then select
the desired setup group from the Meter Setup menu. Click on the tab with the
setup you want to create or modify, and then fill in the boxes with the desired
configuration data for your device. Click the “Save as…” button to store the
data to the site database.
Ì Always set up and store the Basic Setup data to the site database first. PAS uses
this data as a reference when arranging other meter setup.
To save your setup to another site database, select it from the file pane.
Click OK.
To reuse setups from another site, copy them to your present site database.
Click Open, select the desired site database, and click OK. The opened
setup is copied to your site database.
You can also copy all setups from one site database into another site's
database. Select a device site from the list box on the toolbar from which you
want to reproduce setups, and then select “Copy to...” from the Meter Setup
menu. Select the site database to which to copy setups, and click OK.
Downloading Setup to the Meter
You can update each setup in your meter one at a time or download all
setups together from the site database.
To update a particular setup in your device, check the On-line button on the
PAS toolbar, select a meter site from the list box on the toolbar, and then
select the desired setup group from the Meter Setup menu. Click on the tab
of the setup you want to download to the meter, and then click Send.
To download all setups to your device at once, check the On-line button on
the toolbar, select the device site from the list box on the toolbar, and then
select Download Setups from the Meter Setup menu.
Uploading Setup from the Meter
To upload the setup from the device to the site database, check the On-line
button on the toolbar, select the device site from the list box on the toolbar,
and then select Upload Setups from the Meter Setup menu.
Authorization
If communications with your device is secured, you are prompted for the
password when you send new setup data to the meter.
56
Series PM175 Powermeters
Chapter 4 PAS Application Software
Configuring Communications in your Meter
Enter the password and click OK. If your authorization was successful, you
are not prompted for the password again until you close the dialog window.
Configuring Communications in your Meter
This section describes how to configure communication ports in your meter
through PAS.
Setting Up Communication Ports
To enter the setup dialog, select the device site from the list box on the PAS
toolbar, select Communications Setup from the Meter Setup menu, and then
click on the Serial Ports Setup tab. In the Port box, select the desired device
port.
To change the port settings in your meter, select desired port parameters,
and then click Send. For the available communication options, see
Communication Ports in Chapter 3.
NOTE
When you change the COM1 settings in the meter through the
Ethernet port, the device port restarts so communications will
be temporarily lost. You may need to wait some additional time
until PAS restores a connection with your device.
Setting Up the Ethernet
To enter the Setup dialog, select the device site from the list box on the PAS
toolbar, select Communications Setup from the Meter Setup menu, and then
click on the Network Setup tab.
Series PM175 Powermeters
57
Chapter 4 PAS Application Software
General Meter Setup
The following table lists available network options.
Parameter
Options
Default
Device IP Address
192.168.0.203
Network Subnet Mask
255.255.255.0
Network Default Gateway
192.168.0.1
TCP Service Port
502 = Modbus/TCP
502
Ì The TCP service port can also be changed trough the COM1 serial port setup:
changing the protocol for the port automatically changes the TCP port for the
Ethernet.
To change the Ethernet settings in your meter, select desired parameters,
and then click Send.
NOTES
1.
The meter provides the permanent Modbus TCP server
on port 502.
2.
When you change the device network settings through the
Ethernet port, the device port restarts so communication
will be temporarily lost. You may need to wait some
additional time until PAS restores a connection with your
device.
General Meter Setup
This section describes how to configure the PM175 for your particular
environment and application using PAS.
Basic Meter Setup
Before operating your meter, provide the device with basic information about
your electrical network.
58
Series PM175 Powermeters
Chapter 4 PAS Application Software
General Meter Setup
To enter the Setup dialog, select the device site from the list box on the PAS
toolbar, and then select General Setup from the Meter Setup menu.
The following table lists available device configuration options.
Parameter
Options
Default
Description
Basic Configuration
Wiring mode
See Table below
4LN3
The wiring connection of the device
PT ratio
1.0-6500.0
1.0
The phase potential transformer’s
primary to secondary ratio
PT Ratio multiplier
×1, ×10
×1
PT Ratio multiplication factor. Used in
extra high voltage networks to
accommodate the PT ratio for 500 kV
and higher networks.
CT primary current
1-10000 A
5A
The primary rating of the phase
current transformer
Nominal voltage
10-690 V
120 V
The nominal secondary line-to-neutral
(in 4LN3, 3LN3 and 3BLN3 wiring
modes) or line-to-line (in 4LL3, 3LL3,
3BLL3, 3OP2, 3OP3 and 3DIR modes)
voltage. Used as a reference voltage
for the EN50160 evaluation.
Maximum demand
load current
0-10000 A
0
The maximum demand load current
(0 = CT primary)
Nominal frequency
50,60 Hz
60 Hz
The nominal line frequency
1
Demand Setup
30 min
The length of the demand period for
power demand calculations. If the
external synchronization is selected, a
pulse front on the digital input DI1
denotes the start of the demand
interval.
Number of blocks in 1-15
sliding demand
1
The number of blocks to be averaged
for sliding window demands
Volt/Ampere/THD
demand period
900 sec
The length of the demand period for
ampere, volt and THD demand
calculations
Power block
demand period
Series PM175 Powermeters
1, 2, 5, 10, 15,
20, 30, 60 min,
E=external sync
0-1800 sec
59
Chapter 4 PAS Application Software
General Meter Setup
1
PT Ratio is defined as a relation of the potential transformer’s primary voltage rating
to its secondary rating. For example, for the 14,400 V transformer’s primary rating
and 120 V secondary rating, the PT Ratio = 14400/120 = 120.
Available wiring modes are listed in the following table.
Wiring Mode
Description
3OP2
3-wire Open Delta using 2 CTs (2 element)
4LN3
4-wire Wye using 3 PTs (3 element), line-to-neutral voltage readings
3DIR2
3-wire Direct Connection using 2 CTs (2 element)
4LL3
4-wire Wye using 3 PTs (3 element), line-to-line voltage readings
3OP3
3-wire Open Delta using 3 CTs (2½ element)
3LN3
4-wire Wye using 2 PTs (2½ element), line-to-neutral voltage readings
3LL3
4-wire Wye using 2 PTs (2½ element), line-to-line voltage readings
3BLN3
3-wire Broken Delta using 2 PTs, 3 CTs (2½-element), line-to-neutral
voltage readings
3BLL3
3-wire Broken Delta using 2 PTs, 3 CTs (2½-element), line-to-line voltage
readings
Ì In 4LN3, 3LN3 and 3BLN3 wiring modes, the voltage readings for
min/max volts and volt demands represent line-to-neutral voltages;
otherwise, they will be line-to-line voltages. The voltage waveforms and
harmonics in 4LN3, 3LN3 and 3BLN3 wiring modes represent line-to-neutral
voltages; otherwise, they will be line-to-line voltages.
Device Options
This setup allows you to enable or disable optional calculations and redefine
user-selectable device options.
To enter the setup dialog, select the device site from the list box on the PAS
toolbar, select General Setup from the Meter Setup menu, and then click on
the Device Options tab.
The following table lists available device options.
Parameter
60
Options
Default
Description
Power Calculation
Mode
S=f(P, Q) (using
reactive power),
Q=f(S, P) (using
non-active power)
S=f(P, Q)
The method used for calculating
reactive and apparent powers
(see “Power Calculation Modes”
below)
Energy Roll Value
1000.0 kWh
10000.0 kWh
100000.0 kWh
1000000.0 kWh
10000000.0 kWh
100000000.0 kWh
100000000.0
The value at which energy
counters roll over to zero
Phase Energy
Calculation
Disabled, Enabled
Disabled
Enables phase energy calculations
Backup Battery
OFF = switched OFF OFF
On = switched ON
Allows to conserve a battery while
the meter is out of operation
Energy Test Mode OFF = disabled
Wh pulses
varh pulses
Disabled
Setting this option puts the meter
into the energy test mode
Volts Scale, V
10-828 V
144 V
The maximum voltage scale
allowed, in secondary volts. See
“Device Scales” below
Amps Scale, A
2 × nominal CT
secondary current
(2A, 10A)
2A/10 A
The maximum current scale
allowed, in secondary amps. Not
changeable. See “Device Scales”
below
Series PM175 Powermeters
Chapter 4 PAS Application Software
General Meter Setup
Power Calculation Modes
The power calculation mode option allows you to change the method for
calculating reactive and apparent powers in presence of high harmonics. The
options work as follows:
1. When the reactive power calculation mode is selected, active and reactive
powers are measured directly and apparent power is calculated as:
S = P 2 + Q2
This mode is recommended for electrical networks with low harmonic
distortion, commonly with THD < 5% for volts, and THD < 10% for currents.
In networks with high harmonics, the following method is preferable.
2. When the non-active power calculation mode is selected, active power is
measured directly, apparent power is taken as product S = V x I, where V
and I are the RMS volts and amps, and reactive power (called non-active
power) is calculated as:
N=
S2 − P2
Device Scales
The maximum values for volts, amps and power in the meter setup and in
communication are limited by the volts and amps scale settings. The
following table shows the scales used by the meter.
Scale
Conditions
Range
Maximum
All configurations
voltage (V max)
Voltage scale × PT Ratio, V
Maximum
current (I max)
All configurations
Current scale (2A/10A) × CT Ratio =
CT Primary current × 2, A 1
Maximum
Power
Wiring 4LN3, 3LN3,
3BLN3
V max × I max × 3, W
Wiring 4LL3, 3LL3, 3BLL3, V max × I max × 2, W
3OP2, 3OP3, 3DIR2
Series PM175 Powermeters
61
Chapter 4 PAS Application Software
Maximum
frequency
General Meter Setup
50 or 60 Hz
100 Hz
1 CT Ratio = CT primary current/CT secondary current
The default voltage scale in the meter is 144V. The recommended voltage
scale is 120V+20% = 144V for using with external PT’s, and 690V+20% =
828V for a direct connection to power line.
Maximum power is rounded to whole kilowatts. With PT=1.0, it is limited to
9,999,000 W.
Local Settings
This setup allows you to specify your time zone and daylight savings time
options.
To configure the time zone options for your device, select the device site
from the list box on the PAS toolbar, select General Setup from the Meter
Setup menu, and then click on the Local Settings tab.
The available options are described in the following table:
Parameter
62
Options
Default
Description
Country
Default, or country
name
Default
Defines calendar setting. The default
setting stands for the U.S.A.
Daylight savings
time
Disabled
Enabled
Enabled
When DST is disabled, the RTC
operates in standard time only. When
enabled, the device automatically
updates the time at 2:00 AM at the
pre-defined DST switch dates.
DST start month
DST start week
DST start weekday
The date when Daylight Savings Time
First
Month-weekSunday in begins. The DST switch point is
weekday
specified by the month, week of the
Week = 1st, 2nd, 3rd, April
month and weekday. By default, DST
4thor Last (last week
starts at 2:00 AM on the first Sunday
of the month)
in April of each year.
Series PM175 Powermeters
Chapter 4 PAS Application Software
General Meter Setup
Parameter
Options
Default
Description
DST end month
DST end week
DST end weekday
Last
Month-weekSunday in
weekday
Week = 1st, 2nd, 3rd, October
4thor Last (last week
of the month)
The date when Daylight Savings Time
ends. The DST switch point is
specified by the month, week of the
month and weekday. By default, DST
ends at 2:00 AM on the last Sunday
in October of each year.
Time
synchronization
input
None
DI1
DI2
The external port receiving the time
synchronization pulses
None
Daylight Savings Time
The daylight savings time option is enabled in the PM175 by default, and the
default daylight savings time change points are preset for the U.S.A. When
the daylight savings time is enabled, the meter automatically adjusts the
device clock at 02.00 AM when daylight savings time begins/ends.
If the daylight savings time option is disabled, you need to manually adjust
the device clock for daylight savings time.
Time Synchronization Pulses
External time synchronization pulses can be delivered through one of the
digital inputs. If a digital input is selected as the time synchronization source,
the edge of an external pulse adjusts the device clock at the nearest whole
minute. The time accuracy could be affected by the debounce time of the
digital input, and by the operation delay of the external relay.
Using Digital Inputs
The meter is provided with two digital inputs that can trigger the alarm/control
setpoints to give an alarm on input status change, or can be linked to the
energy/TOU registers to count pulses from external watt meters, or gas and
water meters.
To configure them in your device, select the device site from the list box on
the PAS toolbar, select General Setup from the Meter Setup menu, and then
click on the Digital Inputs tab.
Series PM175 Powermeters
63
Chapter 4 PAS Application Software
General Meter Setup
The available options are shown in the following table.
Parameter
Options
Pulse input mode PULSE MODE,
Pulse polarity
KYZ MODE
Default
PULSE
MODE
Description
In pulse mode, either leading, or
trailing edge of the input pulse is
recognized as an event. In KYZ
mode, both leading and trailing
edges of the input pulse are
recognized as separate events.
NORMAL (N.O.),
NORMAL
For the normal polarity, the open
to closed transition is considered a
pulse. For the inverting polarity,
the closed to open transition is
considered a pulse.
INVERTING (N.C.)
It has no meaning in KYZ mode
where both transitions are used.
Debounce time
1-1000 ms
10 ms
The amount of time while the state
of the digital input should not
change to be recognized as a new
state. Too low debounce time could
produce multiple events on the
input change.
The debounce time is used the same for both digital inputs. If you change the
debounce time for one digital input, the same debounce time is automatically
assigned to the other.
Using Relay Outputs
The PM175 is equipped with two relays. Each relay can be operated either
locally from the alarm/control setpoints in response to an external event, or
by a remote command sent through communications, and can also be linked
to an internal pulse source to produce energy pulses.
The available relay options are shown in the following table:
64
Series PM175 Powermeters
Chapter 4 PAS Application Software
Parameter
Operation
mode
General Meter Setup
Options
UNLATHCED
LATCHED
PULSE
KYZ
Default
UNLATCHED
Description
Unlatched mode: the relay goes into its
active state when the control setpoint is
in active (operated) state, and returns
into its non-active state when the
setpoint is released.
Latched mode: the relay goes into its
active state when the control setpoint
goes into active state and remains in
the active state until it is returned into
its non-active state by a remote
command.
Pulse mode: the relay goes into its
active state for the specified time, goes
into non-active state for the specified
time and remains in the non-active
state.
KYZ mode: the relay generates
transition pulses. The relay output state
is changed upon each command and
remains in this state until the next
command.
Polarity
NORMAL
(N.O.)
INVERTING
(N.C.)
NORMAL
With normal polarity, the relay is
normally de-energized in its non-active
state and is energized in its active
(operated) state.
With inverting polarity, the relay is
normally energized in its non-active
state and is de-energized in its active
(operated) state. It is called failsafe
relay operation.
Retentive
mode
NO
YES
NO
Applicable for latched relays.
In non-retentive mode, the relay always
returns to its non-active state upon
power up.
In retentive mode, the relay status is
restored to what it was prior to loss of
power.
Pulse width
20-1000 ms
100 ms
The actual pulse width is a multiple of
the 1/2-cycle time rounded to the
nearest bigger value.
The pause time between pulses is equal
to the pulse width.
Pulse
source
NONE
kWh IMP
kWh EXP
kvarh IMP
kvarh EXP
kvarh TOT
kVAh
0.1-1000.0
NONE
Links a pulse relay to the internal
energy pulse source. The relay must be
set into either pulse, or KYZ mode.
1.0 kWh/Pulse
Defines the pulse weight in kWh units
per pulse
Pulse rate,
kWh/Pulse
Generating Energy Pulses through Relay Outputs
To generate energy pulses through a relay output:
1.
Set a relay to either pulse, or KYZ mode, and then select
a polarity (active pulse edge) for energy pulses and a
pulse width.
2.
Select a source accumulator (type of energy) and the
pulse rate for your output.
3.
Store your new setup to the device.
Series PM175 Powermeters
65
Chapter 4 PAS Application Software
General Meter Setup
Programming Analog Inputs
The PM175 can be provided with two optional analog inputs with options for
0-1mA, ±1mA, 0-20mA or 4-20mA input currents, depending on the order.
The 0-1mA and ±1mA inputs can accept 100% overload currents, i.e., can
actually measure currents in the range of 0-2 mA and ±2mA.
The meter automatically converts the analog input readings received from
the analog-to-digital converter to the user-defined engineering scale and
shows the input values in true engineering units, for example, in volts, amps,
degrees, with the desired resolution.
To configure the Analog Inputs in your device, select General Setup from the
Meter Setup menu, then click on the Analog Inputs tab. If you are
programming your device online, analog inputs are designated as not
available if they are not present in the device.
The available options are described in the following table.
Option
AI type
Range
0-1mA
±1mA
0-20mA
4-20mA
Description
The analog input type. When connected to the meter,
shows the actual type received from the device. When
working off-line, select the analog input option
corresponding to your meter.
Zero scale
-999,999 to
999,999
Defines the low engineering scale (in primary units) for
the analog input corresponding to a lowest (zero) input
current (0 or 4 mA)
Full scale
-999,999 to
999,999
Defines the high engineering scale (in primary units) for
the analog input corresponding to a highest input
current (1 or 20 mA)
Dec. Places
0-3
The number of decimal digits in a fractional part of the
scaled engineering value
Value label
An arbitrary name you can give the analog input value
Always save your analog inputs setup to the site database in order to keep
the labels you give the analog inputs. They are not stored in your device.
66
Series PM175 Powermeters
Chapter 4 PAS Application Software
General Meter Setup
Scaling Non-directional Analog Inputs
For non-directional analog inputs with the 0-1mA, 0-20mA and 4-20mA
current options, provide both zero and full engineering scales. Each of the
scales operates independently.
Scaling ±1 mA Analog Inputs
For directional ±1 mA analog inputs, you should provide only the engineering
scale for the +1 mA input current. The engineering scale for the 0 mA input
current is always equal to zero. The device does not allow you to access this
setting. Whenever the direction of the input current is changed to negative,
the device automatically uses your full engineering scale settings for +1 mA
with a negative sign.
Scaling Analog Inputs for 0-2 mA and ±2 mA
The input scales for 0-1 mA and ±1 mA analog inputs are always
programmed for 0 mA and +1 mA regardless of the desired input range. If
you want to use the entire input range of 2 mA or ±2 mA, set the analog input
scales in your device as follows:
0-2 mA: set the 1 mA scale to 1/2 of the required full scale output for unidirectional parameters, and set the 0 mA scale to the negative full scale
and the 1 mA scale to zero for bi-directional parameters.
±2 mA: set the 1 mA scale to 1/2 of the required full-scale output for both
uni-directional and bi-directional parameters.
For example, to convert voltage readings from the analog transducer that
transmits them in the range of 0 to 2 mA to the range 0 to 120V, set the full
range for the +1 mA analog input to 60V; then the 2 mA reading is scaled to
120V.
Programming Analog Outputs
The meter can be ordered with two optional analog outputs with options for
0-1mA, ±1mA, 0-20mA or 4-20mA output currents.
The 0-1mA and ±1mA current outputs provide a 100% overload, and actually
output currents up to 2 mA and ±2mA whenever the output value exceeds
the engineering scale set for the 1 mA or ±1mA.
To configure the Analog Outputs in your device, select General Setup from
the Meter Setup menu, then click on the Analog Outputs tab. If you are
programming your device online, analog outputs are designated as not
available if they are not present in the device.
The available analog output options are described in the following table.
Option
AO type
Output
parameter
Range
0-1mA
±1mA
0-20mA
4-20mA
See Appendix B
Description
The analog output type. When connected to the
meter, shows the actual AO type read from the
device. When working off-line, select the analog
output option corresponding to your meter.
Selects the measured parameter to be transmitted
through the analog output channel.
Zero scale
Defines the low engineering scale (in primary units)
for the analog output corresponding to a lowest
(zero) output current (0 or 4 mA)
Full scale
Defines the high engineering scale (in primary units)
for the analog output corresponding to a highest
output current (1 or 20 mA)
When you select an output parameter for the analog output channel, the
default engineering scales are set automatically. They represent the
maximum available scales. If the parameter actually covers a lower range,
Series PM175 Powermeters
67
Chapter 4 PAS Application Software
General Meter Setup
you can change the scales to provide a better resolution on the analog
outputs.
Scaling Non-directional Analog Outputs
When programming scales for non-directional analog outputs with a 0-1mA,
0-20mA or 4-20mA current option, you can change both zero and full
engineering scales for any parameter. The engineering scale need not be
symmetrical.
Scaling Directional Power Factor
The engineering scale for the signed power factor emulates analog power
factor meters. The power factor scale is -0 to +0 and is symmetrical with
regard to ±1.000 (-1.000 ≡ +1.000). Negative power factor is scaled as
-1.000 minus measured value, and non-negative power factor is scaled as
+1.000 minus measured value. To define the entire power factor range from
-0 to +0, the default scales are specified as -0.000 to 0.000.
Scaling ±1 mA Analog Outputs
Programming engineering scales for directional ±1mA analog outputs
depends on whether the output parameter represents unsigned (as volts and
amps) or signed (as powers and power factor) values.
If the output value is unsigned, you can change both zero and full
engineering scales.
If the parameter represents a signed (directional) value, you should provide
only the engineering scale for the +1 mA output current. The engineering
scale for the 0 mA output current is always equal to zero for all values except
the signed power factor, for which it is set to 1.000 (see “Scaling Directional
Power Factor” above). The device does not allow you access to this setting if
the parameter is directional. Whenever the sign of the output parameter is
changed to negative, the device automatically uses your full engineering
scale settings for +1 mA with a negative sign.
68
Series PM175 Powermeters
Chapter 4 PAS Application Software
General Meter Setup
Scaling Analog Outputs for 0-2 mA and ±2 mA
The output scales for 0-1 mA and ±1 mA analog outputs are programmed for
0 mA and +1 mA regardless of the desired output current range. To use the
entire output range of 2 mA or ±2 mA, set the analog output scales in your
device as follows:
0-2 mA: set the 1 mA scale to 1/2 of the required full scale output for unidirectional parameters, and set the 0 mA scale to the negative full scale
and the 1 mA scale to zero for bi-directional parameters.
±2 mA: set the 1 mA scale to 1/2 of the required full-scale output for both
uni-directional and bi-directional parameters.
For example, to provide the 0 to 2 mA output current range for volts
measured by the meter in the range of 0 to 120V, set the 1 mA scale to 60V;
then the 120V reading will be scaled to 2 mA.
Using Counters
The meter provides four six-digit counters that count different events.
To configure the device counters, select General Setup from the Meter Setup
menu, then click on the Pulse/Event Counters tab.
Each counter is independently linked to any digital input and count input
pulses with a programmable scale factor. Each counter can also be
incremented in response to any internal or external event, and checked and
cleared through the Control Setpoints.
The following table lists available options.
Option
Range
Default
Description
Pulse Input
None,
DI1-DI2
None
Links a digital input to the counter
Multiplier
1-9999
1
The value added to the counter
when a pulse is detected on the
pulse source input
Counter Value
Series PM175 Powermeters
Displays the present counter
contents
69
Chapter 4 PAS Application Software
General Meter Setup
You can preset a counter to a desired value or clear it through this dialog
without affecting the counter setup. Check the Online button on the PAS
toolbar before entering the setup dialog, type in the desired value into the
Counter Value box, and then click Send.
Using Periodic Timers
The PM175 provides two programmable interval timers that can be used for
periodic recording and triggering operations on a time basis via the Control
Setpoints. When a timer interval expires, the timer generates an internal
event that can trigger any setpoint (see Using Control Setpoints).
To configure the device timers, select General Setup from the Meter Setup
menu, and then click on the Periodic Timers tab.
To run a periodic timer, specify a non-zero time period for the timer. The time
period can be set from 1 to 9999 seconds.
To stop a timer, set the time period to zero.
Using Control Setpoints
The PM175 has an embedded logical controller that runs different actions in
response to user-defined internal and external events. Unlike a PLC, the
meter uses a simplified programming technique based on setpoints that
allows the user to define a logical expression based on measured analog
and digital values that produce a required action.
The meter provides 16 control setpoints with programmable operate and
release delays. Each setpoint evaluates a logical expression with up to four
arguments using OR/AND logic. Whenever an expression is evaluated as
“true”, the setpoint performs up to four concurrent actions that can send a
command to the output relays, increment or decrement a counter, or trigger a
recorder.
The logical controller provides very fast response to events. The scan time
for all setpoints is 1/2 cycle time (8.8 ms at 60Hz and 10 ms at 50 Hz).
To program the setpoints, select General Setup from the Meter Setup menu,
and then click on the Control/Alarm Setpoints tab.
70
Series PM175 Powermeters
Chapter 4 PAS Application Software
General Meter Setup
The available setpoint options are described in the following table.
Option
Range
Description
Triggers
OR/AND
OR, AND
The logical operator for the trigger
Trigger
parameter
See Appendix C
The trigger parameter that is used as an argument in
the logical expression
Operate limit
The threshold (in primary units) at which the
conditional expression would be evaluated to true.
Not applicable for digital triggers.
Release limit
The threshold (in primary units) at which the
conditional expression would be evaluated to false.
Defines the hysteresis for analog triggers. Not
applicable for digital triggers.
Actions
Action
See Appendix C
The action performed when the setpoint expression is
evaluated to true (the setpoint is in operated state)
Delays
Operate delay 0.1-999.9 sec
Release delay
0.1-999.9 sec
The time delay before operation when the operate
conditions are fulfilled
The time delay before release when the release
conditions are fulfilled
Setpoint #1 is factory preset to provide standard periodic data logs on a 15minute time basis. It is linked to the device clock and runs data logs #1 and
#2 at 15-minute boundaries of an hour.
Using Logical Expressions
Logical operators OR/AND are treated in a simplified manner. They have no
specific priority or precedence rules.
Any trigger condition bound to the logical expression by the OR operator and
evaluated as “true” will override any preceding condition evaluated as “false”.
Similarly, any trigger condition evaluated as “false” and bound by the AND
operator will override any condition evaluated before it as “true”.
Series PM175 Powermeters
71
Chapter 4 PAS Application Software
General Meter Setup
To avoid confusion, it is recommended not to alternate different logical
operators in one expression. Instead, bring all conditions that use the same
logical operator together at one side of the expression, and the others - at
the opposite side.
To explicitly override all other conditions with the critical trigger, put it at the
end of the expression using the OR operator if you want the setpoint to be
operated anyway when the trigger condition is asserted, and with the AND
operator, if the setpoint should not be operated while the critical trigger is not
asserted.
Using Numeric Triggers
For numeric (analog) triggers, a setpoint allows you to specify two thresholds
for each trigger to provide hysteresis (dead band) for setpoint operations.
The Operate Limit defines the operating threshold, and the second Release
Limit defines the release threshold for the trigger. The trigger thresholds are
specified in primary units.
If you do not want to use hysteresis for the trigger, set the Release Limit to
the same as the Operate Limit.
Using Binary Triggers
Binary (digital) triggers, like digital inputs, relays, or internal static and pulsed
events, are tested for ON (closed/set) or OFF (open/cleared) status.
The binary events are divided into two types: static events and pulsed
events. Static events are level-sensitive events. A static event is asserted all
the time while the corresponding condition exists. Examples are digital
inputs, relays and event flags.
Pulsed events are edge-sensitive events with auto-reset. A pulsed event is
generated for a trigger only once when a positive transition edge is detected
on the trigger input. The examples of pulsed events are pulse inputs
(transition pulses on the digital inputs), internal pulsed events (energy pulses
and time interval pulses), and events generated by the interval timers. The
logical controller automatically clears pulsed events at the end of each scan,
so that triggers that used pulsed events are prevented from being triggered
by the same event once again.
Using Event Flags
The PM175 provides 8 common binary flags, called event flags, which can
be individually set, cleared and tested through setpoints and via
communications.
Event flags can be used in different applications, for example, to transfer
events between setpoints in order to expand a logical expression or a list of
actions that have to be done for a specific event, or to externally trigger
setpoint actions from the SCADA system or from a PLC through
communications.
Using Interval Timers
The PM175 provides four interval timers that are commonly used for periodic
recording of interval data at the time of the fault or in the presence of other
events detected by a setpoint. The timers can be programmed to generate
periodic events at user-defined intervals (see Using Periodic Timers).
Interval timers are not synchronized with the clock. When you run a timer, it
generates a pulsed event that can trigger a setpoint if you have put the timer
into a list of the setpoint triggers. When the setpoint event is asserted, the
timer is restarted, and then generates the next event when the timer interval
expires.
If you want to record interval data at predefined intervals without linking to
other events, just select a timer as a setpoint trigger and specify a data log
file you want to use for recording, in the setpoint actions list. If you want the
periodic data to be recorded in presence of a specific event, select triggers
72
Series PM175 Powermeters
Chapter 4 PAS Application Software
General Meter Setup
that will identify your event, and then add the timer at the end of the trigger
list using the AND operator.
Using Time Triggers
If you want the setpoint actions to be synchronized with the clock, for
example, to provide synchronous recording interval data each 15 minutes or
each hour, or to output time pulses through relay contacts, use the time
triggers that generate static events synchronized to the device clock.
You can exercise the default setting for Setpoint #1 in your device as an
example of using time triggers. The setpoint is pre-programmed for data
profiling at 15-minute intervals using data logs #1 and #2.
Delaying Setpoint Operations
Two optional delays can be added to each setpoint to extend monitoring
setpoint triggers for a longer time before making a decision on whether the
expected event occurred or not. When a delay is specified, the logical
controller will change the setpoint status only if all conditions are asserted for
a period at least as long as the delay time.
Note that you cannot use delays with pulsed events since they are cleared
immediately and will no longer exist on the next setpoint scan.
Using Setpoint Events and Actions
When a setpoint status changes, i.e., a setpoint event is either asserted or
de-asserted, the following happens in your device:
1.
2.
3.
The new setpoint status is logged to the setpoint status
register that can be monitored through communications
from the SCADA system or from a programmable
controller in order to give an indication on the expected
event.
The operated setpoint status is latched to the setpoint
alarm latch register accessible through communications.
The register holds the last setpoint alarm status until it is
explicitly cleared through communications.
Up to four programmable actions can be performed in
sequence on setpoint status transition when a setpoint
event is asserted.
Generally, setpoint actions are performed independently for each setpoint
and can be repeated a number of times for the same target. The exceptions
are relay operations, data logging and waveform logging that are shared for
each separate target between all setpoints using an OR scheme.
A relay output is operated when one of the setpoints linked to the relay is
activated and will stay in the operated state until all of these setpoints are
released (except for latched relays that require a separate release command
to be deactivated).
Data logging and waveform logging directed to the same file are done once
for the first setpoint among those that specify the same action, guaranteeing
that there will not be repeated records related to the same time.
Recording Setpoint Events
Time-tagged setpoint events can be recorded to the device Event log if you
put a corresponding action into the setpoint action list. The Event recorder
will log any setpoint transition event: both when the setpoint is operated, and
when it is released. The Event recorder will put into a log file a separate
record for each active trigger caused a setpoint status transition, and a
separate record for each action done on the setpoint activation (except for
data logging actions that are not recorded to the Event log).
Series PM175 Powermeters
73
Chapter 4 PAS Application Software
Configuring Summary Energy and TOU Registers
Configuring Summary Energy and TOU Registers
The PM175 provides 8 total (summary) energy and 8 concurrent tariff energy
and maximum demand registers that can be linked to any internal energy
source or to any external pulse source that delivers pulses through the
device digital inputs.
The meter tariff structure supports 8 different tariffs using an arbitrary tariff
schedule. A total of 4 types of days and 4 seasons are supported with up to
eight tariff changes per day.
The meter can provide automatic daily profile recording for total and tariff
energy and maximum demand registers.
By default, the billing registers in your meter and the tariff system are not
operational. To activate the summary/tariff registers or to change the profile
for the first billing register:
1.
Link the billing registers to the respective energy sources,
and then configure the options for these registers like
whether the only totalization or both total and tariff
registers would be used, and whether daily profiling
should be enabled for the energy usage and maximum
demand registers.
2.
Configure the daily tariff schedule using the TOU daily
profiles for all types of days and seasons.
3.
Configure the season tariff schedule using the TOU
calendar.
Setting up Total and Tariff Registers
To configure the device total (summary) and TOU registers, select
Energy/TOU from the Meter Setup menu.
74
Series PM175 Powermeters
Chapter 4 PAS Application Software
Configuring Summary Energy and TOU Registers
The available options are shown in the following table:
Parameter
Options
Default
Description
Summary/TOU Registers
TOU
Unchecked
Checked
Unchecked
Links tariff registers to the selected
energy source
Use Profl
Unchecked
Checked
Unchecked
Enables automatic daily profiling for
energy usage registers (both total and
tariff registers if TOU is enabled)
Dmd Profl
Unchecked
Checked
Unchecked
Enables automatic daily profiling for
maximum demand registers (both total
and tariff registers if TOU is enabled)
Sum Profl
Unchecked
Checked
Unchecked
Enables daily profiling for summary
registers (total of all tariffs)
Units
None
kWh, kvarh, kVAh,
3
m , CF (cubic foot),
CCF (hundred cubic
feet)
The register measurement units. When
a register is linked to an internal energy
source, it is set automatically. When an
external pulse source is used, the user
can select a measurement unit for the
register.
Register Source List
Source
Input
None
kWh Import
kWh Export
kvarh Import
kvarh Export
kVAh,
DI1-DI2
None
Links an energy source to the register
Multiplier
0.001 to 100.000
1.000
The multiplication factor for the energy
source.
Target
Reg#1- Reg#8
None
Defines the target billing register for the
energy source. It is set automatically.
Configuring the Daily Tariff Schedule
To configure your daily tariff schedule, select Energy/TOU from the Meter
Setup menu, and then click on the TOU Daily Profiles tab.
Series PM175 Powermeters
75
Chapter 4 PAS Application Software
Configuring Summary Energy and TOU Registers
The daily profile setup allows you to specify the daily tariff change points with
a 15-minute resolution for 4 seasons using 4 different daily schedules for
each season.
To configure your daily profiles:
1.
Select the desired season and day type.
2.
Select the start time for each tariff change point and the
corresponding active tariff number.
3.
Repeat the setup for all active profiles.
The first tariff change point is fixed at 00:00 hours, and the last tariff change
you specified will be in use until 00:00 hours on the next day.
The energy daily profile log will be automatically configured for the number of
active tariffs you defined in the meter TOU daily profile.
Configuring the Season Tariff Schedule
To configure your season tariff schedule, select Energy/TOU from the Meter
Setup menu, and then click on the TOU Calendar tab.
The meter’s TOU calendar allows you to configure any tariff schedule based
on any possible utility regulation. The calendar itself has 32 entries that allow
you to specify profiles for working days and holidays through all seasons in
any order that is convenient for you, based on simple intuitive rules. There
are no limitations on how to define your schedule. The meter is able to
automatically recognize your settings and to select a proper daily tariff
schedule for any day within a year.
The above picture gives you an example of a single-season tariff schedule
configured for weekends and the designated U.S.A. holidays.
To configure your season tariff schedule:
1.
76
In the “Season” box, select the season, and in the “Day
Type” box, select a day type for this calendar entry.
Series PM175 Powermeters
Chapter 4 PAS Application Software
Configuring Summary Energy and TOU Registers
2.
Select the time interval when this daily tariff schedule is
effective, based on the start and the end weekdays and,
for a multi-season schedule, on the start and the end
month for the selected season. It does not matter which
order of weekdays or months you select: the meter
recognizes the correct order.
3.
For exception days like designated holidays, select a
specific day either by specifying a day and month, or by
selecting a month, a week and a weekday within the
month.
Series PM175 Powermeters
77
Chapter 4 PAS Application Software
Configuring Recorders
Configuring Recorders
The PM175 is provided with a 1-Megabyte onboard non-volatile memory for
data, event and waveform recording.
Before using recorders, the device memory should be partitioned between
log files. The device memory is fully configurable. You can define how much
memory to allocate for each log file. If you want to change the factory
settings, follow the guidelines in the section below.
Configuring Device Memory
The device memory can be partitioned for a total of 20 log files:
•
•
•
•
Event log
16 Data logs
2 Waveform logs
EN50160 Power Quality log
Two of the data log files – Data log #9 and #10 – are automatically configured
in your meter for recording EN51060 compliance statistics data and
harmonics survey data. You cannot change the file records structure, but you
can change the amount of memory that will be allocated for recording data.
To view the present device memory settings, select Memory/Log from the
Meter Setup menu, and then click on the Log Memory tab.
The following table lists available file options.
Option
Type
78
Range
Wrap-around
Non-wrap
TOU Daily
Profile
Description
Defines the file behavior when it is filled up.
Wrap-around: recording continues over the oldest records.
Non-wrap: recording is stopped until the file is cleared.
TOU Daily profile: TOU daily profile data log (only for Data log
#16).
Size
The memory size allocated to the file. Set automatically depending
on the size of the records and the number of records in the file.
Sections/Channels 0-14
The numbers of sections in a multi-section TOU profile data log
file, or the number of recording channels in a waveform log file
Series PM175 Powermeters
Chapter 4 PAS Application Software
Option
Num. of Records
Range
0-65535
Configuring Recorders
Description
Allocates the file memory for predefined number of records
Record size
The size of the file record for a single channel or a section. Set
automatically depending on the file and on the number of
parameters in the data record
0-16
Parameters
The number of parameters in a single data record (not including
the EN50160 statistics files)
Memory is allocated for each file statically when you set up your files and will
not change unless you re-organize the files. The meter automatically
performs de-fragmentation of the memory each time you re-organize your
files. This helps keep all free memory in one continuous block and thus
prevents possible leakage of memory caused by fragmentation.
To change the file properties or to allocate the memory for a new file, double
click on the file partition you want to change, select desired parameters for
your log, and click OK. For your reference, the record size and the number of
records available for your file are reported in the dialog box.
To delete an existing file partition, click on Delete and then click OK.
The following table shows how to calculate a file size for different log files.
File
Record Size, Bytes
Event Log
File Size, Bytes
Record size × Number of records
20
Data Log
12 + 4 × Number of parameters
Record size × Number of records
EN50160 Compliance
Statistics, Data log #9
148 (per channel) × 12
Record size × Number of records
EN50160 Harmonics
Survey, Data log #10
220 (per channel) × 3
Record size × Number of records
TOU Profile Log, Data
log #16
12 + 4 × (Number of season
tariffs + 1 if the TOU summary
register is ordered)
Record size × Number of TOU registers x
Number of records (× 2 if the maximum
demand profile is also ordered)
Waveform Log
1068 (per channel)
Record size × Number of Channels x
Number of series (events) × Number of
records per series
EN50160 Power Quality
Log
32
Record size × Number of records
For more information on configuring specific files, see “Configuring Data Log
Files” and “Configuring Waveform Files” below.
The memory is pre-configured for common data trending and fault recording
applications as shown in the following table.
No.
File
Type
Size,
Bytes
Channels Number of Number of
Records
Events
Description
1
Event log
Wrap
around
20000
1000
1000
2
Data log #1
Wrap
around
109440
1440
1440
Configured for data
trending
3
Data log #2
Wrap
around
109440
1440
1440
Configured for data
trending
10
Data log #9
Wrap
around
21312
12
12
12
Configured for
EN50160
compliance statistics
11
Data log #10
Wrap
around
7920
3
12
12
Configured for
EN50160 harmonics
survey
18
Waveform log #1
Wrap
around
256320
6
40
20
32 samples/cycle
x 32 cycles/series
19
Waveform log #2
Wrap
around
256320
6
40
20
128 samples/cycle
x 8 cycles/series
27
EN50160 Power
Quality log
Wrap
around
32000
1000
1000
Series PM175 Powermeters
79
Chapter 4 PAS Application Software
Configuring Recorders
Configuring the Event Recorder
To configure the Event log file:
1.
Double click on the Event Log file partition with the left
mouse button.
2.
3.
Select a partition type for your file.
Select the maximum number of records you want to be
recorded in the file.
Click OK, then send your new setup to the meter or save
to the device database.
4.
By default, the Event recorder stores all events related to configuration
changes, reset, and device diagnostics. In addition, it records events related
to setpoint operations. Each setpoint should be individually enabled for
recording to the Event log.
To log setpoint operations, add the “Event log” action to the setpoint actions
list. When a setpoint event happens, the Event recorder logs all setpoint
conditions that caused the event and all setpoint actions performed in
response to the event. Logging actions themselves will not be recorded to
the Event log.
Configuring the Data Recorder
The Data recorder is programmable to record up to 16 data parameters per
record in each of 16 data log files. The list of parameters to be recorded to a
data log is configured individually for each file.
Conventional Data Log Files
To create a new data log file or re-configure an existing file:
1.
80
Double click on the file partition with the left mouse
button.
Series PM175 Powermeters
Chapter 4 PAS Application Software
2.
3.
4.
5.
6.
7.
Series PM175 Powermeters
Configuring Recorders
Select a partition type for your file.
Select the number of parameters you want to be recorded
in the file records.
Select the maximum number of records you want to be
recorded in the file.
Click OK, and then send your new setup to the meter, or
save to the device database.
Highlight the data log file row with the left mouse button,
and then click on the “Setup Recorder” button, or click on
the “Data Recorder” tab and select the log number
corresponding to your file.
Configure the list of parameters to be recorded in your
data log file. You are not allowed to select more
parameters than you defined when configuring your file.
Refer to Appendix D for a list of available parameters.
For your convenience, PAS will follow your selection and help you to
configure a series of the neighboring parameters: when you open the
“Group” box for the next parameter, PAS highlights the same group as in
your previous selection; if you select this group again, PAS will
automatically update the “Parameter” box with the following parameter
in the group.
81
Chapter 4 PAS Application Software
8.
9.
Configuring Recorders
Add the name for your data log file in the “Name” box. It
will appear in the data log reports.
Save your new setup to the device database, and send it
to the meter.
Factory Preset Periodic Data Logs
Data logs #1 and #2 are factory preset for periodic recording of the standard
power quantities as shown in the following table.
No.
1
2
3
4
5
6
7
8
1
2
3
4
5
6
7
8
Parameter
No.
Data Log #1
V1/V12
9
V2/V23
10
V3/V31
11
I1
12
I2
13
I3
14
Total kW
15
Total kvar
16
Data Log #2
V1/V12 Demand
9
V2/V23 Demand
10
V3/V31 Demand
11
I1 Demand
12
I2 Demand
13
I3 Demand
14
kW Import Sliding Demand
15
kvar Import Sliding Demand
16
Parameter
Total kVA
Total PF
V1/V12 THD
V2/V23 THD
V3/V31 THD
I1 THD
I2 THD
I3 THD
KVA Sliding Demand
kWh Import
kWh Export
kvarh Import
kvarh Export
kVAh
In
Frequency
TOU Profile Data Log Files
Data log #16 is configurable to store TOU daily profile log records on a daily
basis.
A TOU profile log file is organized as a multi-section file that has a separate
section for each TOU energy and maximum demand register. The number of
sections is taken automatically from the Summary/TOU Registers setup (see
Setting up Total and Tariff Registers). If you selected to profile TOU maximum
demands along with energy registers, then the number of sections in the file
will be twice the number of the allocated TOU registers.
To configure a TOU daily profile log file:
1.
2.
3.
82
Configure your TOU registers and TOU schedule in the
meter before allocating memory for the profile log file (see
Setting up Total and Tariff Registers).
Double click on the Data Log#16 partition with the left
mouse button.
Select the TOU Daily Profile file type.
Series PM175 Powermeters
Chapter 4 PAS Application Software
4.
5.
6.
Configuring Recorders
Select the number of season tariffs in your TOU schedule.
Add one additional parameter if you selected to record the
Summary (TOU total) registers as well.
Select the maximum number of records you want to be
recorded in the file assuming that a new record will be
added once a day.
Click OK and send your setup to the meter or save to the
database.
Configuring the Waveform Recorder
Waveform log files are organized as multi-section files that store data for
each recording channel in a separate section. A waveform log file stores up
to 6 channels simultaneously: three voltage and three current channels.
A single channel waveform record contains 512 points of the sampled input
signal. If a waveform log is configured to record more samples per event
than a single record can hold, the waveform recorder stores as many records
per event as required to record the entire event. All waveform records related
to the event are merged in a series and have the same series number, so
they can be plotted together.
The PM175 supports two waveform files that record waveforms at three
programmable sampling rates: 32, 64 or 128 samples per cycle.
To configure a waveform log file:
1.
Double click on a waveform log partition with the left
mouse button.
2.
3.
Select a partition type for your file.
Select the maximum number of records you want to be
recorded in the file.
The number of records in the waveform log file needed to store one
waveform event (series) is defined as follows:
Number of Records per Series = Sampling Rate (Samples per Cycle) x
Number of Cycles per Event / 512
The total number of records you must allocate to store the required
number of events (series) is defined as follows:
Number of Records = Number of Records per Series x Number of Series
For example, if you want to record a 64-cycle waveform sampled at a
rate of 32 samples per cycle, the number of records required for one
waveform series would be:
Number of Records per Series = (32 x 64)/512 = 4.
If you want to allocate space sufficient to store 20 waveform events
(series), you should set up the waveform log file for 4 x 20 = 80 records.
Series PM175 Powermeters
83
Chapter 4 PAS Application Software
4.
5.
Configuring Recorders
Click OK, and send your setup to the meter or save to the
database.
Click “Setup Recorder”, or click on the “Waveform
Recorder” tab.
The following table lists available waveform options.
Option
Samples per Cycle
Description
Waveform sampling rate
Defines the total duration of the
waveform per event/series
Before Cycles
16-2560 (32 samples/cycle),
8-1280 (64 samples/cycle),
4-640 (128 samples/cycle)
1-20
Num. of Channels
1-6
The number of the simultaneously
recorded channels
Cycles per Series
6.
7.
8.
9.
84
Format/Range
32, 64, 128
Defines the number of cycles to be
recorded prior to event
Select the sampling rate for waveforms.
Select the number of cycles to be recorded prior to the
event, and a total number of cycles in the waveform.
Add the name for your waveform log file in the “Name”
box. It will appear in the waveform reports.
To select the AC channels, click on the Channels button,
check the boxes for channels you want to be recorded,
and then click OK.
Series PM175 Powermeters
Chapter 4 PAS Application Software
Configuring Recorders
10. Save your waveform setup to the device database, and
send it to the meter.
Series PM175 Powermeters
85
Chapter 4 PAS Application Software
EN50160 Evaluation and Recording
EN50160 Evaluation and Recording
EN50160 Background
The EN50160 European standard “Voltage characteristics of electricity
supplied by public distribution systems” issued by CENELEC defines the
main physical characteristics of electric energy supplied by low and medium
voltage public distribution systems under normal operating conditions.
The voltage characteristics are evaluated using a statistical approach. The
standard and its referenced publications specify for each voltage
characteristic:
-
Method of evaluation
Integrating interval for a single measurement
Observation period
Statistical indication of the probability of not exceeding a specified limit
Standard compliance limits or indicative values within which any
customer can expect the voltage characteristics to remain
Compliance Limits
For some voltage characteristics, the standard provides definite limits that
can be complied with for most of the time considering the possibility of
relatively rare excursions beyond these limits. Limits are set with a view to
compliance for a percentage of the observation time, e.g. 95% of the
observations in any period of one week.
The following table gives the characteristics for which definite limits have
been specified by the standard.
Voltage characteristic
Power frequency
Voltage variations (supply
voltage magnitude)
Rapid voltage changes
Flicker (fluctuations of
voltage magnitude)
Voltage unbalance
Harmonic voltage
Interharmonic voltage
Mains signaling voltage
Compliance with stated
limits, % of time
±1% for 95% of a week
±1% for 99.5% of a year
+4/-6% for 100% of time
±10% Un for 95% of time
Observation
period
Week, year
≤4-5% Un (up to 10% Un)
Plt ≤ 1 for 95% of time
Day
Week
≤2-3% for 95% of time
THD ≤ 8 for 95% of time
To be defined
Within “Meister-curve” for
99% of time
Week
Week
Week
Day
Week
Indicatives Values
For the remaining characteristics of the voltage, by their unpredictable
nature, the standard gives only indicative values, which are intended to
provide users with information on the order of magnitude which can be
expected.
The following table gives the characteristics for which indicative values have
been specified by the standard.
Voltage Characteristic
Voltage dips
Short interruptions
Long interruptions
Temporary overvoltages
Transient overvoltages
86
Indicative values
Less than 1 s, 60% depth
70% less than 1 s
10 to 50% less than 3 min
Less than 1.5 kV RMS
Less than 6 kV peak
Observation
period
Year
Year
Year
Year
Year
Series PM175 Powermeters
Chapter 4 PAS Application Software
EN50160 Evaluation and Recording
Resources
CENELEC publications:
EN 50160:1999 Voltage characteristics of electricity supplied by public
distribution systems
IEC publications:
IEC 61000-4-7:2002 Electromagnetic compatibility (EMC) – Part 4-7 Testing
and measurement techniques – General guide on harmonics and
interharmonics measurements and instrumentation, for power supply
systems and equipment connected thereto,
IEC 61000-4-15:2003 Electromagnetic compatibility (EMC) – Part 4 Testing
and measurement techniques – Section 15: Flickermeter – Functional and
design specifications
IEC 61000-4-30:2003 Electromagnetic compatibility (EMC) – Part 4-30
Testing and measurement techniques – Power quality measurement methods
Eurelectric (Union of the Electricity Industry) publications:
Application guide to the European Standard EN 50160 on Voltage
characteristics of electricity supplied by public distribution systems, Ref:
23002 Ren9530, July 1995
Measurement guide for voltage characteristics, Ref: 23002 Ren9531, July
1995
Evaluation Techniques
EN50160 Evaluation Counters
Evaluation Counters and Evaluation Period
The PM175 uses a set of the evaluation counters for collecting EN50160
statistics within a specified evaluation period.
The evaluation period is the period of time within which the meter collects
statistical evaluation data. Supply voltage characteristics can be evaluated
on a weekly or daily basis. The evaluation period being normally preset in
your meter to a week can be changed via the EN50160 Advanced setup.
At the end of the evaluation period, the meter records collected statistical
evaluation data to a log file, and then clears the evaluation registers and
counters so that each evaluation period’s statistics is stored in a separate
record.
You can upload and view the online statistics data via PAS reports, using
data collected since the beginning of the present evaluation interval. You can
also manually clear the present contents of the counters though PAS before
starting your EN50160 evaluation.
Observation Period
The observation period is the period of time within which the voltage
characteristics shall be assessed to ensure compliance with the standard.
The observation periods declared by the EN50160 may differ for
characteristics for which compliance limits are specified in the standard,
usually one week, and for those for which only indicative values are
provided, usually one year.
The EN50160 compliance reports produced by PAS provide correct weekly
and yearly observation statistics regardless of the evaluation periods used
for collecting data. Whenever needed, PAS will aggregate records within a
number of the evaluation intervals to provide correct observation periods.
Some of the characteristics, like rapid voltage changes or mains signaling
voltage, may require daily assessments. If you intend to use daily-evaluated
voltage characteristics, select the daily evaluation period via the EN50160
Advanced setup.
Series PM175 Powermeters
87
Chapter 4 PAS Application Software
EN50160 Evaluation and Recording
EN50160 Compliance Statistics Log
Data log file #9 is automatically configured in the PM175 for recording
EN50160 compliance statistics. Appendix E lists parameters recorded to the
file. The file is arranged as a multi-section data log file where each voltage
characteristic statistics is stored in a separate section. Along with EN50160
compliance statistics recorded at the end of each evaluation period, file also
contains data that may be useful for trouble-shooting power quality problems
for non-compliant voltage characteristics.
You can upload and view the EN50160 compliance statistics data via PAS
reports or via common PAS data logs views.
EN50160 Harmonics Survey Log
Data log file #10 is automatically configured in the PM175 for recording
harmonics survey statistics on a weekly or daily basis. You can see
parameters recorded to the file in Appendix E. The file stores maximum THD
(total, odd and even harmonics) and maximum harmonic voltages up to
order 50 collected within each evaluation period.
Harmonics survey is normally intended for trouble-shooting harmonic
problems throughout electrical networks. It can be separately disabled or
enabled in your meter via the EN50160 Advanced Setup. The evaluation
period for harmonics survey can be selected independently from the
EN50160 compliance evaluation.
You can upload and view the harmonics survey data collected by your
device via PAS reports or via common PAS data logs views.
EN50160 Power Quality Event Log
The PM175 provides the EN50160 Power Quality (PQ) recorder that can
detect EN50160 incidents and record each individual power quality event to
the log file with the start and end timestamps and a fault magnitude. It may
be useful for trouble-shooting problems throughout the electrical network, for
example, to identify and locate the source of a power quality event and to
select an appropriate solution.
The EN50160 power quality report can be uploaded and viewed via PAS
(see Viewing EN50160 Power Quality Event Log). Transient overvoltages
and short-duration voltage dips and temporary overvoltages recorded to the
file can also be viewed in PAS as magnitude/duration pairs on the wellknown ITIC curve chart for assessing the minimum equipment immunity.
The PQ recorder is programmable to trigger the waveform recorder to record
the fault waveforms before, during and after the PQ event for detailed event
analysis.
Methods of Evaluation
This section describes methods used by the PM175 for evaluating supply
voltage characteristics to ensure compliance with the standard.
Frequency Variations
Method of Evaluation
The basic frequency measurement is the mean value of the frequency over
fixed time intervals of 10 seconds under normal operating conditions.
A frequency variation is not evaluated if the supply voltage crosses a voltage
tolerance limit (±15% Un).
Target Values
The ranges of frequency variations given in the EN50160 are:
50Hz±1% for 95% of a week
50Hz±1% for 99.5% of a year
88
Series PM175 Powermeters
Chapter 4 PAS Application Software
EN50160 Evaluation and Recording
50Hz+4/-6% for 100% of the time
The same limits are used for 60Hz systems. The frequency compliance limit
can be programmed in the meter in percent of the nominal power frequency
via the EN50160 PQ Recorder setup.
Supply Voltage Variations
This characteristic defines slow variations of steady state supply voltage
magnitude.
Method of Evaluation
The basic supply voltage magnitude measurement is the RMS value of the
steady state voltage over a period of 10 minutes under normal operating
conditions.
A voltage variation is not evaluated if the supply voltage crosses a voltage
tolerance limit (±15% Un).
Target Values
The range of voltage variations given in the EN50160 is:
±10% Un for 95% of a week
The supply voltage compliance limit can be changed in the meter via the
EN50160 PQ Recorder setup.
Rapid Voltage Changes
Rapid voltage changes are sudden but relatively weak voltage variations
between two steady state voltage levels.
Method of Evaluation
Evaluation of rapid voltage changes is made on an hourly basis. The RMS
voltage is evaluated over 3-second time integration intervals. The meter
establishes the maximum difference of the RMS voltage between two
intervals selected from three 3-second consecutive intervals and compares it
with the target compliance limit.
A rapid voltage change is not classified if it crosses a voltage tolerance limit
(±10% Un), as it would be considered a voltage dip or a temporary
overvoltage.
Target Values
The maximum rate of rapid voltage changes in normally once per hour or
less. For voltage variations repeating more than once an hour, amplitude is
limited by the flicker index. The maximum rate of rapid voltage changes in
variations per hour can be changed in the meter via the EN50160 Advanced
Setup. The target magnitude limit of rapid voltage changes can be
programmed in the meter via the EN50160 PQ Recorder setup.
Under usual operating conditions the magnitude of rapid voltage changes
(once per hour or less) should generally not exceed 5% of nominal voltage in
LV networks, and 4% in MV networks. In some circumstances, like in
systems where equipment switching must be carried out to meet supply
system or load requirements, it can reach 10%Un in LV networks, and 6%Un
in MV networks.
Flicker
Flicker expresses the visual discomfort caused by repetitive changes of
brightness in lightning subjected to fluctuations of the supply voltage. Flicker
is indicated by the long-term flicker severity parameter Plt, which is
evaluated every 2 hours.
Series PM175 Powermeters
89
Chapter 4 PAS Application Software
EN50160 Evaluation and Recording
Method of Evaluation
The basic measurement is the short-term flicker severity indicator Pst,
evaluated each 10 minutes by instrumentation complying with IEC 61000-415. The indicative long-term flicker severity Plt is evaluated from 12
consecutive Pst values. For testing purposes, the Pst period can be
temporarily changed in the meter in the range of 1 to 10 minutes via the
EN50160 Advanced Setup.
Pst values are not classified during intervals when the supply voltage
magnitude exceeds a voltage tolerance limit (±15% Un) or is affected by
voltage dips with depth more than 15% Un.
Target Values
The flicker compliance limit given in the EN50160 is:
Plt ≤ 1 for 95% of a week
The Plt compliance limit can be changed in the meter via the EN50160 PQ
Recorder setup.
Voltage Dips
A voltage dip is a sudden reduction of the RMS voltage below 90% of the
nominal value, followed by a return to a value higher than 90% of the
nominal in a time varying from 10 ms to 60 s.
Method of Evaluation
A voltage dip is classified as one polyphase event regardless of the shape
and of the number of phases affected (as per Eurelectric’s Application guide
to the European Standard EN 50160, and IEC 61000-4-30). An event can
begin on one phase and end on another phase. The fault magnitude is
recorded separately for each phase involved. The event duration is
measured from the instant at which the voltage falls below the start threshold
on one of the phases to that at which it becomes greater than the end
threshold on all affected phases including a threshold hysteresis.
The basic voltage dip measurement is one-cycle RMS voltage updated each
half-cycle.
The voltage dip threshold can be changed in the meter via the EN50160 PQ
Recorder setup.
Statistical Results
The PM175 provides the statistical evaluation of voltage dips using the
classification established by UNIPEDE. Dips are classified by residual
voltage magnitude and duration as shown in Appendix E.
Indicative Values
Under normal operating conditions the expected number of voltage dips in a
year may be from up to a few tens to up to one thousand. The majority of
voltage dips have a duration less than 1 s and a depth less than 60%.
Voltage Interruptions
Voltage interruptions correspond to temporary loss of supply voltage on all
phases lasting less than or equal to 3 minutes in the event of short
interruptions, and more than 3 minutes for long interruptions.
Method of Evaluation
The voltage interruption is detected when the voltages on all phases fall
below the interruption threshold (as per IEC 61000-4-30) specified by the
EN50160 at a level of 1%Un. The interruption threshold can be changed in
the meter via the EN50160 PQ Recorder setup.
The basic voltage measurement is one-cycle RMS voltage updated each
half-cycle.
90
Series PM175 Powermeters
Chapter 4 PAS Application Software
EN50160 Evaluation and Recording
Statistical Survey
The PM175 provides the statistical evaluation of voltage interruptions using
the classification recommended by Eurelectric’s Measurement guide for
voltage characteristics.
Interruptions are classified by duration as shown in Appendix E.
Indicative Values
Under normal operating conditions the expected number of short voltage
interruptions in a year may be from up to a few tens to up to several
hundreds. Short interruptions generally last less than a few seconds.
The annual frequency of long interruptions may be less than 10 or up to 50
depending on the area.
Temporary Overvoltages
Temporary overvoltages are sudden rises of the voltage RMS value of more
than 110% of nominal voltage. Temporary overvoltages may last between 10
milliseconds and one minute.
Method of Evaluation
A temporary overvoltage is classified as one polyphase event regardless of
the shape and of the number of phases affected (as per IEC 61000-4-30). An
event can begin on one phase and end on another phase. The fault
magnitude is recorded separately for each phase involved. The event
duration is measured from the instant at which the voltage rises above the
start threshold on one of the phases to that at which it becomes lower than
the end threshold on all affected phases including a threshold hysteresis.
The overvoltage threshold can be changed in the meter via the EN50160 PQ
Recorder setup.
The basic voltage measurement is one-cycle RMS voltage updated each
half-cycle.
Statistical Survey
The PM175 provides the statistical evaluation of temporary overvoltages
using the classification recommended by Eurelectric’s Measurement guide
for voltage characteristics. Temporary overvoltages are classified by voltage
magnitude and duration as shown in Appendix E.
Indicative Values
Temporary overvoltages on the low voltage side will generally not exceed
1.5 kV RMS.
Transient Overvoltages
Transient overvoltages correspond to disturbances of very short duration,
lasting typically less than one half-cycle, i.e. a few microseconds to several
milliseconds.
Method of Evaluation
Transient overvoltages are detected as impulsive transients with a rise time
less than 0.5 ms and duration from 150 us to ½ cycle. The impulse
magnitude is evaluated by the peak voltage value and is referenced to the
nominal peak voltage (1.414 Un). The meter can detect transient
overvoltages with a magnitude of up to 700V.
Statistical Survey
The PM175 provides the statistical evaluation of transient overvoltages using
the classification recommended by Eurelectric’s Measurement guide for
voltage characteristics. Transient overvoltages are classified by voltage
magnitude as shown in Appendix E.
Series PM175 Powermeters
91
Chapter 4 PAS Application Software
EN50160 Evaluation and Recording
Indicative Values
Temporary overvoltages in LV systems will generally not exceed 6 kV peak,
but higher values occur occasionally.
Voltage Unbalance
This characteristic defines the magnitude and/or phase asymmetries of
three-phase steady state supply voltage.
Method of Evaluation
The basic measurement is the RMS value of the steady state voltage
unbalance over a period of 10 minutes under normal operating conditions. It
is defined using the theory of symmetrical components by the negative
sequence component expressed in percent of the positive sequence
component.
Voltage unbalance is not evaluated if the supply voltage crosses a voltage
tolerance limit (±15% Un).
Target Values
The range of voltage unbalance given in the EN50160 is:
≤ 2% (≤ 3% in some areas) for 95% of a week
The voltage unbalance compliance limit can be changed in the meter via the
EN50160 PQ Recorder setup.
Harmonic Voltage
Method of Evaluation
The basic measurements are the individual harmonic voltage distortion
factors (HD) and the total harmonic distortion factor (THD) over a period of
10 minutes under normal operating conditions.
Harmonic voltages are evaluated by instrumentation complying with IEC
61000-4-7. All calculations are made relative to the nominal voltage.
The THD is evaluated including all harmonics up to the order 40. Harmonic
voltages are evaluated up the order 25 since the EN50160 provides target
values for individual harmonic voltages only for orders up to 25. The highest
harmonic order for evaluating individual harmonic voltages and THD can be
changed in the meter in the range of 25 to 50 via the EN50160 Advanced
Setup.
Harmonic voltages are not evaluated if the supply voltage crosses a voltage
tolerance limit (±15% Un).
Target Values
The ranges of harmonic voltages given in the EN50160 are:
THD ≤ 8% for 95% of a week
Individual harmonic voltages shall be less than or equal to the values
given in Table 1 in Clause 2.11 of the EN50160 for 95% of a week.
The THD compliance limit can be changed in the meter via the EN50160 PQ
Recorder setup. The individual harmonic voltage limits can be adjusted via
the EN50160 Harmonics setup.
Interharmonic Voltage
Method of Evaluation
Since the EN50160 does not specify target limits for interharmonic voltages,
this feature is normally disabled in your meter. You can enable evaluation of
interharmonic voltages via the EN50160 Advanced Setup.
The basic measurements are the individual interharmonic voltage distortion
factors (HD) and the total interharmonic distortion factor (THD) over a period
of 10 minutes under normal operating conditions.
92
Series PM175 Powermeters
Chapter 4 PAS Application Software
EN50160 Evaluation and Recording
Interharmonic voltages are evaluated by instrumentation complying with IEC
61000-4-7. All calculations are made relative to the nominal voltage.
The highest harmonic order for evaluating individual interharmonic voltages
and interharmonic THD can be selected in the meter in the range of 25 to 50
via the EN50160 Advanced setup.
Interharmonic voltages are not evaluated if the supply voltage crosses a
voltage tolerance limit (±15% Un).
Target Values
The EN50160 does not provide target limits for interharmonic voltages. The
ranges of interharmonic voltages selected in the PM175 are:
Interharmonic THD ≤ 2% for 95% of a week
Individual interharmonic voltages shall be less than or equal to the values
given in the following table for 95% of a week.
Interharmonic order
2
3-15
16-25
Relative Voltage
0.2
1.0
0.5
You can change the compliance limit for the interharmonic THD via the
EN50160 PQ Recorder setup. The individual interharmonic voltage limits can
be changed via the EN50160 Harmonics setup.
Mains Signaling Voltage
This characteristic defines the magnitude of the signal voltages used in some
countries for signal transmission over public supply networks. These may
include ripple control signals in a frequency range from 100 HZ to 3 kHz, and
carrier wave communications signals in a frequency range from 3 kHz to
148.5 kHz.
The PM175 can evaluate ripple control signaling voltages in a frequency
range from 100 Hz to 3 kHz.
Method of Evaluation
Since evaluating signal voltages is not commonly used, this feature is
normally disabled in your meter. You can enable evaluation of signaling
voltages via the EN50160 Advanced Setup.
The PM175 evaluates up to four ripple control frequencies. You can select
the required signaling frequencies via the EN50160 Advanced Setup.
The basic measurement is the magnitude of the signaling voltage over a
period of 3 seconds under normal operating conditions.
Signaling voltages are not evaluated if the supply voltage crosses a voltage
tolerance limit (±15% Un).
Target Values
The voltage levels given by the EN50160 in Figure 1 of Clause 2.13 are
taken from the so-called “Meister-curve” which defines the maximum
permissible ripple control voltages in LV networks.
Compliance with the EN50160 requires that the 3-second mean of signal
voltages shall be less or equal to the specified limits for 99% of a day.
Configuring the EN50160 Recorders
Basic Device Settings
The following device settings affect the EN50160 evaluation and should be
checked prior to running the EN50160 recorders.
Series PM175 Powermeters
93
Chapter 4 PAS Application Software
EN50160 Evaluation and Recording
Reference Voltage
As the general approach of the EN50160, all voltage characteristics are
referenced to the nominal voltage that shall be specified in your meter before
running the EN50160 recorders (see Basic Meter Setup). The nominal
voltage refers to the line-to-neutral supply voltage in LV networks (4LN3,
3LN3 or 3BLN3 wiring modes), and to line-to-line voltage in MV networks
(4LL3, 3LL3, 3BLN3, 3OP2, 3OP3 and 3DIR2 wiring modes).
Reference Frequency
The nominal line frequency is used as a reference for the evaluation of
power frequency variations. It should be specified in your meter before
running the EN50160 recorders (see Basic Meter Setup).
EN50160 Evaluation Limits and Options
Limits for evaluation of the EN50160 voltage characteristics can be set via
the EN50160 PQ Recorder Setup and, for harmonic and interharmonic
voltages, via the EN50160 Harmonics Setup (see EN50160 Harmonics
Limits Setup).
The EN50160 evaluation options can be changed via the EN50160
Advanced Setup.
EN50160 Logging Options
The memory allocated in your meter for the EN50160 compliance statistics
and harmonics survey data is sufficient for 3-month data recording on a
weekly basis. The Power Quality event log file is configured for 1000 event
records. You can increase or change the size of the EN50160 data log files
in your meter via the Log Memory Setup (see Configuring Device Memory).
EN50160 PQ Recorder Setup
The PQ recorder setup allows you to adjust the EN50160 evaluation limits
(thresholds) for the specific voltage characteristics in the case the customer
requirements differ from the values provided by the EN50160, and to select
the event and waveform log options for the PQ event log.
94
Series PM175 Powermeters
Chapter 4 PAS Application Software
EN50160 Evaluation and Recording
To configure the PQ recorder:
1.
Select Memory/Log from the Meter Setup menu, and then
click on the EN50160 PQ Recorder tab.
2.
Adjust thresholds and hysteresis for PQ triggers if
required. The harmonic and interharmonic voltage limits
can be individually set for each harmonic order via the
EN50160 Harmonics Setup. Limits for the signaling
voltage frequencies are automatically taken from the
“Meister-curve”.
Check the Enabled box for the voltage characteristics you
want to be recorded to the PQ event log. You can
individually enable or disable recording PQ events related
to specific characteristics. Notice that the interharmonic
voltage and mains signaling voltage evaluation should be
also enabled in the meter via the EN50160 Advanced
Setup.
Disabling recording events to the PQ log does not prevent the
evaluation of the voltage characteristics and collecting the EN50160
statistics for these events.
Select the waveform logging options for PQ events.
Download your setup to the device.
3.
4.
5.
The picture above shows the default PQ recorder settings. The available
options are listed in the following table.
Option
Range
Default
Description
PQ Log
Threshold, %
0-200.0%
Hysteresis, %
0-50.0%
Enabled
Checked
Unchecked
On Start
Checked
Unchecked
Checked
Unchecked
1-2
Defines the operating threshold for the PQ trigger
in percent of the nominal (reference) value
5.0
Defines the hysteresis for the PQ trigger in
percent of the threshold
Enables recording PQ events for specific voltage
characteristics
Waveform Log
On End
Log No.
Checked
Enables waveform log when the PQ event starts
Unchecked
Enables waveform log when the PQ event ends
Specifies the waveform log file used for waveform
recording on the PQ event
The waveform log options allow recording waveforms both at the start and
the end of a PQ event. Since the voltage variations can last from some
seconds to minutes, this allows capturing and analyzing the voltage
transitions using short time waveform recording at the start and at the end of
the voltage sag or swell.
You can temporary disable the PQ recorder in your device. To enable or
disable the PQ recorder:
1.
2.
Check or uncheck the Recorder Enabled checkbox.
Send your setting to the device.
Note that disabling the PQ recorder in your meter does not affect the
evaluation and recording of the EN50160 statistics.
Indication of the Power Quality Events
When the PQ recorder detects a power quality fault, it generates the specific
internal event “PQ EVENT” that can be monitored through a control setpoint.
The event is asserted all the time while the fault condition exists. The “PQ
EVENT” trigger is used to give a power quality fault indication via relay
contacts, or can be combined using the AND operator with timer ticks for
periodic data recording at the time of the fault to produce voltage trending
charts.
Series PM175 Powermeters
95
Chapter 4 PAS Application Software
EN50160 Evaluation and Recording
EN50160 Harmonics Limits Setup
This setup allows you to adjust compliance limits for harmonic and
interharmonic voltages.
To change the default limits in your device:
1.
Select Memory/Log from the Meter Setup menu, and then
click on the EN50160 Harmonics Setup tab.
2.
3.
Adjust limits you want to change.
Download your setup to the device.
The default EM50160 compliance limits are shown in the picture above. You
can change the number of the evaluated harmonics and interharmonics via
the EN50160 Advanced Setup.
EN50160 Advanced Setup
The EN50160 Advanced Setup allows you to configure the EN50160
evaluation options in your meter.
To configure the EN50160 evaluation options:
1.
2.
3.
Select Memory/Log from the Meter Setup menu, and then
click on the EN50160 Advanced Setup tab.
Change the EN50160 evaluation options if required.
Download your setup to the device.
The default EN50160 evaluation options set in your device are shown in the
picture below.
96
Series PM175 Powermeters
Chapter 4 PAS Application Software
EN50160 Evaluation and Recording
The available options are listed in the following table.
Option
Range
Default
Description
EN50160 Compliance Statistics
Enabled
Enables the EN50160 evaluation
Evaluation
Period
Disabled,
Enabled
Daily,
Weekly
Weekly
Defines the EN50160 statistics evaluation period
First Day of the
Week
SundaySaturday
Sunday
Defines the first day of the week for statistics
evaluated on a weekly basis
Evaluation
Enabled
Enables the harmonics survey log
Evaluation
Period
Disabled,
Enabled
Daily,
Weekly
Weekly
Defines the harmonics survey evaluation period
Repetition Rate
1-10
1
Pst Period
1-10 min
10 min
THD, up to
order
25-50
40
Defines the highest harmonic order included in
the THD evaluation.
Harmonics, up
to order
25-50
25
Defines the highest harmonic order for evaluation
of the harmonic voltages.
Evaluation
Disabled,
Enabled
Disabled
Enables the evaluation of the interharmonic
voltages
THD, up to
order
25-50
40
Defines the highest interharmonic order included
in the THD evaluation.
Interharmonics,
up to order
25-50
25
Defines the highest harmonic order for evaluation
of the interharmonic voltages.
Evaluation
EN50160 Harmonics Survey
Rapid Voltage Changes
Defines the maximum repetition rate in variations
per hour (equal or less than) for rapid voltage
changes. Voltage changes at higher rates are not
classified since they will be subject for flicker.
Flicker
Defines the period of time for the short-term
flicker evaluation. The standard setting of 10
minutes can be temporarily changed in the device
for testing purposes.
Harmonic Voltage
Interharmonic Voltage
Series PM175 Powermeters
97
Chapter 4 PAS Application Software
Option
Range
Remote Device Control
Default
Description
Mains Signaling Voltage
Evaluation
Disabled,
Enabled
Disabled
Enables the evaluation of the mains signaling
voltages
1st Signaling
Frequency
110-3000
Hz
183.0 Hz
Specifies the mains signaling frequency for the
compliance evaluation
2nd Signaling
Frequency
110-3000
Hz
191.0 Hz
Specifies the mains signaling frequency for the
compliance evaluation
3rd Signaling
Frequency
110-3000
Hz
217.0 Hz
Specifies the mains signaling frequency for the
compliance evaluation
4th Signaling
Frequency
110-3000
Hz
317.0 Hz
Specifies the mains signaling frequency for the
compliance evaluation
Clearing EN50160 Evaluation Counters
To clear the present contents of the EN50160 evaluation counters before
starting your EN50160 evaluation, check the On-line button, select Reset
from the Monitor menu, and then Click on the “Clear EN50160 Counters”
button (for more information, see Resetting Accumulators and Clearing Log
Files).
Remote Device Control
This section describes online operations on the meter you can perform
through PAS. To access device control options you should have your device
online.
Remote Relay Control
PAS allows you to send a command to any relay in your device or release a
latched relay, except of the relays that are linked to an internal pulse source.
These relays cannot be operated outside of the device.
To enter the Remote Relay Control dialog, check the On-line button on the
PAS toolbar, select Device Control from the Monitor menu, and then click on
the Remote Relay Control tab.
To send a remote command to the relay:
1.
2.
98
From the “Relay Command” box for the relay, select the
desired command:
OPERATE – to operate a relay
RELEASE - to remove your remote command, or to
release a latched relay
Click on Send.
Series PM175 Powermeters
Chapter 4 PAS Application Software
Remote Device Control
Event Flags
The PM175 provides 8 common event flags that are intended for use as
temporary event storage and can be tested and operated from the control
setpoints. You can transfer an event to the setpoint and trigger its operation
remotely by changing the event status through PAS.
To enter the Event Flags dialog, check the On-line button on the PAS
toolbar, select Device Control from the Monitor menu, and then click on the
Event Flags tab.
To change the status of an event flag:
1.
2.
Series PM175 Powermeters
From the “Status” box, select the desired flag status.
Click on Send.
99
Chapter 4 PAS Application Software
Remote Device Control
Device Diagnostics
PAS allows you to examine and clear the present device diagnostics status.
To enter the Device Diagnostics dialog, check the On-line button on the PAS
toolbar, select Device Control from the Monitor menu, and then click on the
Device Diagnostics tab.
To clear the device diagnostics events, click on Clear.
Updating the Clock
To update the Real-Time Clock (RTC) in your device, check the On-line
button on the PAS toolbar, and then select RTC from the Monitor menu or
click on the Real-Time Clock button on the PAS toolbar.
The RTC dialog box displays the current PC time and the time in your
device. To synchronize the device clock with the PC clock, click Set.
Resetting Accumulators and Clearing Log Files
PAS allows you to remotely clear energy accumulators, maximum demands,
Min/Max log registers, counters and log files in your device. To open the
dialog, check the On-line button, and then select Reset from the Monitor
menu.
100
Series PM175 Powermeters
Chapter 4 PAS Application Software
Administration
To reset the desired accumulation registers or to clear a file:
1.
2.
3.
Click on the corresponding button, and then confirm your
command.
If a target has more than one component, you are allowed
to select components to reset.
Check the corresponding boxes, and then click OK.
Administration
Changing a Password
PAS allows you to remotely change the password, and enable or disable the
password security check in your meter. To change the password, check the
On-line button, select Administration from the Monitor menu, and then select
Change Password.
Series PM175 Powermeters
101
Chapter 4 PAS Application Software
Upgrading Device Firmware
To change the password:
1. Type in a new 4-digit password.
2. Repeat the password in the Confirm box.
3. Check the “Enable network protection” to enable
password checking.
4. Click Send.
Upgrading Device Firmware
Your meter has upgradeable firmware. If you need to upgrade your device,
download a new firmware file to the meter through PAS.
Firmware is downloaded through any communication port. The meter may be
connected to your PC through a serial interface, a dial-up modem or the
Internet.
Upgrading firmware is only supported through the Modbus RTU and
Modbus/TCP protocols, so your serial port or modem port should be put into
Modbus RTU mode.
To download a new firmware file to your device:
1.
2.
3.
102
Ensure that the communication port you are connected
through to the meter operates in Modbus RTU mode.
If the port is configured for a different protocol, put it into
Modbus RTU mode either from the front display, or
remotely through PAS. If you are connected to the meter
through a serial interface, it is recommended to set the
port baud rate to 115,200 bps. See Configuring
Communications in your Meter on how to remotely
change the protocol and baud rate in your meter.
Check the On-line button on the PAS toolbar, select Flash
Downloader from the Monitor menu, and then confirm
changes.
Series PM175 Powermeters
Chapter 4 PAS Application Software
Upgrading Device Firmware
4.
Point to the firmware upgrade file for your meter, click
Open, and then confirm upgrading the meter. You are
asked for the password regardless of the password
protection setting in your meter.
5.
Type the meter password, and click OK. If you did not
change the password in the meter, enter the default
password 0.
6.
Wait until PAS completes upgrading your device. It takes
about 3-4 minutes at 115,200 bps to download the file to
the meter.
7.
After upgrading firmware is completed, the meter restarts,
so if it is connected through the modem to your PC,
communications can be temporarily lost. You may need to
wait a short duration until PAS restores a connection with
your device.
You possibly need to restore the previous port settings in
your meter if you changed them.
8.
Series PM175 Powermeters
103
Chapter 4 PAS Application Software
Monitoring Devices
Monitoring Devices
Viewing Real-time Data
Real-time data is continuously retrieved from your devices, updated on the
screen at the rate you defined in the Instrument Setup, and can be recorded
to a file. You can view acquired data in a tabular or in a graphical form as a
data trend.
For information on the real-time data monitoring and recording options, see
the “PAS Getting Started Guide”.
Any data, energy and maximum demand registers in your meters can be
read and recorded to files through the PAS Data Monitor. See Appendix D
for a list of data available in your meter.
Viewing Min/Max Log
To retrieve the real-time Min/Max log data from your device, select the
device site from the list box on the toolbar, select RT Min/Max Log from the
Monitor menu, and then select a data set you want to view.
For more information on the Min/Max data monitoring options, see the “PAS
Getting Started Guide”.
Viewing Real-time Waveforms
The PM175 allows you to retrieve and view the real-time waveforms from
your meter.
104
Series PM175 Powermeters
Chapter 4 PAS Application Software
Retrieving Log Files
The waveforms can be displayed in different views as overlapped or nonoverlapped waveforms, as RMS cycle-by-cycle plot, or as a harmonic
spectrum chart or table. For information on using different waveform views,
see the “PAS Getting Started Guide”.
Retrieving Log Files
Retrieving Recorded Data
Using PAS, you can retrieve recorded events, data and waveforms from your
meters and save them to files on your PC in the MS Access database format.
Historical data can be uploaded on demand any time you need it, or
periodically through the Upload Scheduler that can retrieve data
automatically on a predefined schedule, for example, daily, weekly or
monthly. If you do not change the destination database location, new data
will be added to the same database so you can have long-term data profiles
in one database regardless of the upload schedule you selected.
For information on uploading files and configuring the Upload Scheduler for
your meters, see the “PAS Getting Started Guide”.
Retrieving EN50160 Statistics Files
The EN50160 statistics files and present contents of the EN50160 evaluation
counters can be retrieved by PAS and stored to a database for later analysis.
Using the Upload Scheduler
The PAS Upload Scheduler can automatically retrieve the EN50160 statistics
files on a daily or weekly basis depending on the EN50160 evaluation period
selected in your device.
Select the Daily or Weekly schedule for the EN50160 statistics files when
configuring the upload schedule (see “Using the Upload Scheduler” in the
“PAS Getting Started Guide”).
Check the Data log #9 and #10 boxes in the Select Logs dialog box for
uploading the EN50160 Compliance Statistics and EN50160 Harmonics
Survey files respectively, as shown in the following picture.
Series PM175 Powermeters
105
Chapter 4 PAS Application Software
Viewing Recorded Files
Retrieving EN50160 Statistics Files on Demand
To manually retrieve the EN50160 statistics files on demand, select “Upload
EN50160 Compliance Stats” from the Logs menu and specify the database
to which you want the data to be stored.
Retrieving the EN50160 Online Statistics
To retrieve the present contents of the EN50160 statistics counters
accumulated since the beginning of the current evaluation period, select
“Upload EN50160 Online Stats” from the Logs menu and specify the
database to which you want the data to be stored. The statistics records will
be marked as online events.
See Viewing the EN50160 Online Statistics Report for information on how to
get the EN50160 compliance report for the latest online statistics stored in
the database.
Viewing Recorded Files
Viewing Options
Uploaded data can be viewed on the screen, printed, and exported to other
applications.
PAS offers you different options for easy analysis of retrieved trend and fault
data. Data can be displayed in primary or secondary units. You can use
filtering to find out and work with a subset of events that meet the criteria you
specify, or use sorting to rearrange records in the desired order. PAS can
link events and the corresponding data records and waveforms together to
allow you more effective analysis of recorded events.
For data log files, PAS allows you to view data trends in a graphical form,
measure the delta time and magnitude between two trend points, calculate
average and peak values within time intervals.
For waveform files, PAS provides phasor diagrams, symmetrical
components and delta measurements, and can show you a waveform as an
RMS plot or as a spectrum chart.
For more information on viewing log files and available options, see the “PAS
Getting Started Guide”.
106
Series PM175 Powermeters
Chapter 4 PAS Application Software
Viewing Recorded Files
Viewing the EN50160 Power Quality Event Log
PQ log files are displayed in a tabular view, one event per row. PAS loads
the entire database table to a window, so that you can scroll through the log
to view its contents.
Selecting Voltage Units
Voltages can be displayed in primary or secondary units. To change units for
your reports, click with the right mouse button on the report window, select
Options, select the desired voltage units, and then click OK.
Sorting Events
The event records are normally shown in the order based on the date and
time of the event appearance. To change the sorting order, click on the Sort
button
on the window toolbar or click with the right mouse button on the
report window and select “Sort...”, check the desired sort order, and then
click OK.
Filtering Events
You can use filtering to find and work with a subset of events that meet the
criteria you specify. PAS will temporary hide rows you do not want displayed.
You can use a filter along with sorting to rearrange filtered records in the
desired order.
To filter events, click on the Filter button
on the window toolbar, or click
with the right mouse button on the report window, and then select “Filter...”.
Check the categories of events you want to display, and then click OK.
Series PM175 Powermeters
107
Chapter 4 PAS Application Software
Viewing Recorded Files
Linking to Waveforms
When displaying the PQ report, PAS establishes links between the events
and waveform log records related to the events. PQ events, for which PAS
finds related links, are displayed in blue. To check a list of the event links,
click on the colored event ID with the left mouse button. To directly move to
the related waveform record, click on the corresponding list item.
Retrieving Waveforms Online
If you programmed the PQ recorder to record waveforms on power quality
events, you can upload the waveforms related to a specific event online if
they have not yet been retrieved and stored to the database on your PC.
Events for which PAS did not find a corresponding waveform in the database
are colored black. Click on the event ID, click on the “Retrieve Waveform”
prompt, and then point to a database to which you want the waveform to be
stored.
Viewing the ITI (CBEMA) Curve
Transient overvoltages (impulsive transients) and short-duration voltage
variations (dips and temporary overvoltages) can be viewed as
magnitude/duration pairs on the ITIC (the Information Technology Industry
Council, formerly CBEMA) curve chart. To view an ITI curve chart, click on
the “ITI” button on the window toolbar.
108
Series PM175 Powermeters
Chapter 4 PAS Application Software
Viewing Recorded Files
To view the event details, click on the event point with the left mouse button.
To directly move to the related power quality report entry or to a waveform
record, click on the corresponding list item with the left mouse button.
Viewing the EN50160 Compliance Report
To get the EN50160 Compliance report on the collected statistics data,
select “EN50160 Compliance Statistics” from the Reports menu, point to the
database where you stored the retrieved statistics, uncheck the voltage
characteristics’ tables which you do not want to be reported, and then click
Open.
The following picture shows an example of the EN50160 compliance report.
Series PM175 Powermeters
109
Chapter 4 PAS Application Software
Viewing Recorded Files
The standard compliance statistics is reported within the selected time range
on a daily, weekly or yearly basis depending on the observation periods
stated in the EN50160 for voltage characteristics. If the time range includes a
number of the observation intervals, each interval’s statistics is given in a
separate row. For power frequency, both weekly and yearly compliance
statistics are provided.
For characteristics provided with definite limits, the report shows a
percentage of the observation time within which the characteristic complied
with the standard, e.g. 98% of the observations in a period of one week, and
the total compliance indicator.
For voltage characteristics provided with indicative values, the report gives
the yearly statistical data classified by voltage magnitude and duration.
Selecting the Report Time Range
To change the time range or contents of the report, click on the report with
the right mouse button, select “Options…”, select the required time range,
check the voltage characteristics to be included in the report, and then click
OK.
110
Series PM175 Powermeters
Chapter 4 PAS Application Software
Viewing Recorded Files
Customizing Reports
If you wish to add a logo image, header and footer to your reports:
1.
Select “Report Setup…” from the Reports menu, or click on
the report window with the right mouse button, and then
select “Report Setup…”.
2.
Click on the Change button and select a logo image file.
Check the “Show” box to include your logo into a report.
Type the header text in the Page Header box. Check the
“Enabled” box to include the header into a report.
Click on the Footer tab and type the footer text. Check the
“Enabled” box to include the footer into a report.
Click OK.
3.
4.
5.
Both the header and the footer may contain more than one line of the text.
Use the Enter button to move to the next line as usually.
Series PM175 Powermeters
111
Chapter 4 PAS Application Software
Viewing Recorded Files
Printing Reports
To get a hardcopy of the report on the printer, select Print… from the File
menu. To check the report, as it will look when printed, select Print Preview
from the File menu.
Viewing the EN50160 Online Statistics Report
If you retrieved the EN50160 online statistics data, you can get the online
report on the last retrieved statistics in the same manner as the EN50160
Compliance statistics report. Select “EN50160 Online Statistics” from the
Reports menu, point to the database where you stored the retrieved online
statistics, uncheck the voltage characteristics’ tables that you do not want to
be reported, and then click Open.
Viewing the EN50160 Harmonics Survey Report
To get the EN50160 harmonics survey report on the collected statistics data,
select “EN50160 Harmonics Survey” from the Reports menu, point to the
database where you stored the retrieved statistics, uncheck the voltage
channels which you do not want to be reported, and then click Open.
112
Series PM175 Powermeters
Appendix A Technical Specifications
Appendix A
Technical Specifications
Environmental Conditions
Operating temperature: -20°C to 60°C (-4°F to 140°F)
Storage temperature: -25°C to 80°C (-13°F to 176°F)
Humidity: 0 to 95% non-condensing
Construction
Dimensions see Figure 2-1
Weight: 1.23kg (2.7 lb.)
Materials
Case enclosure: plastic PC/ABS blend
Display body: plastic PC/ABS blend
Front panel: plastic PC
PCB.: FR4 (UL94-V0)
Terminals: PBT (UL94-V0)
Connectors-Plug-in type: Polyamide PA6.6 (UL94-V0)
Packaging case: Carton and Stratocell® (Polyethylene Foam) brackets
Labels: Polyester film (UL94-V0)
Power Supply
120/230 VAC-110/220 VDC Option:
Rated input 85-264VAC 50/60 Hz, 88-290VDC, Burden 10W
Isolation:
Input to output: 3000 VAC
Input to ground: 2000 VAC
12 VDC Option: Rated input 9.6-19 VDC
24 VDC Option: Rated input 19-37 VDC
48 VDC Option: Rated input 37- 72 VDC
2
Wire size: up to 12 AWG (up to 3.5 mm )
Input Ratings
Voltage Inputs
Operating range: 690VAC line-to-line, 400VAC line-to-neutral
Direct input and input via PT (up to 828VAC line-to-line, up to 480VAC lineto-neutral)
Input impedance: 500 kOhm
Burden for 400V: < 0.4 VA
Burden for 120V: < 0.04 VA
Overvoltage withstand: 1000 VAC continuous, 2000 VAC for 1 second
Galvanic isolation: 3500 VAC
2
Wire size: up to 12 AWG (up to 3.5mm )
Current Inputs
Wire size: 12 AWG (up to 3.5 mm2)
Galvanic isolation: 3500 VAC
5A secondary
Operating range: continuous 10A RMS Burden: < 0.1 VA
Overload withstand: 15A RMS continuous, 300A RMS for 1 second
Series PM175 Powermeters
113
Appendix A Technical Specifications
1A secondary
Operating range: continuous 2A RMS Burden: < 0.02 VA
Overload withstand: 6A RMS continuous, 80A RMS for 1 second
Relay Outputs
2 relays rated at 3A/250 VAC; 3A/30 VDC, 2 contacts (SPST Form A)
Wire size: 14 AWG (up to 1.5 mm2)
Galvanic isolation:
Between contacts and coil: 2000 VAC 1 min
Between open contacts: 1000 VAC
Operate time: 10 ms max.
Release time: 5 ms max.
Update time: 1 cycle
Digital Inputs
2 Digital Inputs Dry Contacts
2
Wire size: 14 AWG (up to 1.5 mm )
Galvanic isolation: 2000V RMS
Internal power supply 15V
Scan time: 1 ms
Optional Analog Inputs
2 Analog Inputs (optically isolated)
Ranges (upon order):
±1 mA (100% overload)
0-20 mA
4-20 mA
0-1 mA (100% overload)
2
Wire size: 14 AWG (up to 1.5 mm )
Isolation: 2,000 V RMS
Accuracy: 0.5% FS
Scan time: 1 cycle
Optional Analog Outputs
2 Analog Outputs (optically isolated)
Ranges (upon order):
±1 mA, maximum load 5 kΩ (100% overload)
0-20 mA, maximum load 510 Ω
4-20 mA, maximum load 510 Ω
0-1 mA, maximum load 5 k Ω (100% overload)
Isolation: 2,000 V RMS
Power supply: internal
Accuracy: 0.5% FS
2
Wire size: 14 AWG (up to 1.5 mm )
Update time: 1 cycle
114
Series PM175 Powermeters
Appendix A Technical Specifications
Communication Ports
COM1 (Optional modules)
Serial EIA RS-232 optically isolated port
Isolation: 2,000 V RMS
Connector type: DB9 female.
Baud rate: up to 115.2 kbps.
Supported protocols: Modbus RTU and Modbus ASCII.
RS-422/RS-485 optically isolated port
Isolation: 2,000 V RMS
Connector type: DB9 female.
Baud rate: up to 115.2 kbps.
Supported protocols: Modbus RTU and Modbus ASCII.
Ethernet Port
Transformer-isolated 10/100BaseT Ethernet port.
Connector type: RJ45 modular.
Supported protocols: Modbus/TCP (Port 502).
Number of simultaneous connections: 2.
Dial-up Modem
Transformer-isolated internal 56K modem.
Connector type: RJ11.
Supported protocols: Modbus RTU and Modbus ASCII.
COM2
RS-422/RS-485 optically isolated port
Isolation: 2,000 V RMS
Connector type: removable, 5 pins.
2
Wire size: up to 14 AWG (up to 1.5 mm ).
Baud rate: up to 115.2 kbps.
Supported protocols: Modbus RTU and Modbus ASCII.
Real-time Clock
Accuracy: typical error 15 seconds per month @ 25°C
Log Memory
Onboard memory with battery backup: 1 Mbytes.
Display Module
Display: high-brightness seven-segment digital LEDs, two 4-digit + one
6-digit windows
Keypad: 6 push buttons
Communication: EIA RS-485 port with 12V supply voltage
Connector type: DB15, 15 pins
2
Wires size: up to 14 AWG (up to 1.5 mm )
Distance: up to 1000 m (3200 feet)
Standards Compliance
Accuracy per ANSI C12.20 –1998
UL File # E129258 (PENDING)
Series PM175 Powermeters
115
Appendix A Technical Specifications
Directive complied with:
EMC: 89/336/EEC as amended by 92/31/EEC and 93/68/EEC
LVD: 72/23/EEC as amended by 93/68/EEC and 93/465/EEC
Harmonized standards to which conformity is declared:
EN55011: 1991
EN50082-1: 1992
EN61010-1: 1993
A2/1995
EN50081-2 Generic Emission Standard - Industrial Environment
EN50082-2 Generic Immunity Standard - Industrial Environment
EN55022: 1994 Class A
EN61000-4-2
ENV50140: 1983
ENV50204: 1995 (900MHz)
ENV50141: 1993
EN61000-4-4:1995
EN61000-4-8: 1993
116
Series PM175 Powermeters
Appendix A Technical Specifications
Measurement Specifications
Parameter
Voltage
Full Scale @ Input
Range
120VxPT @ 120V
%
Reading
0.2
Range
Accuracy
% FS
Conditions
0.01
10% to 120% FS
400VxPT @ 690V
0 to 1,150,000 V
Starting voltage
1.5% FS @ 120V
1.5% FS @ 690V
Line current
CT
0.2
0.02
1% - 200% FS
0 to 10,000 A
Active power
0.36×PT×CT @ 120V
0.2
0.02
|PF| ≥ 0.5 1
-10,000,000 kW to
0.3
0.04
|PF| ≤ 0.9 1
Starting current 0.1% FS
+10,000,000 kW
1.2×PT×CT @ 690V
Reactive power
0.36×PT×CT @ 120V
Apparent power
0.36×PT×CT @ 120V
-10,000,000 kvar to
+10,000,000 kvar
1.2×PT×CT @ 690V
0.2
0.02
|PF| ≥ 0.5 1
0 to 10,000,000 kVA
0.2
|PF| ≥ 0.5,
-0.999 to +1.000
1.2×PT×CT @ 690V
Power factor
1.000
I ≥ 2% FSI
Frequency
0.02
Total Harmonic
Distortion, THD
V (I), %Vf (%If)
999.9
Total Demand
Distortion, TDD,
%
100
1.5
15 Hz to 480 Hz
0.1
THD ≥ 1%,
0 to 999.9
V (I) ≥ 10% FSV
(FSI)
1.5
TDD ≥ 1%,
0 to 100
I ≥ 10% FSI
Active energy
Import & Export
Class 0.2S under conditions as per IEC
62053-22:2003
0 to 999,999.999 MWh
Reactive energy
Import & Export
Class 0.2S under conditions as per IEC
62053-22:2003, |PF| ≤ 0.9
0 to 999,999.999 Mvarh
Apparent energy
Class 0.2S under conditions as per IEC
62053-22:2003
0 to 999,999.999 MVAh
1 @ 80% to 120% of voltage FS, 1% to 200% of current FS, and frequency 50/60 Hz
PT - external potential transformer ratio
CT - primary current rating of external current transformer
FSV - voltage full scale
FSI - current full scale
Vf - fundamental voltage
If - fundamental current
NOTES
1. Accuracy is expressed as ± (percentage of reading + percentage of full scale) ± 1 digit. This
does not include inaccuracies introduced by the user's potential and current transformers.
Accuracy calculated at 1second average.
2. Specifications assume: voltage and current waveforms with THD ≤ 5% for kvar, kVA and PF,
and reference operating temperature 20°C - 26°C.
3. Measurement error is typically less than the maximum error indicated.
Series PM175 Powermeters
117
Appendix B Parameters for Analog Output
Appendix B
Parameters for Analog Output
The following table lists parameters that can be provided on the meter’s
analog outputs.
Display Code
nonE
Designation
NONE
rt.U1
rt.U2
rt.U3
rt.U12
rt.U23
rt.U31
rt.C1
rt.C2
rt.C3
V1/12 RT 1
V2/23 RT 1
V3/31 RT 1
V12 RT
V23 RT
V31 RT
I1 RT
I2 RT
I3 RT
rt.Ac.P
rt.rE.P
rt.AP.P
rt.PF
rt.PF.LG
rt.PF.Ld
rt.U.AG
rt.UL.AG
rt.C.AG
kW RT
kvar RT
kVA RT
PF RT
PF LAG RT
PF LEAD RT
VOLT AVG RT 1
VOLT AVG LL RT
AMPS AVG RT
rt.nEU.C
rt.FrEq
In RT
FREQ RT
Ar.U1
Ar.U2
Ar.U3
Ar.U12
Ar.U23
Ar.U31
Ar.C1
Ar.C2
Ar.C3
V1/12 AVR 1
V2/23 AVR 1
V3/31 AVR 1
V12 AVR
V23 AVR
V31 AVR
I1 AVR
I2 AVR
I3 AVR
Ar.Ac.P
Ar.rE.P
Ar.AP.P
Ar.PF
Ar.PF.LG
Ar.PF.Ld
Ar.U.AG
Ar.UL.AG
Ar.C.AG
kW AVR
kvar AVR
kVA AVR
PF AVR
PF LAG AVR
PF LEAD AVR
VOLT AVG AVR 1
VOLT AVG LL AVR
AMPS AVG AVR
rt.nEU.C
rt.FrEq
In AVR
FREQ AVR
d.P.i
d.P.E
d.q.i
d.q.E
d.S
kW IMP ACC DMD
kW EXP ACC DMD
kvar IMP ACC DMD
kvar EXP ACC DMD
kVA ACC DMD
Description
None (output disabled)
1-Cycle Phase Values
V1/V12 Voltage
V2/V23 Voltage
V3/V31 Voltage
V12 Voltage
V23 Voltage
V31 Voltage
I1 Current
I2 Current
I3 Current
1-Cycle Total Values
Total kW
Total kvar
Total kVA
Total PF
Total PF Lag
Total PF Lead
3-phase average L-N/L-L voltage
3-phase average L-L voltage
3-phase average current
1-Cycle Auxiliary Values
In Current
Frequency
1-Sec Phase Values
V1/V12 Voltage
V2/V23 Voltage
V3/V31 Voltage
V12 Voltage
V23 Voltage
V31 Voltage
I1 Current
I2 Current
I3 Current
1-Sec Total Values
Total kW
Total kvar
Total kVA
Total PF
Total PF Lag
Total PF Lead
3-phase average L-N/L-L voltage
3-phase average L-L voltage
3-phase average current
1-Sec Auxiliary Values
In Current
Frequency
Present Demands
Accumulated kW import demand
Accumulated kW export demand
Accumulated kvar import demand
Accumulated kvar export demand
Accumulated kVA demand
5. 1 In 4LN3, 4LL3, 3LN3, 3LL3, 3BLN3 and 3BLL3 wiring
modes, the voltages will be line-to-neutral; for any other wiring
mode, they will be line-to-line voltages.
6.
118
Series PM175 Powermeters
Appendix C Setpoint Triggers and Actions
Appendix C
Setpoint Triggers and Actions
Setpoint Triggers
Display Code
Designation
nonE
NONE
St1.On
St2.On
St1.OFF
St1.OFF
STAT
STAT
STAT
STAT
rL1.On
rL2.On
rL1.OFF
rL2.OFF
RELAY
RELAY
RELAY
RELAY
POS.Ph.r
nEG.Ph.r
Pq.E
POS PHASE REVERSAL
NEG PHASE REVERSAL
PQ EVENT
A.In1.Hi
A.In2.Hi
A.In1.Lo
A.In1.Lo
HI AI1
HI AI2
LO AI1
LO AI2
rtHi.C1
rtHi.C2
rtHi.C3
rtLo.C1
rtLo.C2
rtLo.C3
HI I1 RT
HI I2 RT
HI I3 RT
LO I1 RT
LO I2 RT
LO I3 RT
rtHi. U
rtLo. U
rtHi. C
rtLo. C
rtthd.U
rtthd.C
rtHFc.C
rttdd.C
HI VOLT RT 1
LO VOLT RT 1
HI AMPS RT
LO AMPS RT
HI V THD 1
HI I THD
HI KF RT
HI I TDD
rtHi.Fr
rtLo.Fr
rtHU.Ub
HI FREQ RT
LO FREQ RT
HI V UNB% RT 1
ArHi.C1
ArHi.C2
ArHi.C3
ArLo.C1
ArLo.C2
ArLo.C3
HI I1 AVR
HI I2 AVR
HI I3 AVR
LO I1 AVR
LO I2 AVR
LO I3 AVR
ArHi. U
ArLo. U
ArHi. C
ArLo. C
HI VOLT AVR 1
LO VOLT AVR 1
HI AMPS AVR
LO AMPS AVR
ArHi.P.i
ArHi.P.E
ArHi.q.i
ArHi.q.E
ArHi. S
HI
HI
HI
HI
HI
Series PM175 Powermeters
INP
INP
INP
INP
#1
#2
#1
#2
#1
#2
#1
#2
ON
ON
OFF
OFF
ON
ON
OFF
OFF
kW IMP AVR
kW EXP AVR
kvar IMP AVR
kvar EXP AVR
kVA AVR
Description
None (condition is not active)
Status Inputs
Status input #1 ON
Status input #2 ON
Status input #1 OFF
Status input #2 OFF
Relays
Relay #1 ON
Relay #2 ON
Relay #1 OFF
Relay #2 OFF
Static Events
Positive phase rotation reversal
Negative phase rotation reversal
EN50160 PQ event
Analog Inputs
High analog input #1
High analog input #2
Low analog input #1
Low analog input #2
1-Cycle Phase Values
High I1 current
High I2 current
High I3 current
Low I1 current
Low I2 current
Low I3 current
1-Cycle Values on any Phase
High voltage
Low voltage
High current
Low current
High voltage THD
High current THD
High K-Factor
High current TDD
1-Cycle Auxiliary Values
High frequency
Low frequency
High voltage unbalance
1-Sec Phase Values
High I1 current
High I2 current
High I3 current
Low I1 current
Low I2 current
Low I3 current
1-Sec Values on any Phase
High voltage
Low voltage
High current
Low current
1-Sec Total Values
High total kW import
High total kW export
High total kvar import
High total kvar export
High total kVA
119
Appendix C Setpoint Triggers and Actions
Display Code
120
Designation
ArPF.LG
ArPF.Ld
HI PF LAG AVR
HI PF LEAD AVR
ArnEU.C
ArHi.Fr
ArLo.Fr
ArHU.Ub
HI In AVR
HI FREQ RT
LO FREQ RT
HI V UNB% RT
Hi d.U1
Hi d.U2
Hi d.U3
Hi d.C1
Hi d.C2
Hi d.C3
Hi d.P.i
Hi d.P.E
Hi d.q.i
Hi d.q.i
Hi d. S
HiSd.P.i
HiSd.P.E
HiSd.q.i
HiSd.q.i
HiSd. S
HiAd.P.i
HiAd.P.E
HiAd.q.i
HiAd.q.i
HiAd. S
HiPd.P.i
HiPd.P.E
HiPd.q.i
HiPd.q.i
HiPd. S
HI
HI
HI
HI
HI
HI
HI
HI
HI
HI
HI
HI
HI
HI
HI
HI
HI
HI
HI
HI
HI
HI
HI
HI
HI
HI
PLS.In.1
PLS.In.2
PULSE INPUT #1
PULSE INPUT #2
PLS.Ac.i
PLS.Ac.E
PLS.rE.i
PLS.rE.E
PLS.rE.t
PLS.AP.t
PLS.P.dn
PLS.S.dn
PLS.A.dn
PLS.trF
kWh IMP PULSE
kWh EXP PULSE
kvarh IMP PULSE
kvarh EXP PULSE
kvarh TOT PULSE
kVAh TOT PULSE
START DMD INT
START SD INT
START AMP DMD INT
START TARIFF INT
Cnt.1
Cnt.2
Cnt.3
Cnt.4
HI
HI
HI
HI
t-r.1
t-r.2
t-r.3
t-r.4
TIMER
TIMER
TIMER
TIMER
trF
PrF
TOU TARIFF
TOU PROFILE
U.dAY
YEAr
Mon
DAY OF WEEK
YEAR
MONTH
V1/12 DMD 1
V2/23 DMD 1
V3/31 DMD 1
I1 DMD
I2 DMD
I3 DMD
kW IMP BD
kW EXP BD
kvar IMP BD
kvar EXP BD
kVA BD
kW IMP SD
kW EXP SD
kvar IMP SD
kvar EXP SD
kVA SD
kW IMP ACC DMD
kW EXP ACC DMD
kvar IMP ACC DMD
kvar EXP ACC DMD
kVA ACC DMD
kW IMP PRD DMD
kW EXP PRD DMD
kvar IMP PRD DMD
kvar EXP PRD DMD
kVA PRD DMD
COUNTER
COUNTER
COUNTER
COUNTER
#1
#2
#3
#4
#1
#2
#3
#4
Description
Low total PF Lag
Low total PF Lead
1-Sec Auxiliary Values
High neutral current
High frequency
Low frequency
High voltage unbalance
Present Demands
High V1/V12 Volt demand
High V2/V23 Volt demand
High V3/V31 Volt demand
High I1 Ampere demand
High I2 Ampere demand
High I3 Ampere demand
High block kW import demand
High block kW export demand
High block kvar import demand
High block kvar export demand
High block kVA demand
High sliding window kW import demand
High sliding window kW export demand
High sliding window kvar import demand
High sliding window kvar export demand
High sliding window kVA demand
High accumulated kW import demand
High accumulated kW export demand
High accumulated kvar import demand
High accumulated kvar export demand
High accumulated kVA demand
High predicted kW import demand
High predicted kW export demand
High predicted kvar import demand
High predicted kvar export demand
High predicted kVA demand
Pulse Inputs
Pulse input #1
Pulse input #2
Internal Events
kWh import pulse
kWh export pulse
kvarh import pulse
kvarh export pulse
kvarh total pulse
kVAh total pulse
Start new demand interval
Start new sliding window demand interval
Start new volt/ampere demand interval
Start new tariff interval
Pulse Counters
High pulse counter #1
High pulse counter #2
High pulse counter #3
High pulse counter #4
Timers
Timer #1
Timer #2
Timer #3
Timer #4
TOU Parameters
TOU Tariff
TOU Profile
Time and Date Parameters
Day of week
Year
Month
Series PM175 Powermeters
Appendix C Setpoint Triggers and Actions
Display Code
Designation
M.dAY
hour
Min
SEc
DAY OF MONTH
HOURS
MINUTES
SECONDS
FG1.On
…
FG8.OFF
EVENT FLAG 1 ON
…
EVENT FLAG 8 OFF
SP1.On
…
SP16.On
SP 1 ON
…
SP 16 ON
Description
Day of month
Hours
Minutes
Seconds
Event Flags
Event flag #1 ON
…
Event flag #8 OFF
Setpoint Status
Setpoint #1 ON
…
Setpoint #16 ON
7. 1 In 4LN3, 3LN3 and 3BLN3 wiring modes, the voltages will
be line-to-neutral; for any other wiring mode, they will be line-toline voltages.
Setpoint Actions
Display Code
Designation
none
rEL.1
rEL.2
rEL1.OFF
rEL2.OFF
ELoG
dLoG.1
dLoG.2
dLoG.3
dLoG.4
dLoG.5
dLoG.6
dLoG.7
dLoG.8
dLoG.9
dLoG.10
dLoG.11
dLoG.12
dLoG.13
dLoG.14
dLoG.15
dLoG.16
ULoG.1
ULoG.2
Inc.Cn.1
Inc.Cn.2
Inc.Cn.3
Inc.Cn.4
CLr.Cn.1
CLr.Cn.2
CLr.Cn.3
CLr.Cn.4
CLr.Cnt
CLr.Enr
CLr.dnd
CLr.P.dn
CLr.A.dn
NONE
OPERATE RELAY #1
OPERATE RELAY #2
RELEASE RELAY #1
RELEASE RELAY #2
EVENT LOG
DATA LOG #1
DATA LOG #2
DATA LOG #3
DATA LOG #4
DATA LOG #5
DATA LOG #6
DATA LOG #7
DATA LOG #8
DATA LOG #9
DATA LOG #10
DATA LOG #11
DATA LOG #12
DATA LOG #13
DATA LOG #14
DATA LOG #15
DATA LOG #16
WAVEFORM LOG #1
WAVEFORM LOG #2
INC CNT #1
INC CNT #2
INC CNT #3
INC CNT #4
CLR CNT #1
CLR CNT #2
CLR CNT #3
CLR CNT #4
CLR ALL CNT
CLR ENERGY
CLR ALL DMD
CLR PWR DMD
CLR VOLT/AMP/THD DMD
CLr.tEn
CLr.tdn
CLr.LHi
FLG1.On
FLG2.On
FLG3.On
FLG4.On
FLG1.OFF
CLR TOU ENG
CLR TOU DMD
CLR MIN/MAX
SET FLAG #1
SET FLAG #2
SET FLAG #3
SET FLAG #4
CLR FLAG #1
Series PM175 Powermeters
Description
None (no action)
Operate RO1
Operate RO2
Release latched RO1
Release latched RO2
Log to Event Log
Log to Data Log file #1
Log to Data Log file #2
Log to Data Log file #3
Log to Data Log file #4
Log to Data Log file #5
Log to Data Log file #6
Log to Data Log file #7
Log to Data Log file #8
Log to Data Log file #9
Log to Data Log file #10
Log to Data Log file #11
Log to Data Log file #12
Log to Data Log file #13
Log to Data Log file #14
Log to Data Log file #15
Log to Data Log file #16
Log to Waveform Log file #1
Log to Waveform Log file #2
Increment counter #1
Increment counter #2
Increment counter #3
Increment counter #4
Clear counter #1
Clear counter #2
Clear counter #3
Clear counter #4
Clear all counters
Clear total and phase energy accumulators
Clear all maximum demands
Clear power maximum demands
Clear volt, ampere and THD maximum
demands
Clear TOU energy accumulators
Clear TOU maximum demands
Clear Min/Max log
Set event flag #1
Set event flag #2
Set event flag #3
Set event flag #4
Clear event flag #1
121
Appendix C Setpoint Triggers and Actions
Display Code
FLG2.OFF
FLG3.OFF
FLG4.OFF
122
Designation
CLR FLAG #2
CLR FLAG #3
CLR FLAG #4
Description
Clear event flag #2
Clear event flag #3
Clear event flag #4
Series PM175 Powermeters
Appendix D Parameters for Monitoring and Data Logging
Appendix D Parameters for Monitoring and
Data Logging
The following table lists parameters measured by the meter that are
available for data logging and monitoring through communications. The left
column shows data abbreviations used in PAS. Parameter groups are
highlighted in bold.
Designation
NONE
EVENT FLAGS
EVENT FLAGS 1:16
DIGITAL INPUTS
DI1:16
RELAYS
RO1:16
COUNTERS
COUNTER 1
COUNTER 2
COUNTER 3
COUNTER 4
SYMM COMP
V PSEQ
V NSEQ
V ZSEQ
V NSEQ UNB%
V ZSEQ UNB%
I PSEQ
I NSEQ
I ZSEQ
I NSEQ UNB%
I ZSEQ UNB%
RT PHASE
V1
V2
V3
I1
I2
I3
kW L1
kW L2
kW L3
kvar L1
kvar L2
kvar L3
kVA L1
kVA L2
kVA L3
PF L1
PF L2
PF L3
V1 THD
V2 THD
V3 THD
I1 THD
I2 THD
I3 THD
I1 KF
I2 KF
I3 KF
I1 TDD
I2 TDD
Series PM175 Powermeters
Description
None (stub, read as zero)
Event Flags
Event Flags #1-#8
Digital Inputs
Digital Inputs Status DI1:DI2
Relays
Relay Status RO1:RO2
Pulse Counters
Counter #1
Counter #2
Counter #3
Counter #4
Symmetrical Components
Positive-sequence voltage
Negative-sequence voltage
Zero-sequence voltage
Negative-sequence voltage unbalance
Zero-sequence voltage unbalance
Positive-sequence current
Negative-sequence current
Zero-sequence current
Negative-sequence current unbalance
Zero-sequence current unbalance
1-Cycle Phase Values
V1/V12 Voltage 1
V2/V23 Voltage 1
V3/V31 Voltage 1
I1 Current
I2 Current
I3 Current
kW L1
kW L2
kW L3
kvar L1
kvar L2
kvar L3
kVA L1
kVA L2
kVA L3
Power factor L1
Power factor L2
Power factor L3
V1/V12 Voltage THD 2
V2/V23 Voltage THD 2
V3/V31 Voltage THD 2
I1 Current THD
I2 Current THD
I3 Current THD
I1 K-Factor
I2 K-Factor
I3 K-Factor
I1 Current TDD
I2 Current TDD
123
Appendix D Parameters for Monitoring and Data Logging
Designation
I3 TDD
V12
V23
V31
RT TOTAL
kW
kvar
kVA
PF
PF LAG
PF LEAD
kW IMP
kW EXP
kvar IMP
kvar EXP
V AVG
V LL AVG
I AVG
RT AUX
In
FREQ
V UNB%
I UNB%
AVR PHASE
V1
V2
V3
I1
I2
I3
kW L1
kW L2
kW L3
kvar L1
kvar L2
kvar L3
kVA L1
kVA L2
kVA L3
PF L1
PF L2
PF L3
V1 THD
V2 THD
V3 THD
I1 THD
I2 THD
I3 THD
I1 KF
I2 KF
I3 KF
I1 TDD
I2 TDD
I3 TDD
V12
V23
V31
AVR TOTAL
kW
kvar
kVA
PF
PF LAG
PF LEAD
kW IMP
124
Description
I3 Current TDD
V12 Voltage
V23 Voltage
V31 Voltage
1-Cycle Total Values
Total kW
Total kvar
Total kVA
Total PF
Total PF lag
Total PF lead
Total kW import
Total kW export
Total kvar import
Total kvar export
3-phase average L-N/L-L voltage 1
3-phase average L-L voltage
3-phase average current
1-Cycle Auxiliary Values
In (neutral) Current
Frequency
Voltage unbalance
Current unbalance
1-Second Phase Values
V1/V12 Voltage 1
V2/V23 Voltage 1
V3/V31 Voltage 1
I1 Current
I2 Current
I3 Current
kW L1
kW L2
kW L3
kvar L1
kvar L2
kvar L3
kVA L1
kVA L2
kVA L3
Power factor L1
Power factor L2
Power factor L3
V1/V12 Voltage THD 2
V2/V23 Voltage THD 2
V3/V31 Voltage THD 2
I1 Current THD
I2 Current THD
I3 Current THD
I1 K-Factor
I2 K-Factor
I3 K-Factor
I1 Current TDD
I2 Current TDD
I3 Current TDD
V12 Voltage
V23 Voltage
V31 Voltage
1-Second Total Values
Total kW
Total kvar
Total kVA
Total PF
Total PF lag
Total PF lead
Total kW import
Series PM175 Powermeters
Appendix D Parameters for Monitoring and Data Logging
Designation
kW EXP
kvar IMP
kvar EXP
V AVG
V LL AVG
I AVG
AVR AUX
In
FREQ
V UNB%
I UNB%
RMS (10-min)
V1
V2
V3
V ZERO-SEQ
I ZERO-SEQ
V UNB%
I UNB%
HRM TOT (10-min)
V1 THD
V2 THD
V3 THD
I1 THD
I2 THD
I3 THD
V1 THD/I
V2 THD/I
V3 THD/I
I1 TDD
I2 TDD
I3 TDD
PHASORS
V1 Mag
V2 Mag
V3 Mag
I1 Mag
I2 Mag
I3 Mag
V1 Ang
V2 Ang
V3 Ang
I1 Ang
I2 Ang
I3 Ang
DEMANDS
V1 DMD
V2 DMD
V3 DMD
I1 DMD
I2 DMD
I3 DMD
kW IMP BD
kvar IMP BD
kVA BD
kW IMP SD
kvar IMP SD
kVA SD
kW IMP ACC DMD
kvar IMP ACC DMD
kVA ACC DMD
kW IMP PRD DMD
kvar IMP PRD DMD
Series PM175 Powermeters
Description
Total kW export
Total kvar import
Total kvar export
3-phase average L-N/L-L voltage 1
3-phase average L-L voltage
3-phase average current
1-Second Auxiliary Values
In (neutral) Current
Frequency
Voltage unbalance
Current unbalance
10-min Volts and Symmetrical Components
V1/V12 Voltage 2
V2/V23 Voltage 2
V3/V31 Voltage 2
Zero-sequence voltage
Zero-sequence current
Negative-sequence voltage unbalance
Negative-sequence current unbalance
10-min Total Harmonics
V1/V12 Voltage THD 2
V2/V23 Voltage THD 2
V3/V31 Voltage THD 2
I1 Current THD
I2 Current THD
I3 Current THD
V1/V12 Interharmonic voltage THD 2
V2/V23 Interharmonic voltage THD 2
V3/V31 Interharmonic voltage THD 2
I1 Current TDD
I2 Current TDD
I3 Current TDD
Phasors
V1/V12 Voltage magnitude 2
V2/V23 Voltage magnitude 2
V3/V31 Voltage magnitude 2
I1 Current magnitude
I2 Current magnitude
I3 Current magnitude
V1/V12 Voltage angle 2
V2/V23 Voltage angle 2
V3/V31 Voltage angle 2
I1 Current angle
I2 Current angle
I3 Current angle
Present Demands
V1/V12 Volt demand 2
V2/V23 Volt demand 2
V3/V31 Volt demand 2
I1 Ampere demand
I2 Ampere demand
I3 Ampere demand
kW import block demand
kvar import block demand
kVA block demand
kW import sliding window demand
kvar import sliding window demand
kVA sliding window demand
kW import accumulated demand
kvar import accumulated demand
kVA accumulated demand
kW import predicted sliding window demand
kvar import predicted sliding window demand
125
Appendix D Parameters for Monitoring and Data Logging
Designation
kVA PRD DMD
PF IMP@kVA MXDMD
kW EXP BD
kvar EXP BD
kW EXP SD
kvar EXP SD
kW EXP ACC DMD
kvar EXP ACC DMD
kW EXP PRD DMD
kvar EXP PRD DMD
HRM DMD
V1 THD DMD
V2 THD DMD
V3 THD DMD
I1 THD DMD
I2 THD DMD
I3 THD DMD
I1 TDD DMD
I2 TDD DMD
I3 TDD DMD
SUMM ACC DMD
SUM REG1 ACC DMD
SUM REG2 ACC DMD
…
SUM REG8 ACC DMD
SUMM BLK DMD
SUM REG1 BLK DMD
SUM REG2 BLK DMD
…
SUM REG8 BLK DMD
SUMM SW DMD
SUM REG1 SW DMD
SUM REG2 SW DMD
…
SUM REG8 SW DMD
ENERGY
kWh IMPORT
kWh EXPORT
kvarh IMPORT
kvarh EXPORT
kVAh TOTAL
SUMMARY REGS
SUM REG1
SUM REG2
…
SUM REG8
PHASE ENERGY
kWh IMP L1
kWh IMP L2
kWh IMP L3
kvarh IMP L1
kvarh IMP L2
kvarh IMP L3
kVAh L1
kVAh L2
kVAh L3
%HD V1
V1 %HD01
V1 %HD02
…
V1 %HD50
%HD V2
V2 %HD01
V2 %HD02
…
126
Description
kVA predicted sliding window demand
PF (import) at Maximum kVA sliding window demand
kW export block demand
kvar export block demand
kW export sliding window demand
kvar export sliding window demand
kW export accumulated demand
kvar export accumulated demand
kW export predicted sliding window demand
kvar export predicted sliding window demand
Present Harmonic Demands
V1/V12 THD demand 2
V2/V23 THD demand 2
V3/V31 THD demand 2
I1 THD demand
I2 THD demand
I3 THD demand
I1 TDD demand
I2 TDD demand
I3 TDD demand
Summary (TOU Total) Accumulated Demands
Summary register #1 demand
Summary register #2 demand
…
Summary register #8 demand
Summary (TOU Total) Block Demands
Summary register #1 demand
Summary register #2 demand
…
Summary register #8 demand
Summary (TOU Total) Sliding Demands
Summary register #1 demand
Summary register #2 demand
…
Summary register #8 demand
Total Energy
kWh import
kWh export
kvarh import
kvarh export
kVAh total
Summary (TOU Total) Energy Registers
Summary energy register #1
Summary energy register #2
…
Summary energy register #8
Phase Energy
kWh import L1
kWh import L2
kWh import L3
kvarh import L1
kvarh import L2
kvarh import L3
kVAh total L1
kVAh total L2
kVAh total L3
V1/V12 Harmonic Distortions 2
H01 Harmonic distortion
H02 Harmonic distortion
...
H50 Harmonic distortion
V2/V23 Harmonic Distortions 2
H01 Harmonic distortion
H02 Harmonic distortion
...
Series PM175 Powermeters
Appendix D Parameters for Monitoring and Data Logging
Designation
V2 %HD50
%HD V3
V3 %HD01
V3 %HD02
…
V3 %HD50
%HD I1
I1 %HD01
I1 %HD02
…
I1 %HD50
%HD I2
I2 %HD01
I2 %HD02
…
I2 %HD50
%HD I3
I3 %HD01
I3 %HD02
…
I3 %HD50
ANG V1
V1 H01 ANG
V1 H02 ANG
…
V1 H50 ANG
ANG V2
V2 H01 ANG
V2 H02 ANG
…
V2 H50 ANG
ANG V3
V3 H01 ANG
V3 H02 ANG
…
V3 H50 ANG
ANG I1
I1 H01 ANG
I1 H02 ANG
…
I1 H50 ANG
ANG I2
I2 H01 ANG
I2 H02 ANG
…
I2 H50 ANG
ANG I3
I3 H01 ANG
I3 H02 ANG
…
I3 H50 ANG
H1 PHASE
V1 H01
V2 H01
V3 H01
I1 H01
I2 H01
I3 H01
kW L1 H01
kW L2 H01
kW L3 H01
kvar L1 H01
kvar L2 H01
kvar L3 H01
kVA L1 H01
Series PM175 Powermeters
Description
H50 Harmonic distortion
V3/V31 Harmonic Distortions 2
H01 Harmonic distortion
H02 Harmonic distortion
...
H50 Harmonic distortion
I1 Harmonic Distortions
H01 Harmonic distortion
H02 Harmonic distortion
...
H50 Harmonic distortion
I2 Harmonic Distortions
H01 Harmonic distortion
H02 Harmonic distortion
...
H50 Harmonic distortion
I3 Harmonic Distortions
H01 Harmonic distortion
H02 Harmonic distortion
...
H50 Harmonic distortion
V1/V12 Harmonic Angles 2
H01 Harmonic angle
H02 Harmonic angle
...
H50 Harmonic angle
V2/V23 Harmonic Angles 2
H01 Harmonic angle
H02 Harmonic angle
...
H50 Harmonic angle
V3/V31 Harmonic Angles 2
H01 Harmonic angle
H02 Harmonic angle
...
H40 Harmonic angle
I1 Harmonic Angles
H01 Harmonic angle
H02 Harmonic angle
...
H50 Harmonic angle
I2 Harmonic Angles
H01 Harmonic angle
H02 Harmonic angle
...
H50 Harmonic angle
I3 Harmonic Angles
H01 Harmonic angle
H02 Harmonic angle
...
H50 Harmonic angle
Fundamental (H01) Phase Values
V1/V12 Voltage 2
V2/V23 Voltage 2
V3/V31 Voltage 2
I1 Current
I2 Current
I3 Current
kW L1
kW L2
kW L3
kvar L1
kvar L2
kvar L3
kVA L1
127
Appendix D Parameters for Monitoring and Data Logging
Designation
kVA L2 H01
kVA L3 H01
PF L1 H01
PF L2 H01
PF L3 H01
HRM TOT POW
kW H01
kvar H01
kVA H01
PF H01
FLICKER
V1 Pst
V2 Pst
V3 Pst
V1 Plt
V2 Plt
V3 Plt
MIN PHASE
V1 MIN
V2 MIN
V3 MIN
I1 MIN
I2 MIN
I3 MIN
V1 THD MIN
V2 THD MIN
V3 THD MIN
I1 THD MIN
I2 THD MIN
I3 THD MIN
I1 KF MIN
I2 KF MIN
I3 KF MIN
I1 TDD MIN
I2 TDD MIN
I3 TDD MIN
MIN TOTAL
kW MIN
kvar MIN
kVA MIN
PF MIN
MIN AUX
In MIN
FREQ MIN
MAX PHASE
V1 MAX
V2 MAX
V3 MAX
I1 MAX
I2 MAX
I3 MAX
V1 THD MAX
V2 THD MAX
V3 THD MAX
I1 THD MAX
I2 THD MAX
I3 THD MAX
I1 KF MAX
I2 KF MAX
I3 KF MAX
I1 TDD MAX
I2 TDD MAX
I3 TDD MAX
MAX TOTAL
128
Description
kVA L2
kVA L3
Power factor L1
Power factor L2
Power factor L3
Fundamental Total Power Values
Total fundamental kW
Total fundamental kvar
Total fundamental kVA
Total fundamental PF
Flicker 2
V1 short-term (10 min) flicker severity
V2 short-term (10 min) flicker severity
V3 short-term (10 min) flicker severity
V1 long-term (2 hours) flicker severity
V2 long-term (2 hours) flicker severity
V3 long-term (2 hours) flicker severity
Minimum 1-Cycle Phase Values
V1/V12 Voltage 2
V2/V23 Voltage 2
V3/V31 Voltage 2
I1 Current
I2 Current
I3 Current
V1/V12 Voltage THD 2
V2/V23 Voltage THD 2
V3/V31 Voltage THD 2
I1 Current THD
I2 Current THD
I3 Current THD
I1 K-Factor
I2 K-Factor
I3 K-Factor
I1 Current TDD
I2 Current TDD
I3 Current TDD
Minimum 1-Cycle Total Values
Total kW
Total kvar
Total kVA
Total PF
Minimum 1-Cycle Auxiliary Values
In Current
Frequency
Maximum 1-Cycle Phase Values
V1/V12 Voltage 2
V2/V23 Voltage 2
V3/V31 Voltage 2
I1 Current
I2 Current
I3 Current
V1/V12 Voltage THD 2
V2/V23 Voltage THD 2
V3/V31 Voltage THD 2
I1 Current THD
I2 Current THD
I3 Current THD
I1 K-Factor
I2 K-Factor
I3 K-Factor
I1 Current TDD
I2 Current TDD
I3 Current TDD
Maximum 1-Cycle Total Values
Series PM175 Powermeters
Appendix D Parameters for Monitoring and Data Logging
Designation
kW MAX
kvar MAX
kVA MAX
PF MAX
MAX AUX
In MAX
FREQ MAX
MAX DMD
V1 DMD MAX
V2 DMD MAX
V3 DMD MAX
I1 DMD MAX
I2 DMD MAX
I3 DMD MAX
kW IMP SD MAX
kW EXP SD MAX
kvar IMP SD MAX
kvar EXP SD MAX
kVA SD MAX
MAX HRM DMD
V1 THD DMD MAX
V2 THD DMD MAX
V3 THD DMD MAX
I1 THD DMD MAX
I2 THD DMD MAX
I3 THD DMD MAX
I1 TDD DMD MAX
I2 TDD DMD MAX
I3 TDD DMD MAX
MAX SUMMARY DMD
SUM REG1 DMD MAX
SUM REG2 DMD MAX
…
SUM REG8 DMD MAX
ANALOG INPUTS
AI1
AI2
AI RAW
AI1 RAW
AI2 RAW
AO RAW
AO1
AO2
TOU PRMS
ACTIVE TARIFF
ACTIVE PROFILE
TOU REG1
TOU REG1 TRF1
TOU REG1 TRF2
…
TOU REG1 TRF8
TOU REG2
TOU REG2 TRF1
TOU REG2 TRF2
…
TOU REG2 TRF8
TOU REG3
TOU REG3 TRF1
TOU REG3 TRF2
…
TOU REG3 TRF8
TOU REG4
TOU REG4 TRF1
TOU REG4 TRF2
…
Series PM175 Powermeters
Description
Total kW
Total kvar
Total kVA
Total PF
Maximum 1-Cycle Auxiliary Values
In Current
Frequency
Maximum Demands
V1/V12 Maximum volt demand 2
V2/V23 Maximum volt demand 2
V3/V31 Maximum volt demand 2
I1 Maximum ampere demand
I2 Maximum ampere demand
I3 Maximum ampere demand
Maximum kW import sliding window demand
Maximum kvar import sliding window demand
Maximum kW export sliding window demand
Maximum kvar export sliding window demand
Maximum kVA sliding window demand
Maximum Harmonic Demands
V1/V12 THD demand 2
V2/V23 THD demand 2
V3/V31 THD demand 2
I1 THD demand
I2 THD demand
I3 THD demand
I1 TDD demand
I2 TDD demand
I3 TDD demand
Maximum Summary (TOU Total) Demands
Summary register #1 maximum demand
Summary register #2 maximum demand
…
Summary register #8 maximum demand
Scaled Analog Inputs (Engineering Units)
Analog input AI1
Analog input AI2
Raw Analog Inputs (A/D Units)
Analog input AI1
Analog input AI2
Raw Analog Outputs (A/D Units)
Analog output AO1
Analog output AO2
TOU Parameters
Active TOU tariff
Active TOU profile
TOU Energy Register #1
Tariff #1 register
Tariff #2 register
…
Tariff #8 register
TOU Energy Register #2
Tariff #1 register
Tariff #2 register
…
Tariff #8 register
TOU Energy Register #3
Tariff #1 register
Tariff #2 register
…
Tariff #8 register
TOU Energy Register #4
Tariff #1 register
Tariff #2 register
…
129
Appendix D Parameters for Monitoring and Data Logging
Designation
TOU REG4 TRF8
TOU REG5
TOU REG5 TRF1
TOU REG5 TRF2
…
TOU REG5 TRF8
TOU REG6
TOU REG6 TRF1
TOU REG6 TRF2
…
TOU REG6 TRF8
TOU REG7
TOU REG7 TRF1
TOU REG7 TRF2
…
TOU REG7 TRF8
TOU REG8
TOU REG8 TRF1
TOU REG8 TRF2
…
TOU REG8 TRF8
TOU MAX DMD REG1
DMD1 TRF1 MAX
DMD1 TRF2 MAX
…
DMD1 TRF8 MAX
TOU MAX DMD REG2
DMD2 TRF1 MAX
DMD2 TRF2 MAX
…
DMD2 TRF8 MAX
TOU MAX DMD REG3
DMD3 TRF1 MAX
DMD3 TRF2 MAX
…
DMD3 TRF8 MAX
TOU MAX DMD REG4
DMD4 TRF1 MAX
DMD4 TRF2 MAX
…
DMD4 TRF8 MAX
TOU MAX DMD REG5
DMD5 TRF1 MAX
DMD5 TRF2 MAX
…
DMD5 TRF8 MAX
TOU MAX DMD REG6
DMD6 TRF1 MAX
DMD6 TRF2 MAX
…
DMD6 TRF8 MAX
TOU MAX DMD REG7
DMD7 TRF1 MAX
DMD7 TRF2 MAX
…
DMD7 TRF8 MAX
TOU MAX DMD REG8
DMD8 TRF1 MAX
DMD8 TRF2 MAX
…
DMD8 TRF8 MAX
Description
Tariff #8 register
TOU Energy Register #5
Tariff #1 register
Tariff #2 register
…
Tariff #8 register
TOU Energy Register #6
Tariff #1 register
Tariff #2 register
…
Tariff #8 register
TOU Energy Register #7
Tariff #1 register
Tariff #2 register
…
Tariff #8 register
TOU Energy Register #8
Tariff #1 register
Tariff #2 register
…
Tariff #8 register
TOU Maximum Demand Register #1
Tariff #1 register
Tariff #2 register
…
Tariff #8 register
TOU Maximum Demand Register #2
Tariff #1 register
Tariff #2 register
…
Tariff #8 register
TOU Maximum Demand Register #3
Tariff #1 register
Tariff #2 register
…
Tariff #8 register
TOU Maximum Demand Register #4
Tariff #1 register
Tariff #2 register
…
Tariff #8 register
TOU Maximum Demand Register #5
Tariff #1 register
Tariff #2 register
…
Tariff #8 register
TOU Maximum Demand Register #6
Tariff #1 register
Tariff #2 register
…
Tariff #8 register
TOU Maximum Demand Register #7
Tariff #1 register
Tariff #2 register
…
Tariff #8 register
TOU Maximum Demand Register #8
Tariff #1 register
Tariff #2 register
…
Tariff #8 register
1 In 4LN3, 4LL3, 3LN3, 3LL3, 3BLN3 and 3BLL3 wiring modes,
the voltages will be line-to-neutral; for any other wiring mode,
they will be line-to-line voltages.
130
Series PM175 Powermeters
Appendix D Parameters for Monitoring and Data Logging
2
In 4LN3, 3LN3 and 3BLN3 wiring modes, the voltages will be line-to-neutral; for
any other wiring mode, they will be line-to-line.
Series PM175 Powermeters
131
Appendix E EN50160 Statistics Log Files
Appendix E
EN50160 Statistics Log Files
The following table lists the EN50160 evaluation parameters recorded by the
meter in the EN50160 statistics data log files. The second column shows
data abbreviations used in the PAS data log reports. Data log files’ sections
are highlighted by a bold font.
EN50160 Compliance Statistics Log (Data Log #9)
Field No.
132
Designation
1
2
3
4
5
6
7
8
Nnv
N
N1
N2
N1/N, %
N2/N, %
Freq Min
Freq Max
1
2
3
4
5
6
7
8
9
10
11
12
13
14
15
Nnv
N
N1
N2
N1/N, %
N2/N, %
V1 N1
V1 Min
V1 Max
V2 N1
V2 Min
V2 Max
V3 N1
V3 Min
V3 Max
1
2
3
4
5
6
7
N1
V1 N1
V1 dV%
V2 N1
V2 dV%
V3 N1
V3 dV%
1
2
3
4
5
6
7
8
9
10
Nnv
N
N1
N1/N, %
V1 N1
V1 Plt Max
V2 N1
V2 Plt Max
V3 N1
V3 Plt Max
1
2
3
4
5
6
7
8
9
N11
N12
N13
N14
N11
N12
N13
N14
N11
90%/100ms
85%/100ms
70%/100ms
40%/100ms
90%/500ms
85%/500ms
70%/500ms
40%/500ms
90%/1s
Description
Power Frequency
Number of non-valid 10-sec intervals
Number of valid 10-sec intervals
Number of incidents ±1%, N1
Number of incidents +4%/-6%, N2
EN50160 compliance ratio, N1/N
EN50160 compliance ratio, N2/N
Minimum frequency
Maximum frequency
Supply Voltage Variations
Number of non-valid 10-min intervals
Number of valid 10-min intervals
Number of polyphase incidents ±10%, N1
Number of polyphase incidents +10/-15%, N2
EN50160 compliance ratio, N1/N
EN50160 compliance ratio, N2/N
Number of incidents ±10% on phase V1
Minimum voltage on phase V1
Maximum voltage on phase V1
Number of incidents ±10% on phase V2
Minimum voltage on phase V2
Maximum voltage on phase V2
Number of incidents ±10% on phase V3
Minimum voltage on phase V3
Maximum voltage on phase V3
Rapid Voltage Changes
Number of polyphase incidents
Number of incidents on phase V1
Maximum voltage variation on phase V1, dV/Un%
Number of incidents on phase V2
Maximum voltage variation on phase V2, dV/Un%
Number of incidents on phase V3
Maximum voltage variation on phase V3, dV/Un%
Flicker
Number of non-valid 10-min intervals
Number of valid 10-min intervals
Number of polyphase incidents Plt >1%, N1
EN50160 compliance ratio, N1/N
Number of incidents Plt > 1% on phase V1
Maximum Plt on phase V2
Number of incidents Plt > 1% on phase V2
Maximum Plt on phase V2
Number of incidents Plt > 1% on phase V3
Maximum Plt on phase V3
Voltage Dips (indicative statistics)
Number of polyphase incidents u<90%/t<100ms
Number of polyphase incidents u<85%/t<100ms
Number of polyphase incidents u<70%/t<100ms
Number of polyphase incidents u<40%/t<100ms
Number of polyphase incidents u<90%/t<500ms
Number of polyphase incidents u<85%/t<500ms
Number of polyphase incidents u<70%/t<500ms
Number of polyphase incidents u<40%/t<500ms
Number of polyphase incidents u<90%/t<1s
Series PM175 Powermeters
Appendix E EN50160 Statistics Log Files
Field No.
10
11
12
13
14
15
16
17
18
19
20
21
22
23
24
25
26
27
28
29
30
31
32
33
34
Designation
N12 85%/1s
N13 70%/1s
N14 40%/1s
N11 90%/3s
N12 85%/3s
N13 70%/3s
N14 40%/3s
N11 90%/20s
N12 85%/20s
N13 70%/20s
N14 40%/20s
N11 90%/60s
N12 85%/60s
N13 70%/60s
N14 40%/60s
N11 90%/180s
N12 85%/180s
N13 70%/180s
N14 40%/180s
V1 N1
V1 Min
V2 N1
V2 Min
V3 N1
V3 Min
1
2
3
4
5
6
N1 1s
N2 180s
N3 >180s
V1 Min
V2 Min
V3 Min
1
2
3
4
5
6
7
8
9
10
11
12
13
14
15
16
17
18
19
20
21
N11 110%/1s
N12 120%/1s
N13 140%/1s
N14 160%/1s
N15 200%/1s
N21 110%/60s
N22 120%/60s
N23 140%/60s
N24 160%/60s
N25 200%/60s
N31 110%/>60s
N32 120%/>60s
N33 140%/>60s
N34 160%/>60s
N35 200%/>60s
V1 N1
V1 Max
V2 N1
V2 Max
V3 N1
V3 Max
1
2
3
4
5
6
7
8
9
10
11
N1 110%
N2 150%
N3 200%
N4 250%
N5 300%
V1 N1 110%
V1 N2 150%
V1 N3 200%
V1 N4 250%
V1 N5 300%
V2 N1 110%
Series PM175 Powermeters
Description
Number of polyphase incidents u<85%/t<1s
Number of polyphase incidents u<70%/t<1s
Number of polyphase incidents u<40%/t<1s
Number of polyphase incidents u<90%/t<3s
Number of polyphase incidents u<85%/t<3s
Number of polyphase incidents u<70%/t<3s
Number of polyphase incidents u<40%/t<3s
Number of polyphase incidents u<90%/t<20s
Number of polyphase incidents u<85%/t<20s
Number of polyphase incidents u<70%/t<20s
Number of polyphase incidents u<40%/t<20s
Number of polyphase incidents u<90%/t<60s
Number of polyphase incidents u<85%/t<60s
Number of polyphase incidents u<70%/t<60s
Number of polyphase incidents u<40%/t<60s
Number of polyphase incidents u<90%/t<180s
Number of polyphase incidents u<85%/t<180s
Number of polyphase incidents u<70%/t<180s
Number of polyphase incidents u<40%/t<180s
Total number of incidents on phase V1
Minimum residual voltage on phase V1
Total number of incidents on phase V2
Minimum residual voltage on phase V2
Total number of incidents on phase V3
Minimum residual voltage on phase V3
Voltage Interruptions (indicative statistics)
Number of polyphase incidents t<1s
Number of polyphase incidents t<180s
Number of polyphase incidents t>180s
Minimum residual voltage on phase V1
Minimum residual voltage on phase V2
Minimum residual voltage on phase V3
Temporary Overvoltages (indicative statistics)
Number of polyphase incidents u>110%/t<1s
Number of polyphase incidents u>120%/t<1s
Number of polyphase incidents u>140%/t<1s
Number of polyphase incidents u>160%/t<1s
Number of polyphase incidents u>200%/t<1s
Number of polyphase incidents u>110%/t<60s
Number of polyphase incidents u>120%/t<60s
Number of polyphase incidents u>140%/t<60s
Number of polyphase incidents u>160%/t<60s
Number of polyphase incidents u>200%/t<60s
Number of polyphase incidents u>110%/t>60s
Number of polyphase incidents u>120%/t>60s
Number of polyphase incidents u>140%/t>60s
Number of polyphase incidents u>160%/t>60s
Number of polyphase incidents u>200%/t>60s
Total number of incidents on phase V1
Maximum voltage magnitude on phase V1
Total number of incidents on phase V2
Maximum voltage magnitude on phase V2
Total number of incidents on phase V3
Maximum voltage magnitude on phase V3
Transient Overvoltages (indicative statistics)
Number of polyphase incidents u>120%
Number of polyphase incidents u>150%
Number of polyphase incidents u>200%
Number of polyphase incidents u>250%
Number of polyphase incidents u>300%
Number of incidents u>120% on phase V1
Number of incidents u>150% on phase V1
Number of incidents u>200% on phase V1
Number of incidents u>250% on phase V1
Number of incidents u>300% on phase V1
Number of incidents u>120% on phase V2
133
Appendix E EN50160 Statistics Log Files
Field No.
12
13
14
15
16
17
18
19
20
21
22
23
134
Designation
V2 N2 150%
V2 N3 200%
V2 N4 250%
V2 N5 300%
V3 N1 110%
V3 N2 150%
V3 N3 200%
V3 N4 250%
V3 N5 300%
V1 Peak Max
V2 Peak Max
V3 Peak Max
1
2
3
4
5
Nnv
N
N1
N1/N, %
V Unb% Max
1
2
3
4
5
6
7
8
9
10
11
12
13
14
15
16
17
18
19
20
21
Nnv
N
N1
N2
N1/N, %
N2/N, %
V1 N1
V1 N2
V1 HD% Max
V1 H#
V1 THD Max
V2 N1
V2 N2
V2 HD% Max
V2 H#
V2 THD Max
V3 N1
V3 N2
V3 HD% Max
V3 H#
V3 THD Max
1
2
3
4
5
6
7
8
9
10
11
12
13
14
15
16
17
18
19
20
21
Nnv
N
N1
N2
N1/N, %
N2/N, %
V1 N1
V1 N2
V1 HD% Max
V1 H#
V1 THD Max
V2 N1
V2 N2
V2 HD% Max
V2 H#
V2 THD Max
V3 N1
V3 N2
V3 HD% Max
V3 H#
V3 THD Max
1
2
3
Nnv
N
N1
Description
Number of incidents u>150% on phase V2
Number of incidents u>200% on phase V2
Number of incidents u>250% on phase V2
Number of incidents u>300% on phase V2
Number of incidents u>120% on phase V3
Number of incidents u>150% on phase V3
Number of incidents u>200% on phase V3
Number of incidents u>250% on phase V3
Number of incidents u>300% on phase V3
Maximum peak voltage on phase V1
Maximum peak voltage on phase V2
Maximum peak voltage on phase V3
Supply Voltage Unbalance
Number of non-valid 10-min intervals
Number of valid 10-min intervals
Number of incidents V Unb > 2%, N1
EN50160 compliance ratio, N1/N
Maximum voltage unbalance
Harmonic Voltage
Number of non-valid 10-min intervals
Number of valid 10-min intervals
Number of polyphase harmonic voltage incidents, N1
Number of polyphase voltage THD incidents, N2
EN50160 harmonic voltage compliance ratio, N1/N
EN50160 voltage THD compliance ratio, N2/N
Number of harmonic voltage incidents on phase V1
Number of voltage THD incidents on phase V1
Worst-case harmonic magnitude on phase V1, %Un
Worst-case harmonic component number on phase V1
Worst-case voltage THD on phase V1
Number of harmonic voltage incidents on phase V2
Number of voltage THD incidents on phase V2
Worst-case harmonic magnitude on phase V2, %Un
Worst-case harmonic component number on phase V2
Worst-case voltage THD on phase V2
Number of harmonic voltage incidents on phase V3
Number of voltage THD incidents on phase V3
Worst-case harmonic magnitude on phase V3, %Un
Worst-case harmonic component number on phase V3
Worst-case voltage THD on phase V3
Interharmonic Voltage
Number of non-valid 10-min intervals
Number of valid 10-min intervals
Number of polyphase interharmonic voltage incidents, N1
Number of polyphase interharmonic THD incidents, N2
EN50160 interharmonic voltage compliance ratio, N1/N
EN50160 interharmonic voltage THD compliance ratio, N2/N
Number of interharmonic voltage incidents on phase V1
Number of interharmonic voltage THD incidents on phase V1
Worst-case interharmonic magnitude on phase V1, %Un
Worst-case interharmonic component number on phase V1
Worst-case interharmonic voltage THD on phase V1
Number of interharmonic voltage incidents on phase V2
Number of interharmonic voltage THD incidents on phase V2
Worst-case interharmonic magnitude on phase V2, %Un
Worst-case interharmonic component number on phase V2
Worst-case interharmonic voltage THD on phase V2
Number of interharmonic voltage incidents on phase V3
Number of interharmonic voltage THD incidents on phase V3
Worst-case interharmonic magnitude on phase V3, %Un
Worst-case interharmonic component number on phase V3
Worst-case interharmonic THD on phase V3
Mains Signaling Voltage
Number of non-valid 3-sec intervals
Number of valid 3-sec intervals
Number of polyphase incidents, N1
Series PM175 Powermeters
Appendix E EN50160 Statistics Log Files
Field No.
4
5
6
7
8
9
10
11
12
13
14
15
16
17
18
19
20
21
22
23
Designation
N1/N, %
V1 N1
V1 Frq1 %Un
V1 Frq2 %Un
V1 Frq3 %Un
V1 Frq4 %Un
V2 N1
V2 Frq1 %Un
V2 Frq2 %Un
V2 Frq3 %Un
V2 Frq4 %Un
V3 N1
V3 Frq1 %Un
V3 Frq2 %Un
V3 Frq3 %Un
V3 Frq4 %Un
Frq1
Frq2
Frq3
Frq4
Description
EN50160 compliance ratio, N1/N
Number of incidents on phase V1
Maximum 1st signaling voltage magnitude on phase V1, %Un
Maximum 2nd signaling voltage magnitude on phase V1, %Un
Maximum 3rd signaling voltage magnitude on phase V1, %Un
Maximum 4th signaling voltage magnitude on phase V1, %Un
Number of incidents on phase V2
Maximum 1st signaling voltage magnitude on phase V2, %Un
Maximum 2nd signaling voltage magnitude on phase V2, %Un
Maximum 3rd signaling voltage magnitude on phase V2, %Un
Maximum 4th signaling voltage magnitude on phase V2, %Un
Number of incidents on phase V3
Maximum 1st signaling voltage magnitude on phase V3, %Un
Maximum 2nd signaling voltage magnitude on phase V3, %Un
Maximum 3rd signaling voltage magnitude on phase V3, %Un
Maximum 4th signaling voltage magnitude on phase V3, %Un
1st signaling voltage frequency
2nd signaling voltage frequency
3rd signaling voltage frequency
4th signaling voltage frequency
EN50160 Harmonics Survey Log (Data Log #10)
Field No.
Designation
1
2
3
4
5
…
51
THD MAX
THDO MAX
THDE MAX
%HD02 MAX
%HD03 MAX
…
%HD50 MAX
1
2
3
4
5
…
51
THD MAX
THDO MAX
THDE MAX
%HD02 MAX
%HD03 MAX
…
%HD50 MAX
1
2
3
4
5
…
51
THD MAX
THDO MAX
THDE MAX
%HD02 MAX
%HD03 MAX
…
%HD50 MAX
Series PM175 Powermeters
Description
V1 Harmonic Voltage
Maximum THD
Maximum odd harmonics THD
Maximum even harmonics THD
Maximum H02 harmonic voltage magnitude, %Un
Maximum H03 harmonic voltage magnitude, %Un
Maximum H50 harmonic voltage magnitude, %Un
V2 Harmonic Voltage
Maximum THD
Maximum odd harmonics THD
Maximum even harmonics THD
Maximum H02 harmonic voltage magnitude, %Un
Maximum H03 harmonic voltage magnitude, %Un
Maximum H50 harmonic voltage magnitude, %Un
V3 Harmonic Voltage
Maximum THD
Maximum odd harmonics THD
Maximum even harmonics THD
Maximum H02 harmonic voltage magnitude, %Un
Maximum H03 harmonic voltage magnitude, %Un
Maximum H50 harmonic voltage magnitude, %Un
135