1
SonicWALL ViewPoint User’s Guide
Version 2.8
Copyright Information
© 2004 SonicWALL, Inc. All rights reserved.
Under the copyright laws, this manual or the software described within, may not be copied, in whole or part, without the written consent of the manufacturer, except in the normal use of the software to make a backup copy. The
same proprietary and copyright notices must be affixed to any permitted copies as were affixed to the original.
Under the law, copying includes translating into another language or format.
SonicWALL is a registered trademark of SonicWALL, Inc.
Other product and company names mentioned herein may be trademarks and/or registered trademarks of their
respective companies.
Specifications and descriptions subject to change without notice.
Part Number: 232-000572-00 Rev A
Software License Agreement for
ViewPoint Management System
This Software License Agreement (SLA) is a legal agreement between you and SonicWALL, Inc. (SonicWALL)
for the SonicWALL software product identified above, which includes computer software and any and all associated media, printed materials, and online or electronic documentation (SOFTWARE PRODUCT). By opening the
sealed package(s), installing, or otherwise using the SOFTWARE PRODUCT, you agree to be bound by the terms
of this SLA. If you do not agree to the terms of this SLA, do not open the sealed package(s), install or use the
SOFTWARE PRODUCT. You may however return the unopened SOFTWARE PRODUCT to your place of purchase for a full refund.
The SOFTWARE PRODUCT is licensed, not sold.
You acknowledge and agree that all right, title, and interest in and to the SOFTWARE PRODUCT, including all
associated intellectual property rights, are and shall remain with SonicWALL. This SLA does not convey to you an
interest in or to the SOFTWARE PRODUCT, but only a limited right of use revocable in accordance with the terms
of this SLA.
oThe SOFTWARE PRODUCT is licensed as a single product.
oYou may also store or install a copy of the SOFTWARE PRODUCT on a storage device, such as a network server,
used only to install or run the SOFTWARE PRODUCT on your other computers over an internal network.
oYou may not resell, or otherwise transfer for value, rent, lease, or lend the SOFTWARE PRODUCT.
oThe SOFTWARE PRODUCT is trade secret or confidential information of SonicWALL or its licensors. You shall
take appropriate action to protect the confidentiality of the SOFTWARE PRODUCT. You shall not reverse-engineer, de-compile, or disassemble the SOFTWARE PRODUCT, in whole or in part. The provisions of this section
will survive the termination of this SLA.
oYou agree and certify that neither the SOFTWARE PRODUCT nor any other technical data received from SonicWALL, nor the direct product thereof, will be exported outside the United States except as permitted by the laws
and regulations of the United States, which may require U.S. Government export approval/licensing. Failure to
strictly comply with this provision shall automatically invalidate this License.
LICENSE
SonicWALL grants you a non-exclusive license to use the SOFTWARE PRODUCT for a number of SonicWALL
Internet Security Appliances. This number is specified and shipped with the SOFTWARE PRODUCT. Support for
additional SonicWALL Internet Security Appliances is subject to a separate upgrade license.
OEM - If the SOFTWARE PRODUCT is modified and enhanced for a SonicWALL OEM partner, you must adhere
to the software license agreement of the SonicWALL OEM partner.
UPGRADES
If the SOFTWARE PRODUCT is labeled as an upgrade, you must be properly licensed to use a product identified
by SonicWALL as being eligible for the upgrade in order to use the SOFTWARE PRODUCT. A SOFTWARE
PRODUCT labeled as an upgrade replaces and/or supplements the product that formed the basis for your eligibility
for the upgrade. You may use the resulting upgraded product only in accordance with the terms of this SLA. If the
SOFTWARE PRODUCT is an upgrade of a component of a package of software programs that you licensed as a
single product, the SOFTWARE PRODUCT may be used and transferred only as part of that single product package and may not be separated for use on more than one computer.
DISTRIBUTION RIGHTS
To i-net SPRINTAÔ 2000 DRIVER - SonicWALL has been given a non-exclusive, worldwide license by i-net software GmbH to distribute directly and indirectly (through SonicWALL's distribution channels) the i-net SPRINTAÔ
2000 driver to SonicWALL's end user customers to use the driver with SonicWALL ViewPoint. SonicWALL's end
user customers may make a copy of the driver for backup or archival purposes only. SonicWALL's end user customers are not allowed to make other copies, transfer, re-distribute, use, translate, or reverse assemble/compile the
driver with any other non-SonicWALL applications. i-net software GmbH holds copyright and title to the i-net
SPRINTAÔ 2000 Driver.
To Microsoft's SQL Server Developer's Edition (MSDE) - This software incorporates Microsoft's SQL Server
Developer's Edition (MSDE) and your use is subject to the terms and conditions of Microsoft's MSDE End-User
License Agreement (a copy of which is available on Microsoft's website: <http://www.microsoft.com/sql/howtobuy/deveula.asp>).
To Quest Software's (formerly Sitraka) JClass ServerChart - This software incorporates Quest Software's (formerly
Sitraka) JClass ServerChart and your use is subject to the terms and conditions of Quest's Jclass License Agreement
(a copy of which is available on Quest's website: <http://java.quest.com/jclass/licensing.shtml>).
SUPPORT SERVICES
SonicWALL may provide you with support services related to the SOFTWARE PRODUCT (“Support Services”).
Use of Support Services is governed by the SonicWALL policies and programs described in the user manual, in
“online” documentation, and/or in other SonicWALL-provided materials. Any supplemental software code provided to you as part of the Support Services shall be considered part of the SOFTWARE PRODUCT and subject to
terms and conditions of this SLA. With respect to technical information you provide to SonicWALL as part of the
Support Services, SonicWALL may use such information for its business purposes, including for product support
and development. SonicWALL shall not utilize such technical information in a form that identifies its source.
OWNERSHIP
As between the parties, SonicWALL retains all title to, ownership of, and all proprietary rights with respect to the
SOFTWARE PRODUCT (including but not limited to any images, photographs, animations, video, audio, music,
text, and 'applets” incorporated into the SOFTWARE PRODUCT), the accompanying printed materials, and any
copies of the SOFTWARE PRODUCT. The SOFTWARE PRODUCT is protected by copyrights laws and international treaty provisions. The SOFTWARE PRODUCT is licensed, not sold. This SLA does not convey to you an
interest in or to the SOFTWARE PRODUCT, but only a limited right of use revocable in accordance with the terms
of this SLA.
U.S. GOVERNMENT RESTRICTED RIGHTS
If you are acquiring the Software including accompanying documentation on behalf of the U.S. Government, the
following provisions apply. If the Software is supplied to the Department of Defense (“DoD”), the Software is subject to “Restricted Rights”, as that term is defined in the DOD Supplement to the Federal Acquisition Regulations
(“DFAR”) in paragraph 252.227 7013(c) (1). If the Software is supplied to any unit or agency of the United States
Government other than DOD, the Government's rights in the Software will be as defined in paragraph 52.227 19(c)
(2) of the Federal Acquisition Regulations (“FAR”). Use, duplication, reproduction or disclosure by the Government is subject to such restrictions or successor provisions. Contractor/Manufacturer is: SonicWALL, Inc. 1160
Bordeaux Drive, Sunnyvale, California 94089.
MISCELLANEOUS
This SLA represents the entire agreement concerning the subject matter hereof between the parties and supersedes
all prior agreements and representations between them. It may be amended only in writing executed by both parties.
This SLA shall be governed by and construed under the laws of the State of California as if entirely performed
within the State and without regard for conflicts of laws. Should any term of this SLA be declared void or unenforceable by any court of competent jurisdiction, such declaration shall have no effect on the remaining terms
hereof. The failure of either party to enforce any rights granted hereunder or to take action against the other party in
the event of any breach hereunder shall not be deemed a waiver by that party as to subsequent enforcement of rights
or subsequent actions in the event of future breaches.
TERMINATION
This SLA is effective upon your opening of the sealed package(s), installing or otherwise using the SOFTWARE
PRODUCT, and shall continue until terminated. Without prejudice to any other rights, SonicWALL may terminate
this SLA if you fail to comply with the terms and conditions of this SLA. In such event, you agree to return or
destroy the SOFTWARE PRODUCT (including all related documents and components items as defined above) and
any and all copies of same.
LIMITED WARRANTY
SonicWALL warrants that a) the software product will perform substantially in accordance with the accompanying
written materials for a period of ninety (90) days from the date of purchase, and b) any support services provided by
SonicWALL shall be substantially as described in applicable written materials provided to you by SonicWALL.
Any implied warranties on the software product are limited to ninety (90) days. Some states and jurisdictions do not
allow limitations on duration of an implied warranty, so the above limitation may not apply to you.
CUSTOMER REMEDIES
SonicWALL's and its suppliers' entire liability and your exclusive remedy shall be, at SonicWALL's option, either
a) return of the price paid, or b) repair or replacement of the SOFTWARE PRODUCT that does not meet SonicWALL's Limited Warranty and which is returned to SonicWALL with a copy of your receipt. This Limited Warranty is void if failure of the SOFTWARE PRODUCT has resulted from accident, abuse, or misapplication. Any
replacement SOFTWARE PRODUCT shall be warranted for the remainder of the original warranty period or thirty
(30) days, whichever is longer. Outside of the United States, neither these remedies nor any product Support Services offered by SonicWALL are available without proof of purchase from an authorized SonicWALL international
reseller or distributor.
NO OTHER WARRANTIES
To the maximum extent permitted by applicable law, SonicWALL and its suppliers/licensors disclaim all other warranties and conditions, either express or implied, including, but not limited to, implied warranties of merchantability, fitness for a particular purpose, title, and non-infringement, with regard to the SOFTWARE PRODUCT, and the
provision of or failure to provide support services. This limited warranty gives you specific legal rights. You may
have others, which vary from state/jurisdiction to state/jurisdiction.
LIMITATION OF LIABILITY
Except for the warranties provided hereunder, to the maximum extent permitted by applicable law, in no event shall
SonicWALL or its suppliers/licensors be liable for any special, incidental, indirect, or consequential damages for
lost business profits, business interruption, loss of business information,) arising out of the use of or inability to use
the SOFTWARE PRODUCT or the provision of or failure to provide support services, even if SonicWALL has
been advised of the possibility of such damages. In any case, SonicWALL's entire liability under any provision of
this SLA shall be limited to the amount actually paid by you for the SOFTWARE PRODUCT; provided, however,
if you have entered into a SonicWALL support services agreement, SonicWALL's entire liability regarding support
services shall be governed by the terms of that agreement. Because some states and jurisdiction do not allow the
exclusion or limitation of liability, the above limitation may not apply to you.
Manufacturer is SonicWALL, Inc. with headquarters located at 1143 Borregas Avenue, Sunnyvale, CA 94089,
USA.
CONTENTS
Chapter 1 Introducing SonicWALL ViewPoint
11
Chapter 2 Installing SonicWALL ViewPoint
13
Installation Overview
14
Installation
15
Logging in and out of SonicWALL ViewPoint
17
Registering SonicWALL ViewPoint
18
Creating a mysonicwall.com Account
18
Registering the SonicWALL Appliance
18
Activating the ViewPoint Software
18
Enabling the ViewPoint License on the SonicWALL Appliance19
Chapter 3 Configuring ViewPoint
Configuring a SonicWALL Appliance for SonicWALL ViewPoint
Configuring Access to a SonicWALL Appliance
Adding a SonicWALL Appliance to SonicWALL ViewPoint
Deleting SonicWALL Appliances from SonicWALL ViewPoint
Modifying Settings for a SonicWALL Appliance
Configuring User Settings
Changing ViewPoint Login Password
Configuring Presentation Options
Configuring Management Settings
Configuring General ViewPoint Settings
Configuring Alert Settings
Managing ViewPoint Sessions
Configuring Email/Alert Setting Notifications
Configuring Reporting Settings
Configuring Log Viewer Settings
General Report Settings
Adding a Service
Configuring Email/Archive Settings
Chapter 4 Viewing Reports
Viewing Status Reports
Viewing the Status Summary Report
Viewing Status Over Time
Viewing Bandwidth Reports
Viewing the Bandwidth Summary Report
Monitoring Bandwidth Usage in Real Time
Viewing the Top Users of Bandwidth
Viewing Bandwidth Usage Over Time
Viewing the Top Users of Bandwidth Over Time
Viewing Service Usage Reports
Monitoring Service Usage in Real Time
Viewing the Services Summary Report
21
22
23
26
27
28
29
29
29
31
31
31
32
33
35
35
35
36
37
39
39
39
41
42
42
44
44
46
48
50
50
51
7
Adding a Service
Viewing Web Usage Reports
Viewing the Web Usage Summary Report
Viewing the Top Web Sites
Viewing the Top Users of Web Bandwidth
Viewing Web Usage by User
Viewing Web Usage by Site
Viewing Web Usage Over Time
Viewing Top Sites Over Time
Viewing Top Users Over Time
Viewing Bandwidth Usage By User Over Time
Viewing Web Filter Reports
Viewing the Web Filter Summary Report
Viewing the Web Filter Top Sites Report
Viewing the Top Users that Try to Access Blocked Sites
Viewing the Top Blocked Sites for Each User
Viewing Blocked Site Attempts Over Time
Viewing the Top Blocked Site Attempts Over Time
Viewing the Top Blocked Site Users Over Time
Viewing the Top Blocked Sites for Each User Over Time
Viewing File Transfer Protocol Reports
Viewing the FTP Summary Report
Viewing the Top Users of FTP Bandwidth
Viewing FTP Bandwidth Usage Over Time
Viewing the Top Users of FTP Bandwidth Over Time
Viewing Mail Usage Reports
Viewing the Mail Usage Summary Report
Viewing the Top Users of Mail Bandwidth
Viewing Mail Usage Over Time
Viewing the Top Users of Mail Bandwidth Over Time
Viewing VPN Usage Reports
Viewing the VPN Usage Summary Report
Viewing the Top VPN Users
Viewing VPN Usage Over Time
Viewing the Top VPN Users Over Time
Viewing VPN Usage by Policy
Viewing the Top VPN Policies Over Time
Viewing Hourly VPN Usage by Policy
Viewing the VPN Services Summary Report
Viewing Attack Reports
Viewing the Attack Summary Report
Viewing the Attacks by Category
Viewing the Attacks by Source
Viewing the Errors and Exceptions Report
Viewing Attack Reports Over Time
Viewing the Attacks by Category Over Time
Sources Over Time
Viewing Errors Over Time
Viewing Intrusion Prevention Reports
Viewing the Intrusion Prevention Summary Report
Viewing the Intrusions by Destination
Viewing the Intrusions by Source
8
SonicWALL ViewPoint User’s Guide
52
54
54
56
57
59
61
62
64
65
67
69
69
71
72
74
75
77
78
80
82
82
83
85
87
89
89
91
92
94
96
96
98
99
101
102
104
105
107
109
109
110
112
113
115
116
118
119
122
122
123
125
Top Intrusions
Top Intrusions by Priority
Viewing Intrusions Over Time
Viewing Intrusions by Destination Over Time
Sources Over Time
Top Intrusions Over Time
Viewing Authentication Reports
Viewing the User Login Report
Viewing the Administrator Login Report
Viewing the Failed Login Report
Viewing the Log
Viewing the Log for a SonicWALL Appliance
Chapter 5 Scheduling SonicWALL ViewPoint
Scheduling a Daily Report
Scheduling a Weekly or Monthly Report
Uninstalling the ViewPoint Web Server from the DOS Prompt
Changing the ViewPoint Web Server Port Number
Changing the SonicWALL ViewPoint IP Address
Changing the Default Syslog Server Port Number
The sgmsConfig.xml File
The SonicWALL ViewPoint Log Files
Encrypting the sgmsConfig.xml File
Encrypted Data in the sgmsConfig.xml File
Resetting the Admin Password
Copying/Pasting into SonicWALL ViewPoint User Interface
Using the Import Feature from Applet
Securing Access to the ViewPoint Web Server
Creating a Keystore with a Valid Test Certificate
Creating a Secure Website
Securely Accessing SonicWALL ViewPoint
Customizing Reports
Report File Elements
126
128
129
131
132
134
136
136
137
139
141
141
143
144
146
149
149
149
149
150
150
151
151
151
151
152
152
152
152
153
155
157
9
10
SonicWALL ViewPoint User’s Guide
CHAPTER 1
Introducing SonicWALL ViewPoint
SonicWALL ViewPoint is a browser-based software application that creates dynamic web-based network reports.
With SonicWALL ViewPoint, you can monitor network access, enhance security, and anticipate future bandwidth
needs.
SonicWALL ViewPoint generates both real-time and historical reports to offer a complete view of all activity
through one or more SonicWALL appliances. It generates the reports based on the stream of syslog data received
from each SonicWALL appliance and summarizes this data, allowing you to view the reports for current date, a previous day, or for a range of days.
SonicWALL ViewPoint:
•
•
•
•
•
•
•
Displays bandwidth use by IP address and service.
Identifies inappropriate Internet use.
Provides detailed reports of attacks.
Collects and aggregates system and network errors.
Shows Virtual Private Network (VPN) events and problems.
Presents visitor traffic to your website.
Provides detailed daily firewall logs to analyze specific events.
SonicWALL ViewPoint offers the following features:
•
•
•
•
•
•
•
•
•
•
•
•
•
Web-based browser reporting application—SonicWALL ViewPoint can be accessed from a local or remote
system using a web browser.
Single firewall real-time and historical reports—SonicWALL ViewPoint offers reports for single SonicWALL appliances.
Aggregated real-time and historical reports—SonicWALL ViewPoint offers aggregated reports for multiple
SonicWALL appliances.
Summarized Reports—SonicWALL ViewPoint summarizes its data, allowing the user to view reports for the
current date, a previous day, or a range of days.
Support for multiple firewalls—SonicWALL ViewPoint can generate reports for one or more SonicWALL
appliances.
Log Viewer—SonicWALL ViewPoint includes the Log Viewer to search the database for a specific firewall
activity type.
Top Usage Reports—SonicWALL ViewPoint includes a large range of reports that display the top sites, top
users, and top sites per user.
Concurrent login sessions—Multiple users and administrators can log into SonicWALL ViewPoint concurrently.
Syslog reporting—SonicWALL ViewPoint generates reports based on the stream of syslog data received from
each SonicWALL appliance.
Embedded MSDE database—SonicWALL ViewPoint installs MSDE database to store raw and summarized
syslog traffic from each SonicWALL appliance.
Supports Windows 2000 Professional and Windows XP Professional —SonicWALL ViewPoint software
can be installed on a Windows server that is located on the SonicWALL appliance’s LAN or WAN network.
Supports most SonicWALL Internet Security Appliances—SonicWALL ViewPoint supports 2nd and 3rd
generation SonicWALL appliances, including the new SonicWALL Wireless product.
SonicWALL firmware—SonicWALL ViewPoint supports SonicWALL appliances running firmware 6.3.1.4
and above and SonicWALL Wireless product running SonicOS 1.0 and above.
Introducing SonicWALL ViewPoint
11
12
SonicWALL ViewPoint User’s Guide
CHAPTER 2
Installing SonicWALL ViewPoint
This chapter describes how to install or upgrade SonicWALL ViewPoint.
To install SonicWALL ViewPoint, complete the following procedures:
•
•
•
Review the installation requirements. See “Installation Overview” on page 14.
Install SonicWALL ViewPoint, see “Installation” on page 15.
Register SonicWALL ViewPoint, see “Installation” on page 15.
Installing SonicWALL ViewPoint
13
Installation Overview
In order to install and run SonicWALL ViewPoint, you must be logged in as the administrator and the SonicWALL
ViewPoint server must meet the following requirements:
• Windows 2000 or Windows XP Professional.
• If accessed from the WAN interface, the SonicWALL appliance must have a static IP address. Otherwise, it may
have either a static or dynamic IP address.
• Local and remote browser access: Microsoft Internet Explorer 6.x.
• 750 MHz or faster processor.
• Minimum 512 MB RAM.
• At least 85 MB of free disk space.
14
SonicWALL ViewPoint User’s Guide
Installation
When you are ready to install SonicWALL ViewPoint, follow these steps:
1. Log on to the computer as administrator.
2. Insert the SonicWALL ViewPoint CD-ROM or locate the SonicWALL ViewPoint install file on the network.
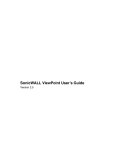
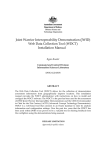
Double-click the setup.exe. The Introduction screen appears (Figure 1).
Figure 1: Introduction Screen
3. Click Next. The License Agreement screen appears (Figure 2).
Figure 2: License Agreement Screen
4. Select from the following:
To accept the terms of the license agreement, select I accept the terms of the License Agreement and
click Next. The Choose Install Folder screen appears (Figure 3).
• To not accept the terms, select I do NOT accept the terms of the License Agreement and click Next. The
SonicWALL ViewPoint installation program closes and the product will not install.
•
Installing SonicWALL ViewPoint
15
Figure 3: Choose Install Folder Screen
5. To accept the default location, click Next. To select a different location, click Choose and select a folder. Click
Next.
The Settings screen appears (Figure 4).
Figure 4: Settings Screen
Do the following:
• Enter the IP address or host name of the Simple Mail Transfer Protocol (SMTP) server in the SMTP Server
Address field.
• Enter the number of the web server port in the Web Server Port field (default: 80).
• Enter the e-mail addresses of administrators who will receive e-mail notifications from SonicWALL ViewPoint.
• Enter and confirm the database password in the Database Password and Confirm Password fields.
• To configure SonicWALL ViewPoint to validate these settings, select the Validate fields on this screen
check box.
Click Install. The installation program begins copying SonicWALL ViewPoint files.
6. After the files are copied, restart the server. Installation is complete.
16
SonicWALL ViewPoint User’s Guide
Logging in and out of SonicWALL ViewPoint
To start and log into SonicWALL ViewPoint, follow these steps:
1. Do one of the following:
• If you are logging in locally, double-click the SonicWALL ViewPoint icon on your desktop.
• If you are logging in from a remote location, open a web browser and enter http://viewpoint_ipaddress/sgms/
login or http://viewpoint_ipaddress or http://localhost .
The SonicWALL ViewPoint login page appears.
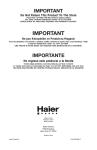
Figure 5: SonicWALL ViewPoint Login Page
2. Enter the SonicWALL ViewPoint user ID (default: admin) and password (default: password).
Note: After the password is entered, an authenticated management session is established that times out after 5 minutes of inactivity. The default time-out can be changed from the General/ViewPoint Password page on the Console
Panel.
For the security purposes, it is highly recommended to change the default password for the user admin. The maximum size of the SonicWALL ViewPoint User ID is 24 alphanumeric characters. If the password is more than 32
characters long, it will automatically be truncated.
3. Click Submit. The SonicWALL ViewPoint UI opens.
4. To logout, click the Logout button in the SonicWALL ViewPoint UI.
Installing SonicWALL ViewPoint
17
Registering SonicWALL ViewPoint
To register SonicWALL ViewPoint, follow these steps:
• Create a mysonicwall.com account—see “Creating a mysonicwall.com Account” on page 18.
• Register the SonicWALL appliance—see “Registering the SonicWALL Appliance” on page 18.
• Activate the ViewPoint Software—see “Activating the ViewPoint Software” on page 18.
• Enable the ViewPoint license on the SonicWALL appliance—see “Enabling the ViewPoint License on the SonicWALL Appliance” on page 19.
Creating a mysonicwall.com Account
If you do not already have a mysonicwall.com account, open a web browser and navigate to the following website:
http://www.mysonicwall.com
Then, follow the on-screen prompts to create a user account.
Registering the SonicWALL Appliance
To register the SonicWALL appliance, follow these steps:
1. Log on to mysonicwall.com.
2. Click My Products. The SonicWALL Product Registration page appears.
Figure 6: mysonicwall.com Welcome Page
3. Enter your SonicWALL serial number in the Serial Number field.
4. If you are registering a SonicWALL SOHO TZW, enter the authentication code in the Authentication Code
field.
5. Enter a descriptive name for the SonicWALL appliance in the Friendly Name field.
6. Click Register. The mysonicwall.com website registers the SonicWALL appliance.
Activating the ViewPoint Software
To activate the SonicWALL ViewPoint software, follow these steps:
1. Log on to mysonicwall.com.
18
SonicWALL ViewPoint User’s Guide
2. Click the label of the newly registered SonicWALL appliance. The Service Management page appears.
Figure 7: Service Management Page
3. Locate the ViewPoint service and click its Activate button. The Activate Service dialog box appears.
4. Enter the ViewPoint Activation Key in the Activation Key field. The ViewPoint Activation Key is printed on
the ViewPoint Software License Certificate shipped with the ViewPoint package.
5. Click Submit. After the Activation Key is registered, a ViewPoint License Key will appear. Carefully write
down the ViewPoint License Key in a safe place.
Enabling the ViewPoint License on the SonicWALL Appliance
To enable the SonicWALL ViewPoint license, follow these steps:
1. Log into the SonicWALL appliance.
2. Expand the Log tree and click ViewPoint. The ViewPoint page appears.
3. Enter the ViewPoint License Key provided by mysonicwall.com in the Enter Upgrade Key field.
4. Click Apply.
5. Restart the SonicWALL for the change to take effect.
Installing SonicWALL ViewPoint
19
20
SonicWALL ViewPoint User’s Guide
CHAPTER 3
Configuring ViewPoint
This chapter describes configure SonicWALL ViewPoint. Select from the following:
•
•
•
•
•
•
•
•
•
To configure a SonicWALL appliance for SonicWALL ViewPoint, see “Configuring a SonicWALL Appliance
for SonicWALL ViewPoint” on page 22.
To configure access settings, see “Configuring Access to a SonicWALL Appliance” on page 23.
To add a SonicWALL appliance to SonicWALL ViewPoint, see “Adding a SonicWALL Appliance to SonicWALL ViewPoint” on page 26.
To delete a SonicWALL appliance from SonicWALL ViewPoint, see “Deleting SonicWALL Appliances from
SonicWALL ViewPoint” on page 27.
To modify a SonicWALL appliance’s settings, see “Modifying Settings for a SonicWALL Appliance” on
page 28.
To change the SonicWALL ViewPoint password, see “Changing ViewPoint Login Password” on page 29.
To configure ViewPoint settings, see “Configuring General ViewPoint Settings” on page 31.
To manage ViewPoint sessions, see “Managing ViewPoint Sessions” on page 32.
To configure reporting settings, see “Configuring Reporting Settings” on page 35.
Configuring ViewPoint
21
Configuring a SonicWALL Appliance for SonicWALL
ViewPoint
The following instructions describe how to configure a SonicWALL appliance to send data to SonicWALL ViewPoint.
1. Log into the SonicWALL appliance.
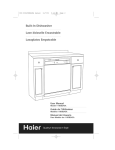
2. Expand the Log tree and click Log Settings. The Log Settings page appears (Figure 8).
Figure 8: Log Settings Page
3. Enter the IP address and port (default: 514) of the SonicWALL ViewPoint server in the Add Syslog Server
fields.
4. Enter 0 in the Syslog Individual Event Rate field.
The Syslog Individual Event Rate field reduces the number of repetitive events that are logged by SonicWALL
ViewPoint. Although this prevents a log file from being full of repetitive events, setting the Syslog Individual
Event Rate field to anything other than 0 will result in inaccurate ViewPoint reports.
5. Select Default from the Syslog Format list box.
6. To ensure accurate and complete reporting, make sure that every event category in the Categories area is
selected except for Network Debug.
7. When you are finished, click Update.
If the SonicWALL appliance is running SonicOS, follow these steps:
1. Log into the SonicWALL appliance.
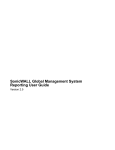
2. Expand the Log tree and click Automation. The Automation page appears (Figure 9).
22
SonicWALL ViewPoint User’s Guide
Figure 9: Automation Page
3. Enter 0 in the Syslog Individual Event Rate field.
The Syslog Individual Event Rate field reduces the number of repetitive events that are logged by SonicWALL
ViewPoint. Although this prevents a log file from being full of repetitive events, setting the Syslog Individual
Event Rate field to anything other than 0 will result in inaccurate ViewPoint reports.
4. Select Default from the Syslog Format list box.
5. Click Add in the Server Name section and enter the IP address and port (default: 514) of the SonicWALL
ViewPoint server in the Add Syslog Server fields. Then, click OK.
6. To ensure accurate and complete reporting, click Categories and make sure that every event category in the
Categories area is selected except for Network Debug. Then, click Apply.
7. When you are finished, click Apply.
Configuring Access to a SonicWALL Appliance
In order to use SonicWall ViewPoint, the SonicWALL appliance must be configured to communicate with SonicWALL ViewPoint and the appliance must be added to the SonicWALL ViewPoint UI.
SonicWALL ViewPoint can access the appliance through the LAN or WAN interface. If the access will occur
through the LAN interface, SonicWALL ViewPoint can log into the SonicWALL appliance using HTTP or HTTPS,
which are enabled by default. If the access will occur through the WAN interface, the SonicWALL appliance must
be configured to allow remote access. To configure remote access through the WAN interface, follow these steps:
1. Log into the SonicWALL.
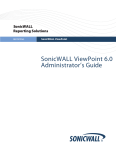
2. Expand the Access tree, and click Management. The Management page appears (Figure 10).
Configuring ViewPoint
23
Figure 10: Management Page
3. From the Management Method section, select from the LAN interface and remotely from the WAN interface
from the Managed pull-down menu.
4. Click Update.
5. Click the Add Service tab. The Add Service page appears (Figure 11).
Figure 11: Add Service Page
6. Select HTTPS Management from the Add a Known service list and click Add.
7. Click the Rules tab. The Rules page appears (Figure 12).
24
SonicWALL ViewPoint User’s Guide
Figure 12: Rules Page
8. Click Add New Rule. The Add Network Access Rule dialog box appears (Figure 13).
Figure 13: Add Network Access Rule Dialog Box
9. Create a rule that allows SonicWALL ViewPoint to access your SonicWALL appliance using HTTPS (HTTPS
Management service) from the WAN and click Update. The rule is added.
Note: If your SonicWALL ViewPoint server is behind a firewall, you need to ensure the syslog traffic can reach the
SonicWALL ViewPoint server. To do this, add the IP address of the firewall as the syslog server in your SonicWALL
appliance, and provide a rule in the firewall to allow syslog traffic from your SonicWALL appliance to the SonicWALL ViewPoint server.
Note: If SonicWALL ViewPoint is located on the WAN side of your SonicWALL appliance and behind a firewall and
there is a VPN tunnel between your SonicWALL appliance and the firewall, SonicWALL ViewPoint can access the
SonicWALL appliance using HTTPS or HTTP over the VPN tunnel.
Configuring ViewPoint
25
Adding a SonicWALL Appliance to SonicWALL ViewPoint
This section describes how to add a SonicWALL appliance to SonicWALL ViewPoint. To add a SonicWALL appliance, follow these steps:
1. Start and log into SonicWALL ViewPoint. The Status page appears (Figure 14).
Figure 14: Status Page
2. Right-click in the left pane of the SonicWALL ViewPoint UI and select Add Unit from the pop-up menu. The
Add Unit dialog box appears (Figure 15).
Figure 15: Add Unit Dialog Box
3. Enter a descriptive name for your SonicWALL appliance in the SonicWALL Name field.
Note: Do not enter the single quote character (') in the SonicWALL Name field.
4. Enter the username used to access your SonicWALL appliance in the SonicWALL Login Name field (default:
admin).
5. Enter the password used to access the SonicWALL appliance in the SonicWALL Password field.
6. Enter the IP address that will be used to access the SonicWALL appliance in the SonicWALL IP Address field.
Note: If SonicWALL ViewPoint is on the same LAN as the SonicWALL appliance or accesses it through a VPN
tunnel, enter the LAN IP address. If SonicWALL ViewPoint will access the SonicWALL appliance from the WAN
interface, enter the WAN IP address.
26
SonicWALL ViewPoint User’s Guide
7. Enter the HTTP port number used to access your SonicWALL appliance in the SonicWALL HTTP Port field
(default: 80).
8. If SonicWALL ViewPoint will log into the SonicWALL appliance using secure HTTP (HTTPS), select the
Enable HTTPS Management check box and enter the HTTPS port number in the SonicWALL HTTPS Port
field (default: 443).
9. Enter the serial number of the SonicWALL appliance in the Serial Number field.
10. Click OK. SonicWALL ViewPoint finds the SonicWALL appliance and validates its ViewPoint license. When
this is complete, the SonicWALL appliance will appear in the left pane of the SonicWALL ViewPoint UI.
Deleting SonicWALL Appliances from SonicWALL ViewPoint
To delete a SonicWALL appliance from SonicWALL ViewPoint, follow these steps:
1. Start and log into SonicWALL ViewPoint. The Status page appears (Figure 16).
Figure 16: Status Page
2. Select a unit in the left pane of the SonicWALL ViewPoint UI.
3. Right-click the unit and select Delete Unit from the pop-up menu. You are prompted to confirm the deletion.
4. Click Yes. The SonicWALL appliance disappears from the left pane of the SonicWALL ViewPoint UI and will
be deleted from the ViewPoint database.
Configuring ViewPoint
27
Modifying Settings for a SonicWALL Appliance
To change the settings of a SonicWALL appliance, whether you are changing the IP address, password, or other settings, follow these steps:
1. Start and log into SonicWALL ViewPoint. The Status page appears (Figure 17).
Figure 17: Status Page
2. Select a unit in the left pane of the SonicWALL ViewPoint UI.
3. Right-click on the unit and select Modify Unit from the pop-up menu. The Modify Unit dialog box appears
(Figure 18).
Figure 18: Modify Unit Dialog Box
4. Make changes to any of the fields.When you are finished, click OK. After SonicWALL ViewPoint finds the
SonicWALL appliance and validates its ViewPoint license, the SonicWALL appliance will re-appear in the left
pane of the SonicWALL ViewPoint UI.
28
SonicWALL ViewPoint User’s Guide
Configuring User Settings
This section describes how to configure user settings.
Changing ViewPoint Login Password
To modify the login password for SonicWALL ViewPoint, follow these steps.
1. Start and log into SonicWALL ViewPoint.
2. Click the Console Panel tab at the bottom of the SonicWALL ViewPoint UI.
3. Expand the User Settings tree and click General. The General page appears.
Figure 19: Status Page
4. Enter the current ViewPoint password in the Old ViewPoint Password field.
5. Enter the new ViewPoint password in the New ViewPoint Password field.
6. Reenter the new ViewPoint password in the Confirm ViewPoint Password field.
7. The ViewPoint Inactivity Timeout period specifies how long SonicWALL ViewPoint waits before logging out
an inactive user. To prevent someone from accessing the SonicWALL ViewPoint UI when SonicWALL ViewPoint users are away from their desks, enter an appropriate value in the ViewPoint Inactivity Timeout field
(default: 5 minutes).
Note: This field can be set to a maximum of 32767 minutes.
8. When you are finished, click Update. The password is changed. To clear all screen settings and start over, click
Reset.
Note: The maximum size of the SonicWALL ViewPoint User ID is 24 alphanumeric characters. The password is
one-way hashed and any password of any length can be hashed into a fixed 32 character long internal password.
Configuring Presentation Options
SonicWALL Viewpoint uses a default group of settings that specifies the types of charts and the amount of data that
is displayed. This settings can be changed during a session, but will be cleared once you log out.
To change the default settings for your user ID, follow these steps:
1. Start and log into SonicWALL ViewPoint as the user whose default settings you will modify.
Configuring ViewPoint
29
2. Click the Console tab.
3. Expand the User Settings tree and click Report Settings. The Report Settings page appears (Figure 20).
Figure 20: Report Settings Page
4. Select whether the reports will contain a chart and table or table only.
5. Select whether Summary and Over Time charts will be displayed as bar graphs or plots from the Summary/
Over Time Charts list box (default: BAR).
6. Select whether User charts will be displayed as pie charts, bar graphs, area charts, or plots from the User Based
Charts list box (default: PIE).
7. Select the number of sites to display in Top Sites reports (default: 10).
8. Select the number of users to display in Top Users reports (default: 10).
9. Select the number of sites to display in Sites by User reports (default: 5).
10. Select the number of items to display in all other reports (default: 10).
11. Select the number of entries per item to display in all other reports (default: 10).
12. To only display data for a specified group of web sites, enter the URL of each site (separated by commas) in the
Site List field. Because this field uses pattern matching, entries such as “yahoo.com” will display data for
mail.yahoo.com, shopping.yahoo.com, and so on.
13. To only display data for a specified group of users, enter the username of each user (separated by commas) in
the User List field. Because this field uses pattern matching, entries such as “john” will display data for johnm,
123john, and so on.
14. To configure the default start and end times for hourly reports, select a start and end time from the Start and
End list boxes.
15. To specify a list of web sites that will be excluded from the reports, enter a string that specifies a URL or portion of a URL to exclude from the reports. For example:
www.yahoo.com
ebay.com
netscape
...
Click Add. Any web site that contains a portion of the string that you specified will be excluded from the
report.
Repeat this step for each web site to exclude.
30
SonicWALL ViewPoint User’s Guide
Configuring Management Settings
This section describes how to configure management settings.
Configuring General ViewPoint Settings
To modify the SonicWALL ViewPoint settings, follow these steps:
1. Start and log into SonicWALL ViewPoint.
2. Click the Console Panel tab at the bottom of the SonicWALL ViewPoint UI.
3. Expand the Management tree and click ViewPoint Settings. The ViewPoint Settings page appears (Figure 21).
Figure 21: ViewPoint Settings Page
4. Enter the IP address of the Simple Mail Transfer Protocol (SMTP) server in the SMTP Server Address field.
5. Enter the sender's email address that will appear in messages sent from the SonicWALL ViewPoint in the ViewPoint Sender's e-Mail Address field.
6. Select the amount of debug information that is stored from the System Debug Level field. For no debugging,
enter 0. For verbose debugging, enter 3.
7. When you are finished, click Update. The ViewPoint settings are changed. To clear the screen settings and start
over, click Reset.
Configuring Alert Settings
The Alert Settings page specifies which email addresses receive alerts notifications during specific times.
To configure the alert notification settings, follow these steps:
1. Start and log into SonicWALL ViewPoint.
2. Click the Console Panel tab at the bottom of the SonicWALL ViewPoint user interface (UI).
3. Expand the Management tree and click Alert Settings. The Alert Settings page appears (Figure 22).
Configuring ViewPoint
31
Figure 22: SonicWALL ViewPoint Alert Settings Page
4. Configure the email address(es) that will receive notifications and the times that they will receive them:
•
•
•
•
•
Schedule 1—Specifies who will receive notifications during the first weekday schedule. Enter one or more
email addresses (separated by commas) and specify the start and end time for the shift.
Schedule 2—Specifies who will receive notifications during the second weekday schedule. Enter one or
more email addresses (separated by commas) and specify the start and end time for the shift.
Schedule 3—Specifies who will receive notifications during the third weekday schedule. Enter one or more
email addresses (separated by commas) and specify the start and end time for the shift.
Saturday—Specifies who will receive notifications on Saturday. Enter one or more email addresses (separated by commas) and specify the start and end time for the shift.
Saturday—Specifies who will receive notifications on Sunday. Enter one or more email addresses (separated by commas) and specify the start and end time for the shift.
5. Select whether the email will be sent in HTML or Plain Text.
6. When you are finished, click Update. The settings are saved.
Managing ViewPoint Sessions
To manage SonicWALL ViewPoint login sessions, follow these steps:
1. Start and log into SonicWALL ViewPoint.
2. Click the Console Panel tab at the bottom of the SonicWALL ViewPoint user interface (UI).
3. Expand the Management tree and click Sessions. The Sessions page appears (Figure 23).
32
SonicWALL ViewPoint User’s Guide
Figure 23: Sessions Page
4. Select the check box of each user to log off and click End selected sessions. The selected users are logged off.
Configuring Email/Alert Setting Notifications
The email/Alert Settings page specifies which email addresses receive email alerts and FYI messages during specific times.
To configure the alert notification settings, follow these steps:
1. Start and log into SonicWALL ViewPoint.
2. Click the Console Panel tab at the bottom of the SonicWALL ViewPoint user interface (UI).
3. Expand the Management tree and click email/Alert Settings. The email/Alert Settings page appears
(Figure 24).
Configuring ViewPoint
33
Figure 24: SonicWALL ViewPoint Alert Settings Page
4. Configure the email address(es) that will receive notifications and the times that they will receive them:
•
•
•
•
•
Schedule 1—Specifies who will receive notifications during the first weekday schedule. Enter one or more
email addresses (separated by commas) and specify the start and end time for the shift.
Schedule 2—Specifies who will receive notifications during the second weekday schedule. Enter one or
more email addresses (separated by commas) and specify the start and end time for the shift.
Schedule 3—Specifies who will receive notifications during the third weekday schedule. Enter one or more
email addresses (separated by commas) and specify the start and end time for the shift.
Saturday—Specifies who will receive notifications on Saturday. Enter one or more email addresses (separated by commas) and specify the start and end time for the shift.
Saturday—Specifies who will receive notifications on Sunday. Enter one or more email addresses (separated by commas) and specify the start and end time for the shift.
5. Select whether the email will be sent in HTML or Plain Text.
6. When you are finished, click Update. The settings are saved.
34
SonicWALL ViewPoint User’s Guide
Configuring Reporting Settings
This section describes how to configure reporting settings. These include how often the summary information is
updated, the number of days that summary information is stored, and the number of days that raw data is stored.
These reports are constructed from the most current available summary data. In order to create summary data, SonicWALL ViewPoint must parse the raw data files.
Note: Because reports are based on the most current summary data, the report may be old. For example, if the data
was summarized four hours ago, all activity that occurred since the last summary will be missing from the report.
When configuring SonicWALL ViewPoint, you can select the amount of summary information to store. Summary
information consumes approximately one kilobyte of information per SonicWALL appliance per day. Make sure
the database is large enough to accommodate the number of days that you choose.
Additionally, you can select the amount of raw data to store. The raw data is made up of information for every connection. Depending on the amount of traffic, this can quickly consume an enormous amount of space in the database. Be very careful when selecting how much raw information to store.
Configuring Log Viewer Settings
To configure Log Viewer settings, follow these steps:
1. Start and log into SonicWALL ViewPoint.
2. Click the Console tab.
3. Select a SonicWALL appliance.
4. Expand the Reports tree and click Log Viewer Settings. The Log Viewer Settings page appears (Figure 25).
Figure 25: Log Viewer Settings Page
5. Specify how many days of raw data SonicWALL ViewPoint will store in the database from the Days To Store
Raw Data list box and click Submit. To save all information, enter All.
6. To save the changes, click Submit.
General Report Settings
To configure SonicWALL ViewPoint settings, follow these steps:
1. Start and log into SonicWALL ViewPoint.
Configuring ViewPoint
35
2. Click the Console tab.
3. Select a SonicWALL appliance.
4. Expand the Reports tree and click Summarizer. The Summarizer page appears (Figure 26).
Figure 26: Summarizer Page
5. For improved scalability, reporting summarization can be distributed among the Agents. To enable distributed
summarization, select the Enable Distributed Summarizer check box.
6. Specify how often SonicWALL ViewPoint processes and updates summary information from the Time
Between Summaries list box and click Update.
7. To specify the next summary time, enter a date and time in the Next Scheduled Summary Time field and click
Update.
8. To update the summary information now, click Summarize Data Immediately. SonicWALL ViewPoint will
automatically process the latest information and make it available for immediate viewing.
Note: This will not affect the normally scheduled updates.
9. Configure the following report setting defaults:
Select the default number of sites that will be displayed in Top Sites reports from the Number of Top Sites
list box.
• Select the default number of users that will be displayed in Top Users reports from the Number of Top
Users list box.
• Select the default number of sites that will be displayed in Top Sites Per User reports from the Number of
Top Sites Per User list box.
•
10. Specify how many days of summarized data the SonicWALL ViewPoint will store in the database from the
Days To Store Summarized Data list box and click Submit. To save all information, enter All.
Summarized data consumes approximately one kilobyte of information per SonicWALL appliance per day.
Make sure the database is large enough to accommodate the number of days that you choose.
11. The Summary Data Available Until field displays when the data was last summarized. To re-summarize any
data, enter a date and time and click Update.
Adding a Service
SonicWALL ViewPoint can monitor known services or custom services.
To add a service that will be displayed in the services reports, follow these steps.
36
SonicWALL ViewPoint User’s Guide
1. Start and log into SonicWALL ViewPoint.
2. Click the Reports tab.
3. Expand the Reports tree and click Services. The Services page appears (Figure 27).
Figure 27: Services Page
4. To add a known service, select it from the Known Services list box and click Add.
5. To add a custom service, enter a name in the Name field, enter the service’s port range, and select the protocol
that it uses from the Protocol list box. Click Add.
6. To delete a service, select it and click Delete.
Configuring Email/Archive Settings
To configure Email/Archive and web server settings, follow these steps:
1. Start and log into SonicWALL ViewPoint.
2. Click the Console tab.
3. Expand the Reports tree and click Email/Archive. The Email/Archive page appears (Figure 28).
Configuring ViewPoint
37
Figure 28: Email/Archive Page
4. This page shows when the next scheduled archive time will occur and when the last weekly and monthly
reports were sent.
5. To set the next archive time, enter the date and time in the Next Scheduled Email/Archive Time fields and
click Update.
6. To change the timestamp of the last weekly report, enter the date and time in the Weekly Reports Last Sent
fields and click Update.
7. To change the timestamp of the last monthly report, enter the date and time in the Monthly Reports Last Sent
fields and click Update.
8. If the web server address, port, or protocol has changed since installation, this will affect reporting and you
should enter the new address, port, and protocol in the Current Web Server Configuration section.
9. When you are finished, click Update. The changes are saved.
38
SonicWALL ViewPoint User’s Guide
CHAPTER 4
Viewing Reports
This chapter describes how to generate reports using SonicWALL ViewPoint.
Select from the following reports:
•
•
•
•
•
•
•
•
•
•
•
•
To view status reports, see “Viewing Status Reports” on page 39.
To view general bandwidth usage reports, see “Viewing Bandwidth Reports” on page 42.
To view bandwidth reports, by service, see “Viewing Service Usage Reports” on page 50.
To view web usage bandwidth reports, see “Viewing Web Usage Reports” on page 54.
To view reports on the number of attempts that users made to access blocked web sites, see “Viewing Web Filter Reports” on page 69.
To view file transfer protocol (FTP) bandwidth usage reports, see “Viewing File Transfer Protocol Reports” on
page 82.
To view mail bandwidth usage reports, see “Viewing Mail Usage Reports” on page 89.
To view virtual private networking (VPN) reports, see “Viewing VPN Usage Reports” on page 96.
To view reports on attempted attacks, see “Viewing Attack Reports” on page 109.
To view reports on intrusion prevention, see “Viewing Intrusion Prevention Reports” on page 122.
To view detailed logging information, see “Viewing the Log” on page 141.
To view user and administrator authentication reports, see “Viewing Authentication Reports” on page 136.
Viewing Status Reports
Status reports display the number of hours that one or more SonicWALL appliances were online and functional during the time period.
From this information, you can determine find trouble spots within your network. For example, this report could
reveal that a SonicWALL appliance that is having network connectivity issues caused by the ISP.
Note: All reports appear in the Firewall’s time zone.
Select from the following:
•
•
To view a status summary, see “Viewing the Status Summary Report” on page 39.
To view bandwidth usage over a period of time, see “Viewing Bandwidth Usage Over Time” on page 46.
Viewing the Status Summary Report
The Status Summary report contains information on the amount of status of a SonicWALL appliance or group of
Status appliances during each hour of the specified day.
To view the Status Summary report, follow these steps:
1. Start and log into SonicWALL ViewPoint.
2. Click the Reports tab.
3. Select the global icon, a group, or a SonicWALL appliance.
4. Expand the Status tree and click Summary. The Summary page appears (Figure 29).
Viewing Reports
39
Figure 29: Summary Page
5. The bar graph displays the amount of time the SonicWALL appliance(s) were online and functional during each
hour of the day.
6. The table contains the following information:
•
•
Hour—when the sample was taken.
Up Time—number of minutes during the hour that the SonicWALL appliance was “Up.”
7. SonicWALL ViewPoint shows today’s report. To change the date of the report and other settings, click Settings. The Report Settings dialog box appears (Figure 34).
Figure 30: Report Settings Dialog Box
8. Select the type of chart to display from the View Settings area.
9. Select the year, month, and day that you would like to view from the Select Report Date area.
10. When you are finished, click Close. The SonicWALL ViewPoint displays the report for the selected day.
Note: These settings will stay in effect for all similar reports during your active login session.
40
SonicWALL ViewPoint User’s Guide
Viewing Status Over Time
The Status Over Time report displays the how often the SonicWALL appliance or a group of SonicWALL appliances was available during the specified time period.
To view the Status Over Time report, follow these steps:
1. Start and log into SonicWALL ViewPoint.
2. Click the Reports tab.
3. Select the global icon, a group, or a SonicWALL appliance.
4. Expand the Status tree and click Over Time. The Over Time page appears (Figure 31).
Figure 31: Over Time Page
5. The bar graph displays the amount of time the SonicWALL appliance(s) were available during each day of the
specified time period.
6. The table contains the following information:
•
•
Date—when the sample was taken.
Up Time—amount of time (in hours) that the SonicWALL appliance was “Up.”
7. To change the date range of the report, click Settings. The Reporting Date Range Selector dialog box appears.
Viewing Reports
41
Figure 32: Report Settings Dialog Box
8. Select whether to display a chart and table or a table only.
9. Select from the following:
•
•
To select a period of time before the last summarization, enter the number of days to view before the last
summarization.
To view a specific date range, select the starting and ending dates that you would like to view.
10. When you are finished, click Close. SonicWALL ViewPoint displays the report for the selected date range.
Note: These settings will stay in effect for all similar reports during your active login session.
Viewing Bandwidth Reports
Bandwidth reports display the amount of data transferred through one or more selected SonicWALL appliances.
Bandwidth reports are an ideal starting point for viewing overall bandwidth usage. You can view bandwidth usage
view by the hour, day, or over a period of days. Additionally, you can view the top users of bandwidth.
From this information, you can determine network strategies. For example, if you need more bandwidth, you might
need to upgrade network equipment, or you might simply need to curtail the bandwidth usage of a few employees.
Note: All reports appear in the Firewall’s time zone.
Select from the following:
•
•
•
•
•
To view a summary of the daily bandwidth usage, see “Viewing the Bandwidth Summary Report” on page 42.
To view bandwidth usage in real time, see “Monitoring Bandwidth Usage in Real Time” on page 44.
To view the users who consume the most bandwidth, see “Viewing the Top Users of Bandwidth” on page 44.
To view bandwidth usage over a period of time, see “Viewing Bandwidth Usage Over Time” on page 46.
To view the users who consume the most bandwidth over time, see “Viewing the Top Users of Bandwidth Over
Time” on page 48.
Viewing the Bandwidth Summary Report
The Bandwidth Summary report contains information on the amount of traffic handled by a SonicWALL appliance
or group of SonicWALL appliances during each hour of the specified day.
To view the Bandwidth Summary report, follow these steps:
1. Start and log into SonicWALL ViewPoint.
2. Click the Reports tab.
3. Select the global icon, a group, or a SonicWALL appliance.
4. Expand the Bandwidth tree and click Summary. The Summary page appears (Figure 33).
42
SonicWALL ViewPoint User’s Guide
Figure 33: Summary Page
5. The bar graph displays the amount of bandwidth transferred during each hour of the day.
6. The table contains the following information:
•
•
•
•
Hour—when the sample was taken.
Events—number of events or “hits.”
MBytes—number of megabytes transferred.
% of MBytes—percentage of megabytes transferred during this hour, compared to the day. For example, if
1000 megabytes of data was transferred during the day and 100 megabytes was transferred at the 12:00
time period, the % of MBytes field will display 10%.
7. SonicWALL ViewPoint shows today’s report. To change the date of the report and other settings, click Settings. The Report Settings dialog box appears (Figure 34).
Figure 34: Report Settings Dialog Box
8. Select the type of chart to display from the View Settings area.
Viewing Reports
43
9. Select the year, month, and day that you would like to view from the Select Report Date area.
10. Select the Source and Destination interfaces to view. If you want to track bandwidth usage in both directions,
select the Bi-directional check box.
11. When you are finished, click Generate Report. SonicWALL ViewPoint displays the report for the selected
day.
Note: These settings will stay in effect for all similar reports during your active login session.
Monitoring Bandwidth Usage in Real Time
The Bandwidth Monitor displays bandwidth usage for the selected SonicWALL appliance in real time.
To view the Bandwidth Monitor, follow these steps:
1. Start and log into SonicWALL ViewPoint.
2. Click the Reports tab.
3. Select a SonicWALL appliance.
4. Expand the Bandwidth tree and click Monitor. The Monitor page appears (Figure 35).
Figure 35: Monitor Page
5. The Bandwidth Monitor shows the amount of data transferred during each sampling period for the last five
minutes. The sampling period is five seconds.
Viewing the Top Users of Bandwidth
The Top Users report displays the users who used the most bandwidth on the specified date.
To view the Top Users report, follow these steps:
1. Start and log into SonicWALL ViewPoint.
2. Click the Reports tab.
3. Select a SonicWALL appliance.
4. Expand the Bandwidth tree and click Top Users. The Top Users page appears (Figure 36).
44
SonicWALL ViewPoint User’s Guide
Figure 36: Top Users Page
5. The pie chart displays the percentage of bandwidth transferred by each user.
6. The table contains the following information:
•
•
•
•
Users—the IP address of the user.
Connections—number of events or “hits.”
MBytes—number of megabytes.
% of MBytes—percentage of megabytes transferred by this user, compared to all users. For example, if
1000 megabytes of data was transferred during the day and 200 megabytes was transferred by the top user,
the % of MBytes field will display 20%.
7. By default, SonicWALL ViewPoint shows today’s report, a pie chart, and the ten top users. To change these settings, click Settings. The Report Settings dialog box appears.
Viewing Reports
45
Figure 37: Report Settings Dialog Box
8. Select the number of users that will be displayed from the Number of Users list box.
9. Select the type of chart from the Chart Type list box.
10. Select the year, month, and day that you would like to view.
11. To display a limited group of users, enter the user IDs in the Select Users field and separate each entry with a
comma.
Note: This field does not use pattern matching. For example, “john” will not match john_smith, john42, or
big_john.
12. When you are finished, click Close. SonicWALL ViewPoint displays the report for the selected day.
Note: These settings will stay in effect for all similar reports during your active login session.
Viewing Bandwidth Usage Over Time
The Bandwidth Over Time report displays the daily amount of traffic handled by a SonicWALL appliance or a
group of SonicWALL appliances for the specified time period.
To view the Bandwidth Over Time report, follow these steps:
1. Start and log into SonicWALL ViewPoint.
2. Click the Reports tab.
3. Select the global icon, a group, or a SonicWALL appliance.
4. Expand the Bandwidth tree and click Over Time. The Over Time page appears (Figure 38).
46
SonicWALL ViewPoint User’s Guide
Figure 38: Over Time Page
5. The bar graph displays the amount of bandwidth transferred during each day of the specified time period.
6. The table contains the following information:
•
•
•
•
Date—when the sample was taken.
Connections—number of hits.
MBytes—number of megabytes transferred.
% of Usage—percentage of megabytes transferred during this day, compared to the time period. For example, if 100,000 megabytes of data was transferred during the time period and 25,000 megabytes was transferred on one day, the % of Usage field will display 25%.
7. To change the date range of the report, click Settings. The Reporting Date Range Selector dialog box appears.
Figure 39: Report Settings Dialog Box
8. Select whether to display a chart and table or a table only.
Viewing Reports
47
9. Select from the following:
•
•
To select a period of time before the last summarization, enter the number of days to view before the last
summarization.
To view a specific date range, select the starting and ending dates that you would like to view.
10. When you are finished, click Close. SonicWALL ViewPoint displays the report for the selected date range.
Note: These settings will stay in effect for all similar reports during your active login session.
Viewing the Top Users of Bandwidth Over Time
The Top Users report displays the users who used the most bandwidth on the specified date.
To view the Top Users Over Time report, follow these steps:
1. Start and log into SonicWALL ViewPoint.
2. Click the Reports tab.
3. Select a SonicWALL appliance.
4. Expand the Bandwidth tree and click Top Users Over Time. The Top Users Over Time page appears
(Figure 40).
Figure 40: Top Users Over Time Page
5. The pie chart displays the percentage of bandwidth transferred by each user.
6. The table contains the following information:
• Users—the IP address of the user.
• Connections—number of events or “hits.”
• MBytes—number of megabytes.
• % of MBytes—percentage of megabytes transferred by this user, compared to all users. For example, if
1000 megabytes of data was transferred during this period and 200 megabytes was transferred by the top
user, the % of MBytes field will display 20%.
7. To change the date range of the report, click Settings. The Reporting Date Range Selector dialog box appears.
48
SonicWALL ViewPoint User’s Guide
Figure 41: Report Settings Dialog Box
8. Select whether to display a chart and table or a table only.
9. Select from the following:
• To select a period of time before the last summarization, enter the number of days to view before the last
summarization.
• To view a specific date range, select the starting and ending dates that you would like to view.
10. To display a limited group of users, enter the user IDs in the Select Users field and separate each entry with a
comma.
Note: This field does not use pattern matching. For example, “john” will not match john_smith, john42, or
big_john.
11. When you are finished, click Close. SonicWALL ViewPoint displays the report for the selected date range.
Note: These settings will stay in effect for all similar reports during your active login session.
Viewing Reports
49
Viewing Service Usage Reports
Service reports provide information on the amount of data transmitted through the selected SonicWALL appliance
by each service.
Service reports are useful for revealing inappropriate usage of bandwidth and can help determine network policies.
For example, if there is a large spike of bandwidth usage, you can determine whether this is caused by regular web
access, someone using FTP to transfer large files, an attempted Denial of Service (DoS) attack, or another service.
Note: All reports appear in the Firewall’s time zone.
SonicWALL ViewPoint can monitor known services as well as custom services. To add a service to monitor, see
“Adding a Service” on page 52.
Select from the following:
• To view service bandwidth usage in real time, see “Monitoring Service Usage in Real Time” on page 50.
• To view a summary of the daily service bandwidth usage, see “Viewing the Services Summary Report” on
page 51.
Note: You cannot view services reports from the global or group view.
Monitoring Service Usage in Real Time
The Services Monitor displays service usage for the selected SonicWALL appliance in real time.
To view the Service Monitor, follow these steps:
1. Start and log into SonicWALL ViewPoint.
2. Click the Reports tab.
3. Select a SonicWALL appliance.
4. Expand the Services tree and click Monitor. The Monitor page appears (Figure 42).
Figure 42: Monitor Page
5. The Services Monitor shows the amount of data transferred for each service during each sampling period for
the last five minutes. The sampling period is 15 seconds.
50
SonicWALL ViewPoint User’s Guide
Viewing the Services Summary Report
The Services Summary report displays the amount of traffic handled by each service during each hour of the specified day.
To view the Services Summary report, follow these steps:
1. Start and log into SonicWALL ViewPoint.
2. Click the Reports tab.
3. Select a SonicWALL appliance.
4. Expand the Services tree and click Summary. The Summary page appears (Figure 43).
Figure 43: Summary Page
5. The bar graph displays the amount of bandwidth used by each service during each hour of the day.
6. The table contains the following information:
• Protocol—the service.
• KBytes—number of kilobytes.
• Events—number of events or “hits.”
• % of Events—percentage of events transferred by this service on the selected day, compared to all other
services. For example, if 10,000 events occurred during the day and 9,000 of the events were handled by
the HTTP service, the % of Events field will display 90%.
7. SonicWALL ViewPoint shows today’s report. To change report settings, click Settings. The Report Settings
dialog box appears (Figure 44).
Viewing Reports
51
Figure 44: Report Settings Dialog Box
8. Select the type of chart to display from the View Settings area.
9. Select the year, month, and day that you would like to view.
10. When you are finished, click Close. SonicWALL ViewPoint displays the report for the selected day.
Note: These settings will stay in effect for all similar reports during your active login session.
Adding a Service
SonicWALL ViewPoint can monitor known services or custom services. To add a service that will be displayed in
all future service reports, follow these steps.
1. Start and log into SonicWALL ViewPoint.
2. Click the Console tab.
3. Expand the Reports tree and click Services. The Services page appears (Figure 45)
52
SonicWALL ViewPoint User’s Guide
Figure 45: .Services Page
4. To add a known service, select it from the Known Services list box and click Add.
5. To add a custom service, enter a name in the Name field, enter the service’s port range, and select the protocols
that it uses from the Protocol list box. Then, click Add.
6. To delete a service, select it and click Delete.
Viewing Reports
53
Viewing Web Usage Reports
Web usage reports provide information on the amount of web usage that occurs through the selected SonicWALL
appliance(s).
Web usage reports can be used to view web bandwidth usage by the hour, day, or over a period of days. Additionally, you can view the top users of web bandwidth and view the most visited sites.
Note: All reports appear in the Firewall’s time zone.
Select from the following:
• To view a summary of the daily web bandwidth usage, see “Viewing the Web Usage Summary Report” on
page 54.
• To view a list of the top visited sites, see “Viewing the Top Web Sites” on page 56.
• To view the users who consume the most web bandwidth, see “Viewing the Top Users of Web Bandwidth” on
page 57.
• To view the top sites visited by each user, see “Viewing Web Usage by User” on page 59.
• To view the top sites and the users who visited the sites, see “Viewing Web Usage by Site” on page 61.
• To view web bandwidth usage over a period of time, see “Viewing Web Usage Over Time” on page 62.
• To view a list of the top visited sites over time, see “Viewing Top Sites Over Time” on page 64.
• To view the users who consume the most web bandwidth over time, see “Viewing Top Users Over Time” on
page 65.
• To view the sites that consume the most web bandwidth over time, see “Viewing Top Sites Over Time” on
page 64.
• To view the top sites visited by each user over time, see “Viewing Bandwidth Usage By User Over Time” on
page 67.
Viewing the Web Usage Summary Report
The Web Usage Summary report contains information on the amount of HTTP bandwidth handled by a
SonicWALL appliance or group of SonicWALL appliances during each hour of the specified day.
To view the Web Usage Summary report, follow these steps:
1. Start and log into SonicWALL ViewPoint.
2. Click the Reports tab.
3. Select the global icon, a group, or a SonicWALL appliance.
4. Expand the Web Usage tree and click Summary. The Summary page appears (Figure 46).
54
SonicWALL ViewPoint User’s Guide
Figure 46: Summary Page
5. The bar graph displays the amount of HTTP bandwidth transferred during each hour of the day.
6. The table contains the following information:
•
•
•
•
Hour—when the sample was taken.
Events—number of events or “hits.”
MBytes—number of megabytes transferred.
% of MBytes—percentage of megabytes transferred during this hour, compared to the day. For example, if
1000 megabytes of HTTP data was transferred during the day and 100 megabytes was transferred at the
12:00 time period, the % of MBytes field will display 10%.
7. SonicWALL ViewPoint shows today’s report. To change report settings, click Settings. The Report Settings
dialog box appears (Figure 47).
Figure 47: Report Settings Dialog Box
8. Select the type of chart to display from the View Settings area.
9. Select the year, month, and day that you would like to view.
Viewing Reports
55
10. When you are finished, click Close. SonicWALL ViewPoint displays the report for the selected day.
Viewing the Top Web Sites
The Top Sites report displays the web sites that used the most HTTP bandwidth on the specified date. To view the
Top Sites report, follow these steps:
1. Start and log into SonicWALL ViewPoint.
2. Click the Reports tab.
3. Select a SonicWALL appliance.
4. Expand the Web Usage tree and click Top Sites. The Top Sites page appears (Figure 48).
Figure 48: Top Sites Page
5. The pie chart displays the percentage of bandwidth used to access the top sites.
6. The table contains the following information:
•
•
•
•
Site—URL or IP address of the site.
Hits—number of hits.
MBytes—number of megabytes transferred.
% of MBytes—percentage of megabytes transferred between this site, compared to all other HTTP traffic.
For example, if 10,000 megabytes of data was transferred during the day and 5,000 megabytes was transferred between the appliance and Ebay, the % of MBytes field will display 50% and you have a problem.
7. By default, SonicWALL ViewPoint shows today’s report, a pie chart, and the ten top sites. To change these settings, click Settings. The Report Settings dialog box appears (Figure 49).
56
SonicWALL ViewPoint User’s Guide
Figure 49: Report Settings Dialog Box
8. Select the number of sites that will be displayed from the Number of Sites list box.
9. Select whether to display a chart and table or a table only.
10. Select the year, month, and day that you would like to view.
11. When you are finished, click Close. SonicWALL ViewPoint displays the report for the selected day.
Note: These settings will stay in effect for all similar reports during your active login session.
Viewing the Top Users of Web Bandwidth
The Top Users report displays the users who used the most HTTP bandwidth on the specified date.
To view the Top Users report, follow these steps:
1. Start and log into SonicWALL ViewPoint.
2. Click the Reports tab.
3. Select a SonicWALL appliance.
4. Expand the Web Usage tree and click Top Users. The Top Users page appears (Figure 50).
Viewing Reports
57
Figure 50: Top Users Page
5. The pie chart displays the percentage of bandwidth transferred by each of the top users.
6. The table contains the following information:
•
•
•
•
Users—the IP address of the user.
Hits—number of hits.
MBytes—number of megabytes transferred.
% of MBytes—percentage of megabytes transferred by this user, compared to all users. For example, if
1000 megabytes of data was transferred during the day and 200 megabytes was transferred by the top user,
the % of MBytes field will display 20%.
7. By default, SonicWALL ViewPoint shows today’s report, a pie chart, and the ten top users. To change these settings, click Settings. The Report Settings dialog box appears (Figure 51).
58
SonicWALL ViewPoint User’s Guide
Figure 51: Report Settings Dialog Box
8. Select the number of users that will be displayed from the Number of Users list box.
9. Select the type of chart from the Chart Type list box.
10. Select the year, month, and day that you would like to view.
11. To display a limited group of users, enter the user IDs in the Select Users field and separate each entry with a
comma.
Note: This field does not use pattern matching. For example, “john” will not match john_smith, john42, or
big_john.
12. When you are finished, click Close. SonicWALL ViewPoint refreshes the report based on the selected settings.
Note: These settings will stay in effect for all similar reports during your active login session.
Viewing Web Usage by User
The By User report displays a list of all users, their top sites, the number of hits to each site, and the amount of data
transferred.
To view the By User report, follow these steps:
1. Start and log into SonicWALL ViewPoint.
2. Click the Reports tab.
3. Select a SonicWALL appliance.
4. Expand the Web Usage tree and click By User. The By User page appears (Figure 52).
Viewing Reports
59
Figure 52: By User Page
5. The table contains the following information:
• User—the IP address of the user.
• Hits—number of hits to each web site visited by the user.
• MBytes—number of megabytes transferred.
6. To change the display settings, click Settings. The Report Settings dialog box appears (Figure 53).
Figure 53: Report Settings Dialog Box
7. Select the number of users that will be displayed from the Number of Users list box.
60
SonicWALL ViewPoint User’s Guide
8. Select the type of chart from the Chart Type list box.
9. Select the year, month, and day that you would like to view.
10. To display a limited group of users, enter the user IDs in the Select Users field and separate each entry with a
comma.
Note: This field does not use pattern matching. For example, “john” will not match john_smith, john42, or
big_john.
11. When you are finished, click Close. SonicWALL ViewPoint refreshes the report based on the selected settings.
Note: These settings will stay in effect for all similar reports during your active login session.
Viewing Web Usage by Site
The By Site report displays a list of all sites, the users that accessed the sites, the number of hits to each site, and the
amount of data transferred.
To view the By Site report, follow these steps:
1. Start and log into SonicWALL ViewPoint.
2. Click the Reports tab.
3. Select a SonicWALL appliance.
4. Expand the Web Usage tree and click By Site. The By Site page appears (Figure 54).
Figure 54: By Site Page
5. The table contains the following information:
• Site—the URL of the site.
• User—the top users that visited the site (default: 10).
• Hits—number of hits to the web site, by user.
• MBytes—number of megabytes transferred, by user.
6. SonicWALL ViewPoint shows today’s report and all web sites. To change the date of the report or web sites displayed, click Settings. The Report Settings dialog box appears.
Viewing Reports
61
Figure 55: Report Settings Dialog Box
7. Select the number of sites that will be displayed from the Number of Sites list box.
8. Select the number of users that will be displayed per site from the Number of Users per Site list box.
9. To only display a limited set of web sites, enter the URLs in the Select Site field and separate each entry with a
comma.
Note: This field does not use pattern matching. For example, “www.yahoo.com” will not match yahoo.com,
mail.yahoo.com, or shopping.yahoo.com.
10. When you are finished, click Close. SonicWALL ViewPoint adjusts the report for the selected day and settings.
Note: These settings will stay in effect for all similar reports during your active login session.
Viewing Web Usage Over Time
The Web Usage Over Time report displays the daily amount of HTTP bandwidth handled by a SonicWALL appliance or group of SonicWALL appliances for the specified time period.
To view the Web Usage Over Time report, follow these steps:
1. Start and log into SonicWALL ViewPoint.
2. Click the Reports tab.
3. Select the global icon, a group, or a SonicWALL appliance.
4. Expand the Web Usage tree and click Over Time. The Over Time page appears (Figure 56).
62
SonicWALL ViewPoint User’s Guide
Figure 56: Over Time Page
5. The bar graph displays the amount of HTTP bandwidth transferred during each day of the specified time period.
6. The table contains the following information:
•
•
•
•
Date—when the sample was taken.
Connections—number of connections or hits.
MBytes—number of megabytes transferred.
% of Usage—percentage of megabytes transferred during this day, compared to the time period. For example, if 100,000 megabytes of data was transferred during the time period and 25,000 megabytes was transferred on one day, the % of Usage field will display 25%.
7. To change the date range of the report, click Settings. The Reporting Date Range Selector dialog box appears
(Figure 57).
Figure 57: Report Settings Dialog Box
8. Select whether to display a chart and table or a table only.
Viewing Reports
63
9. Select from the following:
•
•
To select a period of time before the last summarization, enter the number of days to view before the last
summarization.
To view a specific date range, select the starting and ending dates that you would like to view.
10. When you are finished, click Close. SonicWALL ViewPoint displays the report for the selected date range.
Note: These settings will stay in effect for all similar reports during your active login session.
Viewing Top Sites Over Time
The Top Sites Over Time report displays the most visited web sites for the specified time period.
To view the Top Sites Over Time report, follow these steps:
1. Start and log into SonicWALL ViewPoint.
2. Click the Reports tab.
3. Select a SonicWALL appliance.
4. Expand the Web Usage tree and click Top Sites Over Time. The Top Sites Over Time page appears
(Figure 58).
Figure 58: Top Sites Over Time Page
5. The bar graph displays the amount of HTTP bandwidth transferred during each day of the specified time period.
6. The table contains the following information:
•
•
•
•
Site—URL or IP address of the site.
Hits—number of hits.
KBytes—number of kilobytes transferred.
% of KBytes—percentage of kilobytes transferred between this site, compared to all other HTTP traffic.
For example, if 1,000,000 kilobytes of data was transferred during the day and 500,000 kilobytes was transferred between the appliance and Ebay, the % of KBytes field will display 50% and you have a problem.
7. To change the date range of the report, click Settings. The Reporting Date Range Selector dialog box appears
(Figure 59).
64
SonicWALL ViewPoint User’s Guide
Figure 59: Report Settings Dialog Box
8. Select whether to display a chart and table or a table only.
9. Select from the following:
• To select a period of time before the last summarization, enter the number of days to view before the last
summarization.
• To view a specific date range, select the starting and ending dates that you would like to view.
10. When you are finished, click Close. SonicWALL ViewPoint displays the report for the selected date range.
Note: These settings will stay in effect for all similar reports during your active login session.
Viewing Top Users Over Time
The Top Users Over Time report displays the top users of bandwidth for the specified time period. To view the Top
Users Over Time report, follow these steps:
1. Start and log into SonicWALL ViewPoint.
2. Click the Reports tab.
3. Select a SonicWALL appliance.
4. Expand the Web Usage tree and click Top Users Over Time. The Top Users Over Time page appears
(Figure 60).
Viewing Reports
65
Figure 60: Top Users Over Time Page
5. The graph provides a graphical display of the percentage of bandwidth transferred by each of the top users over
the specified time period.
6. The table contains the following information:
•
•
•
•
Users—the IP address of the user.
Hits—number of hits.
MBytes—number of megabytes transferred.
% of MBytes—percentage of megabytes transferred by this user, compared to all users. For example, if
1000 megabytes of data was transferred during the period and 200 megabytes was transferred by the top
user, the % of MBytes field will display 20%.
7. To change the date range of the report, click Settings. The Reporting Date Range Selector dialog box appears
(Figure 61).
Figure 61: Report Settings Dialog Box
8. Select whether to display a chart and table or a table only.
66
SonicWALL ViewPoint User’s Guide
9. Select from the following:
• To select a period of time before the last summarization, enter the number of days to view before the last
summarization.
• To view a specific date range, select the starting and ending dates that you would like to view.
10. When you are finished, click Close. SonicWALL ViewPoint displays the report for the selected date range.
Note: These settings will stay in effect for all similar reports during your active login session.
Viewing Bandwidth Usage By User Over Time
The By User Over Time report displays a list of all users, their top sites, the number of hits to each site, and the
amount of data transferred for the specified time period.
To view the By User Over Time report, follow these steps:
1. Start and log into SonicWALL ViewPoint.
2. Click the Reports tab.
3. Select a SonicWALL appliance.
4. Expand the Web Usage tree and click By User Over Time. The By User Over Time page appears (Figure 62).
Figure 62: By User Over Time Page
5. The table contains the following information:
•
•
•
•
User—the IP address of the user.
Site—the top five sites visited by the user.
Hits—number of hits to each web site visited by the user.
KBytes—number of kilobytes transferred.
6. To change the date range of the report, click Settings. The Reporting Date Range Selector dialog box appears
(Figure 63).
Viewing Reports
67
Figure 63: Report Settings Dialog Box
7. Select whether to display a chart and table or a table only.
8. Select from the following:
•
•
To select a period of time before the last summarization, enter the number of days to view before the last
summarization.
To view a specific date range, select the starting and ending dates that you would like to view.
9. When you are finished, click Close. SonicWALL ViewPoint displays the report for the selected date range.
Note: These settings will stay in effect for all similar reports during your active login session.
68
SonicWALL ViewPoint User’s Guide
Viewing Web Filter Reports
Web filter reports provide information on the number of attempts that users made to access blocked web sites
through the selected SonicWALL appliance(s). These reports include web sites blocked by the Content Filter List,
customized keyword filtering, and domain name filtering.
Web filter reports can be used to view blocked site access attempts by the hour, day, or over a period of days. Additionally, you can view the users that most frequently attempt to access blocked sites and the most popular blocked
sites.
Note: All reports appear in the Firewall’s time zone.
Select from the following:
•
•
•
•
•
•
•
•
To view a summary of the blocked site access attempts, see “Viewing the Web Filter Summary Report” on
page 69.
To view a list of the blocked sites that users attempted to access most often, see “Viewing the Web Filter Top
Sites Report” on page 71.
To view the users who made the most attempts to access blocked sites, see “Viewing the Top Users that Try to
Access Blocked Sites” on page 72.
To view the top blocked sites that each user attempted to access, see “Viewing the Top Blocked Sites for Each
User” on page 74.
To view blocked site access attempts over a period of time, see “Viewing Blocked Site Attempts Over Time” on
page 75.
To view a list of the blocked sites that users attempted to access most often over time, see “Viewing Blocked
Site Attempts Over Time” on page 75.
To view the users who made the most attempts to access blocked sites over time, see “Viewing the Top Blocked
Site Users Over Time” on page 78.
To view the top blocked sites that each user attempted to access over time, see “Viewing the Top Blocked Sites
for Each User Over Time” on page 80.
Viewing the Web Filter Summary Report
The Web Filter Summary report contains information on the number of times users attempt to access blocked sites
for the specified day.
To view the Web Filter Summary report, follow these steps:
1. Start and log into SonicWALL ViewPoint.
2. Click the Reports tab.
3. Select the global icon, a group, or a SonicWALL appliance.
4. Expand the Web Filter tree and click Summary. The Summary page appears (Figure 64).
Viewing Reports
69
Figure 64: Summary Page
5. The bar graph displays the number of blocked sites that users attempted to access during each hour of the day.
6. The table contains the following information:
• Hour—time when the sample was taken.
• Attempts—number of attempts to access blocked sites.
• % of Attempts—percentage of attempts during this hour, compared to the day. For example, if 100
attempts occurred during the day and 20 attempts occurred at the 12:00 time period, the % of Attempts
field will display 20%.
7. SonicWALL ViewPoint shows today’s report. To change report settings, click Settings. The Report Settings
dialog box appears (Figure 65).
Figure 65: Report Settings Dialog Box
8. Select the type of chart to display from the View Settings area.
9. Select the year, month, and day that you would like to view.
10. When you are finished, click Close. SonicWALL ViewPoint displays the report for the selected day.
70
SonicWALL ViewPoint User’s Guide
Viewing the Web Filter Top Sites Report
The Web Filter Top Sites report displays the top blocked web sites that users attempted to access on the specified
date.
To view the Top Sites report, follow these steps:
1. Start and log into SonicWALL ViewPoint.
2. Click the Reports tab.
3. Select a SonicWALL appliance.
4. Expand the Web Filter tree and click Top Sites. The Top Sites page appears (Figure 66).
Figure 66: Top Sites Page
5. The graph provides a display of the number of access attempts for each of the top twenty blocked web sites.
6. The table contains the following information:
• Site—URL or IP address of the site.
• Attempts—number of attempts.
• % of Attempts—percentage of attempts to access the blocked site, compared to all other blocked site
attempts. For example, if 500 attempts were made during the day and 100 of those attempts were for
www.badsite.com, its % of Attempts field will display 20%.
7. SonicWALL ViewPoint shows today’s report. To change report settings, click Settings. The Report Settings
dialog box appears (Figure 67).
Viewing Reports
71
Figure 67: Report Settings Dialog Box
8. Select the type of chart to display from the View Settings area.
9. Select the year, month, and day that you would like to view.
10. When you are finished, click Close. SonicWALL ViewPoint displays the report for the selected day.
Viewing the Top Users that Try to Access Blocked Sites
The Web Filter Top Users report displays the users who made the most attempts to access blocked sites on the specified date.
To view the Top Users report, follow these steps:
1. Start and log into SonicWALL ViewPoint.
2. Click the Reports tab.
3. Select a SonicWALL appliance.
4. Expand the Web Filter tree and click Top Users. The Top Users page appears (Figure 68).
72
SonicWALL ViewPoint User’s Guide
Figure 68: Top Users Page
5. The pie chart displays the top users with the most blocked site attempts.
6. The table contains the following information:
• Users—the IP address of the user.
• Attempts—number of attempts.
• % of Attempts—percentage of attempts to access the blocked site, compared to all other user attempts. For
example, if 500 attempts were made during the day and 250 of those attempts were made by a single user,
his % of Attempts field will display 50%.
7. By default, SonicWALL ViewPoint shows today’s report, a pie chart, and the ten top users. To change these settings, click Settings. The Report Settings dialog box appears (Figure 69).
Figure 69: Report Settings Dialog Box
8. Select the number of users that will be displayed from the Number of Users list box.
9. Select the type of chart from the Chart Type list box.
10. Select the year, month, and day that you would like to view.
Viewing Reports
73
11. When you are finished, click Close. SonicWALL ViewPoint displays the report for the selected day.
Note: These settings will stay in effect for all similar reports during your active login session.
Viewing the Top Blocked Sites for Each User
The Web Filter By User report displays the top blocked web sites that each user attempted to access on the specified
date.
To view the Web Filter By User report, follow these steps:
1. Start and log into SonicWALL ViewPoint.
2. Click the Reports tab.
3. Select a SonicWALL appliance.
4. Expand the Web Filter tree and click By User. The By User page appears (Figure 70).
Figure 70: By User Page
5. The table contains the following information:
• User—the IP address of the user.
• Site—the top five sites visited by the user.
• Attempts—number of attempts the user made to access each web site.
6. By default, SonicWALL ViewPoint shows today’s report, a pie chart, and the ten top users. To change these settings, click Settings. The Report Settings dialog box appears (Figure 71).
74
SonicWALL ViewPoint User’s Guide
Figure 71: Report Settings Dialog Box
7. Select the number of users that will be displayed from the Number of Users list box.
8. Select the type of chart from the Chart Type list box.
9. Select the year, month, and day that you would like to view.
10. When you are finished, click Close. SonicWALL ViewPoint displays the report for the selected day.
Note: These settings will stay in effect for all similar reports during your active login session.
Viewing Blocked Site Attempts Over Time
The Web Filter Over Time report displays the number of attempts that were made to access blocked web sites for
the specified time period.
To view the Web Filter Over Time report, follow these steps:
1. Start and log into SonicWALL ViewPoint.
2. Click the Reports tab.
3. Select the global icon, a group, or a SonicWALL appliance.
4. Expand the Web Filter tree and click Over Time. The Over Time page appears (Figure 72).
Viewing Reports
75
Figure 72: Over Time Page
5. The bar graph displays the number of attempts that were made to access blocked web sites during each day of
the specified time period.
6. The table contains the following information:
• Date—day when the sample was taken.
• Attempts—number of attempts to access blocked web sites.
• % of Attempts—percentage of attempts to access the blocked site on the day, compared to the time period.
For example, if 5,000 attempts were made during the time period and 500 were made on one day, its % of
Attempts field will display 10%.
7. To change the date range of the report, click Settings. The Reporting Date Range Selector dialog box appears
(Figure 73).
Figure 73: Report Settings Dialog Box
8. Select whether to display a chart and table or a table only.
76
SonicWALL ViewPoint User’s Guide
9. Select from the following:
• To select a period of time before the last summarization, enter the number of days to view before the last
summarization.
• To view a specific date range, select the starting and ending dates that you would like to view.
10. When you are finished, click Close. SonicWALL ViewPoint displays the report for the selected date range.
Note: These settings will stay in effect for all similar reports during your active login session.
Viewing the Top Blocked Site Attempts Over Time
The Top Sites Over Time report displays the top blocked web sites for the specified time period.
To view the Web Filter Over Time report, follow these steps:
1. Start and log into SonicWALL ViewPoint.
2. Click the Reports tab.
3. Select a SonicWALL appliance.
4. Expand the Web Filter tree and click Top Sites Over Time. The Top Sites Over Time page appears (Figure 74).
Figure 74: Top Sites Over Time Page
5. The graph displays the number of access attempts for each of the top blocked web sites during the specified
time period.
6. The table contains the following information:
• Site—URL or IP address of the site.
• Attempts—number of attempts.
• % of Attempts—percentage of attempts to access the blocked site, compared to all other blocked site
attempts. For example, if 500 attempts were made during the period and 100 of those attempts were for
www.badsite.com, its % of Attempts field will display 20%.
7. To change the date range of the report, click Settings. The Reporting Date Range Selector dialog box appears
(Figure 75).
Viewing Reports
77
Figure 75: Report Settings Dialog Box
8. Select whether to display a chart and table or a table only.
9. Select from the following:
•
•
To select a period of time before the last summarization, enter the number of days to view before the last
summarization.
To view a specific date range, select the starting and ending dates that you would like to view.
10. When you are finished, click Close. SonicWALL ViewPoint displays the report for the selected date range.
Note: These settings will stay in effect for all similar reports during your active login session.
Viewing the Top Blocked Site Users Over Time
The Web Filter Top Users Over Time report displays the users who made the most attempts to access blocked sites
during the specified time period.
To view the Top Users Over Time report, follow these steps:
1. Start and log into SonicWALL ViewPoint.
2. Click the Reports tab.
3. Select a SonicWALL appliance.
4. Expand the Web Filter tree and click Top Users Over Time. The Top Users Over Time page appears
(Figure 76).
78
SonicWALL ViewPoint User’s Guide
Figure 76: Top Users Over Time Page
5. The pie chart displays the top users with the most blocked site attempts.
6. The table contains the following information:
• Users—the IP address of the user.
• Attempts—number of attempts.
• % of Attempts—percentage of attempts to access the blocked site, compared to all other user attempts. For
example, if 500 attempts were made during the period and 250 of those attempts were made by a single
user, his % of Attempts field will display 50%.
7. To change the date range of the report, click Settings. The Reporting Date Range Selector dialog box appears
(Figure 77).
Figure 77: Report Settings Dialog Box
8. Select whether to display a chart and table or a table only.
Viewing Reports
79
9. Select from the following:
•
•
To select a period of time before the last summarization, enter the number of days to view before the last
summarization.
To view a specific date range, select the starting and ending dates that you would like to view.
10. When you are finished, click Close. SonicWALL ViewPoint displays the report for the selected date range.
Note: These settings will stay in effect for all similar reports during your active login session.
Viewing the Top Blocked Sites for Each User Over Time
The Web Filter By User report displays the top blocked web sites that each user attempted to access during the
specified time period.
To view the By User Over Time report, follow these steps:
1. Start and log into SonicWALL ViewPoint.
2. Click the Reports tab.
3. Select a SonicWALL appliance.
4. Expand the Web Filter tree and click By User Over Time. The By User Over Time page appears (Figure 78).
Figure 78: By Users Over Time Page
5. The table contains the following information:
• User—the IP address of the user.
• Site—the top five sites visited by the user.
• Attempts—number of attempts the user made to access each web site.
6. To change the date range of the report, click Settings. The Reporting Date Range Selector dialog box appears
(Figure 79).
80
SonicWALL ViewPoint User’s Guide
Figure 79: Report Settings Dialog Box
7. Select whether to display a chart and table or a table only.
8. Select from the following:
•
•
To select a period of time before the last summarization, enter the number of days to view before the last
summarization.
To view a specific date range, select the starting and ending dates that you would like to view.
9. When you are finished, click Close. SonicWALL ViewPoint displays the report for the selected date range.
Note: These settings will stay in effect for all similar reports during your active login session.
Viewing Reports
81
Viewing File Transfer Protocol Reports
FTP usage reports provide information on the amount of FTP usage that occurs through the selected SonicWALL
appliance(s).
FTP usage reports can be used to view FTP bandwidth usage by the hour, day, or over a period of days. Additionally, you can view the top users of FTP bandwidth.
General bandwidth reports do not always provide a complete picture of network bandwidth usage. If a large amount
of FTP traffic occurs during peak times, you might need more bandwidth, you might need to upgrade network
equipment, or you might ask employees to use compression or transfer large files during non-peak times.
Note: All reports appear in the Firewall’s time zone.
Select from the following:
• To view a summary of the daily FTP bandwidth usage, see “Viewing the FTP Summary Report” on page 82.
• To view the users who consume the most FTP bandwidth, see “Viewing the Top Users of FTP Bandwidth” on
page 83.
• To view FTP bandwidth usage over a period of time, see “Viewing FTP Bandwidth Usage Over Time” on
page 85.
• To view the users who consume the most FTP bandwidth over time, see “Viewing FTP Bandwidth Usage Over
Time” on page 85.
Viewing the FTP Summary Report
The FTP Summary report contains information on the amount of FTP bandwidth handled by a SonicWALL appliance or group of SonicWALL appliances during the specified day.
To view the FTP Summary report, follow these steps:
1. Start and log into SonicWALL ViewPoint.
2. Click the Reports tab.
3. Select the global icon, a group, or a SonicWALL appliance.
4. Expand the FTP Usage tree and click Summary. The Summary page appears (Figure 80).
Figure 80: Summary Page
5. The bar graph displays the amount of FTP bandwidth transferred during each hour of the day.
82
SonicWALL ViewPoint User’s Guide
6. The table contains the following information:
•
•
•
•
Hour—when the sample was taken.
Events—number of FTP events.
MBytes—number of megabytes transferred.
% of MBytes—percentage of megabytes transferred during this hour, compared to the day. For example, if
1000 megabytes of FTP data was transferred during the day and 100 megabytes was transferred at the 12:00
time period, the % of MBytes field will display 10%.
7. SonicWALL ViewPoint shows today’s report. To change report settings, click Settings. The Report Settings
dialog box appears (Figure 81).
Figure 81: Report Settings Dialog Box
8. Select the type of chart to display from the View Settings area.
9. Select the year, month, and day that you would like to view.
10. When you are finished, click Close. SonicWALL ViewPoint displays the report for the selected day.
Viewing the Top Users of FTP Bandwidth
The Top Users report displays the users who used the most FTP bandwidth on the specified date.
To view the Top Users report, follow these steps:
1. Start and log into SonicWALL ViewPoint.
2. Click the Reports tab.
3. Select a SonicWALL appliance.
4. Expand the FTP Usage tree and click Top Users. The Top Users page appears (Figure 82).
Viewing Reports
83
Figure 82: Top Users Page
5. The pie chart displays the percentage of bandwidth used by each user. To view the sites visited by each user,
expand the user’s site tree (indicated by a ‘+’ sign).
6. The table contains the following information:
•
•
•
•
Users—the IP address of the user.
Events—number of FTP Events.
KBytes—number of kilobytes transferred.
% of KBytes—percentage of kilobytes transferred by this user, compared to all users. For example, if
10000 kilobytes of data was transferred during the day and 2000 kilobytes was transferred by the top user,
the % of KBytes field will display 20%.
7. By default, SonicWALL ViewPoint shows today’s report, a pie chart, and the ten top users. To change these settings, click Settings. The Report Settings dialog box appears (Figure 83).
84
SonicWALL ViewPoint User’s Guide
Figure 83: Report Settings Dialog Box
8. Select the number of users that will be displayed from the Number of Users list box.
9. Select the type of chart from the Chart Type list box.
10. Select the year, month, and day that you would like to view.
11. To display a limited group of users, enter the user IDs in the Select Users field and separate each entry with a
comma.
Note: This field does not use pattern matching. For example, “john” will not match john_smith, john42, or
big_john.
12. When you are finished, click Close. SonicWALL ViewPoint refreshes the report based on the selected settings.
Note: These settings will stay in effect for all similar reports during your active login session.
Viewing FTP Bandwidth Usage Over Time
The FTP Usage Over Time report displays the daily amount of FTP bandwidth handled by a SonicWALL appliance
or group of SonicWALL appliances for the specified time period.
To view the FTP Usage Over Time report, follow these steps:
1. Start and log into SonicWALL ViewPoint.
2. Click the Reports tab.
3. Select the global icon, a group, or a SonicWALL appliance.
4. Expand the FTP Usage tree and click Over Time. The Over Time page appears (Figure 84).
Viewing Reports
85
Figure 84: Over Time Page
5. The bar graph displays the amount of FTP bandwidth transferred during each day of the specified time period.
6. The table contains the following information:
• Date—when the sample was taken.
• Connections—number of FTP connections.
• MBytes—number of megabytes transferred.
• % of Usage—percentage of megabytes transferred during this day, compared to the time period. For example, if 10,000 megabytes of FTP data was transferred during the time period and 2,500 megabytes of FTP
data was transferred on one day, the % of Usage field will display 25%.
7. To change the date range of the report, click Settings. The Reporting Date Range Selector dialog box appears
(Figure 85).
Figure 85: Report Settings Dialog Box
8. Select whether to display a chart and table or a table only.
86
SonicWALL ViewPoint User’s Guide
9. Select from the following:
• To select a period of time before the last summarization, enter the number of days to view before the last
summarization.
• To view a specific date range, select the starting and ending dates that you would like to view.
10. When you are finished, click Close. SonicWALL ViewPoint displays the report for the selected date range.
Note: These settings will stay in effect for all similar reports during your active login session.
Viewing the Top Users of FTP Bandwidth Over Time
The Top Users Over Time report displays the users who used the most FTP bandwidth for the specified time period.
To view the Top Users Over Time report, follow these steps:
1. Start and log into SonicWALL ViewPoint.
2. Click the Reports tab.
3. Select a SonicWALL appliance.
4. Expand the FTP Usage tree and click Top Users Over Time. The Top Users Over Time page appears
(Figure 86).
Figure 86: Top Users Over Time Page
5. The pie chart displays the top users of FTP bandwidth. To view the FTP sites visited by each user, expand the
user’s site tree (indicated by a ‘+’ sign).
6. The table contains the following information:
•
•
•
•
Users—the IP address of the user.
Events—number of FTP Events.
MBytes—number of megabytes transferred.
% of MBytes—percentage of megabytes transferred by this user, compared to all users. For example, if
10000 megabytes of data was transferred during the period and 2000 megabytes was transferred by the top
user, the % of MBytes field will display 20%.
7. To change the report settings, click Settings. The Reporting Date Range Selector dialog box appears
(Figure 87).
Viewing Reports
87
Figure 87: Report Settings Dialog Box
8. Select whether to display a chart and table or a table only.
9. Select from the following:
•
•
To select a period of time before the last summarization, enter the number of days to view before the last
summarization.
To view a specific date range, select the starting and ending dates that you would like to view.
10. To display a limited group of users, enter the user IDs in the Select Users field and separate each entry with a
comma.
Note: This field does not use pattern matching. For example, “john” will not match john_smith, john42, or
big_john.
11. When you are finished, click Close. SonicWALL ViewPoint displays the report for the selected date range.
Note: These settings will stay in effect for all similar reports during your active login session.
88
SonicWALL ViewPoint User’s Guide
Viewing Mail Usage Reports
Mail usage reports provide information on the amount of mail usage that occurs through the selected SonicWALL
appliance(s).
Mail usage reports can be used to view mail bandwidth usage by the hour, day, or over a period of days. Additionally, you can view the top users of mail bandwidth.
Note: Mail usage reports include SMTP, POP3, and IMAP traffic.
General bandwidth reports do not always provide a complete picture of network bandwidth usage. If a large amount
of mail traffic occurs during peak times, you might want to take some of the following actions:
•
•
•
•
Add bandwidth
Upgrade network equipment
Ask employees to use compression or transfer large files during non-peak times
Ask employees to place large files on an FTP site rather than sending them as mail attachments.
Note: All reports appear in the Firewall’s time zone.
Select from the following:
To view a summary of the daily mail usage, see “Viewing the Mail Usage Summary Report” on page 89.
To view the users who consume the most mail bandwidth, see “Viewing the Top Users of Mail Bandwidth” on
page 91.
• To view mail usage over a period of time, see “Viewing Mail Usage Over Time” on page 92.
• To view the users who consume the most mail bandwidth over time, see “Viewing the Top Users of Mail Bandwidth Over Time” on page 94.
•
•
Viewing the Mail Usage Summary Report
The Mail Usage Summary report contains information on the amount of mail handled by a SonicWALL appliance
or group of SonicWALL appliances during the specified day.
To view the Mail Usage Summary report, follow these steps:
1. Start and log into SonicWALL ViewPoint.
2. Click the Reports tab.
3. Select the global icon, a group, or a SonicWALL appliance.
4. Expand the Mail Usage tree and click Summary. The Summary page appears (Figure 88).
Viewing Reports
89
Figure 88: Summary Page
5. The bar graph displays the amount of mail sent and received during each hour of the day.
6. The table contains the following information:
• Hour—when the sample was taken.
• Events—number of mail events.
• KBytes—number of kilobytes transferred.
• % of KBytes—percentage of kilobytes transferred during this hour, compared to the day. For example, if
10,000 kilobytes of mail was transferred during the day and 1,000 kilobytes was transferred at the 12:00
time period, the % of KBytes field will display 10%.
7. SonicWALL ViewPoint shows today’s report. To change report settings, click Settings. The Report Settings
dialog box appears (Figure 89).
Figure 89: Report Settings Dialog Box
8. Select the type of chart to display from the View Settings area.
9. Select the year, month, and day that you would like to view.
90
SonicWALL ViewPoint User’s Guide
10. When you are finished, click Close. SonicWALL ViewPoint displays the report for the selected day.
Viewing the Top Users of Mail Bandwidth
The Top Users report displays the users who sent and received the most mail on the specified date.
To view the Top Users report, follow these steps:
1. Start and log into SonicWALL ViewPoint.
2. Click the Reports tab.
3. Select a SonicWALL appliance.
4. Expand the Mail Usage tree and click Top Users. The Top Users page appears (Figure 90).
Figure 90: Top Users Page
5. The pie chart displays the percentage of mail sent and received by the top mail users.
6. The table contains the following information:
• Users—the IP address of the user.
• Events—number of mail messages sent and received.
• KBytes—number of kilobytes transferred.
• % of KBytes—percentage of kilobytes transferred by this user, compared to all users. For example, if
10000 kilobytes of data was transferred during the day and 2000 kilobytes was transferred by the top user,
the % of KBytes field will display 20%.
7. By default, SonicWALL ViewPoint shows today’s report, a pie chart, and the ten top users. To change these settings, click Settings. The Report Settings dialog box appears (Figure 91).
Viewing Reports
91
Figure 91: Report Settings Dialog Box
8. Select the number of users that will be displayed from the Number of Users list box.
9. Select the type of chart from the Chart Type list box.
10. Select the year, month, and day that you would like to view.
11. When you are finished, click Close. SonicWALL ViewPoint displays the report for the selected day.
Note: These settings will stay in effect for all similar reports during your active login session.
Viewing Mail Usage Over Time
The Mail Usage Over Time report displays the daily amount of mail handled by a SonicWALL appliance or group
of SonicWALL appliances for the specified time period.
To view the Mail Usage Over Time report, follow these steps:
1. Start and log into SonicWALL ViewPoint.
2. Click the Reports tab.
3. Select the global icon, a group, or a SonicWALL appliance.
4. Expand the Mail Usage tree and click Over Time. The Over Time page appears (Figure 92).
92
SonicWALL ViewPoint User’s Guide
Figure 92: Over Time Page
5. The bar graph displays the amount of mail sent and received during each day of the specified time period.
6. The table contains the following information:
• Date—when the sample was taken.
• Connections—number of mail messages.
• KBytes—number of kilobytes transferred.
• % of Usage—percentage of kilobytes transferred during this day, compared to the time period. For example, if 10,000 kilobytes of mail was transferred during the time period and 2,500 kilobytes of mail was
transferred on one day, the % of Usage field will display 25%.
7. To change the date range of the report, click Settings. The Reporting Date Range Selector dialog box appears
(Figure 93).
Figure 93: Report Settings Dialog Box
8. Select whether to display a chart and table or a table only.
Viewing Reports
93
9. Select from the following:
•
•
To select a period of time before the last summarization, enter the number of days to view before the last
summarization.
To view a specific date range, select the starting and ending dates that you would like to view.
10. When you are finished, click Close. SonicWALL ViewPoint displays the report for the selected date range.
Note: These settings will stay in effect for all similar reports during your active login session.
Viewing the Top Users of Mail Bandwidth Over Time
The Top Users Over Time report displays the users who sent and received the most mail during the specified time
period.
To view the Top Users Over Time report, follow these steps:
1. Start and log into SonicWALL ViewPoint.
2. Click the Reports tab.
3. Select a SonicWALL appliance.
4. Expand the Mail Usage tree and click Top Users Over Time. The Top Users Over Time page appears
(Figure 94).
Figure 94: Top Users Over Time Page
5. The pie chart displays the percentage of mail sent and received by the top mail users.
6. The table contains the following information:
• Users—the IP address of the user.
• Events—number of mail messages sent and received.
• KBytes—number of kilobytes transferred.
• % of KBytes—percentage of kilobytes transferred by this user, compared to all users. For example, if
10000 kilobytes of data was transferred during the period and 2000 kilobytes was transferred by the top
user, the % of KBytes field will display 20%.
7. To change the date range of the report, click Settings. The Reporting Date Range Selector dialog box appears
(Figure 95).
94
SonicWALL ViewPoint User’s Guide
Figure 95: Report Settings Dialog Box
8. Select whether to display a chart and table or a table only.
9. Select from the following:
•
•
To select a period of time before the last summarization, enter the number of days to view before the last
summarization.
To view a specific date range, select the starting and ending dates that you would like to view.
10. When you are finished, click Close.SonicWALL ViewPoint displays the report for the selected date range.
Note: These settings will stay in effect for all similar reports during your active login session.
Viewing Reports
95
Viewing VPN Usage Reports
VPN Usage reports provide information on the amount of VPN usage that occurs through the selected SonicWALL
appliance(s).
VPN Usage reports can be used to view VPN usage by the hour, day, or over a period of days. Additionally, you can
view the top users of VPN.
General bandwidth reports do not always provide a complete picture of network bandwidth usage. If a large amount
of VPN traffic occurs, you might need to add bandwidth, upgrade network equipment, or reconfigure the VPN network.
Note: All reports appear in the Firewall’s time zone.
Select from the following:
•
•
•
•
•
•
•
•
•
To view a summary of the daily VPN bandwidth usage, see “Viewing the VPN Usage Summary Report” on
page 96.
To view the users who consume the most VPN bandwidth, see “Viewing the Top VPN Users” on page 98.
To view VPN bandwidth usage over a period of time, see “Viewing VPN Usage Over Time” on page 99.
To view the users who consume the most VPN bandwidth over time, see “Viewing VPN Usage Over Time” on
page 99.
To view the users who consume the most VPN bandwidth over time, see “Viewing the Top VPN Users Over
Time” on page 101.
To view VPN usage by policy, see “Viewing VPN Usage by Policy” on page 102.
To view VPN usage by policy over time, see “Viewing the Top VPN Policies Over Time” on page 104.
To view hourly VPN usage by policy, see “Viewing Hourly VPN Usage by Policy” on page 105.
To view VPN services usage, see “Viewing the VPN Services Summary Report” on page 107.
Viewing the VPN Usage Summary Report
The VPN Usage Summary report contains information on the number of VPN connections made through a
SonicWALL appliance or group of SonicWALL appliances during the specified day.
To view the VPN Usage Summary report, follow these steps:
1. Start and log into SonicWALL ViewPoint.
2. Click the Reports tab.
3. Select the global icon, a group, or a SonicWALL appliance.
4. Expand the VPN Usage tree and click Summary. The Summary page appears (Figure 96).
96
SonicWALL ViewPoint User’s Guide
Figure 96: Summary Page
5. The bar graph displays the number of VPN connections made during each hour of the day.
6. The table contains the following information:
• Hour—when the sample was taken.
• Connections—number of VPN connections.
• % of Connections—percentage of VPN connections during this hour, compared to the day. For example, if
10,000 connections occurred during the day and 1,000 connections occurred during the 2:00 time period,
the % of Connections field will display 10%.
7. SonicWALL ViewPoint shows today’s report. To change report settings, click Settings. The Report Settings
dialog box appears (Figure 97).
Figure 97: Report Settings Dialog Box
8. Select the type of chart to display from the View Settings area.
9. Select the year, month, and day that you would like to view.
10. When you are finished, click Close. SonicWALL ViewPoint displays the report for the selected day.
Viewing Reports
97
Viewing the Top VPN Users
The Top Users report displays the users who made the most VPN connections on the specified date.
To view the Top Users report, follow these steps:
1. Start and log into SonicWALL ViewPoint.
2. Click the Reports tab.
3. Select a SonicWALL appliance.
4. Expand the VPN Usage tree and click Top Users. The Top Users page appears (Figure 98).
Figure 98: Top Users Page
5. The pie chart displays the VPN connections for the top VPN users.
6. The table contains the following information:
•
•
•
Users—the IP address of the user.
Connections—number of VPN connections.
% of Connections—percentage of VPN connections made by this user, compared to all other users. For
example, if 10,000 connections occurred during the day and 1,000 connections were made by one user, the
% of Connections field will display 10%.
7. By default, SonicWALL ViewPoint shows today’s report, a pie chart, and the ten top users. To change these settings, click Settings. The Report Settings dialog box appears (Figure 99).
98
SonicWALL ViewPoint User’s Guide
Figure 99: Report Settings Dialog Box
8. Select the number of users that will be displayed from the Number of Users list box.
9. Select the type of chart from the Chart Type list box.
10. Select the year, month, and day that you would like to view.
11. When you are finished, click Close. SonicWALL ViewPoint displays the report for the selected day.
Note: These settings will stay in effect for all similar reports during your active login session.
Viewing VPN Usage Over Time
The VPN Usage Over Time report displays the daily number of VPN connections made through a SonicWALL
appliance or group of SonicWALL appliances during the specified time period.
To view the VPN Usage Over Time report, follow these steps:
1. Start and log into SonicWALL ViewPoint.
2. Click the Reports tab.
3. Select the global icon, a group, or a SonicWALL appliance.
4. Expand the VPN Usage tree and click Over Time. The Over Time page appears (Figure 100).
Viewing Reports
99
Figure 100: Over Time Page
5. The bar graph displays the number of VPN connections made during each day of the specified time period.
6. The table contains the following information:
• Date—when the sample was taken.
• Connections—number of connections.
• KBytes—number of kilobytes transferred.
• % of Usage—percentage of kilobytes transferred during this day, compared to the time period. For example, if 10,000 kilobytes of mail was transferred during the time period and 2,500 kilobytes of mail was
transferred on one day, the % of Usage field will display 25%.
7. To change the date range of the report, click Settings. The Reporting Date Range Selector dialog box appears
(Figure 101).
Figure 101: Report Settings Dialog Box
8. Select whether to display a chart and table or a table only.
100
SonicWALL ViewPoint User’s Guide
9. Select from the following:
•
•
To select a period of time before the last summarization, enter the number of days to view before the last
summarization.
To view a specific date range, select the starting and ending dates that you would like to view.
10. When you are finished, click Close. SonicWALL ViewPoint displays the report for the selected date range.
Note: These settings will stay in effect for all similar reports during your active login session.
Viewing the Top VPN Users Over Time
The Top Users report displays the users who made the most VPN connections for the specified time period.
To view the Top Users report, follow these steps:
1. Start and log into SonicWALL ViewPoint.
2. Click the Reports tab.
3. Select a SonicWALL appliance.
4. Expand the VPN Usage tree and click Top Users Over Time. The Top Users Over Time page appears
(Figure 102).
Figure 102: Top Users Over Time Page
5. The pie chart displays the VPN connections for the top VPN users.
6. The table contains the following information:
•
•
•
Users—the IP address of the user.
Connections—number of VPN connections.
% of Connections—percentage of VPN connections made by this user, compared to all other users. For
example, if 10,000 connections occurred during the period and 1,000 connections were made by one user,
the % of Connections field will display 10%.
7. To change the date range of the report, click Settings. The Reporting Date Range Selector dialog box appears
(Figure 103).
Viewing Reports
101
Figure 103: Report Settings Dialog Box
8. Select whether to display a chart and table or a table only.
9. Select from the following:
•
•
To select a period of time before the last summarization, enter the number of days to view before the last
summarization.
To view a specific date range, select the starting and ending dates that you would like to view.
10. When you are finished, click Close. SonicWALL ViewPoint displays the report for the selected date range.
Note: These settings will stay in effect for all similar reports during your active login session.
Viewing VPN Usage by Policy
The VPN Usage by Policy report contains information on VPN usage for a SonicWALL appliance, organized by
policy.
To view the VPN Usage by Policy report, follow these steps:
1. Start and log into SonicWALL ViewPoint.
2. Click the Reports tab.
3. Select a SonicWALL appliance.
4. Expand the VPN Usage tree and click By Policy. The By Policy page appears (Figure 104).
102
SonicWALL ViewPoint User’s Guide
Figure 104: By Policy Page
5. The pie chart displays the amount of data transferred for each policy.
6. The table contains the following information:
•
•
•
•
Policy—name of the policy.
Events—number of VPN events.
MBytes—number of megabytes transferred.
% of MBytes—percentage of megabytes transferred for this policy, compared to all other policies. For
example, if a total of 10,000 megabytes was transferred and 2,500 megabytes was transferred for one policy, the % of Usage field will display 25%.
7. SonicWALL ViewPoint shows today’s report. To change report settings, click Settings. The Report Settings
dialog box appears (Figure 97).
Figure 105: Report Settings Dialog Box
8. Select the number of users that will be displayed from the Number of Users list box.
9. Select the type of chart from the Chart Type list box.
Viewing Reports
103
10. Select the year, month, and day that you would like to view.
11. When you are finished, click Close. SonicWALL ViewPoint displays the report for the selected day.
Note: These settings will stay in effect for all similar reports during your active login session.
Viewing the Top VPN Policies Over Time
The By Policy Over Time report displays the top VPN Policies for the specified time period.
To view the By Policy Over Time report, follow these steps:
1. Start and log into SonicWALL ViewPoint.
2. Click the Reports tab.
3. Select a SonicWALL appliance.
4. Expand the VPN Usage tree and click By Policy Over Time. The By Policy Over Time page appears
(Figure 106).
Figure 106: By Policy Over Time Page
5. The pie chart displays the VPN connections for the top policies.
6. The table contains the following information:
•
•
•
•
Policy—name of the policy.
Events—number of VPN events.
MBytes—number of megabytes transferred.
% of MBytes—percentage of megabytes transferred for this policy, compared to all other policies for the
period. For example, if a total of 100,000 megabytes was transferred and 3,000 megabytes was transferred
for one policy, the % of Usage field will display 3%.
7. To change the date range of the report, click Settings. The Reporting Date Range Selector dialog box appears
(Figure 107).
104
SonicWALL ViewPoint User’s Guide
Figure 107: Report Settings Dialog Box
8. Select whether to display a chart and table or a table only.
9. Select from the following:
•
•
To select a period of time before the last summarization, enter the number of days to view before the last
summarization.
To view a specific date range, select the starting and ending dates that you would like to view.
10. When you are finished, click Close. SonicWALL ViewPoint displays the report for the selected date range.
Note: These settings will stay in effect for all similar reports during your active login session.
Viewing Hourly VPN Usage by Policy
The VPN Usage by Policy Hourly report contains information on hourly VPN usage for a SonicWALL appliance,
organized by policy.
To view the VPN Usage by Policy Hourly report, follow these steps:
1. Start and log into SonicWALL ViewPoint.
2. Click the Reports tab.
3. Select a SonicWALL appliance.
4. Expand the VPN Usage tree and click By Policy Hourly. The By Policy Hourly page appears (Figure 108).
Viewing Reports
105
Figure 108: By Policy Hourly Page
5. The table contains the following information:
•
•
•
•
Hour—period of time.
Policy—name of the policy.
Events—number of VPN events.
MBytes—number of megabytes transferred.
6. SonicWALL ViewPoint shows today’s report. To change report settings, click Settings. The Report Settings
dialog box appears (Figure 109).
Figure 109: Report Settings Dialog Box
7. Select the number of items that will be displayed from the Number of Items list box.
8. Select the number of entries per item from the Entries per Item list box.
9. Select the beginning and ending hour that will be displayed in the report.
10. Select the year, month, and day that you would like to view.
106
SonicWALL ViewPoint User’s Guide
11. When you are finished, click Close. SonicWALL ViewPoint displays the report for the selected day.
Note: These settings will stay in effect for all similar reports during your active login session.
Viewing the VPN Services Summary Report
The Services Summary report displays the amount of traffic handled by each service during each hour of the specified day.
To view the Services Summary report, follow these steps:
1. Start and log into SonicWALL ViewPoint.
2. Click the Reports tab.
3. Select a SonicWALL appliance.
4. Expand the VPN Usage tree and click By Service. The By Service page appears (Figure 110).
Figure 110: By Service Page
5. The bar graph displays the amount of bandwidth used by each service during each hour of the day.
6. The table contains the following information:
•
•
•
•
Protocol—the service.
Events—number of events or “hits.”
MBytes—number of megabytes.
% of MBytes—percentage of megabytes transferred by this service on the selected day, compared to all
other services. For example, if 1,000 megabytes were transferred and 900 megabytes were handled by the
HTTP service, the % of Mbytes field will display 90%.
7. SonicWALL ViewPoint shows today’s report. To change report settings, click Settings. The Report Settings
dialog box appears (Figure 111).
Viewing Reports
107
Figure 111: Report Settings Dialog Box
8. Select the type of chart to display from the View Settings area.
9. Select the year, month, and day that you would like to view.
10. When you are finished, click Close. SonicWALL ViewPoint displays the report for the selected day.
Note: These settings will stay in effect for all similar reports during your active login session.
108
SonicWALL ViewPoint User’s Guide
Viewing Attack Reports
Attack reports show the number of attacks that were directed at or through the selected SonicWALL appliance(s).
These include denial of service attacks, intrusions, probes, and all other malicious activity directed at the
SonicWALL appliance or computers on the LAN or DMZ.
Note: All reports appear in the Firewall’s time zone.
Select from the following:
•
•
•
•
•
•
To view a summary of the attacks, see “Viewing the Attack Summary Report” on page 109.
To view the attacks by attack category, see “Viewing the Attacks by Category” on page 110.
To view the attacks by source IP address, see “Viewing the Attacks by Source” on page 112.
To view a summary of the errors and exceptions, see “Viewing the Errors and Exceptions Report” on page 113.
To view attacks over a period of time, see “Viewing Attack Reports Over Time” on page 115.
To view errors and exceptions over a period of time, see “Viewing Errors Over Time” on page 119.
Viewing the Attack Summary Report
The Attack Summary report contains information on the number of attacks attempted on a SonicWALL appliance
or group of SonicWALL appliances during the specified day.
To view the Attack Summary report, follow these steps:
1. Start and log into SonicWALL ViewPoint.
2. Click the Reports tab.
3. Select the global icon, a group, or a SonicWALL appliance.
4. Expand the Attacks tree and click Summary. The Summary page appears (Figure 112).
Figure 112: Summary Page
5. The bar graph displays the number of attacks attempted during each hour of the day. The table contains the following information:
•
•
•
Hour—when the sample was taken.
Attacks—number of attack attempts.
% of Attacks—percentage of attacks during this hour, compared to the day. For example, if 1,000 attacks
occurred during the day and 100 attacks occurred during the 2:00 time period, the % of Attacks field will
display 10%.
Viewing Reports
109
6. SonicWALL ViewPoint shows today’s report. To change report settings, click Settings. The Report Settings
dialog box appears (Figure 113).
Figure 113: Report Settings Dialog Box
7. Select the type of chart to display from the View Settings area.
8. Select the year, month, and day that you would like to view.
9. When you are finished, click Close. SonicWALL ViewPoint displays the report for the selected day.
Viewing the Attacks by Category
The Attacks by Category report displays the attacks that occurred on the specified date, sorted by category.
To view the Attacks by Category report, follow these steps:
1. Start and log into SonicWALL ViewPoint.
2. Click the Reports tab.
3. Select a SonicWALL appliance.
4. Expand the Attacks tree and click By Category. The By Category page appears (Figure 114).
110
SonicWALL ViewPoint User’s Guide
Figure 114: By Category Page
5. The pie chart displays the percentage of each type of attack. To view source and destination information on the
individual attacks, expand the category tree (indicated by a ‘+’ sign).
6. The table contains the following information:
•
•
•
Type—the type of attack.
Attacks—number of attacks.
% of Attacks—percentage of this type of attack, compared to all other attack types. For example, if 5,000
attacks occurred during the day and the IP Spoof makes up 500 of the attacks, its % of Attacks field will
display 10%.
7. By default, SonicWALL ViewPoint shows today’s report, a pie chart, and the ten top categories. To change
these settings, click Settings. The Report Settings dialog box appears (Figure 115).
Figure 115: Report Settings Dialog Box
8. Select the number of categories that will be displayed from the Number of Categories list box.
9. Select the type of chart from the Chart Type list box.
Viewing Reports
111
10. Select the year, month, and day that you would like to view.
11. When you are finished, click Close. SonicWALL ViewPoint displays the report for the selected day.
Note: These settings will stay in effect for all similar reports during your active login session.
Viewing the Attacks by Source
The Attacks by Source report displays the top sources of attacks.
To view the Attacks by Source report, follow these steps:
1. Start and log into SonicWALL ViewPoint.
2. Click the Reports tab.
3. Select a SonicWALL appliance.
4. Expand the Attacks tree and click By Source. The By Source page appears (Figure 116).
Figure 116: By Source Page
5. The pie chart displays the percentage of each source of attack. To view source and destination information on
the individual attacks, expand the source tree (indicated by a ‘+’ sign).
6. The table contains the following information:
•
•
•
Source—the source of the attack.
Attacks—number of attacks.
% of Attacks—percentage of attacks from this source, compared to all other sources. For example, if 1,000
attacks occurred during the day and 500 attacks came from one source, its % of Attacks field will display
50%.
7. By default, SonicWALL ViewPoint shows today’s report, a pie chart, and the ten top sources. To change these
settings, click Settings. The Report Settings dialog box appears (Figure 117).
112
SonicWALL ViewPoint User’s Guide
Figure 117: Report Settings Dialog Box
8. Select the number of sources that will be displayed from the Number of Sources list box.
9. Select the type of chart from the Chart Type list box.
10. Select the year, month, and day that you would like to view.
11. When you are finished, click Close. SonicWALL ViewPoint displays the report for the selected day.
Note: These settings will stay in effect for all similar reports during your active login session.
Viewing the Errors and Exceptions Report
The Errors and Exceptions Summary report contains information on the number of dropped packets on a
SonicWALL appliance or group of SonicWALL appliances during the specified day.
To view the Errors and Exceptions report, follow these steps:
1. Start and log into SonicWALL ViewPoint.
2. Click the Reports tab.
3. Select the global icon, a group, or a SonicWALL appliance.
4. Expand the Attacks tree and click Errors & Exceptions. The Errors & Exceptions page appears (Figure 118).
Viewing Reports
113
Figure 118: Errors & Exceptions Page
5. The bar graph displays the packets that were dropped during each hour of the day.
6. The table contains the following information:
•
•
•
Hour—when the sample was taken.
Packets—number of dropped packets.
% of Packets—percentage of packets dropped during this hour, compared to the day. For example, if 1,000
packets were dropped during the day and 100 packets were dropped during the 1:00 time period, the % of
Packets field will display 10%.
7. SonicWALL ViewPoint shows today’s report. To change report settings, click Settings. The Report Settings
dialog box appears (Figure 119).
Figure 119: Report Settings Dialog Box
8. Select the type of chart to display from the View Settings area.
9. Select the year, month, and day that you would like to view.
10. When you are finished, click Close. SonicWALL ViewPoint displays the report for the selected day.
114
SonicWALL ViewPoint User’s Guide
Viewing Attack Reports Over Time
The Attacks Over Time report displays the daily number of attempted attacks during the specified time period.
To view the Attacks Over Time report, follow these steps:
1. Start and log into SonicWALL ViewPoint.
2. Click the Reports tab.
3. Select the global icon, a group, or a SonicWALL appliance.
4. Expand the Attacks tree and click Attacks Over Time. The Attacks Over Time page appears (Figure 120).
Figure 120: Attacks Over Time Page
5. The bar graph displays the number of attacks attempted each day of the specified time period.
6. The table contains the following information:
•
•
•
Date—when the sample was taken.
Attacks—number of attacks.
% of Attacks—percentage of attacks on this day, compared to the time period. For example, if 10,000
attacks occurred during the time period and 1,000 attacks occurred on Thursday, its % of Attacks field will
display 10%.
7. To change the date range of the report, click Settings. The Reporting Date Range Selector dialog box appears
(Figure 121).
Viewing Reports
115
Figure 121: Report Settings Dialog Box
8. Select whether to display a chart and table or a table only.
9. Select from the following:
•
•
To select a period of time before the last summarization, enter the number of days to view before the last
summarization.
To view a specific date range, select the starting and ending dates that you would like to view.
10. When you are finished, click Close. SonicWALL ViewPoint displays the report for the selected date range.
Note: These settings will stay in effect for all similar reports during your active login session.
Viewing the Attacks by Category Over Time
The Categories Over Time report displays the number of attacks in each attack category during the specified time
period.
To view the Categories Over Time report, follow these steps:
1. Start and log into SonicWALL ViewPoint.
2. Click the Reports tab.
3. Select the global icon, a group, or a SonicWALL appliance.
4. Expand the Attacks tree and click Categories Over Time. The Categories Over Time page appears
(Figure 122).
116
SonicWALL ViewPoint User’s Guide
Figure 122: Categories Over Time Page
5. The bar graph displays the number of attacks attempted each day of the specified time period. To view source
and destination information on the individual attacks, expand the category tree (indicated by a ‘+’ sign).
6. The table contains the following information:
•
•
•
Category—category of the attack.
Attacks—number of attacks.
% of Attacks—percentage of attacks for this category, compared to other categories. For example, if 5,000
attacks occurred during the time period and 1,000 attacks occurred for a category, its % of Attacks field
will display 20%.
7. To change the date range of the report, click Settings. The Reporting Date Range Selector dialog box appears
(Figure 123).
Figure 123: Report Settings Dialog Box
8. Select whether to display a chart and table or a table only.
Viewing Reports
117
9. Select from the following:
•
•
To select a period of time before the last summarization, enter the number of days to view before the last
summarization.
To view a specific date range, select the starting and ending dates that you would like to view.
10. When you are finished, click Close. SonicWALL ViewPoint displays the report for the selected date range.
Note: These settings will stay in effect for all similar reports during your active login session.
Sources Over Time
The Source Over Time report displays the number of attacks from each major source during the specified time
period.
To view the Sources Over Time report, follow these steps:
1. Start and log into SonicWALL ViewPoint.
2. Click the Reports tab.
3. Select the global icon, a group, or a SonicWALL appliance.
4. Expand the Attacks tree and click Sources Over Time. The Sources Over Time page appears (Figure 124).
Figure 124: Sources Over Time Page
5. The bar graph displays the number of attacks attempted each day of the specified time period. To view source
and destination information on the individual attacks, expand the source tree (indicated by a ‘+’ sign).
6. The table contains the following information:
•
•
•
Source—source of the attack.
Attacks—number of attacks.
% of Attacks—percentage of attacks from this source, compared to other sources. For example, if 2,000
attacks occurred during the time period and 1,000 attacks occurred from a source, its % of Attacks field
will display 50%.
7. To change the date range of the report, click Settings. The Reporting Date Range Selector dialog box appears
(Figure 123).
118
SonicWALL ViewPoint User’s Guide
Figure 125: Report Settings Dialog Box
8. Select whether to display a chart and table or a table only.
9. Select from the following:
•
•
To select a period of time before the last summarization, enter the number of days to view before the last
summarization.
To view a specific date range, select the starting and ending dates that you would like to view.
10. When you are finished, click Close. SonicWALL ViewPoint displays the report for the selected date range.
Note: These settings will stay in effect for all similar reports during your active login session.
Viewing Errors Over Time
The Errors Over Time report displays the number of errors during the specified time period.
To view the Errors Over Time report, follow these steps:
1. Start and log into SonicWALL ViewPoint.
2. Click the Reports tab.
3. Select the global icon, a group, or a SonicWALL appliance.
4. Expand the Attacks tree and click Errors Over Time. The Errors Over Time page appears (Figure 126).
Viewing Reports
119
Figure 126: Errors Over Time Page
5. The bar graph displays the number of packets that were dropped during each day of the specified time period.
6. The table contains the following information:
•
•
•
Date—when the sample was taken.
Dropped Packets—number of dropped packets.
% of Errors—percentage of dropped packets on this day, compared to the time period. For example, if
10,000 packets were dropped during the time period and 1,000 packets were dropped on Wednesday, its %
of Attacks field will display 10%.
7. To change the date range of the report, click Settings. The Reporting Date Range Selector dialog box appears
(Figure 127).
Figure 127: Report Settings Dialog Box
8. Select whether to display a chart and table or a table only.
120
SonicWALL ViewPoint User’s Guide
9. Select from the following:
•
•
To select a period of time before the last summarization, enter the number of days to view before the last
summarization.
To view a specific date range, select the starting and ending dates that you would like to view.
10. When you are finished, click Close. SonicWALL ViewPoint displays the report for the selected date range.
Note: These settings will stay in effect for all similar reports during your active login session.
Viewing Reports
121
Viewing Intrusion Prevention Reports
The Intrusion Prevention Service (IPS) reports show the number of attempted intrusions that occurred during the
specified time period.
Note: All reports appear in the Firewall’s time zone.
Select from the following:
•
•
•
•
•
•
To view a summary of the attacks, see “Viewing the Intrusion Prevention Summary Report” on page 122.
To view the attacks by attack category, see “Viewing the Intrusions by Destination” on page 123.
To view the attacks by source IP address, see “Viewing the Attacks by Source” on page 112.
To view a summary of the errors and exceptions, see “Viewing the Errors and Exceptions Report” on page 113.
To view attacks over a period of time, see “Viewing Attack Reports Over Time” on page 115.
To view errors and exceptions over a period of time, see “Viewing Errors Over Time” on page 119.
Viewing the Intrusion Prevention Summary Report
The Attack Summary report contains information on the number of attempted intrusions on a SonicWALL appliance or group of SonicWALL appliances during the specified day.
To view the IPS Summary report, follow these steps:
1. Start and log into SonicWALL ViewPoint.
2. Click the Reports tab.
3. Select the global icon, a group, or a SonicWALL appliance.
4. Expand the Intrusion Prevention tree and click Summary. The Summary page appears (Figure 128).
Figure 128: Summary Page
5. The bar graph displays the number of intrusions attempted during each hour of the day. The table contains the
following information:
•
•
•
122
Hour—when the sample was taken.
Attacks—number of intrusion attempts.
% of Attacks—percentage of intrusions during this hour, compared to the day. For example, if 1,000 intrusions occurred during the day and 100 intrusions occurred during the 2:00 time period, the % of Intrusions
field will display 10%.
SonicWALL ViewPoint User’s Guide
6. SonicWALL ViewPoint shows today’s report. To change report settings, click Settings. The Report Settings
dialog box appears (Figure 129).
Figure 129: Report Settings Dialog Box
7. Select the type of chart to display from the View Settings area.
8. Select the year, month, and day that you would like to view.
9. When you are finished, click Close. SonicWALL ViewPoint displays the report for the selected day.
Viewing the Intrusions by Destination
The Intrusions by Destination report displays the top destinations from which intrustions were attempted. To view
the Attacks by Destination report, follow these steps:
1. Start and log into SonicWALL ViewPoint.
2. Click the Reports tab.
3. Select a SonicWALL appliance.
4. Expand the Intrusion Prevention tree and click By Destination. The By Destination page appears (Figure 130).
Viewing Reports
123
Figure 130: By Destination Page
5. The pie chart displays the percentage of intrusion attempts that occured from each destination.
6. The table contains the following information:
•
•
•
Destination—IP address or hostname of the destination.
Intrusions—number of intrusions.
% of Intrusions—percentage of intrusions from this destination, compared to all other destinations. For
example, if 5,000 intrusion attempts occurred during the day and 500 came from 108.12.11.2, its % of
Intrusions field will display 10%.
7. By default, SonicWALL ViewPoint shows today’s report, a pie chart, and the ten top categories. To change
these settings, click Settings. The Report Settings dialog box appears (Figure 131).
Figure 131: Report Settings Dialog Box
8. Select the number of categories that will be displayed from the Number of Categories list box.
9. Select the type of chart from the Chart Type list box.
10. Select the year, month, and day that you would like to view.
124
SonicWALL ViewPoint User’s Guide
11. When you are finished, click Close. SonicWALL ViewPoint displays the report for the selected day.
Note: These settings will stay in effect for all similar reports during your active login session.
Viewing the Intrusions by Source
The Intrusions by Source report displays the IP addresses of the sources which originated the request that caused an
intrusion attempt. For example, if the system at IP address 192.168.1.102 issued a request to the system at
102.1.22.3 and 102.1.22.3 made an intrusion attempt, 192.168.1.102 would be listed as the source in the By Source
report.
To view the Intrusions by Source report, follow these steps:
1. Start and log into SonicWALL ViewPoint.
2. Click the Reports tab.
3. Select a SonicWALL appliance.
4. Expand the Intrusion Prevention tree and click By Source. The By Source page appears (Figure 132).
Figure 132: By Source Page
5. The pie chart displays the percentage of each source.
6. The table contains the following information:
•
•
•
Source—the source that made the request.
Intrusion Prevention—number of intrusions.
% of Intrusions—percentage of intrusions caused by this source’s request, compared to all other sources.
For example, if 1,000 intrusion attempts occurred during the day and 500 intrusion attempts came through
the activities of one source, its % of Intrusions field will display 50%.
7. By default, SonicWALL ViewPoint shows today’s report, a pie chart, and the ten top sources. To change these
settings, click Settings. The Report Settings dialog box appears (Figure 133).
Viewing Reports
125
Figure 133: Report Settings Dialog Box
8. Select the number of sources that will be displayed from the Number of Sources list box.
9. Select the type of chart from the Chart Type list box.
10. Select the year, month, and day that you would like to view.
11. When you are finished, click Close. SonicWALL ViewPoint displays the report for the selected day.
Note: These settings will stay in effect for all similar reports during your active login session.
Top Intrusions
The Top Intrusions report displays the types of intrustions that occurred on the specified date.
To view the Top Intrusions report, follow these steps:
1. Start and log into SonicWALL ViewPoint.
2. Click the Reports tab.
3. Select a SonicWALL appliance.
4. Expand the Intrusion Prevention tree and click Top Intrusions. The Top Intrusions page appears (Figure 134).
126
SonicWALL ViewPoint User’s Guide
Figure 134: Top Intrusions Page
5. The pie chart displays the percentage of each type of intrusion attempt. To view source and destination information on the individual intrusion attempts, expand the category tree (indicated by a ‘+’ sign).
6. The table contains the following information:
•
•
•
Category—the type of intrusion.
Intrusions—number of intrusion attempts.
% of Intrusions—percentage of this type of intrusion, compared to all other intrusion types. For example,
if 5,000 intrusion attempts occurred during the day and Web IIS attempts makes up 3,000 of the intrusion
attempts, its % of Intrusions field will display 60%.
7. By default, SonicWALL ViewPoint shows today’s report, a pie chart, and the ten top categories. To change
these settings, click Settings. The Report Settings dialog box appears (Figure 135).
Figure 135: Report Settings Dialog Box
8. Select the number of categories that will be displayed from the Number of Categories list box.
9. Select the type of chart from the Chart Type list box.
10. Select the year, month, and day that you would like to view.
Viewing Reports
127
11. When you are finished, click Close. SonicWALL ViewPoint displays the report for the selected day.
Note: These settings will stay in effect for all similar reports during your active login session.
Top Intrusions by Priority
The By Priority report displays the types of intrustions that occurred on the specified date, ranked by Priority.
To view the By Priority report, follow these steps:
1. Start and log into SonicWALL ViewPoint.
2. Click the Reports tab.
3. Select a SonicWALL appliance.
4. Expand the Intrusion Prevention tree and click By Priority. The By Priority page appears (Figure 136).
Figure 136: By Priority Page
5. The pie chart displays the percentage of each type of intrusion attempt. To view source and destination information on the individual intrusion attempts, expand the category tree (indicated by a ‘+’ sign).
6. The table contains the following information:
•
•
•
•
•
Priority—priority level of the intrusion.
Category—the type of intrusion.
Intrusion—name of the intrusion.
Events—number of intrusion attempts.
% of Intrusions—percentage of this type of intrusion, compared to all other intrusion types. For example,
if 5,000 intrusion attempts occurred during the day and Web IIS cmd.exe access attempts makes up 2,000 of
the intrusion attempts, its % of Intrusions field will display 40%.
7. By default, SonicWALL ViewPoint shows today’s report, a pie chart, and the ten top categories. To change
these settings, click Settings. The Report Settings dialog box appears (Figure 137).
128
SonicWALL ViewPoint User’s Guide
Figure 137: Report Settings Dialog Box
8. Select the number of categories that will be displayed from the Number of Categories list box.
9. Select the type of chart from the Chart Type list box.
10. Select the year, month, and day that you would like to view.
11. When you are finished, click Close. SonicWALL ViewPoint displays the report for the selected day.
Note: These settings will stay in effect for all similar reports during your active login session.
Viewing Intrusions Over Time
The Over Time report displays the daily number of intrusion attempts during the specified time period.
To view the Intrusions Over Time report, follow these steps:
1. Start and log into SonicWALL ViewPoint.
2. Click the Reports tab.
3. Select the global icon, a group, or a SonicWALL appliance.
4. Expand the Intrusion Prevention tree and click Intrusions Over Time. The Intrusions Over Time page appears
(Figure 138).
Viewing Reports
129
Figure 138: Intrusions Over Time Page
5. The bar graph displays the number of intrusions attempted each day of the specified time period.
6. The table contains the following information:
•
•
•
Date—when the sample was taken.
Intrusions—number of intrusion attempts.
% of Intrusions—percentage of intrusion attempts on this day, compared to the time period. For example,
if 10,000 intrusion attempts occurred during the time period and 1,000 intrusion attempts occurred on
Thursday, its % of Intrusions field will display 10%.
7. To change the date range of the report, click Settings. The Reporting Date Range Selector dialog box appears
(Figure 139).
Figure 139: Report Settings Dialog Box
8. Select whether to display a chart and table or a table only.
130
SonicWALL ViewPoint User’s Guide
9. Select from the following:
•
•
To select a period of time before the last summarization, enter the number of days to view before the last
summarization.
To view a specific date range, select the starting and ending dates that you would like to view.
10. When you are finished, click Close. SonicWALL ViewPoint displays the report for the selected date range.
Note: These settings will stay in effect for all similar reports during your active login session.
Viewing Intrusions by Destination Over Time
The Destinations Over Time report displays the top destinations from which intrustions were attempted during the
specified time period. To view the Destinations Over Time report, follow these steps:
1. Start and log into SonicWALL ViewPoint.
2. Click the Reports tab.
3. Select the global icon, a group, or a SonicWALL appliance.
4. Expand the Intrusion Prevention tree and click Destinations Over Time. The Destinations Over Time page
appears (Figure 140).
Figure 140: Destinations Over Time Page
5. The bar graph displays the number of attacks attempted each day of the specified time period.
6. The table contains the following information:
• Destination—IP address or hostname of the destination.
• Intrusions—number of intrusions.
• % of Intrusions—percentage of intrusions from this destination, compared to all other destinations. For
example, if 5,000 intrusion attempts occurred during this period and 500 came from 108.12.11.2, its % of
Intrusions field will display 10%.
7. To change the date range of the report, click Settings. The Reporting Date Range Selector dialog box appears
(Figure 123).
Viewing Reports
131
Figure 141: Report Settings Dialog Box
8. Select whether to display a chart and table or a table only.
9. Select from the following:
•
•
To select a period of time before the last summarization, enter the number of days to view before the last
summarization.
To view a specific date range, select the starting and ending dates that you would like to view.
10. When you are finished, click Close. SonicWALL ViewPoint displays the report for the selected date range.
Note: These settings will stay in effect for all similar reports during your active login session.
Sources Over Time
The Source Over Time report displays the IP addresses of the sources which originated the request that caused an
intrusion attempt. For example, if the system at IP address 192.168.1.102 issued a request to the system at
102.1.22.3 and 102.1.22.3 made an intrusion attempt, 192.168.1.102 would be listed as the source in the Source
Over Time report.
To view the Source Over Time report, follow these steps:
1. Start and log into SonicWALL ViewPoint.
2. Click the Reports tab.
3. Select a SonicWALL appliance.
4. Expand the Intrusion Prevention tree and click Sources Over Time. The Sources Over Time page appears
(Figure 142).
132
SonicWALL ViewPoint User’s Guide
Figure 142: Sources Over Time Page
5. The pie chart displays the percentage of each source.
6. The table contains the following information:
•
•
•
Source—the source that made the request.
Intrusions—number of intrusions.
% of Intrusions—percentage of intrusions caused by this source’s request, compared to all other sources.
For example, if 1,000 intrusion attempts occurred during the day and 500 intrusion attempts came through
the activities of one source, its % of Intrusions field will display 50%.
7. To change the date range of the report, click Settings. The Reporting Date Range Selector dialog box appears
(Figure 143).
Figure 143: Report Settings Dialog Box
8. Select whether to display a chart and table or a table only.
Viewing Reports
133
9. Select from the following:
•
•
To select a period of time before the last summarization, enter the number of days to view before the last
summarization.
To view a specific date range, select the starting and ending dates that you would like to view.
10. When you are finished, click Close. SonicWALL ViewPoint displays the report for the selected date range.
Note: These settings will stay in effect for all similar reports during your active login session.
Top Intrusions Over Time
The Intrusions Over Time report displays the top types of intrustions that occurred during the specified time period.
To view the Intrusions Over Time report, follow these steps:
1. Start and log into SonicWALL ViewPoint.
2. Click the Reports tab.
3. Select a SonicWALL appliance.
4. Expand the Intrusion Prevention tree and click Intrusions Over Time. The Intrusions Over Time page appears
(Figure 144).
Figure 144: Intrusions Over Time Page
5. The pie chart displays the percentage of each type of intrusion attempt.
6. The table contains the following information:
•
•
•
Type—the type of intrusion.
Intrusions—number of intrusion attempts.
% of Intrusions—percentage of this type of intrusion, compared to all other intrusion types. For example,
if 5,000 intrusion attempts occurred during the day and Web IIS attempts makes up 3,000 of the intrusion
attempts, its % of Intrusions field will display 60%.
7. To change the date range of the report, click Settings. The Reporting Date Range Selector dialog box appears
(Figure 145).
134
SonicWALL ViewPoint User’s Guide
Figure 145: Report Settings Dialog Box
8. Select whether to display a chart and table or a table only.
9. Select from the following:
•
•
To select a period of time before the last summarization, enter the number of days to view before the last
summarization.
To view a specific date range, select the starting and ending dates that you would like to view.
10. When you are finished, click Close. SonicWALL ViewPoint displays the report for the selected date range.
Note: These settings will stay in effect for all similar reports during your active login session.
Viewing Reports
135
Viewing Authentication Reports
The login reports show user logins, administrator logins, and failed login attempts for users and administrators.
Note: All reports appear in the Firewall’s time zone.
Select from the following:
•
•
•
To view user logins, see “Viewing the User Login Report” on page 136.
To view administrator logins, see “Viewing the Administrator Login Report” on page 137.
To view failed login attempts, see “Viewing the Failed Login Report” on page 139.
Viewing the User Login Report
The user login report shows users that logged on to the SonicWALL appliance during the specified day to bypass
content filtering or to remotely access local network resources.
To view the User Login report, follow these steps:
1. Start and log into SonicWALL ViewPoint.
2. Click the Reports tab.
3. Select a SonicWALL appliance.
4. Expand the Authentication tree and click User Login. The User Login page appears (Figure 146).
Figure 146: User Login Page
5. The table contains the following information:
•
•
User—the user name.
Time—time the user logged in.
6. SonicWALL ViewPoint shows today’s report. To change report settings, click Settings. The Report Settings
dialog box appears (Figure 147).
136
SonicWALL ViewPoint User’s Guide
Figure 147: Report Settings Dialog Box
7. Select the type of chart to display from the View Settings area.
8. Select the year, month, and day that you would like to view.
9. When you are finished, click Close. SonicWALL ViewPoint displays the report for the selected day.
Viewing the Administrator Login Report
The administrator login report shows successful administrator logins during the specified day. This report is useful
for identifying misuse and unauthorized management of a SonicWALL appliance.
To view the Admin Login report, follow these steps:
1. Start and log into SonicWALL ViewPoint.
2. Click the Reports tab.
3. Select a SonicWALL appliance.
4. Expand the Authentication tree and click Admin Login. The Admin Login page appears (Figure 148).
Viewing Reports
137
Figure 148: Admin Login Page
5. The table contains the following information:
•
•
User—the user name.
Time—time the user logged in.
6. SonicWALL ViewPoint shows today’s report. To change report settings, click Settings. The Report Settings
dialog box appears (Figure 149).
Figure 149: Report Settings Dialog Box
7. Select the type of chart to display from the View Settings area.
8. Select the year, month, and day that you would like to view.
9. When you are finished, click Close. SonicWALL ViewPoint displays the report for the selected day.
138
SonicWALL ViewPoint User’s Guide
Viewing the Failed Login Report
The failed login reports shows failed login attempts for users and administrators that attempted to log on to the
SonicWALL appliance during the specified day. This report is useful for identifying unauthorized access attempts
and potentially malicious activity.
To view the Failed Login report, follow these steps:
1. Start and log into SonicWALL ViewPoint.
2. Click the Reports tab.
3. Select a SonicWALL appliance.
4. Expand the Authentication tree and click Failed Login. The Failed Login page appears (Figure 150).
Figure 150: Failed Login Page
5. The table contains the following information:
• User—the user name.
• Time—time the user logged in.
• IP Address—IP address of the user.
6. SonicWALL ViewPoint shows today’s report. To change report settings, click Settings. The Report Settings
dialog box appears (Figure 151).
Viewing Reports
139
Figure 151: Report Settings Dialog Box
7. Select the type of chart to display from the View Settings area.
8. Select the year, month, and day that you would like to view.
9. When you are finished, click Close. SonicWALL ViewPoint displays the report for the selected day.
140
SonicWALL ViewPoint User’s Guide
Viewing the Log
The Log Viewer contains detailed information on each transaction that occurred on the SonicWALL appliance. This
information is stored for the time that you specified in the configuration settings.
Note: The Log Viewer displays raw log information for every connection. Depending on the amount of traffic, this
can quickly consume a large amount of space in the database. It is highly recommended to be careful when choosing the number of days of information that will be stored. For more information, see “Configuring Reporting Settings” on page 35.
Viewing the Log for a SonicWALL Appliance
To view the Log, follow these steps:
1. Start and log into SonicWALL ViewPoint.
2. Click the Reports tab.
3. Select a SonicWALL appliance.
4. Expand the Log Viewer tree and click Search. The Search page appears (Figure 152).
Figure 152: Search Page
5. Select the date to view from the Date list box.
6. Enter the starting time of events to view in the Start Time field.
7. Enter the ending time of events to view in the End Time field.
8. Select the type of events to view from the Message Category list box.
9. Enter the source IP address to view in the Source IP Address field. To view all IP addresses, enter All.
10. Enter the destination IP address to view in the Destination IP Address field. To view all IP addresses, enter
All.
11. Select the number of entries to display per page from the Results Per Page field.
12. Click Generate Report. The Log Viewer Results page appears (Figure 153).
Viewing Reports
141
Figure 153: Log Viewer Results Page
13. Search through the entries to find the information for which you are searching. To view the next page of entries,
click Next.
14. To generate another report, click Search again in the Log Viewer Tree.
142
SonicWALL ViewPoint User’s Guide
CHAPTER 5
Scheduling SonicWALL ViewPoint
SonicWALL ViewPoint can automatically send reports to any e-mail addresses that you specify.
To view currently scheduled reports or configure new reports, follow these steps:
1. Start and log into SonicWALL ViewPoint.
2. Click the Reports tab.
3. Select a SonicWALL appliance.
4. Expand the Configuration tree and click Scheduled Reports. The Scheduled Reports page appears
(Figure 154).
Figure 154: Scheduled Reports Page
5. The Scheduled Reports page contains a list of currently scheduled reports. To edit a report, select its radio button and click Edit. To delete a report, select its radio button and click Delete.
6. To e-mail a currently scheduled report now, click E-mail Reports Now.
Note: Scheduled reports will send data for the previous day, week, or month. If you click E-mail Reports Now,
information for the current period will be reported, based on the most recently summarized data.
This will not affect the normally scheduled report.
Select from the following:
• To create a new daily report, see “Scheduling a Daily Report” on page 144.
• To create a new weekly or monthly report, see “Scheduling a Weekly or Monthly Report” on page 146.
Scheduling SonicWALL ViewPoint
143
Scheduling a Daily Report
By default, daily reports are sent out once a day at 03:00 GMT and contain information for the previous day. To
change when they are sent, see “Configuring Email/Archive Settings” on page 22. To configure a new daily report,
follow these steps:
1. From the Scheduled Reports page, click the Add Daily Report button. The Daily Reports page appears
(Figure 155).
Figure 155: Daily Reports Page
2. Enter a name for the report in the Scheduled Report Name field.
3. To send the report, select the Email check box.
4. By default, the SonicWALL ViewPoint will use the Simple Mail Transfer Protocol (SMTP) server that was
specified during installation. To change it, enter the IP address or hostname of the SMTP server in the SMTP
Server Address field.
5. Enter the Destination e-mail addresses in the Destination Email Addresses field. Make sure each e-mail
address is separated by a semicolon (;).
6. By default, SonicWALL ViewPoint will use the e-mail address of the user logged into SonicWALL ViewPoint
as the Sender e-mail address. To change it, enter a new Sender e-mail address in the Source Email Address
field.
7. Enter the Subject Line that will appear in reports sent from SonicWALL ViewPoint in the Email Subject field.
8. Enter text that will appear in the message body in the Email Body field.
9. To copy the contents of the report into the body of the email message, select the Send Reports Inline check
box. To send the file as an email attachment, make sure this check box is deselected.
Note: Reports can only be sent inline when all data is sent in a single report.
10. To archive the file on the server’s hard disk, select the Archive check box and enter a path in the Save Directory field.
Specify the directory where the file will be archive in the Save Directory field.
11. Optional. To specify a specific date, enter the date in the Report Date field.
12. If you are using custom reports, specify the folder location of the template files in the Template Folder Name
field. For more information, see Appendix B, “Customized Reports.”
13. To compress the reports into a single file, select the Zip Reports into a single file check box.
14. To include all of the data in a single report, select the Include all data in a single report check box.
144
SonicWALL ViewPoint User’s Guide
15. To password-protect the Zip file, select the Password Protect the Zip File check box and enter the password in
the Password field.
16. To only display data for a specified group of web sites or users, enter the URL of each site and username of
each user (separated by commas) in the User/Server Filter field. Because this field uses pattern matching,
entries such as “yahoo.com” will display data for mail.yahoo.com and shopping.yahoo.com. Entries such as
“john” will display data for johnm, 123john, and so on.
17. Select the daily reports that will be included in the e-mail message:
• User Login—shows users that logged on to the SonicWALL appliance to bypass content filtering or to
remotely access local network resources.
• Admin Login—shows successful administrator logins for the SonicWALL appliance.
• Failed Login—shows failed login attempts for users and administrators that attempted to log on through
the SonicWALL appliance.
• Status Summary—status of the SonicWALL appliance during each hour.
• Bandwidth Summary—amount of traffic handled by the SonicWALL appliance during each hour.
• Bandwidth Top Users—displays the users who used the most bandwidth.
• Service Summary—amount of traffic handled by each service during each hour.
• VPN Summary—amount of VPN traffic handled by the SonicWALL appliance during each hour.
• VPN Top Users—displays the users who used the most VPN bandwidth.
• VPN By Policy—displays VPN usage by policy.
• VPN By Policy hourly—displays hourly VPN usage by policy.
• VPN By Service—displays VPN usage by service.
• Web Usage Summary—amount of HTTP bandwidth handled by the SonicWALL appliance during each
hour of the day.
• Web Usage Top Sites—displays the web sites that used the most HTTP bandwidth.
• Web Usage Top Users—displays the users who used the most HTTP bandwidth.
• Web Usage Sites By User, By Site—displays a list of all users, their top sites, the number of hits to each
site, and the amount of data transferred.
• Web Filter Summary—displays the number of times users attempt to access blocked sites during each
hour.
• Web Filter Top Sites—displays the top blocked web sites that users attempted to access.
• Web Filter Top Users—displays the users who made the most attempts to access blocked sites.
• Web Filter Sites By User, By Site—displays a list of all users, their top sites, and the number of attempts
that were made to access each site.
• FTP Usage Summary—amount of FTP bandwidth handled by the SonicWALL appliance.
• FTP Usage Top Users—displays the users who used the most FTP bandwidth.
• Mail Usage Summary—amount of mail handled by the SonicWALL appliance.
• Mail Usage Top Users—displays the users who sent and received the most mail.
• Attacks Summary—number of attack attempted on the SonicWALL appliance.
• Attacks By Category—displays the attacks that occurred, sorted by category.
• Attacks By Source—displays the top sources of attacks.
• Attacks Errors and Exceptions—number of errors and exceptions on the SonicWALL appliance.
• Intrusion Summary—number of intrusions attempted on the SonicWALL appliance.
• Intrusions By Category—displays the intrusion attempts that occurred, sorted by category.
• Intrusions By Source—displays the top source that generated intrusion attempts.
• Intrusions By Destinaton—displays the top destinations that generated intrusion attempts.
18. When you are finished, click Add. The new report will appear in the list on the Scheduled Reports page.
Note: The report will run based on the settings that you specified and will use the default display settings. To
change the display settings, see “Configuring Presentation Options” on page 24.
Scheduling SonicWALL ViewPoint
145
Scheduling a Weekly or Monthly Report
By default, weekly reports are sent out every Monday at 03:00 GMT and contain information for the previous
week. Monthly reports are sent out on the second day of every month at 03:00 GMT and contain information for the
previous month. To change when they are sent, see “Configuring Email/Archive Settings” on page 22. To configure
a new weekly or monthly report, follow these steps:
1. From the Scheduled Reports page, click the Add Multi-Day Report button. The Multi-Day Reports page
appears (Figure 156).
Figure 156: Multi-Day Reports Page
2. Enter a name for the report in the Scheduled Report Name field.
3. To send the report, select the Email check box.
4. By default, SonicWALL ViewPoint will use the Simple Mail Transfer Protocol (SMTP) server that was specified during installation. To change it, enter the IP address or hostname of the SMTP server in the SMTP Server
Address field.
5. Enter the Destination e-mail addresses in the Destination Email Addresses field. Make sure each e-mail
address is separated by a semicolon (;).
6. By default, SonicWALL ViewPoint will use the e-mail address of the user logged into SonicWALL ViewPoint
as the Sender e-mail address. To change it, enter a new Sender e-mail address in the Source Email Address
field.
7. Enter the Subject Line that will appear in reports sent from SonicWALL ViewPoint in the Email Subject field.
8. Enter text that will appear in the message body in the Email Body field.
9. To copy the contents of the report into the body of the email message, select the Send Reports Inline check
box. To send the file as an email attachment, make sure this check box is deselected.
Note: Reports can only be sent inline when all data is sent in a single report.
10. To archive the file on the server’s hard disk, select the Archive check box and enter a path in the Save Directory field.
Specify the directory where the file will be archive in the Save Directory field.
11. Select whether the report will be sent Weekly or Monthly.
12. Optional. To specify a specific date, enter the date in the Report Date field.
13. If you are using custom reports, specify the folder location of the template files in the Template Folder Name
field. For more information, see Appendix B, “Customized Reports.”
14. To compress the reports into a single file, select the Zip Reports into a single file check box.
146
SonicWALL ViewPoint User’s Guide
15. To include all of the data in a single report, select the Include all data in a single report check box.
16. To password-protect the Zip file, select the Password Protect the Zip File check box and enter the password in
the Password field.
17. To only display data for a specified group of web sites or users, enter the URL of each site and username of
each user (separated by commas) in the User/Server Filter field. Because this field uses pattern matching,
entries such as “yahoo.com” will display data for mail.yahoo.com and shopping.yahoo.com. Entries such as
“john” will display data for johnm, 123john, and so on.
18. Select the reports that will be included in the e-mail message:
• Status Over Time—displays the status of the SonicWALL appliance for the week or month.
• Bandwidth Over Time—displays the daily amount of traffic handled by the SonicWALL appliance for the
week or month.
• Bandwidth Top Users Over Time—displays the top users of bandwitdth handled by the SonicWALL
appliance for the week or month.
• Web Usage Over Time—displays the daily amount of HTTP bandwidth handled by the SonicWALL appliance for the week or month.
• Web Usage Top Sites Over Time—displays the top sites for the week or month.
• Web Usage Top Users Over Time—displays the top users for the week or month.
• Web Usage By Users Over Time—displays the web usage by users for the week or month.
• Web Filter Over Time—displays the number of attempts that were made to access blocked web sites for
the week or month.
• Web Filter Top Sites Over Time—displays the top filtered sites for the week or month.
• Web Filter Top Users Over Time—displays the top users trying to access filtered sites for the week or
month.
• Web Filter By Users Over Time—displays web filtering by user for the week or month.
• FTP Usage Over Time—displays the daily amount of FTP bandwidth handled by the SonicWALL appliance for the week or month.
• FTP Usage Top Users Over Time—displays the top FTP users for the week or month.
• Mail Usage Over Time—displays the daily amount of mail handled by the SonicWALL appliance for the
week or month.
• Mail Usage Top Users Over Time—displays the top Mail users for the week or month.
• Attacks Over Time—displays the daily number of attacks attempted during the week or month.
• Attacks Categories Over Time—displays the attacks that occurred during the week or month, sorted by
category.
• Attacks Sources Over Time—displays the top sources of attacks during the week or month.
• Attacks Errors and Exceptions Over Time—number of errors and exceptions on the SonicWALL appliance during the week or month.
• VPN Usage Over Time—displays daily number of VPN connections during the week or month.
• VPN Usage Top Users Over Time—displays the users who used the most VPN bandwidth during the
week or month.
• Drop Packets Over Time—displays the number of packet errors during the week or month.
• VPN By Policy Over Time—displays VPN usage by policy during the week or month.
• Intrusions Over Time—number of intrusions attempted on the SonicWALL appliance during the week or
month.
• Intrusions By Categories Over Time—displays the intrusion attempts that occurred during the week or
month, sorted by category.
• Intrusions By Sources Over Time—displays the top source that generated intrusion attempts during the
week or month.
• Intrusions By Destinatons Over Time—displays the top destinations that generated intrusion attempts
during the week or month.
19. When you are finished, click Add. The new report will appear in the list on the Scheduled Reports page.
Scheduling SonicWALL ViewPoint
147
148
SonicWALL ViewPoint User’s Guide
APPENDIX A
Technical Tips
Uninstalling the ViewPoint Web Server from the DOS Prompt
To uninstall the SonicWALL ViewPoint Web Server from the DOS prompt, change to the <sgms_directory>:\Tomdirectory and enter the following command:
cat\bin
service -uninstall 'ViewPoint Web Server'
Changing the ViewPoint Web Server Port Number
During installation, you can specify a different port number for the ViewPoint Web Server. To do so, follow these
steps:
1. Open the following file:
<viewpoint_directory>:/Tomcat/conf/server.xml
2. Locate the following line:
Parameter name="port" value="80"
3. Change the default value of 80 to another port number:
4. Save the file and exit.
Changing the SonicWALL ViewPoint IP Address
If you changed the IP address of the SonicWALL ViewPoint server, follow these steps:
1. Stop all SonicWALL ViewPoint services.
2. Execute the following SQL commands from a DOS window:
osql -U <userid> -P <password> -Q "update sgmsdb.dbo.schedulers set ipAddress = 'new ip' where
ipAddress = 'old ip'"
3. Restart all SonicWALL ViewPoint services.
Changing the Default Syslog Server Port Number
By default, the SonicWALL ViewPoint syslog server default port number is 514 on Windows systems. To change
the port, follow these steps:
1. Open the viewpointConfig.xml file with a text editor.
2. Add the following line to the end of the file before the </Configuration> section:
Parameter name="syslog.syslogServerPort" value="port_number"
where port_number is the new port number.
3. Save the file and exit.
149
The sgmsConfig.xml File
SonicWALL ViewPoint stores its configuration information in the sgmsConfig.xml file.
The following table contains the contents of the sgmsConfig.xml file. Each of these parameters was configured during installation or can be configured from the SonicWALL ViewPoint UI.
Table 1: The sgmsConfig.xml File
LANGUAGE
Specifies the language used by SonicWALL ViewPoint (default: en).
COUNTRY
Specifies the country (default: US).
debug
Specifies the debugging level (Levels 0, 1, 2, or 3). The default setting 0 specifies no debugging.
installDir
Specifies where SonicWALL ViewPoint is installed.
dbtype
Specifies the type of database used.
dbhost
Specifies the IP address of the database server.
dbport
Specifies the database port.
dbname
Specifies the database name. This is encrypted using Tiny Encryption technology.
dbuser
Specifies the database username. This is encrypted using Tiny Encryption technology.
dbowner
Specifies the database owner. This is encrypted using Tiny Encryption technology.
datasource
Specifies the data source.
dbpassword
Specifies the database password. This is encrypted using Tiny Encryption technology.
dbconnections
Number of database connections (default:20).
dbdriver
Specifies the database driver.
dburl
Specifies the URL of the database.
syslog.syslogParserPort
Internal use only.
syslog.syslogServerPort
Internal use only.
syslog.launchSyslogServer
Internal use only.
syslog.forwardToHost
Specifies another host that will receive syslog messages.
syslog.forwardToHostPort
Specifies the port of the host that will receive syslog messages.
The SonicWALL ViewPoint Log Files
SonicWALL ViewPoint provides a number of log files that can be used for troubleshooting. These files are located
in the SonicWALL ViewPoint Logs directory and include:
• msde.log—MSDE database log
• phase2install.log—Phase 2 Installation log
• viewpointWebServerLog.txt—Web Server log
• tomcaterr.log—Tomcat log
• tomcatout.log—Tomcat log
• vpSummarizerDbg.txt—Summarizer log in debug mode
• vpSummarizerLog.txt—Summarizer log in non-debug mode
150
SonicWALL ViewPoint User’s Guide
The following log files are also available:
•
•
<viewpoint_directory>\SonicWALL_ViewPoint_2.0_installLog.log—Phase 1 Installation log
C:\ViewPoint20_uninstall.log—Uninstall log
Encrypting the sgmsConfig.xml File
To encrypt text for use in the sgmsConfig.xml and web.xml files, do the following:
1. Navigate to the <viewpoint_directory>:\bin folder.
2. Enter the following command:
java -cp . TEAV text
where text is the text string to encrypt.
The encrypted string is returned.
3. Add the encrypted string to the sgmsConfig.xml or web.xml file.
Note: This procedure only performs encryption.
Encrypted Data in the sgmsConfig.xml File
The sgmsConfig.xml and web.xml files contain encrypted data. The following information is encrypted using Tiny
Encryption technology:
•
•
•
•
Database Password
Database Name
Database Username
Database Owner
Resetting the Admin Password
To reset the admin user's password to default value of 'password', enter the following from the command-line
prompt:
osql -U DBuser -P DBpassword -q "exit(update sgmsdb.dbo.users set password =
'5f4dcc3b5aa765d61d8327deb882cf99' where id like 'admin')"
where DBuser is the SGMSDB username and DBpassword is the SGMSDB password.
Copying/Pasting into SonicWALL ViewPoint User Interface
The Java Plug-in version 1.3 and later does not allow applets to access user clipboards. To circumvent this, you
must explicitly allow applets to access your clipboard. To do this, follow these steps:
1. Open the java.policy file with a text editor. It is usually located in the following directory:
c:\Program Files\JavaSoft\JRE\1.3\lib\security
2. Add the following line to the top of the file after the "// "standard" properties that can be read by anyone":
permission java.awt.AWTPermission "accessClipboard", "write";
3. Save the java.policy file and exit.
151
Using the Import Feature from Applet
To use the SonicWALL ViewPoint Import option from a remote browser, follow these steps:
1. Open the java.policy file with a text editor. It is usually located in the following directory:
c:\Program Files\JavaSoft\JRE\1.3\lib\security
2. Add the following line to the end of the file:
// permission granted to all domains to use ViewPoint' Import option
grant {
permission java.io.FilePermission "<<ALL FILES>>", "read, write, delete, execute";
permission java.util.PropertyPermission "user.home", "read, write";
permission java.lang.RuntimePermission "modifyThread";
};
grant {
permission java.lang.RuntimePermission "accessClassInPackage.sun.misc";
};
3. Save the file and exit.
Securing Access to the ViewPoint Web Server
This section describes how to configure SonicWALL ViewPoint to run using HTTPS.
Creating a Keystore with a Valid Test Certificate
To configure SonicWALL ViewPoint to use HTTPS, you must create a keystore with a valid test certificate. To do
this, follow these steps:
1. From the command-line on the SonicWALL ViewPoint Console, change to the following directory:
sgms_directory\jre\bin
where sgms_directory is the directory where SonicWALL ViewPoint was installed.
2. Enter the following command:
.\keytool -genkey -alias spcert -keyalg RSA -keystore sgms_directory\etc\keystore
3. You are prompted to enter the keystore password and other information.
4. When prompted to confirm the information, type yes and press Enter.
5. Enter key password for <spcert>. If the password is the same as the keystore password, press Enter.
The certificate is issued for evaluation and testing purposes. To create a secure website using this certificate, see
"Creating a Secure Website" on page 42. To use HTTPS with a valid certificate, you will need to obtain a certificate through a valid certificate authority (e.g., Verisign and Thawte) and store the certificate in the keystore
that you just created.
Note: For information on getting a certificate from Thawte, visit http://www.orionserver.com/docs/ssl-howto.html.
Creating a Secure Website
This section describes how to create a secure website with server side authentication. To do this, follow these steps:
1. Open the <sgms_directory>\jre\lib\security\java.security file with a text editor.
2. Locate the following entry:
provider.2
3. Replace it with the following:
provider.3
4. Insert the following line above the line that you just edited:
security.provider.2=com.sun.net.ssl.internal.ssl.Provider
5. Save the file and exit.
6. Open the <sgms_directory>\Tomcat\conf\server.xml file with a text editor.
7. Locate the following entry:
152
SonicWALL ViewPoint User’s Guide
<!-<Connector className="org.apache.tomcat.service.PoolTcpConnector">
<Parameter name="handler"
value="org.apache.tomcat.service.http.HttpConnectionHandler"/>
<Parameter name="port"
value="8443"/>
<Parameter name="socketFactory"
value="org.apache.tomcat.net.SSLSocketFactory" />
</Connector>
-->
8. Remove the comment characters (<!--, -->).
9. Change the port value from 8443 to 443.
10. . Enter the following lines below the port entry:
<Parameter name="keypass" value="keystore_password"/>
<Parameter name="keystore" value="sgms_directory\etc\keystore"/>
<Parameter name="clientAuth" value="false"/>
where keystore_password is the keystore password that you entered when creating the certificate
and sgms_directory is the directory where SonicWALL ViewPoint was installed.
The following is an example of a modified server.xml entry:
<Connector className="org.apache.tomcat.service.PoolTcpConnector">
<Parameter name="handler"
value="org.apache.tomcat.service.http.HttpConnectionHandler"/>
<Parameter name="port"
value="443"/>
<Parameter name="keypass" value="sgms11"/>
<Parameter name="keystore" value="D:\SGMS2\etc\keystore"/>
<Parameter name="clientAuth" value="false"/>
<Parameter name="socketFactory"
value="org.apache.tomcat.net.SSLSocketFactory" />
</Connector>
11. To disallow normal HTTP traffic, locate and comment out the following section:
<!-- Normal HTTP -->
<Connector className="org.apache.tomcat.service.PoolTcpConnector">
<Parameter name="handler"
value="org.apache.tomcat.service.http.HttpConnectionHandler"/>
<Parameter name="port" value="80"/>
</Connector>
When you are finished, it should look like the following:
<!-- Normal HTTP -->
<!-<Connector className="org.apache.tomcat.service.PoolTcpConnector">
<Parameter name="handler"
value="org.apache.tomcat.service.http.HttpConnectionHandler"/>
<Parameter name="port" value="80"/>
</Connector>
-->
12. Save the file and exit.
13. Restart the ViewPoint Web Server service.
Securely Accessing SonicWALL ViewPoint
To securely access SonicWALL ViewPoint, open a web browser and enter https://viewpoint_address where
viewpoint_address is the address of the SonicWALL ViewPoint server.
If you are using a Windows server, modify the desktop shortcut and make sure it points to https://localhost.
153
154
SonicWALL ViewPoint User’s Guide
APPENDIX B
Customized Reports
The scheduled reports generated by the SonicWALL ViewPoint Scheduler service contain several elements that can
be customized. These include:
• Logo at the top left corner of the report – default is SonicWALL logo
• Heading section at the top right corner of the report – default is ‘SonicWALL Reporting’
• Chart and table colors
• Background colors
• Font types and size
• Displayed text
Note: Table fonts and text can not be altered.
Customizing Reports
To customize reports, follow these steps:
1. Create a folder to store custom report templates. The folder name cannot contain spaces and must be located in
the appropriate directory. For example, to use the folder name MyCustomReports, you must create the folder
with the following directory structure:
<gms_directory>\Tomcat\webapps\sgms\reports\scheduledreports\MyCustomReports
2. Copy all of the files in the following directory into the newly created folder:
<gms_directory>\Tomcat\webapps\sgms\reports\scheduledreports\
3. The default logo used in the reports is the SonicWALL logo. If you wish to use a different logo, copy it into the
following directory:
<gms_directory>\Tomcat\webapps\sgms\images\
4. Using Table 2 as a guideline, edit one or more of the JSP files in each subdirectory. Figure 157 shows some
report elements as they are displayed.
Figure 157: Report Elements
155
5. Restart the SGMS Web server service.
6. Update the database. Each scheduled report is stored with a unique ID in the VP_EMAIL_RECEIVERS table
in the SGMS database and each scheduled report contains an additional field, entitled
“TEMPLATE_FOLDER”, in the table. The TEMPLATE_FOLDER field specifies the partial folder name from
where the custom templates are drawn.
Run the following SQL commands in the QueryAnalyzer to enable one or all of the current scheduled reports in
the VP_EMAIL_RECEIVERS table to pick up the custom templates from your newly created custom folder
(i.e., MyCustomTemplate).
USE SGMSDB;
UPDATE VP_EMAIL_RECEIVERS SET TEMPLATE_FOLDER=’MyCustomReports’ WHERE ID=’x’;
where x is the ID of the schedules report in the VP_EMAIL_RECEIVERS table. For all the current scheduled
reports in the VP_EMAIL_RECEIVERS table, omit the ‘WHERE ID=’x’’ from the UPDATE command.
Now, all reports in the scheduled report ID x pick up the customized templates from the MyCustomTemplate
folder.
Note: The TEMPLATE_FOLDER field must contain the full path below the scheduledreports directory. If the
TEMPLATE_FOLDER field is empty, default report formats are used. The SQL commands only apply to the
current scheduled reports in the database (i.e., in the VP_EMAIL_RECEIVERS table). If you create new scheduled reports from the UI or by using the CLI, you must re-execute the SQL commands for the newly created
scheduled reports.
156
SonicWALL ViewPoint User’s Guide
Report File Elements
The following table contains a list of all modifyable report elements.
Note: When modifying JSP files, you can change report values, but do not modify the parameter or file names.
Table 2: Report File Elements
Element
Element Parameter
Default Value
Main body background color
body bgcolor
#95B5CD (light blue)
Banner background color
bgcolor
#071F4F(dark blue)
Banner border color
bordercolor
#000000 (black)
Logo image
img src
images/mainLogo2.gif
Logo image link
href
http://www.sonicwall.com
Logo image size
width and height
200 and 73, respectively
Logo image name
alt
SonicWALL Logo
Logo image background color
bgcolor
#FFFFFF (white)
Banner title
SonicWALL ViewPoint
Banner title font type
font face
Verdana, Arial, Helvetica, sans-serif
Banner title font size
font size
2
Banner title font color
font color
#000000 (black)
Banner text (unit report)
Scheduled Report for SonicWALL appliance at
IP address:
Banner text (group report)
Scheduled Report for SonicWALL Group:
Banner text font type
font face
Verdana, Arial, Helvetica, sans-serif
Banner text font size
font size
1
Banner text font color
font color
#000000 (black)
Name bar background color
Bgcolor
#0C2C56
Name bar text
Name bar text font type
For example, Web Usage Top Sites By User for,
Bandwidth Over Time from, Overtime from,
Bandwidth Summary for
font face
Verdana, Arial, Helvetica, sans-serif
Name bar text font size
font size
1
Name bar text font color
font color
#FFFFFF (white)
Chart background color
setChartBackground
#FFFFFF (white)
Chart plot color
setPlotAreaBackground
Varies for each report
Timezone text font type
font face
Arial
Timezone text font size
font size
1
Timezone text font color
font color
#FFFFFF (white)
Timezone text
Report produced for timezone
157
158
SonicWALL ViewPoint User’s Guide
APPENDIX C
Messages
Message Text
CONFIG—Route not available to the destination IP:
Route not available to the destination. IP
Cannot decide where to send layer 3 broadcast due to src IP
ROUTING—Layer 3 broadcast dropped due to Src IP:
CONFIG—Unknown Peer type in PDE
Unknown Peer type in PDE.
CONFIG—Manual keying for remote clients is not supported
ESP/AH manual keying for remote clients is not supported
CONFIG—Unknown protocol in PDE
Unknown protocol in PDE.
Out of BRAM space. Cannot save PDE.
SYSTEM - CAPACITY - Call Sales - BRAM capacity reached - Last policy not saved
Out of BRAM space. Cannot restore all PDE(s). Upgrade failed.
SYSTEM - CAPACITY - Revert to prior release - BRAM capacity reached - Call sales
Failed to get free frame buffer
SYSTEM - CAPACITY - Call Customer Support if message reoccurs - Frame Buffer
Out of memory
SYSTEM - CAPACITY - Memory error or capacity reached - Warm start and monitor
DRAM checksum error
SYSTEM - ERROR - Call Customer Support if message reoccurs - DRAM Checksum
Out of memory. Cannot restore all PDE(s). Upgrade failed.
SYSTEM - CAPACITY - Revert to prior release - Call Sales
Memory allocation error. ULA Host Auth. incomplete. IP:
SYSTEM - CAPACITY - Call Sales - ULA Memory
Flash write error
SYSTEM - ERROR - Call Customer Support if message reoccurs- Flash Write
Flash erase error
SYSTEM - ERROR - Call Customer Support if message reoccurs - Flash Erase
Flash checksum error
SYSTEM - ERROR - Call Customer Support if message reoccurs- Flash Checksum
Critical: Terminating Flash programming
SYSTEM - ERROR - Call Customer Support for replacement- Flash Halt
159
Critical: Ravlin is completely disabled.
SYSTEM - ERROR - Call Customer Support for replacement- Sys Disabled
Critical: Failed to disable Ravlin.
SYSTEM - ERROR - DISCONNECT UNIT- Call Support - Runaway System
Signature Verification failure
SYSTEM - ERROR - Call Customer Support to reset firmware - Signature
Out of NV Memory
SYSTEM - CAPACITY - Call Customer Support - Flash Capacity
Invalid NV Type
SYSTEM - ERROR - Call Customer Support if message reoccurs- Flash Type
No such NV handle
SYSTEM - ERROR - Call Customer Support if message reoccurs- Flash Handle
ISAKMP:Drop Request to send packet with length > 1520.
IKE ERROR: Drop Request to send packet with length > 1520. Peer:
ISAKMP: Drop Request to send packet with length zero.
IKE ERROR: Drop Request to send packet with length zero. Peer:
Interface 0 stopped transmitting due to an abnormal interrupt.
SYSTEM - ERROR - The DEC ethernet interface 0 stopped transmitting due to an abnormal interrupt.
CA certificate not found in list
CONFIG - PKI - Check configuration: Referenced CA certificate not loaded
CA certificate lookup hash
CONFIG - PKI - Check configuration: Reload CA certificate
Found CA certificate in CA certificate list
PKI - Success: Found CA certificate
Certificate verified - but invalid
PKI - Certificate is invalid
PKI - IDS - Verify CA signature failed
Verify CA signature failed
CONFIG - PKI - Check Policy: certificate and policy names do not match
Distinguished name in the Certificate does not match with the policy entry.
PKI - Signature Algorithm mismatch is X.509 certificate
Signature Algorithm mismatch is X.509 certificate
DSS p value:
PKI - DSS p value:
DSS q value:
PKI - DSS q value:
DSS g value:
PKI - DSS g value:
ARP - No ARP entry for destination:
No ARP entry for destination
ARP - Received Delayed ARP reply. Source:
Received Delayed ARP reply. Source:
ARP - No ARP response. Destination:
No ARP response. Destination:
ARP - Duplicate ARP response. Source:
160
SonicWALL ViewPoint User’s Guide
Duplicate ARP response. Source:
Save DHCP address in NVM success.(Peer/Hostname/DHCP IP):
Save DHCP address in NVM success.(Peer:DHCP):
DHCP - Saved DHCP Record (Peer/Hostname/DHCP IP):
SYSTEM - CAPACITY - Failed DHCP save to NV (Peer/Hostname/DHCP IP)
Failed to save DHCP address in NVM. (Peer:DHCP)
DHCP - IP address received is
DHCP successful - current IP address is
DHCP - NACK received
DHCP NACK received
DHCP - Normal - Renewing
DHCP Renewing
DHCP - Normal - Rebinding
DHCP Rebinding
DHCP - Normal - Lease Expires
DHCP Lease Expires
Restarting DHCP.
SYSTEM - ERROR - Restarting DHCP.
Stop DHCP
SYSTEM - ERROR - Stop DHCP
DHCP - Housekeeping - Move to new index. (Peer:DHCP:Old:New)
Moving DHCP Address to new index. (Peer:DHCP:Old:New)
DHCP - Error - Invalid DHCP Address. (Peer:DHCP Address)
Invalid DHCP Address. (Peer:DHCP Address)
DHCP - Normal - Insert Hash table entry. (Index:DHCP Addr)
Insert Hash table entry. (Index:DHCP Addr)
DHCP - Rcvd request to release DHCP Address. (Peer:DHCP Addr)
Rcvd request to release DHCP Address. (Peer:DHCP Addr)
DHCP - Normal -Lease expired for DHCP Address. (Peer:DHCP Addr)
Lease expired for DHCP Address. (Peer:DHCP Addr)
DHCP - Normal - Received DHCP records. Peer/DHCP IP:
Received DHCP records. Peer/DHCP IP:
DHCP - Normal - Record already exists. Peer/DHCP IP:
DHCP record already exists. Peer/DHCP IP:
Delete DHCP record on passive Ravlin. Peer/DHCP IP:
DHCP - Releasing remote DHCP record due to reassignment Peer/DHCP IP:
Delete DHCP record due to unsolicited ARP. Peer/DHCP IP:
DHCP - Releasing DHCP due to reassignment Peer/DHCP IP:
DHCP – Register address for remote user (Peer/Hostname/DHCP IP):
Register DHCP Client. (Peer/Hostname/DHCPIP)
DHCP – Register address for Ravlin Soft user (Device IP/Hostname/VIP):
Register DHCP Client. (RIP/Hostname/VIP)
ICMP - Network Error - Received ICMP Unreachable from:
Received ICMP Destination unreachable
IP - IP Fragmentation Failed:
161
IP Fragmentation Failed:
FW - LOG - Packet passed in clear: (Src|Dst|Proto|DstPort)
VPN - LOG - TCP Session Terminated: (Src|Dst|DstPort|SrcPort)
VPN - LOG - TCP Session Initiated: (Src|Dst|DstPort|SrcPort)
FW - EVENT - No ICMP session. Pkt. dropped: (Src/Dst/Interface)
FW - EVENT - No UDP session. Pkt. dropped: (Src/Dst/DstPort/SrcPort/Intf)
FW - EVENT - No TCP session. Pkt. dropped: (Src/Dst/DstPort/SrcPort/Intf)
FW - LOG - ICMP Session Initiated: (Src|Dst)
FW - LOG - ICMP Session Terminated: (Src|Dst)
FW - LOG - UDP Session Initiated: (Src|Dst|DstPort|SrcPort|NAT)
FW - LOG - UDP Session Terminated: (Src|Dst|DstPort|SrcPort|NAT)
FW - LOG - TCP Session Initiated: (Src|Dst|DstPort|SrcPort|NAT)
FW - LOG - TCP Session Terminated: (Src|Dst|DstPort|SrcPort|NAT)
LCP Conf-Req Sent
PPP - LCP Conf-Req Sent
LCP Conf-Req Rcvd
PPP - LCP Conf-Req Rcvd
LCP Conf-Ack Sent
PPP - LCP Conf-Ack Sent
LCP Conf-Ack Rcvd
PPP - LCP Conf-Ack Rcvd
LCP Conf-Nak Sent
PPP - LCP Conf-Nak Sent
LCP Conf-Nak Rcvd
PPP - LCP Conf-Nak Rcvd
LCP Conf-Reject Sent
PPP - LCP Conf-Reject Sent
LCP Conf-Reject Rcvd
PPP - LCP Conf-Reject Rcvd
LCP Term-Req Sent
PPP - LCP Term-Req Sent
LCP Term-Req Rcvd
PPP - LCP Term-Req Rcvd
LCP Term-Ack Sent
PPP - LCP Term-Ack Sent
LCP Term-Ack Rcvd
PPP - LCP Term-Ack Rcvd
LCP Code-Reject Sent
PPP - LCP Code-Reject Sent
LCP Code-Reject Rcvd
PPP - LCP Code-Reject Rcvd
LCP Protocol-Reject Rcvd
PPP - LCP Protocol-Reject Rcvd
PAP Auth-Req Sent
PPP - PAP Auth-Req Sent
162
SonicWALL ViewPoint User’s Guide
PAP Auth-Ack Rcvd
PPP - PAP Auth-Ack Rcvd
PAP Auth-Nak Rcvd
PPP - PAP Auth-Nak Rcvd
IPCP Conf-Req Sent
PPP - IPCP Conf-Req Sent
IPCP Conf-Req Rcvd
PPP - IPCP Conf-Req Rcvd
IPCP Conf-Ack Sent
PPP - IPCP Conf-Ack Sent
IPCP Conf-Ack Rcvd
PPP - IPCP Conf-Ack Rcvd
IPCP Conf-Nak Sent
PPP - IPCP Conf-Nak Sent
IPCP Conf-Nak Rcvd
PPP - IPCP Conf-Nak Rcvd
IPCP Conf-Reject Sent
PPP - IPCP Conf-Reject Sent
IPCP Conf-Reject Rcvd
PPP - IPCP Conf-Reject Rcvd
IPCP Term-Req Sent
PPP - IPCP Term-Req Sent
IPCP Term-Req Rcvd
PPP - IPCP Term-Req Rcvd
IPCP Term-Ack Sent
PPP - IPCP Term-Ack Sent
IPCP Term-Ack Rcvd
PPP - IPCP Term-Ack Rcvd
PPP - PPPoE login failed. Check username/password and try again.
PPPoE - Authentication failed. Check username/password and try again.
PPP - PPPoE Info
PPPoE Info
PPP - Received CHAP Auth request
Received CHAP Auth request
CHAP authentication sent
PPP - CHAP authentication sent
CHAP authentication success
PPP - CHAP authentication success
CHAP authentication failure
PPP - CHAP authentication failure
PADI Sent
PPPoE - Looking for Servers (PADI)
PADO Rcvd
PPPoE - Available Server (PADO)
PADR Sent
163
PPPoE - Selected a Server (PADR)
PADS Rcvd
PPPoE - Server Confirms Selection (PADS)
PADT Sent
PPPoE - Terminate Session Sent (PADT)
PPPoE - Discovery Complete
PPPoE Discovery Complete
PPPoE - Discovery Failed
PPPoE Discovery Failed
PPPoE - Service Name Error
PPPoE Service Name Error
PPPoE - Concentrator Error
PPPoE Concentrator Error
PPPoE - Generic TAG Error
PPPoE Generic TAG Error
PPPoE - Network Disconnected due to inactivity
PPPoE - Connection established
RADIUS - Sent Challenge - Client:
Sent RADIUS ACCESS_CHALLENGE. Client:
RADIUS - Authentication successful.
RADIUS Authentication successful.
RADIUS - Authentication failed.
RADIUS Authentication failed.
RADIUS - Access Request from Client:
Received RADIUS ACCESS_REQUEST. Client:
Drop RADIUS ACCESS_REQUEST. Bad pending SA pointer.
RADIUS - Cannot match reply to pending session
RADIUS - Received unknown attribute. Login halted Client:
Received unknown attribute. No ACCESS_CHALLENGE sent. Client:
RADIUS - Bad Checksum - Software error from:
Received RADIUS packet with bad checksum. Client:
Frame allocation error. No ACCESS_CHALLENGE sent. Client:
SYSTEM - CAPACITY - Frame allocation - N0 RADIUS Challenge sent to Client:
Inactive Session terminated.
RADIUS - Inactivity triggered - Session terminated.
Computed hash does not match received hash. Auth Server:
RADIUS - Server Configuration Error - Check shared key to:
No pending client request. Drop RADIUS frame. Client:
RADIUS - No pending client request. Drop request from Client:
RADIUS - Invalid Access Code - Potential intrusion from Client:
Received RADIUS packet with invalid ACCESS code. Client:
Bad Pending SA pointer type:
SYSTEM - ERROR - Call Customer Service - SA pointer type
Drop duplicate RADIUS ACCESS_REQUEST. Client:
RADIUS - Duplicate Request - Possible intrusion from:
164
SonicWALL ViewPoint User’s Guide
RADIUS - Invalid packet - Possible intrusion from:
Received invalid RADIUS packet. Client:
Challenge response timeout. ULA Host:
RADIUS - Timeout. Ravlin Host:
Challenge response timeout. ISAKMP aborted. Client:
RADIUS - Timeout. Ravlin Soft Client:
RADIUS - Sent Request to AAA Server:
Sent RADIUS ACCESS_REQUEST. Auth. Server:
RADIUS - Received Access Rejected from AAA Server:
Received RADIUS ACCESS_REJECT. Auth. Server:
RADIUS - Received Challenge from AAA Server:
Received RADIUS ACCESS_CHALLENGE. Auth. Server:
Failed to Authenticate. Client:
RADIUS - Failed to Authenticate. Client:
Authentication server does not exist.
RADIUS - Cannot connect to Authentication Server:
Authentication server timeout.
RADIUS - AAA Server timeout.
Received SNMP packet with bad checksum from
SNMP - Possible intrusion - Checksum error in command channel from
AH/ESP Anti-Replay Update Failed: Non-Initialized or Wrapped SEQNUM
VPN FW - Anti-Replay Update Failed
AH/ESP Anti-Replay Check Failed: Last:Current SEQNUM:
VPN FW - Anti-Replay Check Failed - Sequence Number (Last:Current)
AH/ESP Tunnel Decapsulation Check Failed: Bad Inner IP or ESP Hdrs ??
VPN FW - Decapsulation Check Failed: Bad IP and/or Header
AH/ESP Anti-Replay Check Failed: SEQNUM is zero.
VPN FW - Anti-Replay Check Failed - Sequence Number is zero.
AH/ESP Authentication : HMAC Hash Verification Failed. Peer:
VPN FW - HMAC Hash Verification Failed. Peer:
CONFIG - Client VPN request- but no policy from:
No client group defined. ISAKMP cannot be initiated. Peer:
IPSEC - Normal - Session lifetime has expired for Peer:
IPSEC SA lifetime expired. Peer:
CONFIG - No policy defined for Peer
ISAKMP responder. No PDE defined for Client or server. Peer
Cannot find ISAKMP authentication preshared key
CONFIG - Cannot find preshared key
No conn entry with message ID to verify QM!:
SYSTEM - ERROR - Lost state of IPSEC rekey - will reset
ISAKMP Responder could not find gateway MAC address
SYSTEM -ERROR - IKE Could not find gateway MAC address
Bad IPSEC protocol transform
CONFIG - Bad IPSEC protocol transform
DHCP - Received request to send DHCP records from:
165
Received request to send DHCP records.
Internal error: client hash table has bad flag
SYSTEM - ERROR - Watch for reoccurrence - Client Table corrupted
Bad DES transform
CONFIG - IKE - Bad DES transform
CONFIG - IKE - Found inconsistent transform
ISAKMP Responder found inconsistent transforms
CONFIG – IKE - Unsupported payload type.
IPSEC - Session rekey failed
Quick Mode processing failed
IKE - SA lifetime expired with Peer:
ISAKMP SA lifetime expired. Peer:
IKE - Received Keep alive packet
IKE - Discard out of sequence packet. Peer:
CONFIG - extra proposals after AH and ESP
Internal error: extra proposals after AH and ESP
Bad IPSEC protocol values
CONFIG - IPSEC- Bad IPSEC protocol values
CONFIG - IKE proposal is not acceptable. Peer:
ISAKMP Phase I proposal is not acceptable. Peer:
CONFIG - ESP/AH proposal is not acceptable. Peer:
ISAKMP Phase II proposal is not acceptable. Peer:
IKE - Security Association requested from Peer:
Received ISAKMP initialization request. Peer:
IKE - Session created - Ready to negotiate.
Phase I complete.
IKE - Initiate Security Association with Peer:
Start ISAKMP initialization. Peer:
IKE - Unable to negotiate security association with Peer:
ISAKMP failed. Peer:
IPSEC - IKE Complete - Encrypting to Peer:
ISAKMP/OAKLEY successful. SA Active. Peer:
IPSEC - NAT Detected - OmniTraversal invoked to Peer:
IPSEC traffic will be encapsulated in UDP. Peer:
IKE - Improper packet - Aborting negotiation
No SA exists. Next payload is not S
IKE - Unable to decrypt packet
Unable to decrypt payload!
Can't get conn entry I just created!
SYSTEM - ERROR - IKE negotiation out of sync - will auto reset
CONFIG - Preshared keys between peers are different
Invalid payload. Possible overrun attack!
Main Mode processing failed
SYSTEM - ERROR - IKE Processing failed
Header verified invalid!
166
SonicWALL ViewPoint User’s Guide
IKE - Incoming packet for negotiation is invalid
CONFIG - Timeout - Negotiation could not be reached
ISAKMP timeout. SA data is invalid.
IKE - Starting Session Rekey. Peer:
Start QM Rekey. Peer:
IKE - Received request to rekey session with Peer:
Received QM rekey. Peer:
IKE - Resources busy rekey delayed slightly
Start rekey later since we initiate ISAKMP one at a time.
CONFIG - Place unit in VPN mode
Recv'd an encrypted packet when crypto not active!.
Can't create conn entry!
SYSTEM - ERROR - Watch for reoccurrence - Conn Entry
CONFIG - Remote end is sending clear traffic
Recv'd an unencrypted packet when crypto active!
IKE - Negotiation failed - No answer received from Peer:
ISAKMP timeout. Retransmission failed. Peer:
IKE - Negotiation aborted - Payload verification failed.
Payload verification failed. ISAKMP aborted.
No connection entry
SYSTEM - ERROR - Check policies
SYSTEM - ERROR - Unable to encrypt packet
Unable to encrypt payload!
Can't send request after processing!
SYSTEM - ERROR - Packet invalid after processing
DHCP - “Retransmission of DHCP Records failed. Peer:
Retransmission of DHCP Records failed. Peer:
IKE - Request to delete IPSEC SA has invalid DOI
Invalid DOI in delete message!
IKE - Request to delete IKE SA invalid.
Invalid ISAKMP SA delete message.
IKE - Request to delete IPSEC SA does not match
ISAKMP SA delete msg for a different SA!
IKE - Request to delete IPSEC SA invalid
Invalid IPSEC SA delete message.
IKE - Request to delete SA has unknown protocol
Unknown protocol in delete message!
Dropped duplicate ISAKMP packet.
IKE - Duplicate IKE Packet discarded
IKE - Authentication rekey set to (seconds)
Phase I rekey.
IPSEC - Session rekey set to (seconds)
Phase II rekey.
IKE -Received ISAKMP packet with bad length. Peer:
Received ISAKMP packet with bad length. Peer:
167
IKE - Restart IKE after ESP decap. Peer gateway:
Restart ISAKMP after ESP decap. Peer gateway:
IKE - Received IKE SA delete request. Peer:
Received ISAKMP SA delete request. Peer:
IKE -Received IPSEC SA delete request. Peer:
Received IPSEC SA delete request. Peer:
IKE - Restart IKE after ESP decap. Peer host:
Restart ISAKMP after ESP decap. Peer host:
CONFIG - Check preshared keys.
Unable to compute shared secret.
Host:Virtual IP does not match Inner Source IP.(VIP:Src IP):
VPN FW - Decrypted Source IP does not match (Expected:Actual):
Host:Destination address does not match local protected networks.
VPN FW - Decrypted Destination IP does not match policy
Gateway:Source or destination address failed filter.(Src:Dst:Port):
VPN FW - Received packet does not match policy (Src:Dst:Intf):
ULA enabled PDE. Drop Pkt as host is not Authenticated. IP:
VPN FW - Policy requires host authentication by RADIUS IP:
CONFIG - RADIUS is not enabled. Dropping IP:
ULA enabled PDE. Drop Pkt as RADIUS is not enabled. IP:
CONFIG - Only 1 PDE can have Peer Net set to all zero
Found more than one Gateway PDE with peer networks set to all zero.
Drop ISAKMP frame from Local Side
VPN FW - IKE received on local interface - Check cabling
CONFIG - Remote network appears in more than 1 PDE (Src/Dst/Net/Mask)
Destination matches to multiple peer networks on Gateway PDE (Src/Dst/Net/Mask)
Drop ESP due to bad checksum in IP
NETWORK - Incoming ESP packet has bad checksum
Local interface. Source address failed filter.(Src:Dst):
VPN FW - Local interface reports invalid source IP (Src:Dst):
Remote interface. Source address failed filter.(Src:Dst):
VPN FW - Remote interface reports invalid source IP (Src:Dst):
Unsupported protocol. (SrcIP/DstIP/Protocol/Port/Interface):
VPN FW - No session for (SrcIP/DstIP/Protocol/Port/Intf):
Failed to build SA. Block connection. Peer:
VPN FW - Block VPN Connection. Peer:
Drop ESP or AH. Multiple server entries. ISAKMP aborted. Peer:
SYSTEM - ERROR - Multiple server entries. IKE aborted. Peer:
Drop ISAKMP frame on remote port in non-operational mode. Peer:
SYSTEM - ERROR - Drop IKE frame from/to Peer:
ISAKMP race condition found. Peer:
SYSTEM - ERROR - ISAKMP race condition found. Peer:
SYSTEM - ERROR - Check Policy - decryption halted
Unknown crypto algorithm. Payload not decrypted
SYSTEM - ERROR - Check Policy - encryption halted
168
SonicWALL ViewPoint User’s Guide
Unknown crypto algorithm. Payload not encrypted
Mismatch Protocol/Port Check
SYSTEM - ERROR - Mismatch Protocol/Intf Check
Bad SPI in Packet (SrcIP/Status/SPI1/SPI22/InSPI):
IPSEC - Bad SPI in Packet (SrcIP/LocalSPI/InSPI):
Internal error: Bad SA type.
SYSTEM - ERROR - Call customer service - - Bad SA Type
Failed to start ISAKM phase I rekey. Invalid SA.
SYSTEM - ERROR - Call customer service if frequent - IKE Rekey aborted.
Could not find the IPSEC SA to remove.
IPSEC - SA to terminate can not be found.
Client SA Terminated.
IPSEC - Client SA Terminated.
Memory allocation error. ISAKMP aborted. Peer:
SYSTEM - CAPACITY - Call Sales - IKE Memory Peer:
CONFIG - IKE - Unknown Protocol to negotiate. Peer:
Unknown protocol to negotiate. ISAKMP aborted. Peer:
IPSEC - Cannot match OmniTraversal Packet to active SA - Peer:
Received ESPThruUDP packet outside an SA. Peer:
CONFIG - IKE - Unknown authentication method! ISAKMP aborted.
Unknown authentication method!. ISAKMP aborted.
CONFIG - IKE - Unknown crypto-algorithm
Unknown crypto-algorithm. ISAKMP aborted.
Internal error: Multiple PDE's for same Peer exceeded limit.
SYSTEM - ERROR - Multiple PDE's for same Peer exceeded limit.
AUDIT - Publisher registered for event audit messages
Publisher registered for event audit messages
AUDIT - Deallocation of event publisher context failed.
Deallocation of event publisher context failed.
AUDIT - Event publisher deregistered.
Event publisher deregistered.
AUDIT - Publisher deregistration failed.
Publisher deregistration failed.
Random Number Generator Fault
SYSTEM - POST - Random Number Generator Fault
SYSTEM - POST - All subsystems test OK - System Ready
SYSTEM - POST - Ethernet test failed
SYSTEM - POST - Crypto test failed
SYSTEM - POST - BRAM test failed
SYSTEM - POST - UART test failed
SYSTEM - POST - Real Time Clock test failed
SYSTEM - POST - Ethernet initialization failed
SYSTEM - POST - Out of memory
SYSTEM - POST - Critical: BRAM version unrecognized
SYSTEM - POST - Receive buffer unavailable on local interface
169
SYSTEM - POST - Receive buffer unavailable on remote interface
SYSTEM - POST - No frames available for local interface (GetFrame() failed)
SYSTEM - POST - No frames available for remote interface (GetFrame() failed)
SYSTEM - POST - Interface 0 stopped transmitting due to an abnormal interrupt.
SYSTEM - POST - Interface 1 stopped transmitting due to an abnormal interrupt.
Tunnel Status:
VPN - Performance for:(PDE: Sent-Rcvd-Lost Min-Max-Avg)
170
SonicWALL ViewPoint User’s Guide