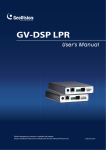
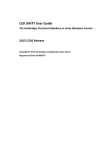
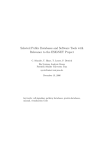
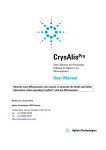
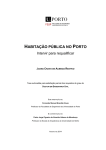
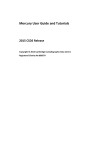
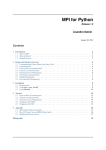
1
VISTA User Guide
2010 CSDS Release
Copyright © 2009 The Cambridge Crystallographic Data Centre
Registered Charity No 800579
Conditions of Use
The Cambridge Structural Database System (CSD System) comprising all or some of the following:
ConQuest, Quest, PreQuest, Mercury, (Mercury CSD and Materials module of Mercury), VISTA, Mogul,
IsoStar, SuperStar, web accessible CSD tools and services, WebCSD, CSD Java sketcher, CSD data file,
CSD-UNITY, CSD-MDL, CSD-SDfile, CSD data updates, sub files derived from the foregoing data files,
documentation and command procedures (each individually a Component) is a database and copyright work
belonging to the Cambridge Crystallographic Data Centre (CCDC) and its licensors and all rights are
protected. Use of the CSD System is permitted solely in accordance with a valid Licence of Access
Agreement and all Components included are proprietary. When a Component is supplied independently of
the CSD System its use is subject to the conditions of the separate licence. All persons accessing the CSD
System or its Components should make themselves aware of the conditions contained in the Licence of
Access Agreement or the relevant licence.
In particular:
• The CSD System and its Components are licensed subject to a time limit for use by a specified
organisation at a specified location.
• The CSD System and its Components are to be treated as confidential and may NOT be disclosed or redistributed in any form, in whole or in part, to any third party.
• Software or data derived from or developed using the CSD System may not be distributed without prior
written approval of the CCDC. Such prior approval is also needed for joint projects between academic
and for-profit organisations involving use of the CSD System.
• The CSD System and its Components may be used for scientific research, including the design of novel
compounds. Results may be published in the scientific literature, but each such publication must include
an appropriate citation as indicated in the Schedule to the Licence of Access Agreement and on the
CCDC website.
• No representations, warranties, or liabilities are expressed or implied in the supply of the CSD System
or its Components by CCDC, its servants or agents, except where such exclusion or limitation is
prohibited, void or unenforceable under governing law.
Licences may be obtained from:
Cambridge Crystallographic Data Centre
12 Union Road
Cambridge CB2 1EZ
United Kingdom
Web: http://www.ccdc.cam.ac.uk
Telephone: +44-1223-336408
Email: [email protected]
(UNITY is a product of Tripos, L.P. and MDL is a registered trademark of Elsevier MDL)
1
INTRODUCTION
Vista incorporates a wide range of functionality which allows the user to manipulate and analyse the
geometrical parameters saved from a ConQuest search of the CSD.
The following chapters give an overview of the many different functions available through Vista. The
chapters are arranged according to menu and sub-menu order, and full details of certain functions are
given in the most appropriate chapter, with cross-references to these descriptions provided throughout
the remaining text of this User Guide.
On UNIX, Vista can be run by typing the following command at the command prompt:
vista junk
You can also run Vista with no filename specified. This will cause Vista to look for the default
ConQuest files, namely conquest.tab, conquest.fgd, etc. If these files are unavailable, an error pop-up
will inform you.
The current data limits for Vista are 250 parameters and 10,000 fragments. The maximum number of
points allowed to be plotted is 5000.
If you experience any problems with Vista please contact us with details at:
[email protected]
Vista User Guide
1
2
SPREADSHEET
• The table spreadsheet is the functional heart of Vista, and this menu provides the numerous links
to the other sections of the program.
• The spreadsheet window is split into three main areas: the ConQuest file information, the
spreadsheet, and the active functions.
• The ConQuest file information in the top-left section of this window provides the user with a
quick summary of the original ConQuest search of the CSD. The search fragment is shown
together with a count of the number of parameters defined for this fragment. The number of
refcodes kept by the search of the CSD is given as well as the total number of fragments located.
A summary of the number of parameters and fragments that are currently selected or suppressed
in the spreadsheet itself is also presented in this information box.
• The scrollable table spreadsheet is the main feature of this window. The parameters form the
columns of the spreadsheet with the fragments (represented by their refcodes) forming the rows.
• In general, the spreadsheet operates on a policy of "first select data then perform function". To
select either a row or a column, click on the grey bevelled numbered buttons. A selected row/
column will be rendered in reverse video - white text on a black background. A selected row/
column can be de-selected by clicking on the grey bevelled button again.
• If a refcode has been suppressed, that particular row, will appear "greyed out"- dark grey text on
light grey background. Such entries are effectively removed from the data set and from
subsequent spreadsheet applications, until the user manually restores the data. These entries
remain visible in the spreadsheet to remind the user that they are working with a reduced dataset.
2
Vista User Guide
• The active functions are gathered to the right of the spreadsheet window. These are used to
perform operations on data selected in the spreadsheet. A full description of the available
functions now follows.
2.1 Load/Save ConQuest Files
• If you need to load a new set of data or simply re-load the current data, click on Load. Enter the
root name and either hit RETURN or click OK.
• The same pop-up appears when you wish to save the files.
2.2 Histogram
• Histogram production is a very straightforward procedure. Select one numerical parameter from
the spreadsheet (click one of the grey numbered bevelled buttons) and then press Histogram.
Vista will automatically display the desired histogram using the plot window. Plot options are
then available to the user (see Section 3, page 12).
• If more than one parameter is currently selected in the spreadsheet then Vista will report an error.
If this happens return to the spreadsheet, de-select unwanted parameters and then click
Histogram again.
• Histograms can only be produced for numerical parameters.
2.3 Scattergram
• Scattergram production is also a simple procedure. This time two numerical parameters must be
selected in the spreadsheet. The order of selection is important however as the first parameter
picked in the spreadsheet will always be plotted as the Y axis in the resulting scattergram.
• With two parameters selected press Scattergram and Vista will display the desired scattergram in
a plot window. Plot options are then available to the user (see Section 3, page 12).
• If more than two parameters are selected in the spreadsheet (or only one parameter) then an error
will be reported. Return to the spreadsheet and ensure only two parameters are selected before
proceeding with Scattergram.
• Scattergrams can only be produced for numerical parameters.
Vista User Guide
3
2.4 Polar Histogram
• Polar histograms can be generated using exactly the same procedure employed for plotting linear
histograms (see Section 2.2, page 3).
• Select one numerical parameter (usually an angle for meaningful polar plots, although Vista will
attempt to plot polar histograms for any selected numerical parameter) and then select Polar
Histogram.
• Vista will automatically display the desired polar histogram using the plot window. Plot options
are then available to the user (see Section 3, page 12).
2.5 Polar Scattergram
• Polar scattergrams can be produced in the same fashion as the linear scattergrams (see Section
2.3, page 3).
• Select two numerical parameters in the spreadsheet. The order of selection is important and if
one non-angular parameter is required to be plotted then this must be selected first, followed by
the angular parameter.
• With two parameters selected click Polar Scattergram and Vista will automatically display the
desired polar histogram using the plot window. Plot options are then available to the user (see
Section 3, page 12).
2.6 View Refcodes
• A list of refcodes can be built up and viewed in any order from within the ASER viewer window
(see Section 4, page 20).
• There are several functions in Vista for generating these refcode lists and they will be detailed
later in this guide.
• From the spreadsheet window the user can manually select refcode rows in the spreadsheet by
clicking on the grey buttons. Pressing View REFCODes will take the user to the ASER viewer
where the selected refcodes will be available for viewing.
• If no rows are selected, an error message will appear.
2.7Correlation/Covariance
• The correlation/covariance option permits the investigation of statistical relationships between
numerical parameters.
• To use this function select as many numerical parameters as are required on the spreadsheet and
then hit the Correlation/Covariance button. A new screen will appear.
• Details of the Correlation/Covariance menu are given (see Section 5, page 23).
4
Vista User Guide
2.8 View Quest Fragment
• At the top left hand side of the spreadsheet, there is a thumbnail image of the current test
fragment, as defined in ConQuest. Its purpose is simply to remind the user of the nature of the
current test.
• An enlarged rendering of this fragment is available in a separate screen, which is activated by
selecting View ConQuest Fragment.
• Clicking on the thumbnail image of the fragment will also activate the View ConQuest Fragment
window.
• Details about this window and the information presented in it are available in this guide (see
Section 6, page 24).
2.9 Generate P.C. Scores
• Another statistical analysis tool available in Vista is Principal Component Analysis (PCA).
• To perform a PCA on a set of parameters simply select the relevant columns of the Spreadsheet
and then press Generate P.C. Scores. Four or more parameters are required for PCA, and for the
results to be statistically meaningful the parameters chosen are usually ones that are derived
from similar geometrical properties. For instance it is meaningful to perform a PCA on the six
torsion angles of a cyclohexane ring fragment, but it is not statistically meaningful to attempt a
PCA on three torsion angles and three distances from the same dataset.
• Upon completion of the PCA the user is given the opportunity to review the results before the
PC scores are written to the spreadsheet. A pop-up with a brief summary of the PC scores is
presented. Clicking on any of the items in the scrolling list will display the eigenvalue and %
variance. The blue -/+ keys will move up/down the list sequentially.
• If the PCA results seem satisfactory then hit OK and the PC score data will be added to the
spreadsheet. Selecting CANCEL will abandon the PCA analysis and not write the PC scores to
the spreadsheet.
• Once the PC scores are in the spreadsheet they can be analysed in the same fashion as any other
spreadsheet parameter. Plotting functions such as the Scattergram can be used as well and are
usually invaluable in the interpretation of the PCA as a whole.
Vista User Guide
5
2.10 Create/Transform
• This feature allows the creation of new parameters by application of mathematical functions to
the parameters defined in the original ConQuest search.
• There are two modes of operation: Create and Transform.
• Create will generate a new numerical parameter, to be appended to the end of the spreadsheet.
No parameters need to be selected prior to pressing Create.
• Transform simply applies the input equation to the current selected parameter. This must be a
numerical parameter. On completion the original parameter is replaced by the transformed
parameter
• NFRAG and REFCOD are untouchable, as certain Vista operations require this information to
be constant.
• The equation can either be constructed by pressing buttons on the calculator and/or keying in the
text via the keyboard.
• The scrolling list is active and by clicking on an item in the list, the item text phrase will be
inserted into the calculator display. If a parameter is being transformed, the selected parameter is
highlighted to remind the user. In addition, the parameter being created/transformed also appears
in the title bar (TRN09 in the example shown above).
• When new parameters are being created, they are named, by default, TRNn, where n is the
parameter number. If a parameter of this name already exists then it will currently be overwritten
by the new parameter.
• The equation can be up to 256 characters long. The calculator display can typically show up to
60 characters. The display can however be scrolled left and right to view strings longer than 60
characters. Using the left and right cursor keys, the I-beam cursor can also be scrolled through
the equation text. In addition, clicking on characters will also re-position the cursor. Any text
6
Vista User Guide
•
•
•
•
entered (whether by keyboard or by button presses) will be inserted at the current cursor
position.
Memory buttons are available when using the Create or Transform buttons. Pressing M will
store the current display contents in a memory. MR will place a copy of the contents of the
memory into the display, at the current cursor position. This feature could be particularly useful
if you wish to apply the same/similar transform to many parameters. For instance:
• SQRT(ABS())
could be stored in memory. Only the contents of the inner-most brackets then need to be entered
if MR is used to repeat this function several times. Pressing MC will clear the contents of the
memory. Selecting C will clear the equation and hitting AC will clear the display and erase the
memory contents.
As with other pop-up menus, pressing OK or hitting RETURN will apply the transform. Any
errors will be reported and the user is given another chance to rectify their mistake. CANCEL
will abort the operation.
As mentioned previously, suppressed entries are effectively removed from the dataset and so the
transform is only applied to those entries that are currently active. This is useful if you wish to
apply the transform to a particular group of entries. An example of this would be in the case of
angles ranging from 0-180 degrees. Those entries less than or equal to 90 degrees could be
suppressed and the transform angle=180-angle applied to the rest.
2.11 Search
• Search is another new function available in Vista and allows any one parameter to be tested for a
number of conditions.
• Choose one parameter from the spreadsheet and press Search. There is no restriction on
parameter type as the routine automatically determines the format of the data. The Search popup menu will appear.
• In the simple case of a number, a cut-off value is typed into the Limit text field. One of the
FORTRAN conditional operators needs to be selected. The default is .EQ.. If the parameter
being tested is composed of characters then characters can also be entered into the Limit field.
• In the case of a real value, the tolerance field is active. This allows for experimental error. For an
integer value, this field is automatically greyed out. In the case of character string searches, the
Vista User Guide
7
tolerance field is also disabled.
• The Exact match button is only active for string searches. If for example you wished to search
for the refcode ABCDEF, with the Exact match button disabled, the following refcodes could be
matched (if they appear in the table file and are active) ABCDEF, ABCDEF10, ABCDEF21, etc.
With the Exact match button activated, only the first of the above refcodes would have been
matched.
• Once the search criteria have been specified, hit OK and the function will be performed
(choosing CANCEL will return to the spreadsheet). All of the entries that are matched by the
Search criteria will appear highlighted in the spreadsheet. The dialogue bar at the top of the
spreadsheet window will also report the number of hits satisfied by this search function for that
particular dataset.
2.12 Re-name
• More meaningful names can be given to the parameters. Re-naming can only be applied to one
parameter at a time.
• Select one parameter in the spreadsheet and hit Re-name. The Re-name Parameter pop-up menu
will appear allowing the user to type in a new parameter name.
• The text keyed into the text field will be converted into upper case and the new name will be
compared against the others to check for duplicates. An error pop-up will inform if the name is
unsuitable. The parameter names have a maximum length of 6 characters.
2.13 Export
• The Export operation allows users to write selected columns of data to an ASCII text file in a
form which is then suitable for import into other statistical or spreadsheet packages.
• To export data, select the parameters of interest and press Export. The order of selection is
mirrored in the output file column order. The Export Table File pop-up menu will appear.
• The user can choose from the variety of column separators given in the scrolling list, with the
default setting being to TAB delimited text. The export filename can be specified in this menu
with the default being filename.exp. Parameter names can be added as Column Headings and a
column of the Line Numbers can also be inserted. Any suppressed data in the spreadsheet will
not be exported.
8
Vista User Guide
2.14 Swap
• Any two selected parameters can be swapped. This operation simply interchanges the
parameters' relative positions in the spreadsheet.
• This feature may be particularly useful if there is a need to visually compare, line-by-line, two
columns which are not adjacent in the spreadsheet.
• If more than two parameters are selected in the spreadsheet an error message will be reported.
This is also true if only one parameter is selected.
• For consistency reasons the NFRAG and REFCOD fields are not permitted to be swapped with
any other fields.
2.15 Select Parameters
• Selects (highlights) all of the parameters.
• If one or more parameters are already selected when Select Par is pressed, the previous selection
order is erased and a new order imposed which follows sequentially from 1 (NFRAG) to N.
2.16 Clear Parameters
• De-selects all of the parameters. This action has no effect on suppressed refcodes.
2.17 Delete Parameters
• Selected columns of data can be removed from the spreadsheet by hitting the Delete button. This
function should be used with care as there is no undo facility available in Vista.
• NFRAG and REFCOD are protected against deletion.
2.18 Select Refcodes
• All the rows in the spreadsheet are selected. Suppressed entries remain suppressed.
2.19 Clear Refcodes
• All the rows in the spreadsheet are de-selected. This action has no effect on suppressed refcodes
Vista User Guide
9
and suppressed entries remain suppressed.
2.20 Invert
• Performs a logical NOT on the refcode selections. Those that are selected are unselected and
vice-versa. Suppressed entries remain suppressed.
2.21 Delete Refcodes
• Removes all selected refcodes from the spreadsheet. There is no undo so use with care.
2.22 Suppress Unselected
• Suppresses all entries that are not currently selected.
2.23 Suppress Selected
• Suppresses all entries that are currently selected.
2.24 Restore Suppressed Entries
• Restores all suppressed entries. This action will not bring back deleted entries.
2.25 Save Coordinates
• The Save Coords button allows you to save the 3D coordinates of the selected spreadsheet
entries as a multi-mol2 file.
2.26 Text Size
• Selecting Text Size from the spreadsheet menu launches the Set Text Size pop-up menu.
• Text size values from 10-150 pixels are permitted.
• The absolute text size displayed on the screen will be entirely dependent on the fonts available to
the X-blackboard.
2.27 Refresh
• Total window refresh.
10
Vista User Guide
2.28 Help
• Launches the Help sub-menu (see Section 8, page 30).
2.29 About
• This is an interactive About window. The picture depicts the program structure and highlights
the facilities available in Vista. Each icon is linked to a text file containing a short description of
each menu. Clicking on an icon will display the text in the dialogue window below. By default,
the spreadsheet information is loaded.
2.30 Miscellaneous buttons
• Home: positioned in the top left corner of the spreadsheet, this button simply resets the
spreadsheet row/column positions. i.e. row 1 column 1.
• + and -: If there are multiple tests loaded these keys allow the user to navigate through the tests
available.
Vista User Guide
11
3
PLOT WINDOW
• One plot menu is available however, depending on the type of plot being created (histogram or
scattergram), certain buttons may be greyed out or will activate specific pop-ups.
• The plot window display is split into two parts. The main feature is the plot itself, but also
present is an analysis summary for each of the parameters chosen for the plot. The title of the
plot relates to the parameters selected. In the case of a scattergram the title is by default Y versus
X.
• The plot presented is an active plot: data points can be selected by clicking on them and selected
data points are coloured red. Plot objects can be de-selected by clicking on them again.
• Picking an active plot object will add the associated refcodes to the refcode scrolling list. These
refcodes will initially be highlighted in this list. Refcodes in the list can be de-selected by
clicking on them. This does not remove the refcode from the list and does not de-select the
active plot object. All refcodes highlighted in the scrolling refcode list can be viewed using the
ASER Viewer by selecting View Refcodes (see Section 4, page 20).
• As new plot objects are selected the relevant refcodes are appended to the refcode scrolling list.
This list is not alphabetical. The last refcode in the list always refers to the last data object
selected.
• Operations can be carried out on the plot using the plot function keys located to the right and to
the bottom of the window. Full descriptions of the actions available with these buttons will
follow.
12
Vista User Guide
3.1 Plot Options
• Selecting Plot Options will launch a pop-up menu containing the various options available. The
pop-up menus differ for histograms, scattergrams and polar plots and so each will be described
individually below.
3.1.1
Histogram
• There are 3 plot modes available for histograms:
• Binned: conventional filled rectangles representation. Default mode
• Line: small filled circles representing the upper limit of each bin are joined with lines.
• Level: horizontal lines representing the upper limit of each bin.
• There are also several check boxes:
• Conical Correction: only active for angles (see Section 9, page 31).
• Easy pick: selection of histogram bins can be very difficult if the bin contains a small number
of contributors relative to the scale of the plot as a whole. Turning on Easy pick will create
artificially large bins for these small bins allowing them to be selected more easily. When
Easy pick is on the bins that it has made larger will be coloured in yellow to distinguish them
from the other histogram bins.
• Markers: vertical lines depicting the mean, median, lower quantile (LQ) and upper quantile
(UQ).
• Percent: the bins are plotted as the % of the distribution rather than the default absolute
number of occurrences
• Quantile: allows the user to stipulate the plot quantiles to be used (expressed as a percentage)
• Plot options selected for histograms will remain set for the next histogram with the exception of
Conical Correction which is reset every time.
Vista User Guide
13
3.1.2
Scattergram
• There are 4 plot modes for the linear scattergrams:
• Scatter: one-on-one plot. This is currently the default mode. Up to 5000 graphical primitives
can be plotted. There is now a choice of scalable symbols to choose from as symbols for the
scatterplot.
• Colour: a graduated colour scheme is chosen to represent the frequency of data points, with
areas of low data density represented by dark colours, and regions of high data density
represented by light colours.
• Numerical: the data shown on the plot can be represented by numerical characters which
range from 1 (for one plot object at that plot position) through 9, and then for higher
representations, alphabetically beginning at A (for ten plot objects at the plot position).
• Contour: Not yet active - under development.
• There are also check boxes available:
• Linear: plots a regression line through the data represented on the scattergram.
• Regression: The regression calculation will only include those data points which are not
suppressed. If a regression line is present on the scattergram plot and data points are
subsequently suppressed then the regression calculation will automatically be re-performed to
take account of the new content of the dataset.
2.1.3 Polar Histogram/Scattergram
14
Vista User Guide
• The polar histogram/scattergram function can be used to plot one or two parameters, with 4
choices of axes. The plot axes can be defined simply by clicking once on one of the 4 choices
available.
• The polar plots are also active plots and plot objects can be selected from them as with the linear
histograms and scattergrams.
• There are 4 check boxes available:
• Scatterplot: toggles the scatterplot on/off inside the centre circle of the polar plot. The
scatterplot symbols can be altered (see Section 3.4, page 17).
• Histogram: toggles the histogram distribution on/off around the outside of the polar plot. If
the histogram is disabled, the scatterplot is enlarged to fill the available space. If both
histogram and scattergram are disabled, then only the grid/axes are plotted.
• Quantile: allows the user to stipulate the plot quantiles to be used (expressed as a percentage)
for the histogram
• Easy pick: selection of histogram bins can be very difficult if the bin contains a small number
of contributors relative to the scale of the plot as a whole. Turning on Easy pick will create
artificially large bins for these small bins allowing them to be selected more easily. When
Easy pick is on the bins that it has made larger will be coloured in yellow to distinguish them
from the other histogram bins.
3.2 Set Axes
• Plot axes can be tailored to suit individual specifications. The text fields permit the editing of the
X/Y limits and the X/Y bin sizes.
• The Define Limits check box disables/enables the X/Y limits text fields. With Define Limits off,
the text fields are greyed out, preventing any text input. Attempts to type will be unsuccessful.
• The bin values are only relevant for the colour density, numerical density, contour and histogram
plots. The bin text fields are greyed out for other modes. Changing the bin values can have a
profound effect on the visual appearance of a plot and experimentation with this option to find
the most representative plot is recommended.
Vista User Guide
15
• Grid: toggles the plot grid on/off.
• Square Axes: ensures that both the X and Y axis lengths are the same. This forces the layout of
the plot to change in order to accommodate the new graph shape. The plot summary is
positioned to the right of the plot and the figures are listed vertically in one column. With Square
Axes off, the plot becomes rectangular with the width maximized. The plot summary is
positioned beneath the plot in a fashion similar to the plot output from Vista 1.0.
• Show Axes: toggles the axes on/off for the plot.
• Show Ticks: toggles the axial markers on/off
• Show Numbering: toggles the axial numbering schemes (labels) on/off.
3.3 Text
• The pop-up menu available in Vista allows the user to change the default expressions and create
their own plot labels. The check boxes for each text item can be used to dictate whether or not a
text item appears on plot.
• Title: the default title "Y vs X" is generated automatically. Should the title be suppressed, the Y
axis will generally lengthen, as there is free space where the title was.
• X/Y axis: up to 20 characters are permitted for the axial labels. Disabling either of these labels
will not change the plot dimensions.
• Analysis: this is the plot statistics summary. The min., max, mean, mean sd etc.
• Summary: listed in the Analysis Summary. As previously mentioned (see Section 3.2, page 15),
the position of the summary is dependent on the plot shape. If the Square Axes option is disabled
and the Analysis Summary option is also disabled, the plot will expand to fill the free space.
• Text Size: as with the spreadsheet, the text size used for annotation can be redefined. Values from
10 to 150 pixels are currently permitted. The size of the text can have a profound effect on the
plot dimensions, as everything is scaled relative to the Text Size.
16
Vista User Guide
3.4 Symbols
• For scatterplots, the marker symbol can be selected from the above choice of geometrical
shapes. Each symbol has its maximum dimension and active mouse picking area defined by the
symbol size. Values up to 100 pixels can be set.
3.5 Line Width
• Allows the line width of the histogram or scattergram boundaries to be altered.
3.6 Flip Axes
• Transposes the plot axes.
3.7 Re-plot
• Re-plots the diagram maintaining any settings.
3.8 Defaults
• Re-plots the diagram reverting to default plot settings.
3.9 Clear
• Any selected entries in the refcode list are de-selected. A useful procedure when adding new
entries to the list is to press Clear, so that only the new arrivals to the list are selected, leaving
you in no doubt as to which of the entries in the refcode list are associated with the last selection.
• The plot objects remain selected and highlighted in red despite the refcode being de-selected.
3.10 Set
• Selects (highlights) all entries in the refcode list.
3.11 View Refcodes
• As with the spreadsheet, all those refcodes which are currently selected will be passed on to the
ASER viewer (see Section 4, page 20).
Vista User Guide
17
3.12 Postscript
• Copies the current display list (plot) to the PostScript editor. Be sure that the current display is
definitely the one that you want to print as the PostScript editor has no options available for
altering symbols, or for suppressing data etc. All of this must be done in the plot window using
the functions available there (see Section 7, page 26).
3.13 Refresh
• Refreshes the display.
3.14 Help
• Brings up the Help pop-up with information on the current display (see Section 8, page 30).
3.15 Select All
• Selects all of the data points currently on the plot (highlights in red). This option will not select
those points which have been previously suppressed. Selected refcodes are written to the
scrolling refcode list.
3.16 De-select All
• De-selects all currently selected data points. This does not effect suppressed plot objects.
3.17 Select Range
• Allows the user to specify (by clicking on the two outer extremes of the desired range) a range of
data points to be selected. This option will not select those points which have been previously
suppressed. Selected refcodes are written to the scrolling refcode list.
3.18 De-select Range
• Allows the user to specify (by clicking on the two outer extremes of the desired range) a range of
data points to be de-selected. This does not effect suppressed plot objects.
3.19 Suppress Selected
• Suppresses all currently selected data points/plot objects on the plot.
3.20 Suppress Un-selected
• Suppresses all currently un-selected data points/plot objects on the plot.
18
Vista User Guide
3.21 Invert
• Same function as the spreadsheet invert. All selected objects will be de-selected and all unselected objects will become selected.
3.22 Restore
• Restores the entire data-set, returning all suppressed entries back to the plot.
Vista User Guide
19
4
VIEW ASER
• There are display windows allowing 1D, 2D and 3D representations to be viewed
simultaneously. The large window on the left is the active window, and by default displays the
3D representation of the molecule. The 1D or 2D information can be exchanged with the 3D
image by clicking in either the 1D or 2D windows. When the 3D display is not in the active
window certain geometrical functions become disabled, but it is still possible to rotate, translate,
etc.
• The lower part of the ASER viewer menu contains the operations available to the user. These are
described in detail below.
4.1 Refcodes
• Selected refcodes exported from the Spreadsheet or Plot menus are shown in the scrolling
refcode list in the bottom-left of the window. The order of the refcodes is unchanged from that
exported from the Spreadsheet and Plot lists.
• Only one refcode can be viewed at a time and this is the one highlighted in the list. Initially this
will be the first refcode. The entry can be changed by clicking on another entry in the list (direct
access) or by pressing the -/+ keys to move sequentially through the list.
• The selected entry is displayed in all 3 windows.
4.2 Parameter Values
• The values for all the parameters for the selected fragment/refcode are shown in this scrollable
list. If the ASER viewer was called from the Plot menu then the parameters involved in the plot
20
Vista User Guide
will be highlighted in the list.
4.3 Atom Pick Mode (APM)
• A bank of radio buttons Label Atom, Calc. Dist., Calc. Angle, Calc. Tors. and No Action
determine the action taken when atoms are selected for the 3D representation of the molecule
only (the 3D representation must be in the active window).
• By default the APM is Label Atom. The three geometric modes will direct the user to select a
number of atoms and the appropriate calculated value is returned in the dialogue bar directly
below the active window.
• No Action performs no action.
4.4 Render Options
• The render options available in the ASER viewer menu are applicable only when the 3D
representation of the molecule is in the active window. These options are exactly the same as
those of the same name found in the ConQuest program. All of the options are operated by a
toggle button.
• Unit Cell: displays the 3D crystal diagram as it is located in the outlined unit cell.
• Packing: displays the unit cell contents as a packing diagram. The Unit Cell check box mimics
the packing button. This is because the packing routine, by default, adds the cell. The user can,
however, switch off the cell manually.
• Hydrogens: toggles the display of hydrogen atoms in the 3D crystal diagram.
• Labels: labels all atoms in the 3D crystal diagram.
• Key: toggles the display of the element key box in the active window.
• Bond Colour: The colour coding mode for the 3D stick diagram. The ConQuest options of
Element, Bond Type, Fragment and Residue are included. The Fragment button is greyed out if
no FGN file or FGD files are located.
4.5 3D Molecule Manipulation
• The 3D representation of the molecule can be manipulated using the buttons in the bottom-right
section of the ASER viewer menu. Manipulation does not require the 3D representation to be in
the main window.
• Molecule Rotation: there are 6 rotation buttons for the independent rotation about each of the
three axes. The rotation increment is displayed above, in a text field. The value can be
changed by the -/+ keys, which will increment the current value by 1.0. Alternatively, the user
can type directly into the field. Values between 0.0 and 180.0 are permitted.
• Molecule Translation: the translation buttons are analogous to the rotation buttons. The
translation increment is 0.1, with limits of 0.0 and 2.0.
Vista User Guide
21
4.6 Miscellaneous
• Refresh: refreshes the display
• Help: launches the Help pop-up menu (see Section 8, page 30).
• Reset: resets the 3D view to the least squares projection.
22
Vista User Guide
5
CORRELATION/COVARIANCE SPREADSHEET
• Further details of how to perform a correlation/covariance analysis are provided (see Section
2.7, page 4).
• This menu displays both the correlation and the covariance matrices. As they are both
symmetrical about the diagonal, they can be displayed simultaneously.
• The covariance values have yellow cells and the correlation values have white cells.
• To assist the analysis, the correlation figures which are considered to be significant are colour
coded. There are two levels of significance. By default these values are 0.6 (blue) and 0.8 (pink).
• The colour code bar at the bottom displays the two values in text fields. Both of these text fields
are editable. Hitting RETURN or selecting the re-compute button will instruct the routine to read
the value and re-colour the cells accordingly.
• If the values entered are incorrect the old values are retained. Correct values will satisfy the
criteria 0.0 <= blue <= pink <= 1.0.
• Information on statistical functions is provided (see Section 9, page 31).
Vista User Guide
23
6
VIEW QUEST FRAGMENT
• The thumbnail diagram of the ConQuest search fragment located in the spreadsheet window can
be expanded and viewed in more detail by either clicking on the diagram, or by selecting View
Quest Fragment (see Section 2.8, page 5). Both of these actions will start the Fragment View
window provided that a .FGD file is present for that particular problem name (.FGD = fragment
definition file). There are a variety of features present in the Fragment View window and these
are described in more detail below.
6.1 Parameter Summary
• All of the parameters appear in a scrolling list to the right of the window.
• One of the parameters is highlighted. Generally the highlighted parameter will be the first one in
the list (NFRAG). However, if parameters were already selected in the spreadsheet, then one of
these will be highlighted in the parameter list. The highlighted parameter in this case is the one
which was selected last in the spreadsheet.
• Parameters can be selected from the list by clicking on them. This action will display the
information pertinent to that particular parameter. Highlighting parameters in the parameter list
does not affect which are the selected parameters in the spreadsheet.
• Beneath the scrolling list of parameters a summary of statistics for the currently highlighted
parameter is given.
• No.: the parameter number.
• Name: the parameter name as defined in ConQuest or as re-defined in Vista.
• Type: the type of parameter. String, Integer, Real, Distance, Angle, Transform etc.
24
Vista User Guide
• Minimum: this is the minimum value of the parameter across the whole data-set. This includes
any suppressed entries.
• Maximum: this is the maximum value of the parameter across the whole data-set. This
includes any suppressed entries.
• Range: essentially the minimum-maximum range. In the case of circular statistics though
there is a different interpretation.
• Mean: linear or circular mean.
• Mean S.D.: mean standard deviation.
• Sample S.D.: sample standard deviation.
• Rbar: specific to circular statistics.
• If the parameter distribution is described by circular statistics there will be a footnote in red.
Further details given (see Section 9, page 31).
6.2 Fragment Display
• There are three display modes for fragment rendering. The display mode can be changed using
the check boxes found next to the display mode names in the bottom left of this window.
• Atom Numbering: labels the atoms of the ConQuest fragment using the numbering scheme
present in the fragment definition file.
• Parameter Highlight: will colour in pink the atoms (and bonds) involved in the parameter
definition, if the parameter is a distance, angle or torsion angle. Only one parameter can be
viewed in this fashion at any one time.
• Colour Code Atoms: toggles colouring by element of the atoms in the fragment, with special
groups coloured in pink. When disabled all atoms and groups will appear in white
6.3 Miscellaneous
• Help: Launches the Help window (see Section 8, page 30).
• Refresh: refreshes the current window.
Vista User Guide
25
7
POSTSCRIPT EDITOR
• It is possible to save PostScript output with Vista. This is accomplished using the PostScript
Editor menu.
• The Editor window carries options for saving files, adding/removing text to the plots, and
selecting colours for both plot and background items. It is not possible to alter the plot itself
using the PostScript Editor (e.g. replot using different parameters, transpose the axes, alter
symbol/text sizes) and this must be done in the Plot menu prior to entering the PostScript Editor.
• The options available to the user for customizing the PostScript plot are gathered on the right
hand side of the Editor window. Most of these, familiar to users of Vista 1.0, are described in
detail below.
7.1 Save PS file
• Selecting Save PS launches the Save Postscript File pop-up menu. The filename to which the
postscript output is to be written can be specified here.
26
Vista User Guide
7.2 Properties
• The Page Properties pop-up menu contains various options for selecting how the PostScript file
is to be defined (and printed).
• Print Mode whether the plot is to printed in colour or monochrome depends on which of the
radio buttons is selected here. Default is to print colour.
• Orientation: allows the user to select between Landscape and Portrait plot orientations. The
default is landscape.
• Centring: the plot can either be centred at the page origin position, or in the centre of the page.
The default option is in the centre of the page.
• Scale: the size of the plot can be scaled. Use Page Preview to determine the required size for
the page.
• In addition there is a toggle switch (EPSF) which makes the postscript output encapsulated or
not. The default option is for the encapsulated postscript option to be on.
7.3 Preview
• The Page Preview pop-up allows the user to view their plot as it would appear on paper. The text
is actually replaced with dotted lines as the text itself is not infinitely scalable.
Vista User Guide
27
• Select Done to end Page Preview.
7.4 Customizing Tools
• There are a number of options available to the user for customizing the plot before producing the
final postscript output. These are essentially collected in the Customizing Tools box.
• The arrow symbol represents the tool available for selecting objects on the plot. This is used in
conjunction with the Group and Single buttons to select groups of like items (e.g. all grid lines,
all plot objects, all analysis text) or single items (e.g. just one word in the analysis summary)
respectively.
• Selected items display their "handles" and can be de-selected by clicking on them for a second
time. This is useful for removing individual selections, but if wholesale de-selection is required
then this can be acheived by clicking on the Clear Selections button.
• Currenty selected items will remain selected even when new items are chosen, and subsequent
modifications will be performed on all selected items in the display.
• Selected items can be coloured (by chosing any of the colours available in the Paint Box),
moved (using the Nudge Control functions) or deleted (by selecting the Delete button).
• Text can be edited using the middle of the three Customizing Tools buttons. Once this option is
chosen the panel at the bottom of the window prompts the user to select the text phrase to be
edited. Clicking on any text item will cause the Edit Text pop-up to appear. This menu allows
the user to edit the text, alter the text size, and adjust both the horizontal and vertical
justifications. The text size range is 40-150 pixels and up to 80 characters are allowed.
• Text can also be added by using the last of the Customizing Tool buttons, denoted by an a. If this
option is chosen the user is prompted at the bottom of the window to select a point on the display
where the new text will appear. The Add Text pop-up will then appear. This contains an empty
28
Vista User Guide
buffer in which the user can input text, and also allows the user to stipulate text size and
horizontal and vertical justification. The text size range is 10-150 pixels and up to 80 characters
are allowed.
• Restore Original will remove all edits done to the plot and return to the raw view as first
encountered upon selecting Postscript from the Plot menu (see Section 3.12, page 18).
7.5 Set Grid
• This option allows the user to define the invisible grid size upon which plot objects and text are
positioned. This is done by changing the number of pixels, with large values (up to 250)
resulting in a well-spaced grid, and small values (down to 1) giving a very fine grid.
• The user is also given the option of toggling the Snap grid on or off.
7.6 Reverse Video
• Inverts the colour scheme for the entire display including the background.
7.7 Miscellaneous
• Help: launches the Help window. Further details are provided (see Section 8, page 30).
• Refresh: refreshes the current window.
Vista User Guide
29
8
HELP
• The pop-up Help is available in all of the windows of Vista. To find out more information about
a particular button click on it and text relating to that function will appear.
• It is also possible to find out more information by typing a phrase in the text field.
30
Vista User Guide
9
REFERENCES AND NOTES
Many of the statistical routines employed in Vista are taken from the CAMAL Subroutine Library
summarized in:
• Taylor, R., J. Applied Cryst., 1986, 19, 90-91.
For further information on basic statistical terms and their calculation refer to any comprehensive
undergraduate textbook, such as:
• Snedecor, G.W. & Cochran, W.G., Statistical Methods, 1980, Iowa State University Press.
For a summary of principal component analysis see for example:
• Auf der Heyde, T.P.E., J. Chem. Educ., 1990, 67, 461-469.
• Chatfield, C. & Collins, A.J., Introduction to Multivariate Analysis, 1980, London, Chapman
and Hall.
Circular methods are used to generate descriptive statistics for torsion angles:
• Allen, F.H. & Johnson, O., Acta Cryst., 1991, B47, 62-67.
Conical correction applies specifically to D-H...A angles in H-bonded systems. For details of this see:
• Stouten, P.F.W., Van Eijck, B.P. & Kroon, J., J. Mol. Struct., 1991, 243, 61-87.
Vista User Guide
31
32
Vista User Guide