1
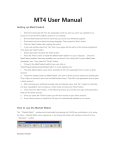
META TRADER 4
USER GUIDE
High Risk Trading Warning: FX and CFDs trading entails significant risks and is not appropriate
for all investors. The possibility of incurring substantial losses should be taken into account. It is
therefore important to understand the possible consequences of investing. Traders should weigh
their earning potential against the risks involved and act accordingly.
1
Copyright
This publication, including all photographs, illustrations and software, is protected
under international copyright laws, with all rights reserved. Neither this manual,
nor any of the material contained herein, may be reproduced without prior written
consent of the author.
© Copyright, 2015 C 7 Traders
Disclaimer
The information in this document is subject to change without notice. C 7 Traders
makes no representations or warranties with respect to the contents hereof and
specifically disclaim any implied warranties of merchantability or fitness for any
particular purpose. C 7 Traders reserves the right to revise this publication and to
make changes from time to time in the content hereof without obligation of C 7
Traders to notify any person of such revision or changes.
2
CONTENTS
Installation
Market Watch
Line, Bar And Candlestick Charts
Chart Periods
Chart Properties
Open A Position – Instant Execution and Pending Order
Close A Position – Stop Loss,Take Profit and Trailing Stop
Pending Orders
Modify Or Delete Orders
3
Here is a picture of what the MT4 main screen looks like:
Main menu (access to the program menu and settings);
Toolbars (quick access to the program features and settings);
“Market Watch” window (real-time quotes for the specified instruments);
“Navigator” window (quick access to all your accounts, indicators, expert
advisors); “Chart” window;
“Terminal” window (quick access to the trading and account history, list of open
positions and placed orders, client terminal log-file and internal mailbox).
Download the MetaTrader4 platform from the
C 7 Traders website – www.c7traders.com
4
1. Launch the Metatrader exe file the same way you launch any Windows program. It’s best if
you select to save to disk.
2. Scroll down the list to select the setup language. Then press the Next button:
3. Click the Next button after reading the notice:
5
4. In the next window check the “Yes, ...” box if you agree with the terms of the license
agreement. Then press the Next button:
5. Select data path and press the Next button:
6
6. Then use the default program group for C 7 Traders Club and press the Next Button button:
7. Press the Next button to install MetaTrader 4 on your computer:
8. Installation is in process:
7
9. Once Metatrader 4 has been installed click the “Launch C 7 Traders Club – MetaTrader 4
box. Then press the Finish button:
10. First-time C 7 Traders Club users will be prompted to fill in the application form to open a
demo account:You must click the “I agree to subscribe into your newsletters” box in order to
launch the program. Then click the Next button.
8
11. Use the default server and click Next.
12.You will see your login and password to trade on the demo account. Click Finish to gain
access to your demo account.
9
Note, that if your demo account is inactive for 90 days it is automatically deleted
by the server.
13.Your demo account platform will start up and display the following window. Click Start to
update your platform.
Then click Update and Restart to restart your platform.
10
The Market Watch Window:
The “Market Watch” window can be activated by pressing the Ctrl+M key combination, or
by using the View->Market Watch menu sequence or by clicking the
button from the
“Standard” toolbar:
Right click the mouse button on the “Market Watch” window to produce the context menu:
New Order – enables the window to open/
close a position or to place a new pending
order;
Chart Window – enables the chart of a
currency pair or CFD;
Tick Chart – shows the tick chart for the
selected instrument;
Hide – deletes the specified symbol from
the list in the “Market Watch” window;
Hide All – deletes all symbols from the list
in the “Market Watch” window which are not
used (if you have open positions or charts, its
symbols will not be deleted);
Show All – displays all available symbols in
the “Market Watch” window;
Symbols – enables the window where you
can hide/show the selected instruments;
Sets – saves/adjusts/deletes the custom
settings for the “Market Watch” window;
High/Low – shows/hides columns with
the highest and lowest prices for each
instrument;
Time – displays a column with the arrival
time of the latest quote for each instrument;
Grid - hides/unhides gridlines in the “Market
Watch” window;
Popup Prices – opens the popup window
which contains real time quotes for your
selected instruments.
11
In MetaTrader 4, you can see as many real time charts as you wish, all on one screen, for any
currency pair and for any time period. The following types of charts are available in MetaTrader
4:
Line Chart. Chart x-axis is for the different time periods (minutes, hours, days,
months etc.), and y-axis is for the price. The point on the chart shows the close price
for the period, i.e. the bid of the last quote for this period. All the sequential points are
joined by lines:
It is recommended that this chart type is used only for the short time periods (up to
5 minutes). In order to change the chart to a line chart, press the  button on the
«Charts» toolbar:
or press the Alt+3 key combination or use the Charts -> Line Chart menu
sequence.
Bar Chart. The chart is created with the use of bars. Each bar has a high (top), a
low (bottom), an opening price (left horizontal little line) and a closing price (right
horizontal little line) for the specified period of time (for example, an hour):
12
The Market Watch Window:
It is recommended that you use this chart type for periods of 5 minutes or more. In order to
change the chart to a bar chart press the
button on the “Charts” toolbar
or press the Alt+1 key combination, or use the Charts -> Bar Chart menu sequence.
Candlesticks. These charts are created in the same way as bar charts:
Candlesticks charts were very popular in the 80-90s because of their clear graphics. This
method of technical analysis is based on the correlation between both closing and opening
prices within the same trading day, and the closing price of the previous session and the
opening price of the next session.
Candlesticks have different configurations compared to bar charts. The rectangular part of the
candlestick line is called the real body. The thin vertical lines above and below the body are
called shadows. They show lows and highs within a specified period of time. Depending on
the closing and opening prices the real body can be white (empty) or black. When the body
is white, the closing price is higher than the opening level. When the body is black, the closing
price is lower than the opening level.
In order to create a candle chart press the
button on the “Charts” toolbar:
or press the Alt+2 keys simultaneously, or use the Charts -> Candlesticks menu sequence.
In MetaTrader 4 both the bar and candle high is the highest Bid price for the defined period,
the low is the lowest Bid price, the closing price is the last quoted Bid, the opening price is the
first quoted Bid.
13
In order to create a new chart for any instrument right click on the “Market Watch” window,
then select the Chart window item from the context menu:
By left clicking the mouse you can drag and drop any selected currency pair into any
open chart window.
Chart period – the period displayed in one bar or candle. For example, if you create
a 15 minute bar chart, then each bar will have the price data for the relevant 15
minutes. In MetaTrader 4 the following time periods can be used: 1, 5, 15, 30 minutes
(M1, M5, M15, M30 respectively), 1 hour (H1), 4 hours (H4), 1 day (D1), 1 week (W1)
and 1 month (MN). In order to change a time period, use the “Periodicity” toolbar:
14
Right click anywhere on the chart to produce the context menu to get access to the chart
settings:
Choose Periodicity and select a time period from the drop down menu or press the
button on the “Charts” toolbar;
Select Refresh item if an error occurs or if there are so called “gaps” on the chart. All missing
data will be uploaded from the server and will appear on the chart;
Select Grid if you wish to hide/unhide gridlines on the chart;
Select Volumes in order to show/hide tick volume (the number of quotes of any period time);
Zoom in / Zoom out will help you to modify chart measures.
You can also use the  /
buttons on the “Charts” toolbar or press the “+” and “-”
buttons;
Save as picture... will save the chart as the *.gif, or *.bmp. file;
15
Properties... (or the F8 button) enables the window where you can change chart settings, by
selecting the “Color” tab you can change the color of any element on the chart:
Other settings can be changed in the Common tab:
16
Please note the following options:
Offline chart - the chart is not being updated by new quotes. Once you open the chart
offline
(File -> Open offline) this option becomes automatic;
Chart shift – allows you to shift the chart from the right edge of the window, to see the
mostrecent candle forming.You can also press the  button on the “Charts” toolbar or
use the Charts -> Chart shift menu sequence;
Chart autoscroll - autoscrolls to the left once a new quote is received.You can also
press the
button on the “Charts” toolbar or use the Charts -> Autoscroll menu
sequence. If you are viewing the chart back a few days, and the autoscroll button is
depressed, it will automatically take you to the most recent candle forming on the next
tick of the price.
Open a position:
In order to enable the “Order” window:
right click on the “Market Watch” window or on the “Trade” tab of the “Terminal” window
and select New order from the context menu; or
press the F9 button; or
use the Tools -> New order menu sequence; or
right click on the chart window and select Trading -> New Order from the context
menu; or
double click on the currency pair in the “Market Watch” window.
The “Order” window:
17
In MetaTrader 4 there are two ways of making deals: “Instant Execution” and “Pending Order”.
Instant Execution means you do not have to request quotes, and you will enter the
market immediately. Once you have decided to buy or sell at the current price press the
Buy or Sell buttons to open a long or short position.
Before you enter the market you can change the details in the “Order” window:
Symbol - a currency pair
Volume - number of lots;
Stop Loss - the level of Stop Loss order;
Take Profit - the level of Take Profit order;
Comment - any notes (that will show up in your report)
The new position will now be listed in the “Trade” tab of the “Terminal” window.
18
Close a position:
In order to close a position, highlight the trade in the “Trade” tab of the “Terminal” window
and right click to obtain the context menu:
then select Close order. Double clicking on the open position in the “Trade” tab of the
“Terminal” window will have the same result. The “Order #” window appears and you click the
Yellow Close bar.
Place/Modify/delete Stop Loss & Take Profit Orders
Stop Loss - an order to close a previously opened position at a price less profitable for the
Customer than the price at the time of placing the order
Take Profit – an order to close a previously opened position at a price more profitable for
the Customer than the price at the time of placing the order.
If you place these types of orders you do not have to sit in front of your computer to wait for
the outcome.
19
Take Profit and Stop Loss orders will be executed automatically as soon as the price reaches
the order level (see below).You can place Stop Loss and Take Profit at the time of making a
deal filling in the “Stop Loss” and “Take Profit” fields in the “Order” window:
Afterwards in order to modify Stop Loss and Take Profit levels use the context menu:
Right click on the open position or on the pending order in the “Trade” tab of the
“Terminal” window then select Modify or delete order. The “Modify order” window
enables:
20
Fill in the “Stop Loss” and “Take profit” fields. By pressing the red button (in our example
“1.2121”) you can copy this level into the “Stop Loss” field. By pressing the blue button
(in our example “1.2096”) you can copy this level in the “Take profit” field. The value in
the “Level” field defines the difference between the order level and the current price.
Once you fill in the “Stop Loss” or/and “Take profit” fields press the red “Modify #position
number ...” button.
In order to delete Stop Loss or Take profit orders specify its level as equal to zero.
Trailing Stop: is an algorithm to manage Stop Loss orders. Once a trailing stop has been
placed (for example, trailing stop’s value is 15 pips) the following occurs:
No Stop Loss order will be placed until the open position is in a profit of at least 15 pips.
MetaTrader 4 then sends an instruction to place the Stop Loss order 15 pips higher or
lower than the current price.
Subsequently, each time the difference between the current price and the order level
exceeds 15 pips, MetaTrader 4 sends the instruction to modify the Stop Loss order to
a level 15 pips higher or lower than the current price. As a result, the Stop Loss order
becomes closer to the current price.
Important:
It is very important to note that no Stop Loss order will be placed until the market moves in
your favor as mentioned above. Therefore until this has happened, to limit losses, a separate
Stop Loss would need to be placed manually.
21
In order to place a trailing stop, highlight the open position in the “Trade” tab of the “Terminal”
window and right click to open the context menu.
22
Pending Order: is an instruction to open a position when the current price reaches the
order level.
There are four types of pending orders:
Buy Stop - an order to open a Buy position at a price higher than the price at the
moment of placing the order;
Sell Stop - an order to open a Sell position at a price lower than the price at the
moment of placing the order;
Buy Limit - an order to open a Buy position at a lower price than the price at the
moment of placing the order;
Sell Limit - an order to open a Sell position at a price higher than the price at the
moment of placing the order.
In order to enable the “Order” window:
right click on the “Market Watch” window or on the “Trade” tab of the “Terminal” window
and select New order from the context menu; or
press the F9 button; or
use the Tools -> New order menu sequence; or
right click on the chart window and select Trading -> New Order from the context
menu; or
double click on the currency pair in the “Market Watch” window.
23
Then choose the Pending order item from the drop down
The following options may be changed in this window as well:
Symbol - a currency pair;
Volume - transaction size in lots;
Stop Loss - Stop Loss order level which will be activated once the pending order has
been executed;
Take Profit - Take Profit order level which will be activated once the pending order has
been executed;
Comment - your comments for the pending order;
Type - the type of pending order: Buy Stop, Buy Limit, Sell Stop, Sell Limit;
At price - pending order level;
Expiry - if the box has not been checked the order is valid up to the time when you
cancel it or when it is executed. If the box is checked the order is valid up to the moment
specified in the box.
Once the Place order button is pressed it appears in the “Trade” tab of the
“Terminal” window.
24
In order to modify or delete a pending order highlight it in the “Terminal” window, then right
click to produce the context menu:
Select the Modify or Delete Order menu item. Press the Modify button or the Delete
button depending on your choice in the dialog window:
25
This page is intentionally left blank.
26
This page is intentionally left blank.
27
Contact Us
www.c7traders.com | Email: [email protected]
28
C 7 Traders London Ltd.
27 Old Gloucester Street, London,
WCIN, 3AX
T: +44 20 8144 8737
F: +44 20 3318 2803
C 7 Traders Singapore Pte Ltd.
100 Peck Sia Street #07-15
Downtown Oasia Hotel
Singapore 079333
T: +65 6710 7337
F: +65 6710 7376