1
– invariants (in particular ranges of variables) on the float and real number semantics,
– run-time execution errors (such as... ?),
– functional proofs both for the program (floating point semantic) and for the underlying algorithm (real
number semantic),
– test case generation (for maximal (minimal) value or error),
– sensitivity analysis.
2
Using Fluctuat
2.1
Analysis phases
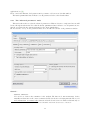
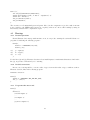
There are different phases in the use of the tool. For a given problem the user has to go through three
phases : project creation, static analysis and visualisation of the results.
A project is constituted of :
– one or several sources files (.c or .ada),
– one or several include directories (equivalent to the -I gcc option),
– some other compiling options (such as -D).
– the name of the function where the analysis starts,
This is stored internally in a project file called project.xml, which contains all the previous information.
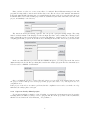
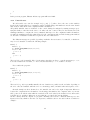
Once the project is built, the analysis phase can start. To perform the analysis, Fluctuat uses a project,
and optionally a set of parameters.
With these parameters, you can choose the behavior of the analyzer, from the precision of its computations,
to the rounding mode of your environment.
And after the analysis, Fluctuat writes all the information in the output directory. In this directory, you can
find information about values and errors of each variable. This is where the GUI retrieves the information.
Each of these phases are detailed in the following sections.
Fluctuat can be used in graphical or in batch mode. The major part of the operations done in the
graphical mode can also be achieved in batch mode. The following sections show how to use Fluctuat in
graphical mode, but Section 2.6 explains how to do the same operations in batch.
2.2
GUI (main window)
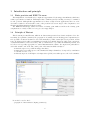
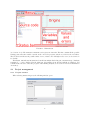
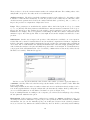
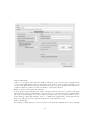
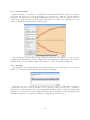
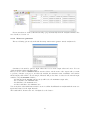
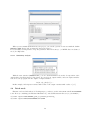
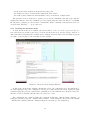
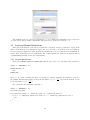
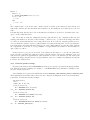
The main window (Figure 1) is divided in several parts :
– Menus, you can find all the actions of the interface in this part and some quick links,
– Source code, this part display the contents of the current file,
– Origins, each bar represents a part of the current imprecision error,
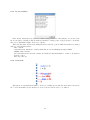
– Variables, all the variables readable at the end of the program are displayed here,
– Files, to navigate between source files,
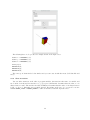
– Values and errors, the information of the selected variable,
– Status bar, to find useful information about the analysis.
All the actions (and the quick link corresponding) of the Menus bar are detailed in Appendix B.
The Source code part displays the contents of the current file. You can change the font used to display
code, see actions Small font and Big font.
Once the first analysis is done, variables of the program become underlined, and you can access a variable
(values and errors) by clicking on it on the source code, or by selecting it in the Variables part. You can
also change the current file displayed with the Files part.
If a variable is selected, the Values and errors and Origins parts display information collected by the
tool during the last analysis.
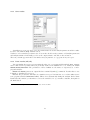
The Origins part is a representation of the error, detailed by each contribution of each line of the program
5