1
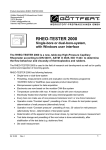
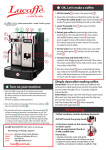
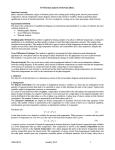
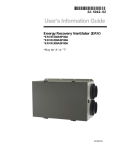
motcom loganalyser
User manual
version 1.0.5.x
Revision 08.05.2015
Kurt-Schumacher-Str. 28-30
66130 Saarbrücken, Deutschland
e-mail: [email protected]
web: www.motcomgmbh.com
motcom loganalyser
User manual
Contents
Introduction................................................................................................................. 3
I. Getting started ......................................................................................................... 4
1. Installation........................................................................................................... 4
2. Functions ............................................................................................................ 4
II. Single file analysis .................................................................................................. 6
1. BCom / BeCOMS................................................................................................ 6
1.1. Linear plot..................................................................................................... 6
1.2. Time cursor controls ..................................................................................... 7
1.3. Analysis range .............................................................................................. 8
1.4. Additional diagrams ...................................................................................... 9
2. BCom / BeCOMS with simulated alarm level .................................................... 15
3. OCom / SiCOMS............................................................................................... 16
3.1. XY diagram................................................................................................. 16
3.2. Diagram values checkboxes....................................................................... 16
3.3. Sensor number checkboxes ....................................................................... 17
3.4. Gauges and options ................................................................................... 17
III. Multiple file analysis............................................................................................. 18
IV. Online monitoring ................................................................................................ 19
V. Menu .................................................................................................................... 21
1. File .................................................................................................................... 21
2. Options.............................................................................................................. 22
Loganalyser_manual_1.0.5.x.doc
08.05.2015
Author: N. Volchek
Page 2
motcom loganalyser
User manual
Introduction
motcom loganalyser is a PC program for extended and detailed viewing of
measurement data collected by BCom and OCom systems during operation.
Both BCom and OCom systems record the engine measurement data in daily (or
hourly) logfiles on a connected PC. Reviewing and assessing this data is vital for
evaluating engine condition and planning maintenance procedures.
motcom loganalyser advanced viewing tools for logfiles give an extended sight of the
engine condition at a selected time point or time interval.
In addition to this “offline” analysis, motcom loganalyser can be used as an “online”
monitoring tool. When the application is run in online mode parallel to BCom Logger
software, it automatically registers new logfiles and detects changes in them. This
long-time overview of engine status helps to forecast possible problems and plan
necessary engine maintenance works more effectively.
Loganalyser_manual_1.0.5.x.doc
08.05.2015
Author: N. Volchek
Page 3
motcom loganalyser
User manual
I. Getting started
1. Installation
To install motcom loganalyser on a PC with Windows operating system run the
installer “motcom loganalyser_nnn.msi” where “nnn” is the version and build number
(f.i. “motcom loganalyser_1.0.5.6.msi”).
System requirements
-
Dual- or multi-core processor 2.4 GHz or higher
Min. 4GB RAM
Screen resolution 1280 x 768 dots or higher, at least 256 colors
Supported operating systems: Microsoft Windows XP, Windows 7, Windows 8.x.
Runs as a desktop application
- Internet connection is required for automatic e-mail notifications
After installation motcom loganalyser can be launched through a desktop shortcut or
through Windows program menu Start / Programs / motcom loganalyser.
2. Functions
Main program window has a common Windows-style task bar with menus and large
command buttons on the left side. These command buttons switch between the
program functional sections: single file analysis, multiple file analysis and online
monitoring.
Fig.1. Main window, single file analysis panel
Single file analysis is the default panel (the corresponding command button is
highlighted).
Loganalyser_manual_1.0.5.x.doc
08.05.2015
Author: N. Volchek
Page 4
motcom loganalyser
User manual
It has command buttons for opening BCom logfiles (also with simulated BCom alarm
level), and for OCom logfiles (Fig. 1).
Multiple file analysis panel allows to load up to 4 BCom logfiles at the same time for
comparing (chapter III.)
Fig.2. Multiple file analysis panel
Online monitoring panel has a section that displays some relevant settings, f. i.
paths to directories where logfiles are being stored, control buttons to start or stop
monitoring processes, and also contains a short status report in text form. See
chapter IV for information.
Fig.3. Online monitoring panel
Loganalyser_manual_1.0.5.x.doc
08.05.2015
Author: N. Volchek
Page 5
motcom loganalyser
User manual
II. Single file analysis
1. BCom / BeCOMS
A
B
C
D
Fig.4. BCom logfile analysis window
To open a BCom logfile for analysis, use Load button. Loading progress in percent is
displayed to the right of it. The button caption is also changed to “Cancel” during load
to allow to interrupt reading a file. This is useful in case of somewhat lengthy loading
times for large logfiles.
1.1. Linear plot
(Fig. 4, A)
The graph at the upper part of the window shows the time diagram of the linear data.
The diagram can be scrolled and zoomed in and out using command buttons on its
toolbar:
-
scroll mode
-
zoom mode
Click on x- or y-axis with the left mouse button, hold the button and move
the mouse to scroll or zoom data.
-
return to original view (to fit the complete logfile data into the diagram
window)
Loganalyser_manual_1.0.5.x.doc
08.05.2015
Author: N. Volchek
Page 6
motcom loganalyser
User manual
1.2. Time cursor controls
(Fig. 4, B)
By default, two cursors for time axis are displayed at the linear diagram in form of
vertical lines, yellow and white, with time markers besides them. They can be moved
across the diagram using the mouse pointer while the left mouse button is pressed.
The marker at the side of a cursor also displays the value of selected data channel at
selected time point. Data channels are listed at the right side of linear plot and
represent signals measured by BCom system.
Time cursor controls to the right of the diagram (Cursor 1 and Cursor 2 groups) also
move the cursors to a selected time point (hh, min, sec fields).
The first cursor of the linear plot (yellow line) can also be moved automatically from
one time point to another using the following buttons at the diagram toolbar:
-
let the first cursor run automatically in forward direction
-
run the first cursor in backward direction
-
stop the cursor movement
The logfile window view modes can be switched between full size, upper pane view
and lower pane view.
Press the
button to switch to the upper pane view:
Fig.5. BCom logfile analysis window, upper pane
and the
button to return to full size mode.
Loganalyser_manual_1.0.5.x.doc
08.05.2015
Author: N. Volchek
Page 7
motcom loganalyser
User manual
In full size mode, press the
button to switch to the lower pane view:
Fig.6. BCom logfile analysis window, lower pane
- press
button to return to full size mode.
1.3. Analysis range
(Fig. 4, C)
The horizontal bar below the linear plot is a time range indicator for additional
analysis diagrams displayed below in tabs (fig. 4, D).
Some graphs show data for a single time point (like polar diagram, p. 1.4.2 and bar
diagrams, p. 1.4.6), therefore analysis range takes the form of a single tick and
marks the position of the yellow cursor on the linear diagram:
Other diagrams work with a user-selected interval limited by one or two cursors:
bearing friction spots (p. 1.4.3) and bearing condition (p. 1.4.4). By default this
interval lays between the logfile beginning and the yellow cursor. The user can move
the white cursor to select a smaller interval between the two cursors. For these
diagrams, the thick bar at the analysis range indicator shows the selected range:
There are also diagrams that use the data from the whole logfile (bearing histograms,
p. 1.4.5 and statistics, 1.4.7), for them the thick bar always goes through the entire
indicator:
Loganalyser_manual_1.0.5.x.doc
08.05.2015
Author: N. Volchek
Page 8
motcom loganalyser
User manual
1.4. Additional diagrams
(Fig. 4, D)
Tab controls at the bottom part of the window contain the following views:
- engine and system parameters,
- polar data diagram,
- bearing friction spot graph,
- bearing condition indicators,
- histograms of friction spots maximum percentage,
- bar diagrams for cylinder thermosignal and cylinder speed difference,
- statistics diagram.
1.4.1. Parameters
Fig.7. BCom logfile analysis window (lower pane), parameters
- the tab displays engine and system parameters from the loaded logfile.
Press Log messages button to open a window with status messages extracted from
the logfile:
Fig.8. Status messages window
Loganalyser_manual_1.0.5.x.doc
08.05.2015
Author: N. Volchek
Page 9
motcom loganalyser
User manual
1.4.2. Polar diagram
Fig.9. BCom logfile analysis window, polar diagram
- displays polar data measured during the full combustion cycle nearest to the time
point selected at the linear plot (Fig. 4, A). These are:
---------
thermo voltage relative to the cycle mean value
thermo voltage in persent to alarm level
crankshaft angle acceleration
100% of thermosignal alarm level
The black radial lines (polar coordinates diagram) and vertical lines (xy-diagram)
represent the firing order of engine cylinders.
Polar data is only recorded into logfile while the engine runs while linear data is
present even when the engine is stopped.
The y-axis of polar xy-diagram can be scrolled. Put the mouse pointer on the y-axis
scale, press the left mouse button and pull the scale up or down.
Loganalyser_manual_1.0.5.x.doc
08.05.2015
Author: N. Volchek
Page 10
motcom loganalyser
User manual
1.4.3. Bearing friction spots
a
b
Fig.10. BCom logfile analysis window, bearing friction spots
- the tab displays the number of friction spot registered at the analysis range.
a:
schematic model of the crankshaft with friction spots indicator. Blue lines show
big end bearings, green lines correspond to main bearings.
If relative thermosignal value in percent of DC alarm level in polar data at a
selected time point reaches or exceeds 100%, and if it can be assigned to a
bearing, the bearing is marked with a red rectangle, and a friction spot is
registered for this bearing.
The range of polar data points assigned to a certain bearing is called cylinder
range and can be set in the Options / General window (see chapter V, p.
2.1).
If the relative thermosignal exceeds 70%, the corresponding bearing is
marked with a yellow rectangle.
b:
each bar represents the number of friction spots observed for the
corresponding bearing at the analysis range (Fig. 10 above: friction spots are
counted starting from the file beginning up to the yellow cursor).
Loganalyser_manual_1.0.5.x.doc
08.05.2015
Author: N. Volchek
Page 11
motcom loganalyser
User manual
1.4.4. Bearing condition
a
b
Fig.11. BCom logfile analysis window, bearing condition at the analysis range
- the tab represents graphically the friction spot percentage at the analysis range.
a:
schematic model of the crankshaft as described above in p. 1.4.3.
b:
each bar represents the number of registered friction spots in percent to total
polar data points at the analysis range for the corresponding bearing (Fig. 11
above: friction spot percentage is calculated between the yellow and the white
cursors).
The sliders show the maximal percentage of friction spots on a sample time
interval in the complete polar data set of the logfile. The sample time interval
can be selected in the Options / General window (chapter V, p. 2.1)
Loganalyser_manual_1.0.5.x.doc
08.05.2015
Author: N. Volchek
Page 12
motcom loganalyser
User manual
1.4.5. Bearing histograms
a
b
Fig.12. BCom logfile analysis window (lower pane), bearing histograms, time resolution 2 hours
- the bars represent friction spot maximum percentage on a sample time interval
inside time periods defined by Time resolution option for selected bearing. (The
sample time interval can be selected in the Options / General window (chapter V, p.
2.1))
Use interactive “clickable” crankshaft model ( a ) or the Bearing combo-box ( b ) to
select a big end bearing (listed by its ordinal number), or a main bearing (listed as a
string: MB1, MB2, …)
The default time resolution for large files is set to 1 or 2 hours. Changing it to a
smaller time period shows more detailed picture:
Fig.13. BCom logfile analysis window (lower pane), bearing histograms, time resolution 10 min
Loganalyser_manual_1.0.5.x.doc
08.05.2015
Author: N. Volchek
Page 13
motcom loganalyser
User manual
1.4.6. Bar diagrams
Fig.14. BCom logfile analysis window (lower pane), bar diagrams
Cylinder thermosignal difference:
The red bars show thermo signal for cylinders in percents of alarm level during the
recent full combustion cycle. The purple bars represent this value relatively to the
average thermosignal for all cylinders.
Cylinder speed difference:
The diagram shows absolute cylinder speed (blue bars) and a relative value (purple
bars) to the average speed for all cylinders during the most recent full combustion
cycle.
1.4.7. Statistics
Fig.15. BCom logfile analysis window (lower pane), statistics
Red bars here represent thermosignal average, orange bars - thermosignal standard
deviation values for every hour of engine operation.
The total thermosignal average and standard deviation for the whole logfile are
shown at the right side of the panel. Only the time when the engine runs is
considered.
Loganalyser_manual_1.0.5.x.doc
08.05.2015
Author: N. Volchek
Page 14
motcom loganalyser
User manual
2. BCom / BeCOMS with simulated alarm level
The thermosignal data of BCom logfile corresponds to DC alarm level which is set up
by two BCom system parameters: Alarm level DC, and DC alarm percent (fine
control coefficient).
In some cases it could be useful to see what impact would different alarm level
values have on the measured values and on alarm triggering.
The New simulated session menu opens a window where both DC alarm level
parameters can be changed. Pull a slider with the mouse pointer to simulate different
values:
Fig.16. “Simulate alarm level” window
Pressing OK button opens a new logfile analysis window where thermovoltage signal
is re-calculated for loaded logfile. Modified data reflects simulated alarm level:
Fig.17. BCom logfile analysis window, simulated alarm level 4
Loganalyser_manual_1.0.5.x.doc
08.05.2015
Author: N. Volchek
Page 15
motcom loganalyser
User manual
3. OCom / SiCOMS
A
B
C
D
Fig.18. OCom logfile analysis window
To open an OCom logfile for analysis, use Load button. Loading progress in percent
is displayed to the right of it.
3.1. XY diagram
(Fig. 18, A)
The graph at the upper part of the window shows the time diagram of the data
measured by OMD sensors.
The diagram can be scrolled and zoomed in and out using command buttons on its
toolbar:
-
scroll mode
-
zoom mode
Click on x- or y-axis with the left mouse button, hold the button and move
the mouse to scroll or zoom data.
-
return to original view (to fit the complete logfile data into the diagram
window)
3.2. Diagram values checkboxes
(Fig. 18, B)
The checkboxes control which OMD values should be displayed at the diagram.
Loganalyser_manual_1.0.5.x.doc
08.05.2015
Author: N. Volchek
Page 16
motcom loganalyser
User manual
3.3. Sensor number checkboxes
(Fig. 18, C)
To display measured values of a selected sensor, the corresponding checkbox
should be marked. Clear the checkbox to hide all values for this sensor.
3.4. Gauges and options
(Fig. 18, D)
Each gauge displays the current selected measurement value of the corresponding
sensor:
- digital display of measurement value shown at the corresponding gauge
Fig.19. Gauge
The OMD logfile window modes can be switched between full size and upper pane
view.
Press the
button to switch to the upper pane view, and
to return to full size mode.
Loganalyser_manual_1.0.5.x.doc
08.05.2015
Author: N. Volchek
button
Page 17
motcom loganalyser
User manual
III. Multiple file analysis
This function is used to open several (in the current version, up to 4) BCom logfiles at
the same time for comparing.
Fig.20. Multiple logfile analysis window
“Load” buttons are used for selecting BCom logfile paths and names. When the file is
selected, the button caption changes to “Delete” to allow removing or changing the
selection.
Press the “Show diagrams” button to open the analysis windows with selected
logfiles. Only the upper pane of analysis window is shown by default, but the
windows can be restored to full size.
Loganalyser_manual_1.0.5.x.doc
08.05.2015
Author: N. Volchek
Page 18
motcom loganalyser
User manual
IV. Online monitoring
Motcom loganalyser can be used for detecting long-time trends in engine condition.
This is implemented through automatic scanning of collected logfiles for the engine.
The purpose of scanning is to detect high thermosignal values in polar data which
could suggest presence of a friction spot in a bearing or other moving engine part.
Every “peak” in thermovoltage signal that exceeds 100% of DC alarm level is
counted, even if no alarm situation is detected. System status messages are also
extracted from scanned logfiles.
It is possible to use autoscanning as a one-time routine or as a monitoring task
performed regularly at a certain time interval, for instance parallel to BCom Logger.
One-time scan routine extracts information from logfiles collected over a certain time
period. Monitoring routine checks regularly for newly created logfiles and for changes
in a logfile currently being written by BCom Logger, and adds this new information to
existing autoscan results.
A
B
D
C
Fig.21. Online monitoring window
A:
Logfile autoscan frame
- shows selected logfile directories to scan, and the name of the logfile currently
being scanned, or autoscan status messages. To set up scan directories and
scan mode, use Options / Logfile autoscan options menu (chapter V, p. 2.2)
- contains control buttons and LED indicators of monitoring tasks (ON / OFF)
Loganalyser_manual_1.0.5.x.doc
08.05.2015
Author: N. Volchek
Page 19
motcom loganalyser
User manual
“Start monitoring” button – press it to start the online monitoring process. If
continuous online monitoring is not selected in options window (chapter V, p. 2.2),
the caption on the button is “Scan once”. After start, the button caption changes to
“Stop monitoring” (or “Stop scanning”).
“Send info e-mails” button – press to start the background service for regular
notification e-mails. After start, the button caption changes to “Stop sending”.
“Send alarm e-mails” button – if it is pressed, an e-mail containing short report
(“alarm e-mail”) will be sent each time when new important system messages are
detected. After start, the button caption changes to “Stop sending”.
B:
Friction spot diagram status frame
- contains “Reset diagram” button and a text field showing the time of the latest
reset for each selected directory.
If Show complete friction spot data checkbox is unchecked, only data from logfiles
starting from the latest reset point will be included in scan results. Otherwise, data
from all logfiles are shown.
To update the autoscan results after changing options, stop running scan (if any) and
press “Start monitoring” (or “Scan once”) button.
C:
Scan results field
- contains information extracted from logfiles during scan: engine operating
hours and number of system message occurrences: Main Alarm, Pre-Alarm,
etc.
D:
View diagrams button
- opens the autoscan report window.
Friction spots registered in logfiles are shown in form of cumulative diagrams in
separate windows for each scanned directory.
Fig.22. Logfile autoscan report
Loganalyser_manual_1.0.5.x.doc
08.05.2015
Author: N. Volchek
Page 20
motcom loganalyser
User manual
Each point at the x-axis represents time stamp of one logfile. The y-value of each
point is the accumulated number of high thermosignal occurrences up to the current
time stamp.
If scanning started as a monitoring task, the scan result windows will be updated
automatically.
V. Menu
1. File
1.1. File / New session
This menu item opens a new BCom / BeCOMS logfile analysis window (see chapter
II, 1).
1.2. File / New simulated session
Opens a new BCom / BeCOMS logfile analysis window with simulated DC alarm
level (see chapter II, 2).
1.3. File / New OMD session
Opens a new OCom / SiCOMS logfile analysis window (see chapter II, 3).
1.4. File / Exit
Closes the application.
Loganalyser_manual_1.0.5.x.doc
08.05.2015
Author: N. Volchek
Page 21
motcom loganalyser
User manual
2. Options
All options are only available for modifications if online monitoring process is NOT
running. Otherwise the options are read-only and greyed. Stop the online monitoring
to enable options for modification!
2.1. Options / General options
2.1.1. General
Fig.23. Options / General
Cylinder range: encoder steps for cylinder detection – this value defines how
many polar data points are related to a cylinder in BCom logfiles.
Base time interval for cylinder percent bar calculation – this is the sample time
for friction spot bars calculation at the Bearing condition tab (chapter II, p. 1.4.4) and
Bearing histograms tab (chapter II, p. 1.4.5) for BCom logfiles.
Hide test signal in polar data – the option is for test and calibration purposes.
Polar diagram options:
Scaling factor: angular signal – this value defines how angular signal looks at the
polar diagram. Selected value is multiplied with the polar signal values. If “logfile
value” option is selected, scaling factor from the BCom logfile itself is used (this is
default case).
Scaling factor: angular acceleration – the same for angular acceleration.
Press “OK” to confirm the values and close the window. “Cancel” button closes the
window and dismisses the modified values.
Loganalyser_manual_1.0.5.x.doc
08.05.2015
Author: N. Volchek
Page 22
motcom loganalyser
User manual
2.1.2. Notifications
The following settings configure automatic notification functions. Two types of
notifications are available: regular reports with status messages statistics and friction
spot diagrams, and alarm reports which contain only important system status
messages.
Regular reports can be sent once or at certain time interval. Alarm reports are only
sent if new important status messages are detected in logfiles during online
monitoring within the autoscan time interval.
Fig.24. Options / Notifications
Upload account for sending automatic notifications – user name and password
on the upload server of motcom GmbH. This account is necessary for using
automatic notification function, and can be created at customer request by motcom
GmbH administrators.
User name is entered as clear text, while password is masked with “*” signs during
input. Changing user name automatically clears password field, it is required to reenter the password.
(Important!) To save the upload account data, press “Set” button. Without this,
modified account info is ignored even at pressing “OK”.
E-mail addresses for automatic notifications – the list of e-mail addresses which
will receive automatic notifications when the corresponding service is started.
To add an e-mail to the list, press “Add…” button. A new empty entry is created in
the list with cursor blinking in it. Type the e-mail (format: [recipient name]@[mail
server]), then press Enter key or click anywhere at the list box outside the new entry
field to finish editing.
To delete an entry, click on it in the list box and press “Delete” button.
Loganalyser_manual_1.0.5.x.doc
08.05.2015
Author: N. Volchek
Page 23
motcom loganalyser
User manual
Send e-mail once – if the option is checked, a regular report will be sent immediately
on pressing “Send info e-mails” button (if there any scanned logfile information in
the “Scan results” field of the Online monitoring window (chapter IV).
Send e-mails continuously – if this option is checked, a background service for
sending regular reports at configured time interval will be started when “Send info emails” button is pressed at the Online monitoring window (chapter IV).
Time interval for sending – each time when the selected time is elapsed, a regular
report will be sent when “Send e-mails continuously” option is checked.
Send alarm e-mails – this option is to be checked to enable sending alarm reports
each time some important status messages are detected during online monitoring.
Press “OK” to confirm the values and close the window. On “Cancel” button the
window is closed without saving the modified values.
Loganalyser_manual_1.0.5.x.doc
08.05.2015
Author: N. Volchek
Page 24
motcom loganalyser
User manual
2.2. Options / Logfile autoscan options
The following window contains configuration settings for autoscan functions.
Fig.25. Logfile autoscan options window
Directories to scan – this is the list of directories that will be auto-scanned. (Up to 6
directories can be added here).
To add a directory to the list, press “Add…” button. A window for selecting a hard
disk directory is shown. Browse for a directory, click on it and press “OK” button to
add the item to the list.
To delete an entry, click on it in the list box and press “Delete” button.
A log directory must contain logfiles only for one engine. Engine name is extracted
from logfile names. If a different engine name is detected in a logfile in the same
directory, then such logfile is ignored.
Scan all logfiles once – this option should be checked for a one-time scan of
selected directories. Scanning can take a considerable amount of time when
performed for the first time.
Scan all logfiles continuously – if the option is checked, a background process is
started that checks for changes in logfiles periodically at a selected time interval and
includes detected changes in the long-time statistics.
(Important!) This option, if checked, also defines the programs’ behaviour on its
next start: the online monitoring process will be started automatically.
Loganalyser_manual_1.0.5.x.doc
08.05.2015
Author: N. Volchek
Page 25
motcom loganalyser
User manual
Time interval for scanning – the value defines how often the logfile directories will
be scanned for changes.
Delete the result file and rescan – if this option is checked, special system file that
contains autoscan results will be deleted next time before scanning. All BCom logfiles
will be re-scanned. (Otherwise existing scan results are always first read from the
system file.) This is useful when, f. i., some newer loganalyser version has different
system file format, and the program displays a warning about old autoscan file
format.
Password to stop monitoring – if it is desired to protect the online monitoring
process from accidental stop, a password can be used. The input in this text field is
masked with “*” signs.
Press “OK” to confirm the values and close the window. Press “Cancel” button to
close the window and dismiss the modified values.
Loganalyser_manual_1.0.5.x.doc
08.05.2015
Author: N. Volchek
Page 26