1
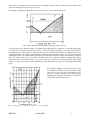
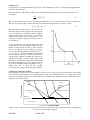
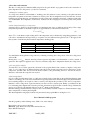
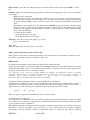
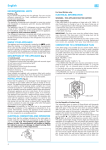
03 Thermal analysis of tin-lead alloys.
Important concepts
phase, chemical constituents, degree of freedom, phase rule, melting point, boiling point, eutectic point, eutectic
composition, eutectic temperature, phase diagram, intensive and extensive variables, chemical potential, phase
equilibrium in terms of chemical potential, Newton′s cooling law, cooling curves, mass percentage, molar fraction.
Experimental Methods:
The data for the construction of equilibrium diagrams are determined experimentally by a variety of methods, the most
common methods are:
• Metallographic Methods
• X-ray Diffraction Technique
• Thermal Analysis
Metallographic Methods This method is applied by heating samples of an alloy to different temperatures, waiting for
equilibrium to be established, and then quickly cooling to retain their high-temperature structure. The samples then
examined microscopically. This method is difficult to apply to metals at high temperatures because the rapidly cooled
samples do not always retain their high-temperature structure, and considerable skill is then required to interpret the
observed microstructure correctly.
X-ray Diffraction Technique This method is applied by measuring the lattice dimensions and indicating the
appearance of a new phase either by the change in lattice dimension or by the appearance of a new crystal structure.
This method is very precise and very useful in determining the changes in solid solubility with temperature.
Thermal Analysis This is by far the most widely used experimental method. It relies on the information obtained
from the cooling diagrams. In this method, alloys mixed at different compositions are melted and then the temperature
of the mixture is measured at a certain time interval while cooling back to room temperature.
A cooling diagram for each mixture is constructed and the initial and final phase change temperatures are determined.
Then these temperatures are used for the construction of the phase diagrams.
1. Objective
The objective of this laboratory is to determine a portion of the tin-lead phase diagram using thermal analysis.
2. Background
The Degrees of Freedom (F) is the number of independent intensive variables (i.e. those that are independent of the
quantity of material present) that need to be specified in value to fully determine the state of the system. Typical such
variables might be temperature, pressure, or concentration.
If a system is constituted more than one phase, a single phase is immiscible to the other phases and separated from other
phases by phase boundary. In a liquid or solid state, it is not necessary for a single phase to be separated spatially, but it
can be distributed in the other phase, e.g. the oil phase in an emulsion. A phase may of course contain several chemical
constituents. The number of phases is represented in the Gibbs phase rule by P.
The Chemical Constituents are simply the distinct compounds (or elements) involved in the state equations of the
system. The number of these is represented as the components (C) of the system if there are no chemical equilibria,
stoichiometric and electroneutrality conditions to diminish the number of components.
The phase rule
F =C−P+2
(1)
in this form involves two intensive variables the pressure and temperature. When pressure is constant and the partial
pressure of components are very low (as in the case of tin-lead alloy) the phase rule is given
(1a)
F = C − P +1
A eutectic system is a mixture of chemical compounds or elements that has a single chemical composition that solidifies
at a lower temperature than any other composition. This composition is known as the eutectic composition and the
temperature is known as the eutectic temperature. On a phase diagram the point at the eutectic temperature and the
eutectic composition gives the eutectic point. The components of such a system form homogeneous liquid phase, but
the solid phase contains pure one component crystalline phases of different materials. Not all binary alloys have a
30/01/2015
hout03_2015
1
eutectic point; for example, in the silver-gold system the liquidus and the solidus both increase monotonically as the
composition changes from pure silver to pure gold.
The melting point diagram of Pb-Sb-alloys represented in Figure 1 shows eutectic behaviour.
Fig. 1. Phase diagram of a binary mixture showing eutectic behaviour.
Cooling the melt a the component A starts to crystallize at the temperature TK(a). In this case of decreasing temperature
the composition of the melt is described by the curve 1. A melt b segregates crystallites of the component B when the
temperature TK(b) is reached. The curve 2 describes the composition of the melt as a function of temperature. The curves
separating the fields of A + liquid from liquid and B + liquid from liquid are termed liquidus curves. The horizontal line
separating the fields of A + liquid and B + liquid from A + B all solid, is termed the solidus. The intersection point E of
the curves 1 and 2 is called eutectic point. The residual melt of any alloy of this type solidifies at temperature E (eutectic
temperature) like a uniform metal. At the eutectic point in this two component system, all three phases, that is liquid,
crystals of A and crystals of B, all exist in equilibrium. Note that the eutectic is the only point on the diagram where this
is true.
The real phase diagram of the tin-lead system is a bit
more difficult. It contains not only a horizontal solidus
curve, but two more, the pairs of the liquidus curves.
However, on the laboratory practice we will construct a
simplified phase diagram, which will not contain these
solidus lines, just the horizontal one.
Fig. 2. Melting point - composition diagram of a tin-lead system
30/01/2015
hout03_2015
2
Cooling curves
Cooling curves are evaluated at different compositions of Pb-Sn mixtures in order to construct phase diagram similar
to which is shown in Fig 2.
The temperature T of a Pb-Sn alloy, which is left to itself after melting, initially can be described by the Newton′s
cooling law:
dT
= −k (T − Tr )
dt
(2)
The cooling rate dT/dt is proportional to the temperature difference (T – Tr ), where Tr is the constant room temperature.
The factor k is called cooling constant. The integration in the time interval between t = 0 and t = t gives
T1 − Tr = (T0 − Tr ) ⋅ e − kt
(3)
The temperature of a Pb-Sn alloy is T0 at start and T1
after time t elapsed. If the composition is not the eutectic
one the segregation of solid Pb-Sn mixed crystallites
starts at certain temperature TL. Due to the resulting
solidification heat the cooling rate decreases, i.e., the
cooling curve exhibits a slight discontinuous course at
TL (see Figure 3).
At TE the melt has the eutectic composition and
solidifies like a pure metal. The temperature of the melt
remains constant during the time τE. The horizontal
section of cooling curve can be predicted by equation
1a. For a eutectic transformation in a binary alloy P = 3,
C = 2, and so F = 0. The temperature should remain
constant until the last drop of liquid melt has been
solidified. The completely solidified alloy decreases in
temperature according to equation 3. The k values of the
melt and the solid alloy agree almost. If TL is higher than
the melting temperature of tin, the composition of the
alloy can be determined clearly using Figure 3. If TL is
smaller than 232 °C, there are two possible
concentrations according to the melting point diagram.
Fig. 3 Temperature-time diagram of a Pb-Sn alloy
Cooling curves and phase diagram
By observing the cooling curves of several samples of an alloy across a range of compositions, the shape of the liquidus
curves and the eutectic temperature of the eutectic binary system can be determined (Figure 4). Cooling curves can be
also used to investigate all other types of transformations, for example, those within the solid state where there may be
a change in the crystal structure.
Liquidus
(a)
(b)
(c)
Liquid
Temperature
Liquidus
Liquid plus solid (β)
Liquid plus solid
(α)
Eutectic
Temperature
Solid (α + β)
Composition or Time
Figure 4: Ideal cooling curves for: (a) hypoeutectic alloy, (b) eutectic alloy and (c) hypereutectic alloy, superimposed
on a portion of a eutectic phase diagram.
30/01/2015
hout03_2015
3
3. Procedure and evaluation
The data of cooling curves at different Sn/Pb compositions are given in files. A program is used for the construction of
phase diagram from cooling curves. (see also User’s manual)
1. Finding the transition points
A cooling curve exhibits local maximum or breaking point (discontinuous course) referring to the phase transition
temperature and plateau section that is identical to eutectic point. We fit straight lines before and after the observed
breaking point, and the intercept of straight lines gives the correct value of melting point in mV or simply read the value
of local maximum. The temperature of eutectics is obtained from the averaging of several data points in the plateau
range.
2. Converting thermovoltage to temperature.
A thermocouple is applied to the measurement of temperature time curve of different tin-lead alloys. The voltage
temperature dependence of the thermocouple can be approximated by a linear function in the form
T = a + b ⋅ U therm
(4)
where U therm is the thermocouple reading and T is the temperature can be calculated by using fitting parameters a and
b. In order to determine the intercept and slope of equation 4 we use calibration data given in Table 1. We apply for the
table systems of well-known phase transition temperatures, melting points.
Equilibrium system
Ice-water
Tin
Lead
Zinc
Utherm / mV
0
From evaluation
From evaluation
From evaluation
Table 1 Calibration data
Melting point, T / oC
0
231.9
327.4
420.0
You will find the missing thermovoltage values by evaluating of heating and cooling curves of Zn and cooling curves
of Sn and Pb.
Plotting the T vs U therm. function and using a linear regression algorithm you will determine a and b constants of
equation 4. This equation is applied to the conversion of thermovoltage data to temperature taken from cooling curves.
3. Selecting folders and files
You may find a lot of folders optional in a file menu of the program. Each folder contains a complete cooling curve
series, i.e. 14 cooling curves of different tin-lead composition given in mass percentage and 2 cooling curves of pure
components. Another folder chosen from file menu contains cooling and heating curves for zinc. In the last two
characters of file name the composition is encoded.
4. Data manipulation
Choose a folder from file menu. Select a cooling curve from the folder content and use the straight line fitting program
if there is a breaking point on the curve and find the average temperature in mV units belonging to the plateau. The 95%
lead containing sample is an exception, it has no eutectic point. Repeat this procedure for the other 13 composition.
Naturally, on the cooling curves of pure tin and lead you cannot observe a eutectic point. Finally, you will have 16 data
for constructing phase diagram and 13 eutectic point data, all of them are given in terms of thermovoltage. Calculate the
average of 13 eutectic point data that will serve as the 17th datum of phase diagram.
Enter the melting point data in thermovoltage for table 1 and calculate constants of equation 4. Transform themovoltage
data to temperature. Construct phase diagram.
The data manipulation and graph construction is performed by the program Microsoft Origin ver. 3.5.
User’s Manual for SnPb program
Start the program by double clicking on the „SnPb” icon on the desktop!
Press any key and you can see the menu:
Elérési út: „path” Path of the folder where the data files are.
Please DO NOT change it!
30/01/2015
hout03_2015
4
File beolvasása: „Load data” Choosing this menu you can select a dataset. After selection press ENTER to load the
files.
Grafikon: „Graph” Choosing this menu the graphs will be visualized. In the right upper corner you can see the number
of the sample.
Főmenü: return to main menu.
Egyenesillesztés: line fitting, data reading mode. In this mode a cross-shaped cursor appears in the left upper
corner. We can move the cross by the left-right arrows. You will see the coordinates of the actual data point at
the bottom. (Pressing CTRL + arrows you can move faster.) We can read the local maximum and the plateau
values.
Determination of the breaking point: line fitting. Pressing ENTER we can place points for the linear fitting
(Place the 1st and 2nd points before the breaking point and the 3rd and 4th after it!). After placing the 4th point the
program gives the equations of the lines and the coordinates of the intersection (y coordinate in mV in the right
lower corner) automatically.
To exit this mode press ESC!
+ (on the numerical pad) : next graph
- (on the numerical pad) : previous graph
Tengelyek: „Axes” We can rescale the graphs (e.g. zoom in).
We do not use this menu.
Vége: „End”
Ki szeretne lépni? (I/N) „Would you like to exit? (Y/N)”
Sample questions and answers for the entrance quiz.
These questions are devoted for practicing and preparing to labs at home. Please note that these are samples only and
the question of the entrance quiz are not restricted to these ones!
MLT Q and A
Q1 Compare metallographic and X-ray diffraction method used for thermal analysis.
A1 Metallographic Methods for probing crystalline structure at higher temperatures. The sample is heated to the desired
temperature than quickly cooled to room temperature and structure is studied by microscope. The method fails to
produce good results as metals do not retain their structure.
X-ray diffraction is one of the most powerful technique for qualitative and quantitative analysis of crystalline
compounds. The technique provides information that cannot be obtained any other way, e.g. types and nature of
crystalline phases present, structural make-up of phases, degree of crystallinity, amount of
amorphous content, microstrain & size and orientation of crystallites.
Q2. What are the thermodynamic conditions for phase equilibrium to be established?
A2. If the intensive variables T, p and µ of system containing more than one phase are constant in time the system is at
equilibrium, i.e. the chemical potential of a component takes the same value in each phase, and it is true for all the
components. For a system containing two components A, B and two phases α, β it can be written
µAα = µAβ
and
µBα = µBβ
These two equation require the state determiners T and p to be kept constant.
Q3. Define phase and component.
A3. A single phase, P is immiscible to the other phases and separated from other phases by phase boundary. In a liquid
or solid state, it is not necessary for a single phase to be separated spatially, but it can be distributed in the other phase,
e.g. the oil phase in water as an emulsion.
The chemical constituents are simply the distinct compounds (or elements) involved in the state equations of the system.
The number of these is represented as the components (C) of the system if there are no chemical equilibria,
stoichiometric and electroneutrality conditions to diminish the number of components. The number of chemical
30/01/2015
hout03_2015
5
components in every phase is restricted by existing equilibria. Therefore the number of chemical components equal to
the number of species, S minus the number of reactions, R and the ionization equilibrium, I
C=S–R–I
Example: phosphoric acid in aqueous phase,
Equlibria:
H3PO4 = H+ + H2PO4H2PO4- = H+ + HPO42HPO42- = H+ + PO43-,
Number of reactions: 3
Species:
H2O, H+, H3PO4, H2PO4-, HPO42-, PO43Number of species:
6
C=S–R–1=6–3–1=2
The number of components are two.
Q4. Apply Gibbs phase rule and find the degree of freedom for a methanol liquid – methanol vapour closed system.
A4. The degree of freedom can be calculated using equation F = C − P + 2 . C = 1, P = 2, therefore F = 1. One variable,
either temperature or pressure can be varied without a change in number of phases.
Q5. Apply Gibbs phase rule and find the degree of freedom for a tin –lead alloy at the eutectic point at constant
pressure.
A5. One of the intensive variables is taken constant: F = C − P + 1 . We have three phases: pure crystalline lead, pure
crystalline tin and the liquid phase; the number of components are two, therefore F=0. No variable can be changed
without disappearing a phase.
Q6. Define the eutectic composition and eutectic temperature.
A6. In a system containing two or more components the lowest melting point can be found at the eutectic composition.
The melting/freezing temperature correspond to the eutectic composition is the eutectic temperature.
Q7 The eutectic composition given in Pb mass percentage is 36%. Transform this concentration into molar fraction
and mole percent of Pb. Molar masses are MSn= 118.7 g/mol, MPb= 207.2 g/mol.
A7. The molar fraction: x Pb =
n Pb
n Pb + nSn
100 g eutectic contains 36 g lead and 64 g tin. In moles: nPb =
The molar fraction: xPb =
36
64
= 0.1737 mol , nSn =
= 0.5392 mol
207.2
118.7
0.1737
= 0.244
0.1737 + 0.5392
Thus the mole percent of lead is 24,4%.
30/01/2015
hout03_2015
6