1
IDAX User's Manual
© 2009 Megger AB
2
IDAX User's Manual
Table of Contents
Foreword
0
3
Part I IDAX
1
Overview
................................................................................................................................... 3
2
................................................................................................................................... 7
Instrument Panels
3
................................................................................................................................... 9
Software Installation
4
9
Measurement...................................................................................................................................
Technique
5
...................................................................................................................................
12
Getting Started
with IDAX
6
21
IDAX System...................................................................................................................................
Control
Part II Results User Interface
25
1
...................................................................................................................................
26
Results Menus
and Commands
2
Test Browser................................................................................................................................... 63
Part III IDAX Error Messages
66
1
70
(347) Output...................................................................................................................................
voltage is not within specified limits
2
................................................................................................................................... 70
(361) Overvoltage
3
...................................................................................................................................
70
(364) Measured
capacitances don't match
4
...................................................................................................................................
70
(365) Specimen
capacitance below limit
5
...................................................................................................................................
71
(366) Specimen
capacitance above limit
6
...................................................................................................................................
71
(367) Measured
DC current > MaxDCCurrent
7
...................................................................................................................................
71
(368) Measured
hum current > MaxHumCurrent
Index
72
© 2009 Megger AB
IDAX
1
IDAX
1.1
Overview
3
IDAX is an insulation diagnostic system for investigations/analysis of dielectric materials,
normally insulators. The measurement method used is dielectric spectroscopy, i.e. measurement
of the dielectric properties of the material as a function of the frequency, and in some cases
also as a function of the voltage. By studying the dielectric material properties as functions of
frequency it is possible to make a distinction between different types of phenomena. For
example, it is possible to separate polarization loss from leakage currents.
The system applies a sinusoidal voltage with desired frequency over the sample. This voltage
will generate a current in the sample. By accurately measuring the voltage and the current, the
sample impedance can be calculated. Depending upon the actual sample model, various
parameters can be calculated from the impedance, such as capacitance, loss, resistance etc. This
procedure can then be repeated at the specified frequencies and voltage levels and even more
information on the sample can be revealed. More information can be found in the chapter
"Measurement technique".
The system is fully computerized and most of the measurements can be performed
automatically.
More technical and safety details are given in sections:
Specifications
System and accessories
Safety precautions
1.1.1
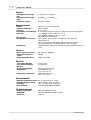
Specifications
The Insulation Diagnostic System IDAX measures the insulation impedance, at different
frequencies, for insulation materials present in high and medium voltage transmission and
distribution networks. The measurement results are used for insulation diagnosis.
The IDAX uses voltages up to 200 Vpeak (~140 V RMS). The voltage range can be increased by
adding an external high voltage unit (the high voltage unit is specified separately).
1.1.1.1
IDAX-300 Specifications
General
The Insulation Diagnostic System IDAX-300 measures the insulation impedance, at different
frequencies, for insulation materials present in high and medium voltage transmission and
distribution networks. The measurement results are used for insulation diagnosis.
The IDAX-300 uses voltages up to 200 Vpeak (~140 V RMS). The voltage range can be increased
by adding an external high voltage unit (the high voltage unit is specified separately). The
IDAX-300 is operated using an external laptop/PC.
The IDAX-300 uses a three electrode set-up, which allows for measurements of non-grounded
as well as grounded objects with and without guard.
The IDAX-300 system applies sinusoidal shaped voltages at different frequencies across the test
object and simultaneously measures the current through it. The output voltage is either taken
from a 10 Vpeak arbitrary waveform generator or from a 200 Vpeak arbitrary waveform
generator.
© 2009 Megger AB
4
IDAX User's Manual
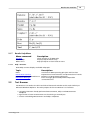
Output
Voltage/current range,
10V:
Voltage/current range,
200V:
Frequency range:
0 - 10 Vpeak, 0 - 50 mApeak
0 - 200 Vpeak, 0 - 50 mApeak
0.1 mHz - 10 kHz
Measurements
Inputs:
Capacitance Range:
Accuracy:
Dissipation Factor Range:
Accuracy:
Noise Level:
Test Modes, 2 Channels:
Calibration:
Channel 1, channel 2, ground
10 pF - 100 uF
0.5% + 1 pF
0 - 10 (with retained accuracy of capacitance; otherwise higher)
>1% +0.0003, 1 mHz - 100 Hz, C > 1 nF
>2% +0.0005, 100 Hz - 1 kHz, C > 1 nF
Max 500 uA at 50 Hz/60 Hz
UST-1, UST-2, UST-1+2, GST, GST-Guard-1, GST-Guard-2,
GST-Guard-1+2
With 2-ch measurement option additionally UST-1+UST-2,
UST-1+GST-Guard-2, UST-2+GST-Guard-1, UST-1+2+GST
Calibration box allows field calibration, recommended interval 2
years
General
Mains Input (nominal):
Power Consumption
(max):
Communication Ports:
90 - 265 V ac, 50/60 Hz
250 VA
USB 2.0 and LAN
Physical
Instrument Weight:
Case and Instrument
Weight:
Accessories Weight:
Dimensions:
Dimensions with Case:
4.9 kg/11 lbs
9.9 kg/22 lbs
8.5 kg/18 lbs (soft bag)
335 x 300 x 99 mm
17.7 x 6.3 x 16.1 in
520 x 430 x 220 mm
20.5 x 17 x 8.7 in.
Environmental
Operating Ambient Temp:
Storage Ambient Temp:
Humidity:
CE Standards:
0°C to +50°C /-32°F to +122°F
-40°C to 70°C / -40°F to +158°F
20% - 95% RH, non-condensing
IEC61010 (LVD) EN61326 (EMC)
PC Requirements
Operating System:
CPU/RAM:
Interface:
Windows 2000/ XP / Vista
Pentium 500 MHz/512 Mb or better
USB 2.0
© 2009 Megger AB
IDAX
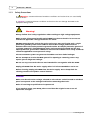
1.1.2
System and Accessories
1.1.2.1
IDAX-300 System and Accessories
IDAX-300
Cables
© 2009 Megger AB
Transport case
5
6
IDAX User's Manual
1.1.3
Safety Precautions
A"
Warning" statement denotes hazardous conditions and actions that can cause bodily
harm or death.
A "Caution!" statement denotes conditions and actions that can damage the IDAX or the
equipment being tested.
Warning!
Always follow local safety regulations when working on high voltage equipment.
Make certain all personnel working with IDAX have been trained in its correct use
and that all applicable safety precautions are taken.
BEFORE connecting this unit to the mains outlet user must verify that only a single
protective ground systems exists AND no measurable voltage potential exists
between the mains outlet protective ground and the test object protective ground. If
a voltage potential is found between mains outlet protective ground and the test
object protective ground then additional measures described in local safety standards
should be applied to ensure personal safety.
The measurement system can generate hazardous and even lethal voltages.
Do not attempt to service the IDAX yourself as opening or removing covers may
expose you to dangerous voltage.
Do not use any accessories that are not intended for use together with the IDAX.
Unplug the IDAX from the mains supply when it is left unattended or not in use.
Before cleaning, unplug the IDAX from the mains supply. Use a damp cloth for
cleaning. Do not use liquid or aerosol cleaners.
Caution!
Make sure that the mains voltage selected on the selector switch located on the back
panel corresponds to the voltage level before connecting the mains.
Refer all servicing to qualified service personnel.
If you need to return your IDAX, please use either the original crate or one of
equivalent strength.
© 2009 Megger AB
IDAX
1.2
Instrument Panels
1.2.1
IDAX-300 Front Panel
Overview
Power
a) Power ON/OFF switch
Turns unit on and off.
b) Mains connector
For connecting to mains outlet.
c) Fuse
Use small screwdriver to gently pry out
to change the fuse, F1, 2A slow blow.
Interface
d) USB Port
for connecting computer
e) ETHERNET
RJ45 connector for Ethernet connection
via twisted pair cable.
© 2009 Megger AB
7
8
IDAX User's Manual
Output
f) Enable switch
1 for activating the output of voltage.
0 for deactivating the output of voltage.
g) Generator
Generator output connector.
h) Active
Red high intensity LED. Is lit when the
output is switched on, dark when the
output is switched off.
External
i) AMPLIFIER
Connector for external amplifier
Input
j) Input 1 and Sense 1
First input channels.
k) Input 2 and Sense 2
Second input channels.
l) Protective ground
Connector for connection to station
ground.
m) Test
Test inputs.
© 2009 Megger AB
IDAX
1.3
9
Software Installation
The IDAX-206 come with the measurement and display software already installed on the
internal computer. On the IDAX-300 and if you want to use the IDAX-206 with an external PC
you have to install the software.
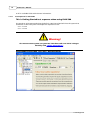
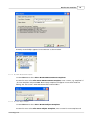
To start installing the software insert the USB memory stick and run the program IDAXInstall
XXXX.exe from it.
When first starting the IDAX software after installing it make sure the IDAX206/300 is
connected and turned on. For the IDAX-206 also check that the switch in the rear panel is set to
EXT USB. When the software starts it will look for the IDAX hardware and connect to it
automatically.
1.4
Measurement Technique
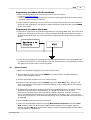
Short overview of measurement principle is given in this section.
How impedance is measured Gives basic principle of IDAX operation
Sample modeling
Describes theoretical models used for presenting measurement
results
1.4.1
How Impedance is Measured
IDAX measures impedance. By measuring the impedance at one point, i,e, at a specific
frequency and amplitude, parameters such as resistance, capacitance and loss can be calculated.
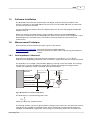
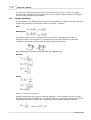
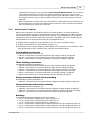
The impedance of a sample is measured by applying a voltage across the sample. This voltage
will generate a current through the sample. By accurately measuring the voltage and the
current, the impedance can be calculated, see illustration below.
Computer with
DSP-board
Sample
U
Voltage source
Z
Control voltage
I
Measured voltage
V
Voltmeter
A
Electrometer
Measured current
Fig.1. Measurement of electrical impedance.
The impedance is calculated using Ohm's law:
where Z, U and I are complex entities.
The voltage (and the current) is generated by a voltage source. There are currently two internal
voltage sources available in the IDAX system, which can deliver a maximum peak output of
10 Vpeak and 200 Vpeak, respectively. The voltage is measured by means of a voltmeter and
© 2009 Megger AB
10
IDAX User's Manual
the current is measured by an ammeter or electrometer which acts as a current-to-voltage
converter. The analogue signals (voltages) are then converted to digital samples of the signals
that are used in subsequent calculations.
1.4.2
Sample Modelling
The impedance, Z, can be presented directly or by using different impedance models. Two ways
of presenting Z directly are the polar and the rectangular, as follows:
Polar:
Rectangular:
Two simple models which are usually used in circuit analysis, although more seldom in
insulation analysis, are capacitance, C, and resistance, R. The equivalent RC circuit models
available are series and parallel models (see Fig.1) calculated as follows:
a)
b)
Fig.1. Equivalent circuit models: a) series RC circuit, b) parallel RC circuit.
Parallel:
Series:
where w = 2pf and f is frequency.
Another model, more often used in insulation diagnostics, is the complex capacitance model
describing the insulation impedance as a complex capacitance, where the imaginary part of the
capacitance represents the losses. The complex capacitance model is defined as follows:
where
© 2009 Megger AB
IDAX
11
Complex C:
The DC' is defined as the capacitance, C', with an arbitrary constant k (usually negative) added.
The aim of this parameter is to make it possible to distinguish between small changes in
capacitance in graphical presentation.
A model, very often used in insulation diagnostics, is a description of the insulation impedance
as a capacitance combined with a dissipation factor, tand, or a power factor (PF or cosj). The
capacitance, tand and cosj/PF are defined as follows:
C, PF, Tan-Delta:
If tand and cosj (PF) are small, then tand » cosj = PF (E.g. tand=0.1 corresponds to PF=0.0995)
Insulation diagnostics is based on material characterization and therefore material models are
often used. To be able to define material parameters from measured impedance Z the
geometry of the sample, described in terms of the geometrical capacitance C0, has to be
defined. In the illustration below, a vacuum (or air-filled) capacitor of defined geometry is
shown. Since no "material" is between the electrodes, the capacitance of a) is the geometrical
capacitance.
U
C0
a) I
U
e’& e’’ C
b) I
U
e’& s,r C
c) I
Material parameter models based on a geometrical capacitance C0 and material parameters.
In the above illustration b) and c) a material is inserted between the electrodes and it will
influence the current, I, flowing in the circuit. The influence of the material can be described by
different parameters using either a dielectric model or a conductive model. In the dielectric
model the "material capacitance", the permittivity, is a complex function describing both the
capacitance and the loss. Whereas in the conductive model the capacitance is described by a
permittivity and the loss by a conductivity (or resistivity). The dielectric and resistive models are
derived as follows:
© 2009 Megger AB
12
IDAX User's Manual
Dielectric:
Resistive:
If geometrical capacitance, C0, is unknown it can be set by the user by entering a permittivity
(dielectric constant), e', for the material. Entering a permittivity, e', will let the system calculate
an approximate C0 making use of the material models available. Yet, one must be aware that
the accuracy of the absolute values are limited by the accuracy of the entered permittivity. If
the geometrical capacitance is unknown and an approximate permittivity is given, the
geometrical capacitance is calculated as follows:
The impedance value, Z, used in the calculation is the first measurement point in the actual
measurement.
1.5
Getting Started with IDAX
This describes how to perform a diagnostic measurement on a specific test specimen. More
details about the software functions can be found in IDAX System Control and IDAX Results.
It is recommended to start using IDAX by going through the procedure in this section in order
to become familiar with the instrument and the software. This procedure is also a good test to
perform whenever a confirmation of the proper functioning of the instrument is required. This
test is executed using the standard equipment delivered with IDAX.
Before starting to use IDAX certain preparatory procedures must be followed.
© 2009 Megger AB
IDAX
13
Preparatory Procedure: IDAX instrument
1. Before connecting IDAX instrument power cord to the mains outlet:
§ read the safety precautions
§ connect the transparent ground lead to a protective earth (ground) close to measurement
specimen and to panel of instrument.
2. Connect IDAX instrument to a mains outlet which meets the requirements in User's Manual
and local safety regulations, and switch on IDAX instrument using the mains switch POWER
on the front panel.
Preparatory Procedure: Specimen
1. All specimen capacitances must be discharged before connecting IDAX leads. This means that
all specimen electrodes must be short circuited and grounded. The electrodes must remain
grounded until IDAX leads are connected. Below a general picture of ground connections is
shown.
2. In the case of Test Capacitor, keeping the electrodes grounded while connecting IDAX leads
is complicated. Therefore, in this particular case with Test Capacitor, it is permitted to remove
the ground connections before connecting IDAX.
1.5.1
Measurement
1. Make sure that IDAX is properly connected to mains outlet.
2. Turn on IDAX using the mains switch POWER on the front panel. The IDAX performs a
self-test and start-up procedure.
3. Activate the Results window if not active after start-up.
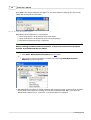
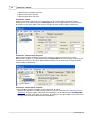
4. In Results create new object selecting Object from menu File / New. Click "Browse" and
select !!Test Capacitor.obj template and enter arbitrary name as Object Name, for example
"Test" and click OK.
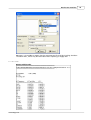
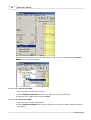
5. By default all measurement templates listed as Associated Measurement Templates will be
available for performing the measurements. It is possible to deselect one or more
measurement templates from Associated Measurement Templates. As shown in picture
below, four Measurement Templates !!C10 (GST-Guard), !!C12 (UST), !!C12, C10, C10+C12
and !!C20 (GST-Guard) are associated with the object "Test" for IDAX-206, similar procedure
as IDAX-300.
6. Fill in available fields with relevant information.
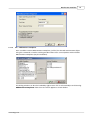
7. Create new measurement sequence selecting Measurement Sequence from menu File /
New. Arbitrary name can be entered as Measurement Sequence, for example "Getting
Started" and press OK. New measurement sequence with corresponding Measurement Plan
files will appear in Test Browser.
© 2009 Megger AB
14
IDAX User's Manual
8. Fill in available fields with relevant information.
1.5.1.1
Test Sequence for IDAX-300
This is Getting Started test sequence when using IDAX-300
The specimen to be measured using the built-in capacitance box built into the system that
terminates at the front panel. The respective capacitances are:
C10 = ~2.5 nF
C12 = ~4.7 nF
Warning!
The measurement system can generate hazardous and even lethal voltages.
Carefully read "Safety precautions".
Ungrounded Specimen Test (UST) Measurement
© 2009 Megger AB
IDAX
In Test Browser select Measurement Plan file !!C12 (UST), carefully read and follow the
instructions. Or follow the instructions below.
1. Make sure that preparation procedures (both IDAX and Specimen) have been followed.
2. Connect the output to the lower capacitance connector.
3. Connect Current 1 and Sense 1 to the top capacitance connector.
4. Remove possible ground connections from somewhere.
5. Turn on the output switch activate the output and then start the measurement.
6. Wait until measurement is finished or abort earlier by stopping the measurement.
Grounded Specimen Test (GST) Measurement
© 2009 Megger AB
15
16
IDAX User's Manual
In Test Browser select Measurement Plan file !!C10 (GST-Guard), carefully read and follow the
instructions. Alternatively, follow the instructions below.
1. Make sure that preparation procedures have been followed (see also "Ungrounded Specimen
Test (UST) Measurement").
2. Connect the generator output to the upper capacitance connector.
3. Connect Current 1 and Sense 1 to the lower capacitance connector.
4. Remove possible ground connections from the connection pins.
5. Turn on the output switch activate the output and then start the measurement.
6. Wait until measurement is finished or abort earlier by stopping the measurement.
1.5.1.2
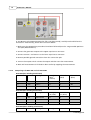
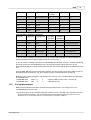
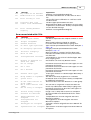
Comparing 1-ch IDAX-206 and 2-ch IDAX-300
IDAX-300 (two winding transformer)
Test no.
Measure
Configuration
Energize
(Gen,
Yellow)
Channel 1
(Red)
Channel 2
(blue)
1
CH
GST-Guard-1+2
H
L
NC
2
CHL
UST-1
H
L
NC
3
CL
GST-Guard-1+2
L
H
NC
IDAX-206 (two winding transformer)
Test no.
Measure
Configuration
Energize
(Hi, Red)
Channel 1
(Lo, Blue)
1
CH
GST-Guard
H
L
2
CHL
UST
H
L
3
CL
GST-Guard
L
H
Energize
Channel 1
IDAX-300 (three winding transformer)
Test no.
Measure
Configuration
Channel 2
© 2009 Megger AB
IDAX
(Gen,
Yellow)
(Red)
(blue)
1
CH
GST-Guard-1+2
H
L
T
2
CHL
UST-1
H
L
T
3
CL
GST-Guard-1+2
L
H
T
4
CLT
UST-2
L
H
T
5
CT
GST-Guard-1+2
T
H
L
6
CTH
UST-1
T
H
L
17
IDAX-206 (three winding transformer)
Test no.
Measure
Configuratio
n
Energize
(Hi, Red)
Channel 1
(Lo, Blue)
1
CH
GST-Guard
H
L
T shorted to L
2
CHL
UST
H
L
T shorted to tank
3
CL
GST-Guard
L
H
T shorted to H
4
CLT
UST
L
H
T shorted to tank
5
CT
GST-Guard
T
H
L shorted to H
6
CTH
UST
T
H
L shorted to tank
In case of a two winding transformer the set-up of IDAX-206 (IDA 200) and IDAX-300 are very
similar; the leads need to be moved between test 2 and test 3.
In case of a three winding transformer the IDAX-300 second input channel is utilized (standard);
the leads need to be moved between test 2 and test 3, between test 4 and test 5. If use
IDAX-206 (IDA 200) on a three winding transformer, the leads need to be moved between every
test.
If using IDAX-300 with two electrometers (option), the two set-ups using same cable set-up can
be measured simultaneously, e.g. test 1 and test 2 (test 3 and test4; test 5 and test 6).
Note that Test 6, CTH (Energize T and measure H), in many cases are replaced by CHT (Energize
H and Measure T):
· IDAX-300: CHT,
UST-2, H,
L,
T (same cable set-up as Test 1 and Test 2)
· IDAX-206: CHT,
UST,
H,
T,
L shorted to tank
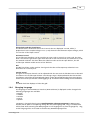
1.5.2
During Measurement
When the measurement has been started the measurement file icon changes to an icon
corresponding to the data file.
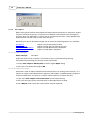
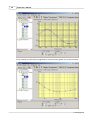
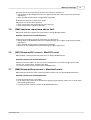
1. By pressing <F4> on the keyboard, Results window can be activated if not already active and
the measurement progress can be viewed when selecting Graph tab. The graph shows the
dissipation factor for the Test Capacitor in the frequency range 0.1 - 1000 Hz .
© 2009 Megger AB
18
IDAX User's Manual
2. By pressing <F5> on the keyboard, an oscilloscope will be displayed on the screen. The Ch 0
(red) signal in the oscilloscope displays the applied voltage over the sample, Ch 1 (white) is
the output voltage from the first electrometer and Ch 2 (blue) is the output voltage from the
second electrometer. The output voltage from the electrometer is a function of the current
through the sample.
3. The instrument stops automatically after the last measurement point is completed, however,
the measurement can be interrupted earlier by a stop command. You can press stop button
or, on the IDAX-206, the OUTPUT OFF button. On the IDAX-206 a lit green READY LED on
the front panel indicates that the measurement is stopped or finished.
© 2009 Megger AB
IDAX
1.5.3
19
Presenting Results
By default the measurement data is presented using a model defined in the measurement plan.
However, additional models can be added while inspecting the results (see Selecting Models for
details).
Depending on which parameters are of interest to the user, the measurement data can be
presented using different models. E.g. in the tand model the dissipation and/or power factor as
well as capacitance can be displayed in the graph as a function of frequency. See also how to
select models in sections "Configuration / Models" and "Sample Modelling".
The results can be viewed using three additional tabs: Graph, Table and 50/60 Hz data as
shown in pictures below.
Graph tab is active
© 2009 Megger AB
20
IDAX User's Manual
Table tab is active
50/60 Hz Data tab is active
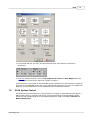
1.5.4
Selecting Models
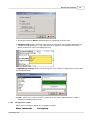
1. Select Configuration / Models in Results window and all available models will be presented
as shown below. In this picture, both the "Dielectric" and "C, PF, Tan-delta" models are
ticked. Select the desired models and click OK.
© 2009 Megger AB
IDAX
21
2. In the Graph tab you can select the desired parameters. For example, the dielectric
parameter e'.
3. In Results window menu the choices File / Export, File / Print and File / Report allow for
exporting the measurement data and creation of reports.
All measurements are stored on the IDAX 206 system hard disk or the measurement computer's
hard disk on an IDAX-300 system and can be opened and analysed at any time. For comparison
purposes, many measurements can be loaded into the same Results window.
1.6
IDAX System Control
The IDAX System Control performs a measurement according to commands pre-arranged in a
Measurement plan or command file (C-file), using programming syntax described in IDAX
Command and Variable References. The Measurement plan used is available in Results tab
Measurement plan.
© 2009 Megger AB
22
IDAX User's Manual
In addition to the IDAX System Control program window, a few more windows are accessible
from here.
Window
Results
Comments
Messages
Oscilloscope
1.6.1
Functions
Editing of measurement plans and displaying the results.
Window is activated after up-start by default
Adding comments to the actual measurement.
Displaying messages from the software during a
measurement.
Viewing the actual voltage and current curve forms.
Message Window
Messages from IDAX system to the user will be displayed in the Messages window. For example,
if a measurement was aborted prematurely by the program, the reason for it will be displayed
here.
1.6.2
Connect and Disconnect
In the File menu you have the choice to connect (if not connected) and disconnect (if
connected) to the IDAX unit. If you are not connected and the software needs to connect to the
IDAX unit it will be done automatically.
1.6.3
Oscilloscope
The Oscilloscope displays the signals present on channel 0 (white, Ch0) and channel 1 (red, Ch1)
inputs of the analogue IO unit.
© 2009 Megger AB
IDAX
23
Ch0 and Ch1 and their check boxes
The Ch0 and Ch1 check boxes select the channels that are displayed. Trace 0, white, is
proportional to the sample voltage. Trace 1, red, shows the electrometer output voltage, which
is a function of the input current.
Horizontal control
The oscilloscope time base can be set either on auto scale or manual. On auto scale, the time
base is set from the generator signal from the DSP. In the manual mode, the time base is set by
the Time/div slide bar. The time above the slide bar refers to the time per division, the full
oscilloscope window width consists of ten divisions.
Roll
The Roll check box can be used for slow signals that the oscilloscope may otherwise have
difficulties to accurately lock.
Vertical control
The gain of the input channels can be adjusted with the two vertical slide bars next to the Grid
check box at the oscilloscope window. The voltage range is displayed beside the Ch0 and Ch1
check boxes. The offset of the displayed signals can be adjusted by placing the mouse pointer
inside the oscilloscope window and dragging it up and down while holding the mouse button.
Grid
The Grid check box displays or hides the grid.
1.6.4
Changing Language
The language in which IDAX user interface (IDAX software) is displayed can be changed. The
following languages are available:
§ English
§ Swedish
§ German
§ French
§ Spanish
Language is changed selecting menu Configuration / Change Language in IDAX System
Control, which opens a file opening dialog. The selected language file, *.lng, is loaded and it
will be used after restarting the IDAX program. Each language has its own language file, *.lng,
and all language files are located in the directory D:\IDA\Language files\.
© 2009 Megger AB
24
IDAX User's Manual
In addition to IDAX interface language, the language of Measurement Templates is changed if
a translation is available. The translation files are stored in directory D:\IDA\Language files\.
1.6.5
Test Leads
The Test Leads dialog is used to select and, possible edit the settings for different cable sets.
The presets drop-down is used to select what cable set you are to use for a measurement. If the
cable set you are planning to use is not included you can use the “Add” button to add a new
preset.
The settings for a cable set can be edited. What the different settings means is explained in this
table.
1.6.6
Generator
Input 1
Input 2
Ground
R
(Ohm)
Resistance of centre
conductor
Resistance of
centre
conductor
Resistance of
centre
conductor
Resistance of
earth/ground
conductor
L
(Henry)
-----
Inductance of
input 1 cable
Inductance of
input 1 cable
Inductance of
earth/ground
cable
C12
(Farad)
Capacitance between
centre conductor and
middle shield
Cap. between
conductor and
shield
Cap. between
conductor and
shield
-----
C23
(Farad)
Capacitance between
middle shield and outer
shield
-----
-----
-----
About
In "About" window the software versions of installed IDAX system, its program components
and information about the operating system are displayed.
© 2009 Megger AB
IDAX
1.6.7
25
Calibration
The IDAX system presents its measurement results derived from measured voltage and current.
Therefore, the IDAX system should mainly be calibrated with voltage and current standards.
Calibration of the IDAX-206 system is performed using an external calibration box containing
voltage, current and impedance references. The system can be calibrated against the calibration
box every year or every 6 months. On the other hand, if the system is used and stored outside
certain temperature/moisture limits, more frequent calibration is recommended.
The system may also require more frequent calibration to compensate for exposure to
temperature gradients during measurement work, or if the calibration temperature differs too
much from the ambient temperature. Moreover, one may recommend more frequent
calibration if tighter accuracy specifications are to be met. Using the external calibration box for
calibration of the system makes it possible to always have a calibrated system which eliminates
the need to send the whole system away for calibration. The only thing that needs to be sent
away is the external calibration box. It is recommended to calibrate the box every two years.
1.6.8
Calibration Procedure IDAX-300
It is recommended to calibrate the IDAX-300 at least once a year. There are two options
regarding calibration of IDAX-300:
§ The IDAX unit can be sent to Pax for calibration
§ Calibration can be performed by the customer using the optional Calibration Set
The second option means that the IDAX instrument is available since it does not need to be sent
away for calibration. The calibration procedure is easy to perform using the optional
Calibration Set, which consists of:
§ Calibration Box
§ Calibration Software
§ Cables and connectors
§ User's Manual
The only thing that needs to be sent away is the Calibration Box and calibration of the
Calibration Box can be performed by any local accredited laboratory or testing facility handling
test and measure instruments.
2
Results User Interface
Results program is the window where all data from the measurement are displayed in a
graphical or text format. Earlier performed measurements can also be opened for comparison
purposes. Moreover, a measurement plan for the measurement to be performed can be edited
here.
Interaction with the program is done via windows and toolbar menu, the functions are
described in "Results Menus and Commands"
Results window is divided into two sections:
§ Test Browser (left-side)
§ Measurement Plan and presentation of the measurement results in graphical and table
format (right-side)
© 2009 Megger AB
26
2.1
IDAX User's Manual
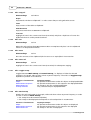
Results Menus and Commands
Windows menu
Menu
Description
File Menu
Operations with measurement objects, measurement files,
etc.
Editing and changing properties of opened measurements.
Zooming features
Selection of presentation form
Configuration of Results window settings
On-line Help
Edit Menu
Diagram Menu
View Menu
Configuration Menu
Help Menu
Icon menu
Icon menu is designed for easier navigation and operations with Test Browser.
Open measurement
Close measurement
Save
© 2009 Megger AB
Results User Interface
27
New Measurement Sequence
Toggle between Show and Hide sweep
Show/Hide Test Browser
Switch between Measurement Sequence and Measurement Plan or data file
Go one Measurement Plan or data file Down in Measurement Sequence if there are more
than one
Go one Measurement Plan or data file UP in Measurement Sequence if there are more
than one
2.1.1
2.1.1.1
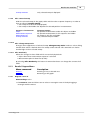
Results File Menu
Menu Command
Description
New
Add/Remove Templates
Create new objects and Measurement Sequences
Add new or remove existing Measurement templates
Open Measurement
Close Measurement
Remake Measurement
Open selected measurement(s)
Close selected measurements
Repeat a measurement
Save
Save As...
Save current template or Measurement Plan
Save the current template under a new name.
Load D-file...
Import
Export
Temporarily load a measurement file into Results
Import measurement data
Export measurement data
Print
Report
Send to...
Print short summary of measurement
Create detailed report about measurement
Send data to an external analysis program
Rename File/Folder
Delete File/Folder
Rename individual file, test sequence or object folder
Delete individual file(s), test sequence(s) or object folder(s)
Exit
Close Results program
File / New
Depending on selected file or folder in Test Browser user can create:
New Object
New Test Sequence
Create new Object is created if the object to be measured is not
among those in Test Browser
Create new Measurement Sequence for a selected Object
2.1.1.1.1 File / New / Object
New object is created if the object to be measured is not among those in Test Browser.
1. Select New / Object from File menu which opens New Object dialog
© 2009 Megger AB
28
IDAX User's Manual
2. Select appropriate object template by using Browse button and press Open
3. Enter name for the new object, for example, "Test capacitor.obj" and press OK.
© 2009 Megger AB
Results User Interface
29
4. Newly created object appears in Test Browser as shown below.
2.1.1.1.2 File / New / Measurement Template
1. From View menu select View / Browse Measurement Templates
2. From File menu select File / New / Measurement Template, enter a name, e.g. template.icf
, for new template and press Save. New empty template will appear in Text View mode for
editing. See also section "IDAX 206 Commands and Variables".
2.1.1.1.3 File / New / Object Template
1. From View menu select View / Browse Object Templates
2. From File menu select File / New / Object Template, enter a name for new template and
© 2009 Megger AB
30
IDAX User's Manual
press Save. New empty template will appear in Text View mode for editing. See also section
"IDAX 206 Commands and Variables".
2.1.1.1.4 File / New / Measurement Sequence
New Measurement Sequence is created when:
· new measurement is to be performed on new object
· new measurement is to be performed on an existing object
· individual measurement file(s) is imported
Note!
Before creating new Measurement Sequence, at least one measurement template
must be associated with the test object.
1. To create new test sequence:
· select New / Measurement Sequence from File menu
or
· right-click on chosen test object and from menu selecting New Measurement
Sequence (see picture below)
2. New Measurement Sequence will be automatically assigned a name in form of date as shown
below (date has the format according to International Standard ISO 8601). The name for
Measurement Sequence (i.e. "First Test" as in picture below) is optional.
© 2009 Megger AB
Results User Interface
2.1.1.2
31
File / Add/Remove Templates
User can add or remove Measurement Templates, (C-files) for selected measurement object
using this command. It invokes a dialog window where user can manipulate with available
Measurement Templates (see picture below).
This dialog window can be also invoked by right mouse click on selected object and choosing
Add/Remove Templates from the menu which appears as shown below.
© 2009 Megger AB
32
2.1.1.3
IDAX User's Manual
File / Open Measurement
One or more measurements can be opened by this command depending on selected item in
Test Browser.
Selected item
Single data file
Measurement Sequence
Object
2.1.1.4
Data to be opened
All sweeps in selected data file
All sweeps in all data files under selected Measurement Sequence
All sweeps in all data files in all Measurement Sequences under
selected Object
File / Close Measurement
One or more measurements can be closed by this command depending on selected item in Test
Browser.
Selected item
Single data file
Measurement Sequence
Object
2.1.1.5
Data to be closed
All sweeps in selected data file
All sweeps in all data files under selected Measurement Sequence
All sweeps in all data files in all Measurement Sequences under
selected Object
File / Remake Measurement
In cases when user is dissatisfied with a certain measurement it is possible to repeat this
measurement with the same settings using Remake Measurement as follows:
1. Connect IDAX to the test object if not connected.
2. Select the measurement file, (D-file) to be repeated (obligatory).
3. Choose Remake Measurement. It will create a Measurement Plan, (C-file) from the selected
data file, i.e. all measurement settings from this data file are copied into the new
Measurement Plan, (C-file).
4. Make corrections in Measurement Plan if needed.
5. Press ON on IDAX front panel to start the measurement.
2.1.1.6
File / Save
Save any changes made to the current template or Measurement Plan.
2.1.1.7
File / Save As
1.
Select template which is to be saved under new name.
2.
Invoke Save As dialog from menu File / Save As...
© 2009 Megger AB
Results User Interface
3.
Enter new name for the template and press OK.
Note:
2.1.1.8
33
The Object Templates are saved in Object Templates directory and Measurement
Templates under Measurement Templates directory
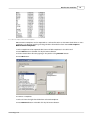
File / Load D-file
Shortcut keys: Ctrl+L
This command allows for temporary loading of single measurement files, D-files. During
loading a Temporary Object and Temporary Sequence are created as shown in picture below.
All subsequent data files are opened under the same Temporary Sequence.
The opened files can be then imported under an existing object by using File / Import File / To
Structure.
If Results program is opened as an independent program and the data files are temporary
opened, then closing Results program, user is asked if the opened files should be imported into
the existing data structure.
© 2009 Megger AB
34
2.1.1.9
IDAX User's Manual
File / Import
When sharing measurement data between different IDAX instruments or computers, Import
function facilitates the process of insertion of individual measurements into existing data
structure. Data are imported in a fashion which corresponds that they can be appropriately
imported back into the same or other data structure.
Depending on data to be imported type and structure the following options are available:
IDA Zip File
File to Structure
Measurement Templates
Object Templates
Import archived measurement data
Import selected file into existing structure
Import selected Measurement Templates
Import selected Object Templates
2.1.1.9.1 File / Import / IDA Zip File
Short-cut keys:
Ctrl+Alt+I
Import the data in from archived (*.izf) format. Data are inserted among existing
measurements preserving the structure of the archived file.
1. Choose File / Import / IDA Zip File to invoke regular Open dialog.
2. Select file to be imported and press OK.
2.1.1.9.2 File / Import / File to Structure
Command is used to import individual measurement files into existing data structure, i.e. it
requires an Object and a Measurement Sequence. New Object and Measurement Sequence
need to be defined in case there is no object and/or sequence to import the data.
1. From menu File / Import / File to Structure invoke import dialog.
2. Select the directory where measurement(s) to be imported are located.
3. Select Object under which the measurement must be imported.
© 2009 Megger AB
Results User Interface
35
4. Select the Measurement Sequence.
5. Select measurement(s) to be imported. By default all measurements located in given
directory are imported. Deselect those which not to import by unchecking appropriate check
boxes.
© 2009 Megger AB
36
IDAX User's Manual
6. Press OK button and the measurement will appear in the Test Browser.
2.1.1.9.3 File / Import / Measurement Templates
Measurement Templates can be imported from a selected location on the IDAX hard drive or
user's computer. It is done by invoking a dialog window shown below from menu File / Import
/ Measurement Templates:
1. Choose directory where template(s) to be imported are located by typing in the path
manually or using Browse button.
2. Select template(s) to be imported from available templates in the left hand side.
© 2009 Megger AB
Results User Interface
37
3. Press Add button or double click by left mouse button on chosen template.
4. Press OK button.
2.1.1.9.4 File / Import / Object Templates
Object Templates can be imported from a selected location on the IDAX hard drive or user's
computer. It is done by invoking a dialog window shown below from menu File / Import /
Object Templates:
1. Choose directory where the template(s) to be imported are located by typing in the path
manually or using Browse button.
2. Select the template(s) to be imported from available templates in the left hand side.
3. Press Add button or double click by left mouse button on chosen template.
© 2009 Megger AB
38
IDAX User's Manual
4. Press OK button.
2.1.1.10 File / Export
When sharing measurement data between different IDAX instruments or computers, Export
function facilitates the process of extraction of individual measurements or templates from
existing data structure. Data are exported in such a fashion that they can be appropriately
imported back into the same or other data structure.
Depending on objective the Export function can be used in differently:
IDA Zip File
Data
Measurement Templates
Object Templates
Export data structure to a single file
Export tab-delimited data or graph into a file
Export selected Measurement Templates
Export selected Object Templates
2.1.1.10.1 File / Export / IDA Zip File
Short-cut keys:
Ctrl+Alt+E
Export of the data in an archived (*.izf) format. By exporting data into an IDA Zip File, the data
structure is preserved. It is possible to export:
· individual measurements - Object and Measurement Sequence information are included.
· Measurement Sequences - Object information and all measurements in this sequence are
included.
· Objects - all Measurement Sequences with respective measurements are included.
2.1.1.10.2 File / Export / Data
Short-cut keys:
Ctrl+E
The "Export" command invokes an export-dialog with two different file type options, export to
a file as a graph or the measurement points:
· WMF (Windows metafile)
· TXT (Tab delimited format)
If the measurement data is exported as a TXT-file one can also select appropriate Format and
Decimal separator. The Format option allows user to remove the header of the file, which
makes it easier to import the data into another program. Decimal numbers are written in the
file using chosen Decimal separator option - point or comma.
© 2009 Megger AB
Results User Interface
Moreover, it is possible to export also the measurement file itself by checking checkbox
"Include D-File", which may be favourable when exporting to floppy disk.
2.1.1.10.3 Header
Export with header
© 2009 Megger AB
39
40
IDAX User's Manual
Export without header
2.1.1.10.4 Point/Comma
Point as a decimal separator
Comma as a decimal separator
© 2009 Megger AB
Results User Interface
41
2.1.1.10.5 File / Export / Measurement Templates
Measurement Templates can be exported to a selected location on the IDAX hard drive or user's
computer. It is done by invoking a dialog window shown below from menu File / Export /
Measurement Templates:
1. Select templates to be exported side from available templates in the left hand.
2. Press Add button or double click by left mouse button.
3. Choose destination directory typing in the path or using Browse button.
4. Press OK button.
To remove a template:
1. Select it from the right hand side from selected templates.
2. Press Remove button or double click by left mouse button.
© 2009 Megger AB
42
IDAX User's Manual
2.1.1.10.6 File / Export / ObjectTemplates
Object Templates can be exported to a selected location on the IDAX hard drive or user's
computer. It is done by invoking a dialog window shown below from menu File / Export /
Object Templates:
1. Select templates to be exported side from available templates in the left hand.
2. Press Add button or double click by left mouse button.
3. Choose destination directory typing in the path or using Browse button.
4. Press OK button.
To remove a template:
1. Select it from the right hand side from selected templates.
2. Press Remove button or double click by left mouse button.
2.1.1.11 File / Print
Shortcut keys: Ctrl+P
The Print command allows user to print out a simple report of the measurement results in a
text format.
Graph, Table or 50/60 Hz Data view
Pressing Print first invokes a special window for Print Setup, where user can compose the
appearance of the report. By checking in given options one can print out a report consisting of:
· calculated values such as equivalent current, dissipated power, power factor and
capacitance at 10 kV and at 50/60 Hz,
· table containing the data, which are selected in the Results window,
· graphical presentation of the measurement.
© 2009 Megger AB
Results User Interface
43
Test Plan view
When in Measurement Plan view and in Text View mode user can print test plan text. If not
in Text View mode, the Print command is inactive.
2.1.1.12 File / Report
Shortcut keys: Ctrl+Alt+P
This command invokes a dialog window where two report generators are available.
Report Generator
Description
List&Label
Create report using special set of drivers (only option available
when creating report on IDAX)
Create Report using features Microsoft Word text editor
(Requires MS Word application installed on computer)
MS Word
2.1.1.12.1 List&Label Report
List&Label is a set of special drivers provided for designing, viewing and printing reports.
When invoking List&Label report generator, a dialog window allows for choosing between
various options as shown in the picture below. If there are already prepared report file(s) they
will be listed in the left side of the dialog window and can be selected to work with.
© 2009 Megger AB
44
IDAX User's Manual
Menu functions
Description
New report file
Create new report file. See also separate manual for
List&Label.
Add a report to the list of available reports
Delete the selected report file
Modify in selected report file can be done. It means that
the layout, appearance, etc. can be changed. (See separate
manual for List&Label).
Preview selected report file with the users data
Print the report according to previously designed layout
from selected report file, for example, Two winding
transformer + bushings.lst
Close Report dialog
Add report
Delete
Modify
Preview
Print
Close
2.1.1.12.2 MS Word Report
MS Word report generator allows for designing, viewing and printing reports using Microsoft
Word features.
When invoking MS Word report generator, a dialog window allows for choosing between
various options as shown in the picture below. If there are already prepared report file(s) they
will be listed in the left side of the dialog window and can be selected to work with.
Menu functions
Description
New report file
Add report
Delete
Modify
Create new report file using MS Word
Add a report to the list of available reports
Delete the selected report file
Modify in selected report file can be done. It means that
the layout, appearance, etc. can be changed.
Preview selected report file with the users data. Printing is
done using MS Word print options.
Close Report dialog
Compile
Close
© 2009 Megger AB
Results User Interface
45
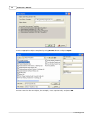
2.1.1.13 File / Send to
Shortcut keys: Ctrl+D
In addition to different data export options, the measurement data file, (D-file) can be sent to
other programs directly for further analysis. For this purpose Results are configured by
providing search path to the external program. The configuration is made from menu
Configuration / Program... where the appropriate executable file is selected in dialog box.
Now the data file loaded into Results can be sent to the chosen external program from File /
Send to... as shown below. If the configuration step has been omitted, the dialog shown above
appears and user is prompted to enter the search path at this stage.
When a executable application is selected, the name of the executable is added to the Send
to... menu as shown below, where MODS has been chosen as application where data are to be
sent.
© 2009 Megger AB
46
IDAX User's Manual
The data can also be send to selected application by right mouse click and selecting Send to ..
MODS as shown in picture below.
2.1.1.14 File / Rename File/Folder
1. Select the file or folder to be renamed
2. Choose Rename File/Folder from menu or right-click on the file or folder
3. Type new file or folder name and press Enter
2.1.1.15 File / Delete File/Folder
1. Select the file or folder to be deleted
2. Choose Delete File/Folder from menu or right-click on the file or folder. A pop-up window
will appear:
© 2009 Megger AB
Results User Interface
47
3. To confirm, select Yes and press Enter or left-click, otherwise select No.
2.1.1.16 File / Exit
Shortcut keys: Alt+F4
1. Closes Results program, without quitting IDAX System Control program. Results can be
restored by pressing F4 or selecting from menu Windows / Results in IDAX System Control
window.
2. If Results were launched as stand-alone application - File / Exit quits Results program without
saving changes.
2.1.2
Results Edit Menu
Commands for handling text and objects
Menu Command
Description
Undo
Undo last operation
Copy
Copy All
Cut
Paste
Copy object(s) or text to clipboard
Copy all selected objects or text to clipboard
Cut object(s) or text to clipboard
Paste object(s) or text from clipboard
Select All
Select all object(s) or text from Results window
Commands for handling graphical output
2.1.2.1
Menu Command
Description
Toggle Sweep
Mark Sweep
Unmark Sweep
Toggles between show and hide measurement sweep
Shows measurement sweep
Hides measurement sweep
Change Sweep Color
Changes colour appearance of measurement sweep
Edit / Undo
Shortcut keys:
Ctrl+Z
Reverse the effect of the last action performed, such as typing, deleting or formatting text, etc.
2.1.2.2
Edit / Copy
Shortcut keys:
Ctrl+C
Place a duplicate of the selected text or object(s) onto the Clipboard where it can be pasted
elsewhere.
© 2009 Megger AB
48
2.1.2.3
IDAX User's Manual
Edit / Copy All
Shortcut keys:
Ctrl+Alt+C
Graph
Copy Results window to Clipboard. i.e. make screen dump as using Alt+Print Screen.
Table
Copy content of the table to Clipboard
50/60 Hz Values
Copy measured values at 50/60 Hz to Clipboard.
Test Plan
Highlight all text in the current text frame (Text View) and place a duplicate of it onto the
Clipboard where it can be pasted elsewhere.
2.1.2.4
Edit / Cut
Shortcut keys:
Ctrl+X
Delete the selected text from Measurement Plan or Template and place it on the Clipboard
where it can be pasted elsewhere.
2.1.2.5
Edit / Paste
Shortcut keys:
Ctrl+V
Place the contents of the clipboard (the last text cut or copied) back into Test Plan.
2.1.2.6
Edit / Select All
Shortcut keys:
Ctrl+A
Highlight all text in the current text frame (Text View) for subsequent copying.
2.1.2.7
Edit / Toggle Sweep
Toggles between Mark Sweep and Unmark Sweep, i.e. displays or hides the selected
sweep(s) in the graph, table and the values at power frequency. The effect of Toggle Sweep
depends on position in Test Browser.
Position in Test Browser
Object
Measurement Sequence
Measurement file
A sweep selected
2.1.2.8
Displayed sweeps
All opened measurements under this object are displayed/hidden
All opened measurements in this sequence are displayed/hidden
All sweeps in this file are displayed/hidden
Only selected sweep is displayed/hidden
Edit / Mark Sweep
Displays the selected sweep in the graph, table and shows values at power frequency. In order
to have an effect of Mark Sweep:
· the sweeps must be unmarked (hidden)
· the sweeps to be displayed also depends on selected position in Test Browser.
Position in Test Browser
Object
Measurement sequence
Measurement file
Displayed sweeps
All opened measurements under this object are displayed
All opened measurements in this sequence are displayed
All sweeps in this file are displayed
© 2009 Megger AB
Results User Interface
A sweep selected
2.1.2.9
49
Only selected sweep is displayed
Edit / Unmark Sweep
Hides the selected sweep in the graph, table and the values at power frequency. In order to
have an effect of Unmark Sweep:
· the sweeps must be marked (displayed)
· the sweeps to be hidden also depends on selected position in Test Browser.
Position in Test Browser
Object
Measurement sequence
Measurement file
A sweep selected
Displayed sweeps
All opened measurements under this object are hidden
All opened measurements in this sequence are hidden
All sweeps in this file are hidden
Only selected sweep is hidden
2.1.2.10 Edit / Change Sweep Color
Changes colour appearance of selected sweep. Change Sweep Color invokes a colour dialog
window from which a desired colour for sweep can be selected. This command can also be
invoked right-click on selected sweep.
2.1.2.11 Edit / Read Only
Allows for changes in those fields which are read only by default:
· object data when measurement sequence is selected
· Measurement plan for data files (D-files)
By selecting Edit / Read Only this feature is removed and user can change the content of all
fields.
2.1.3
2.1.3.1
Results Diagram Menu
Menu command
Description
Zoom in
Zoom out
Zooming in into a selected area
Returning to full graph
Diagram / Zoom In
Shortcut keys: Ctrl+I
1. The Zoom In command allows user to select a rectangular area of the by dragging a
rectangle with the mouse.
© 2009 Megger AB
50
IDAX User's Manual
2. The marked area will the be magnified to cover the entire graph area as shown below.
© 2009 Megger AB
Results User Interface
2.1.3.2
51
Diagram / Zoom Out
Shortcut keys: Ctrl+O
Zoom out command fully displays all active curves similarly as turning on Autoscale in axis
settings. The axis settings in the axis settings, however, remain unchanged.
2.1.4
Results View Menu
Menu Command
Description
Browser
Show/Hide Test Browser.
Browse Object Tree
Browse Measurement Templates
Browse Object Templates
Allow to select which items are displayed Test Browser.
Show only Measurement Templates
Show only Object Templates
Information
Display information about Object, Measurement Sequence,
Measurement Plan etc.
Show graphical representation of measurements
Show table view of the measurement results
Present the values at power frequency
Graph
Table
50/60 Hz Data
2.1.4.1
Text View
Open Measurement Plan or Template programming
commands for its interface and measurement settings for
review and editing
Show Measurement Templates
Show/Hide Measurement Templates
View / Browser
Toggles between hide and show Test Browser. It may be convenient to hide it in order to
maximise the area for graphical output as well as for table and when editing measurement
plans.
2.1.4.2
View / Browse Object Tree
Displays all objects inclusive associated Measurement Templates, Measurement Sequences,
Measurement Plans, (C-files) and measurement data files, (D-files).
2.1.4.3
View / Browse Measurement Templates
Displays all available Measurement Templates and it is possible to edit any of them as well as
create new ones.
2.1.4.4
View / Browse ObjectTemplates
Displays all available Object Templates and it is possible to edit any of them as well as create
new ones.
2.1.4.5
View / Information
Measurements performed by IDAX are described in a command file, called Measurement Plan or
C-file (*.icf). This text file contains all information specific for the measurement in question, and is in
its entirety saved in the data file (*.idf) before the measurement data.
Displayed content of Information tab depends on selected place in Test Browser. There are
several possibilities:
· Object selected
· Measurement Sequence selected
© 2009 Megger AB
52
IDAX User's Manual
· Measurement Template selected
· Measurement Plan selected
· Measurement Data selected
Information - Object
Displays information about object corresponding to the chosen Object Template. Object
information can be edited using also Text view mode. The changes made here will, however,
be unique for the given object. Permanent changes must be made in Object Template(s).
Information - Measurement Sequence
Measurement Sequence displays information relevant to given measurement occasion.
Measurement Sequence can be edited using also Text view mode. The changes made here will,
however, be unique for the given Measurement Sequence only. Permanent changes must be
made in Object Template(s).
Information - Measurement Template
1. Selected Measurement Template is associated with an object
Displays the appearance of Measurement Plan for specific conditions (see also Measurement
Templates) and given object. Measurement Template(s) can be edited using also Text view
mode. The changes made here will, however, be unique for the given object only. Permanent
changes must be made in Measurement Template(s).
© 2009 Megger AB
Results User Interface
53
2. When using View / Browse Measurement Templates
Similar as above, but the changes made in Text view mode will be permanent and will have
effect when creating next new object or adding given Measurement Template to existing
object(s).
Information - Measurement Plan
Measurement Plan displays the same information as Measurement Template and can be edited
also using Text view mode. In the Text view mode appearance of the Measurement Plan view
can be specified, thus hiding irrelevant information from the user. The changes made here will,
however, be unique for the given measurement. Permanent changes must be made in
Measurement Template(s).
Information - Measurement Data
© 2009 Megger AB
54
IDAX User's Manual
Measurement Data displays the same information as Measurement Plan. The data itself is not
visible, yet can be viewed in Text mode.
Caution: The data files are Read-only and even the editing is possible after disabling Read-only
attribute, it is strongly discouraged. Any data loss or damage caused by editing of data files is
user's responsibility.
The IDAX System Control reads the Measurement Plan and each line is interpreted in
subsequent order. Normally, every variable or command is contained in a separate row.
However, multiple variables and commands can be entered in the same row if they are
separated with semicolons. When the measurement is started, current Measurement Plan is
copied to a file LastC.icf in D:\IDA catalogue, which is then read and executed by the IDAX
System Control.
2.1.4.6
View / Graph
Shortcut keys:
Ctrl+G
Displays graphical output of an ongoing measurement and/or previously made and opened
measurements. It is possible to display graphical representation of the measurements using
different parameters, i.e. loss tangent, power factor, PF, capacitance, C and others (see also
Configuration / Models).
By clicking right mouse button on a measurement point the properties of this point are shown
in Properties box in left lower corner of Results window.
© 2009 Megger AB
Results User Interface
2.1.4.7
55
View / Table
Shortcut keys: Ctrl+T
Ongoing measurement and/or previously made and opened measurements are displayed in a
text mode. In addition to measured values loss tangent, power factor, PF, capacitance, C and
others, in Table mode also hum current, DC offset and object's capacitance are shown for
specified configurations.
2.1.4.8
View / 50/60 Hz Data
Measured values
When a frequency sweep is performed, the measurements are done at certain pre-defined
frequencies. Due to possible interferences at power frequency (50 or 60 Hz) it is generally
© 2009 Megger AB
56
IDAX User's Manual
recommended to avoid this frequency. Instead, two measurements near the power frequency
are performed and the values at power frequency are obtained by interpolation.
10 kV equivalents
The 10 kV equivalents are values that are calculated from the measured values. Using low
voltage, e.g. 200 Vpeak, will result in a certain current through the sample. A linear insulating
material, such as oil and/or paper, will have the same dissipation factor and capacitance also at
a 10 kV test voltage. Therefore, it is possible to calculate the current and power at 10 kV from
the measured values.
2.1.4.9
View / Text View
Displays text behind the Measurement Plan or Template. In Text View all formatting and
measurement settings are shown for user and editing is enabled. It is also possible to view data
files (D-files), but their editing is disabled.
2.1.4.10 View / Show Measurement Templates
Shows or hides Measurement Templates associated to objects in Test Browser. Hiding templates
saves space in Test Browser, which may be recommended.
2.1.5
Results Configuration Menu
There are commands under this menu which allow user to configure output of measurement
results, display desired measured values in both graphical and text format as well as edit
measurement plan(s).
Menu command
Description
Information
Configure appearance and Template and Measurement Plan
editing tools
Configure appearance of graphical output
Configure Table view
Display values of losses and capacitance at power (network)
frequency (50 or 60 Hz)
Graph
Table
Power Frequency Data
2.1.5.1
Send to
Select an external program for data analysis
Models
Display available models for presentation of results
Configuration / Information
Editing of Measurement and Object Templates and Measurement Plans in Text View mode can
be facilitated by means of this dialog window.
© 2009 Megger AB
Results User Interface
57
1. Checking/unchecking Gutter displays/hides line numbering in the left side.
2. Advanced help enables automatic appearance of alternatives for variables. When typing a
variable name followed by "=" sign, the alternatives appear as a drop-down menu (see
below) and user can select the appropriate one.
3. Highlighting settings allows user to change the color scheme for appearance of text editor
(see example below).
4. Font... allows user to select the fonts to be used in Text view of Measurement or Object
Templates and Measurement Plan.
2.1.5.2
Configuration / Graph
Allows user to configure appearance of graphical output
Menu commands
© 2009 Megger AB
Description
58
IDAX User's Manual
Display Title
Axis
Background
Toggle ON/OFF display title
Configure Axis settings
Change background color
2.1.5.2.1 Configuration / Graph / Display Title
Toggles ON/OFF the graph title.
2.1.5.2.2 Configuration / Graph / Axis
The Axis command invokes the axis dialog window. This window allows the names, scales, grid,
prefixes, etc. on the axes to be modified. The dialog is divided into three parts:
§ Title
§ X-axis
§ Y-axis.
2.1.5.2.2.1 Autoscale
Autoscale automatically sets the scale so that all active curves are displayed in the graph.
Note!
Negative values are not possible to display in logarithmic scale.
2.1.5.2.2.2 Grid
For grid settings, three options are available:
§ None, no grid is shown.
§ Small, also called tics. Only an indication at the axis, no lines in the graph.
§ Full, all lines are displayed in the graph.
© 2009 Megger AB
Results User Interface
2.1.5.2.2.3 Label
Allows user to enter a label text for both X- and Y- axis.
2.1.5.2.2.4 Log/Lin
Makes it possible to change between logarithmic and linear scale for the X and/or Y axis.
Note!
Negative values are not possible to display in logarithmic scale.
2.1.5.2.2.5 Precision
Precision sets how many digits of the point is presented in the Graph/Table.
2.1.5.2.2.6 Prefix/Scientific
Changes between Prefix or Scientific notation in the Graph/Table.
2.1.5.2.2.7 Title
Here the title for the graph in Results can be written. If Auto is checked, the title of the
measurement will be displayed for the measurement. If more than one measurements are
© 2009 Megger AB
59
60
IDAX User's Manual
loaded in the results window, with different titles, no title will be displayed.
2.1.5.2.2.8 Unit
Units for both X- and Y- axis.
2.1.5.2.3 Configuration / Graph / Background
Shortcut keys: Ctrl+B
Using this command the background of the graph can be changed. The selected color is used on
display and in files exported in *.wmf format, however, when printing the background color is
set to white.
2.1.5.3
Configuration / Table
Allows user to choose between displaying or hiding the disturbance data when in Table mode.
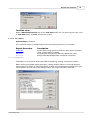
2.1.5.4
Configuration / Power Data
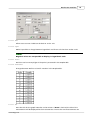
Configures display of desired values at power frequency (50 or 60 Hz). This command invokes a
dialog window shown below. The options are as follows:
1) showing either loss tangent (tand) or Power Factor (PF)
2) select power frequency
§ 50 Hz, e.g. Europe, Australia, most part of Africa and Asia
§ 60 Hz, e.g. USA, Canada, Mexico, certain countries in South America
3) showing interpolated 10 kV equivalents for current, dissipated power, Power Factor and
capacitance
© 2009 Megger AB
Results User Interface
2.1.5.5
61
Configuration / Program...
The dialog window, which appears when selecting this menu command, allow user to choose
an external application for further data analysis. This is done by providing the search path to
this program as shown below.
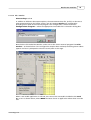
2.1.5.6
Configuration / Models...
Shortcut keys:
Ctrl+M
Command Configuration / Models... invokes a window where available models for
presentation of measurement results are shown. Different models can be selected and the
corresponding results in graphical or text format will be simultaneously displayed.
© 2009 Megger AB
62
IDAX User's Manual
Selected models appear at the bottom of Results window, where one can choose which
parameters are to be shown. Below the Dielectric and C, PF, Tan-Delta models are chosen to be
used in Results and e¢ as a parameter is displayed in the graph.
2.1.6
Impedance models
The following impedance models and their parameters are available:
© 2009 Megger AB
Results User Interface
2.1.7
2.1.7.1
63
Results Help Menu
Menu command
Description
Contents
Results Help
What's this?
Show content of all IDAX Help
Display help for Results only
Pop-up help for unclear fields or menu
Help / Contents
IDAX Help contents displays available Help topic:
2.2
Topic
Description
IDAX
Results User Interface
Command and Variable Reference
IDAX Error Messages
Overview of IDAX operating principle and functions
Preparation of measurements and presentation of results
Reference of programming directives
Error messages generated by IDAX and possible
countermeasures
Test Browser
Test Browser is located at the left hand side of the Results window and it works similarly to
Microsoft Windows Explorer. The main purpose of the Test Browser is to facilitate:
§ navigation between already performed measurements, Object and Measurement
Templates
§ organisation of new measurements on the existing or new objects
§ creation and editing Measurement and Object Templates
© 2009 Megger AB
64
2.2.1
IDAX User's Manual
Data Structure
Test Browser is arranged as a tree-like structure consisting of:
§ Objects
§ Measurement Sequences
§ Measurement Plans and data files
Objects
Each object is represented by an object template specified in a file Object.obj. This file contains
the information about the object which is constant such as owner, manufacturer, serial number,
etc. There are several pre-defined Object Templates for power transformers, bushings and
cables. Depending on user's needs these files can also be modified as well as new templates can
be created.
When creating new objects it is recommended to select Measurement Templates which can be
associated to those objects.
Measurement Sequence
Measurement Sequence is created in order to make a measurement and therefore at least one
Measurement Template must be associated with the Object.
Measurement structure
In order to perform a measurement a Measurement Sequence must be available or a new one
must be created. New sequence is created by selecting desired object and press File / New /
Measurement Sequence. This will result in:
· A dialog will appear where a test date and an optional name of Measurement Sequence
can be defined
· All Measurement Templates associated with the object will be copied to the folder of new
Measurement Sequence (inclusive the object information) as command or C-files (*.icf).
· In order to run a measurement, a command file from those under Measurement Sequence
is chosen and IDAX is started by pressing ON.
· When measurement is started, the command file is replaced by a data file containing both
information from the command file and measurement data. Finished measurement can be
© 2009 Megger AB
Results User Interface
65
repeated by selecting data file and choosing File / Remake Measurement. This will create
a new command file copy from data file, which is possible to start again. (The name of
command file will remain the same as original data file with additional number at the end,
for example xxxxx-2 or yyyy-3, where number indicates times the measurement has been
repeated.
· When measurement is finished the next command file in given Measurement Sequence can
be selected and run until the entire Measurement Sequence is done. Unwanted command
files can be deleted or simply left as they are.
2.2.2
Measurement Templates
Measurement Templates are templates which are recommended to use when performing
various measurements on power and distribution transformers, bushings and cables. The form
view of Measurement Template is pre-specified, however, can be modified to satisfy different
requirements. For information about the commands in the IDAX C file see the Commands and
Variable Reference in the program help file or included pdf manual.
In all Measurement Templates it is provided that user can choose to perform either:
1) frequency sweep down to a specified stop frequency, or
2) measurement only at power frequency (50 or 60 Hz). This last option is not available for XLPE
cable measurements and in limited extent in general measurement plans.
Two winding transformer
Available Measurement Templates are:
§ 2W-CH - measurement of insulation between high voltage winding and ground
§ 2W-CHL - measurement of insulation between high and low voltage windings
§ 2W-CL - measurement of insulation between low voltage winding and ground
Three winding transformer
Available Measurement Templates are:
§ 3W-CH - measurement of insulation between high voltage winding and ground
§ 3W-CHL - measurement of insulation between high and low voltage windings
§ 3W-CHT - measurement of insulation between high voltage and tertiary winding
§ 3W-CLT - measurement of insulation between low voltage and tertiary winding
§ 3W-CL - measurement of insulation between low voltage winding and ground
§ 3W-CT - measurement of insulation between tertiary winding and ground
Autotransformer without tertiary winding
Available Measurement Templates are:
§ 2WA-CH - measurement of insulation between high/low voltage winding and ground
Autotransformer with tertiary winding
Available Measurement Templates are:
§ 3WA-CH - measurement of insulation between high/low voltage winding and ground
§ 3WA-CHT - measurement of insulation between high/low voltage and tertiary windings
§ 3WA-CT - measurement of insulation between tertiary winding and ground
Bushings
Available Measurement Templates are (for each phase):
§ C1, H1 - measurement of bushing H1* main insulation, C1
§ C1, H2 - measurement of bushing H2 main insulation, C1
§ C1, H3 - measurement of bushing H3 main insulation, C1
§ C2, H1 - measurement of bushing H1 insulation between test tap and ground sleeve, C2
§ C2, H2 - measurement of bushing H2 insulation between test tap and ground sleeve, C2
§ C2, H3 - measurement of bushing H3 insulation between test tap and ground sleeve, C2
© 2009 Megger AB
66
IDAX User's Manual
* H1, H2 and H3 are default labels for bushings of different phases.
PILC Cables
§ PILC Cable, A - measurement of insulation of phase A*
§ PILC Cable, B - measurement of insulation of phase B
§ PILC Cable, C - measurement of insulation of phase C
* A, B and C are default labels for different phases of the cable.
XLPE Cables
§ XLPE Cable, A - measurement of insulation of phase A*
§ XLPE Cable, B - measurement of insulation of phase B
§ XLPE Cable, C - measurement of insulation of phase C
* A, B and C are default labels for different phases of the cable.
General measurements
Available Measurement Templates are:
§ General (PF Data) - generic measurement plan for measuring only at power frequency (50/60
Hz)
§ General (Sweep) - generic measurement plan for measuring of frequency sweep
§ General HV - generic measurement plan for measurements using IDA High Voltage Unit
2.2.3
Object Templates
Object Templates are templates which are recommended to use when creating new objects.
Available pre-specified templates are:
§
§
§
§
§
§
§
§
§
§
§
§
§
!!Test Capacitor
!General Specimen
Autotransformer with Tertiary + Bushings
Autotransformer with Tertiary
Autotransformer without Tertiary + Bushings
Autotransformer with Tertiary
Bushings
PILC (Paper Insulated Lead Covered) Cable
Three Winding Transformer + Bushings
Three Winding Transformer
Two Winding Transformer + Bushings
Two Winding Transformer
XLPE Cable
The form view of Object Template is pre-specified, however, it can be modified to satisfy
different requirements. For information about the commands in the IDAX C file see the
Commands and Variable Reference in the program help file or included pdf manual.
3
IDAX Error Messages
System messages
No
101
Message
Filename missing
103
104
105
Not string
Could not open file:
Could not open or create
key
Explanation
File name not specified file dialog. Specify a file
name.
A string variable is expected.
Wrong file name, file is missing or path is incorrect.
Problem accessing Windows Registry.
© 2009 Megger AB
IDAX Error Messages
No
106
107
Message
Key could not be deleted
Redeclaration of variable
108
Error writing to file
109
112
Incorrect data type
Cannot start measurement
113
Error reading Windows
registry
67
Explanation
Problem accessing Windows Registry.
A variable is declared two or more times in the C–
file.
The log file from a Calibration or a Self test could
not be created.
The Data type specified does not exist.
Displayed when IDAX is not properly set up in order
to perform a measurement. Usually accompanied by
a more detailed message.
Problem accessing Windows Registry.
Errors associated with C-file
No
201
Message
Not a complex number
202
203
204
Illegal assignment
Unknown directive
No "Data type" specified
205
No "Category" specified
206
208
Incorrect "Category"
Error on line
209
"VoltageSource" incorrect
210
211
Boolean is expected for
check box ("CB")
Not an integer
212
Not a real
213
Not a Boolean
214
Unknown "Data type"
216
217
Wrong number of arguments
Syntax error
218
To few radio buttons in
group ("RB")
Not a radio buttons item
("RB")
Not an array of integers
219
220
221
222
223
224
225
226
© 2009 Megger AB
Explanation
Variable is expected to be complex number in "X+Yi"
format.
Wrong type has been assigned to variable.
Incorrect command. Most likely a typing error.
Type must be specified before data field. Example: $
Type = 'R'
Category must be specified before data field.
Example $ Cat = 'C'
Wrong variable in category (Cat) has been used.
Indicates the number of line in C-file, where error
was detected.
"VoltageSource" has to be of a defined type. Most
likely a typing error.
Check boxes can have only Boolean values.
Parameter values must be of the same type as in the
parameter declaration.
Parameter values must be of the same type as in the
parameter declaration.
Parameter values must be of the same type as in the
parameter declaration.
"Data type" must be of a defined type. Most likely a
typing error.
Too few or too many arguments in a variable.
Undefined error in the syntax. Usually accompanied
by additional information.
There must be at least two buttons in a radio group
The function is assigned to a value that does not
match any radio button. Most likely a typing error.
Parameter values have to be of the same type as in
the parameter declaration.
Invalid bitmap "Image"
Image is not a *.bmp file or the file is corrupted.
Variable not declared
All new variables must be declared with a "New"
function.
"AmplitudeScale" not
"AmplitudeScale" must be assigned. See User's
assigned
Manual for options.
"VoltageSource" not
"VoltageSource" must be assigned. See User's
assigned
Manual for options.
"FileType" not assigned
"FileType" must be assigned. See User's Manual for
options.
"SpecVersion" not assigned "SpecVersion" must be assigned. See User's Manual
for options
68
IDAX User's Manual
No
227
228
229
Message
"DraftSpecVersion" not
assigned
"Configuration" not
assigned
Value not assigned
Explanation
"DraftSpecVersion" must be assigned. See User's
Manual for options.
"Configuration" must be assigned if using a
Termination Box with relays. See User's Manual for
options.
If cat 'P' is assigned, the field can not be left blank.
Errors related to IDAX 206 system and measurement settings
No
301
302
303
306
307
308
309
Message
Wrong argument in
"LinSweep" function
Wrong argument in
"LogSweep" function
Settings could not be
saved
No DSP device name
312
Could not open DSP
No geometric capacitance
Error initializing DSP.
DSP not present or
inactive.
Neither the file LastC.icf
nor specified file could
be found
Unknown "C-File" command
313
314
Wrong number of arguments
No "Amplitude"
315
No "Frequency"
319
No measurement to comment
320
321
No current measurement
DSP variables wrong
322
323
334
DSP code not found
Index does not exist
in NT registry
Could not interpolate
calibration data
No voltage source selected
Could not get info from
DSP
"MeasurementPerPoints"
must be greater than zero.
DSP reset failed
"Else" without "if"
"End" without "if"
Only variables or
constants are allowed
Types does not match
339
340
Error updating "D-File"
Invalid voltage
341
Invalid current
311
324
325
327
329
330
331
332
333
Explanation
Wrong number/type of argument. See User's Manual
Appendix A.6 for options
Wrong number/type of argument. See's Manual
Appendix A.6 for options.
User settings could not be saved.
The name of the DSP instrument is not valid, contact
a service supplier.
The DSP instrument did not connect properly.
The DSP instrument did not connect properly.
The C-file is not found in the system. Probably
problem with reading/writing to disc or Windows
registry.
The specified command does not exist. Most likely a
typing error.
Too few or too many arguments in a command.
"Amplitude" must be assigned. See User's Manual
Appendix A.5 for options.
"Frequency" must be assigned. See User's Manual
Appendix A.5 for options.
Comments are possible during a measurement or
directly after the measurement.
No measurement which has been started.
The DSP-variables (e.g. MinTime, MinCycles, etc.) are
wrong.
No or wrong DSP code found in the system.
Problems accessing Windows Registry.
Could not interpolate transfer functions.
A voltage source must be selected before measuring.
Problems with the connection to the DSP instrument.
One measurement at each frequency must be
performed.
Problems with the connection to the DSP instrument
Syntax error in C-file.
Syntax error in C-file.
Only variables or constants are allowed in an if–else
statement.
Wrong type of data (e.g. string assigned to an
integer).
Measured data was not properly added to the D-file.
The desired voltage is out of the specified limits.
Possible typing error in the C-file.
The applied settings results in a current that is too
© 2009 Megger AB
IDAX Error Messages
No
342
343
344
345
346
347
351
352
356
357
358
359
360
361
364
365
366
367
368
Message
Explanation
high.
Invalid frequency
The desired frequency is out of the specified limits.
Possible typing error in the C-file.
Cable parameter not found: The specified parameter was not found in the sample
cable.
Cable parameters not found No cable data was found.
"Temination box" parameter The specified parameter was not found in the
not found:
"Termination Box".
"Termination box"
No "Termination Box" data were found.
parameters not found
Output voltage is not
The applied voltage differs from the desired.
within specified levels.
"InitMeasureZ" settings:
Not possible to perform InitMeasureZ measurement.
This message is followed by one of 340-342.
No "Amplifier type"
High Voltage amplifier not selected.
selected
Electrometer Overload
Overload in Electrometer instrument during a
measurement.Measurement point is probably
inaccurate. Message also written in point property.
Error reading backplane
Problem accessing instrument backplane.
serial
Cannot find the Name
Syntax error in Calibration or Self test files.
option in file
Cannot find the Connection Syntax error in Calibration or Selftest files.
option in file
Error in file ... at
Syntax error in Calibration or Selftest files.
line ...
Overvoltage
An overvoltage occurred.
Measured capacitances
Disagreement between values of capacitance
don't match
measured for different configurations
Specimen capacitance below Measured capacitance below specified limit.
limit.
Specimen capacitance above Measured capacitance above specified limit.
limit.
Measured DC
Measured DC current exceeds limits set by
current>MaxDCCurrent
MaxDCCurrent variable.
Measured hum
Measured interference (hum) current exceeds limits
current>MaxHumCurrent
set by MaxHumCurrent variable.
Errors associated with D-file
No
400
401
403
404
405
406
407
408
409
410
411
412
413
© 2009 Megger AB
69
Message
No sweep
No points in sweep
Wrong model
Wrong parameter
Printer error:
Illegal value for x-min
Illegal value for y-min
Error: y-max is less than
y-min
Error: x-max is less than
x-min
Error: Table not exported
No information to show
Cannot read from A:\
(floppy)
Cannot read from drive
Explanation
Error in D-file syntax.
Error in D-file syntax.
Error in D-file syntax.
Error in D-file syntax.
Displays error from printer routines.
Illegal settings for axis values.
Illegal settings for axis values.
Illegal settings for axis values.
Illegal settings for axis values.
The D-file table was not exported properly.
The information dialog could not display the
information.
Results cannot read from floppy disk. Possibly
damaged floppy.
Results cannot read from specified drive.
70
3.1
IDAX User's Manual
(347) Output voltage is not within specified limits
Measured output voltage is outside specified limits.
Possible reasons and countermeasures
1) Voltage electrode, Hi, is grounded:
§ check measurement set-up and disconnect ground
§ change measurement configuration if terminal of test object cannot be disconnected from
ground
2) Voltage electrode, Hi, is connected to measuring electrode, Lo or Ground:
§ check measurement set-up and disconnect measuring or guard electrodes from the voltage
electrode. Voltage electrode, Hi, must not be connected to either measuring or guard
electrode
3) High stray capacitances to ground or high capacitance of the test object:
§ lower the highest frequency used in C-file (see also Measurement variables)
§ Lower the InitFrequency in the C-file (see also Measurement variables)
3.2
(361) Overvoltage
Measurement aborted due to overvoltage detected on measuring electrode, Lo. Potential
difference between signal ground and real ground exceeds limiting value.
Possible reasons and countermeasures
1) Ground electrode is not connected to true ground:
§ connect Ground electrode to true station/substation ground
2) Transients caused by accidentally disconnected ground connection:
§ check ground connection
3.3
(364) Measured capacitances don't match
Values of capacitance measured for different configurations, the UST, GST-Guard and
GST-Ground are in disagreement.
Possible reasons and countermeasures:
1) When performing UST measurement, measuring electrode, Lo, is connected together with
Ground electrode or Lo is connected to ground:
§ check measurement set-up and make sure that measuring electrode, Lo, is connected to a
non-grounded terminal of the test object and that Ground electrode is connected to ground
3.4
(365) Specimen capacitance below limit
Measured capacitance below limit specified in C-file by MinSpecimenC.
Possible reasons and countermeasures
1) Measured capacitance higher than 10 pF.
© 2009 Megger AB
IDAX Error Messages
71
Specimen size is very small which results in low value of capacitance:
§ change limit set by MinSpecimenC to an approximately 10% lower value than measured
capacitance
§ select another measurement configuration if possible
§
2) Measured capacitance lower than 10 pF.
Most likely no contact with specimen:
§ check connections with specimen for loose contacts
§ check measurement cables for damage
3.5
(366) Specimen capacitance above limit
Measured capacitance above limit specified in C-file by MaxSpecimenC.
Possible reasons and countermeasures
Large size of test object results in high values of capacitance:
§ change limit set by MaxSpecimenC to an approximately 10% higher value than measured
capacitance
§ select another measurement configuration if possible
§ decrease in test voltage allows for measuring at higher frequencies
3.6
(367) Measured DC current > MaxDCCurrent
Measured DC current exceeds the limits set in C-file by MaxDCCurrent.
Possible reasons and countermeasures
Features of the test object as well as certain configurations can result in high values of DC
current, use caution when analyzing the data.
§ increase the limit for DC current set by MaxDCCurrent
3.7
(368) Measured hum current > MaxHumCurrent
Measured interference or hum current exceeds the limits set in C-file by MaxHumCurrent.
Possible reasons and countermeasures
1) Level of interferences is very high:
§ try to reduce the influence of interferences by placing measuring cables close to each other
and avoiding cable loops
§ increase the limit for hum current set by MaxHumCurrent
© 2009 Megger AB
72
IDAX User's Manual
Index
-DDiagram
Zoom In 49
Zoom Out 49, 51
Directives
Emmision 3
Immunity 3
LVD 3
Mechanics 3
Dissipation factor 10
-3347
361
365
366
367
368
70
70
70
71
71
71
-E-
-550/60 Hz Data Tab
19
-AAbout 24
Autoscale 58
Axis
Autoscale 58
Grid 58
Label 59
Scale 59
Settings 58
Title 59
Unit 60
-CCalibration 25
Calibration Procedure
EM0 Calibration 25
Full Calibration 25
Capacitance
Geometrical 10
Conductivity 10
Configuration
Graph 56, 57
Information 56
Models 56, 61
Power Data 60
Power Frequency Data
Send to... 56
Table 56, 60
Current
Range 3
25
Edit
Change Sweep Color 47, 49
Copy 47
Copy All 47, 48
Cut 47, 48
Mark Sweep 47, 48
Paste 47, 48
Read Only 47, 49
Select All 47, 48
Toggle Sweep 47, 48
Undo 47
Unmark Sweep 47, 49
Equivalent Circuit
Paralell 10
Series 10
Error Messages 66
Export 38
Data 38
IDA Zip File 38
Measurement Templates 41
Object Templates 42
Point or Comma 40
TXT format 38
With or without header 39
WMF format 38
-FFile
56
Add Templates 31
Add/Remove Templates 27
Close Measurement 27, 32
Delete File/Folder 27, 46
Exit 27, 47
Export 27
Import 27
© 2009 Megger AB
Index
File
Load D-file 27, 33
New 27
New Measurement Sequence 30
New Measurement Template 29
New Object 27
New Object Template 29
Open Measurement 27, 32
Print 27, 42
Remake Measurement 27, 32
Remove Templates 31
Rename File/Folder 27, 46
Report 27, 43
Save 27, 32
Save As... 27, 32
Send To... 27, 45
Frequency
Range 3
-GGetting Started
Data File 17
Performing Measurement
Graph 57
Axis 58
Background 60
Display Title 58
Graph Tab 19
Grid 58
36
-LLabel 59
Language
Change Language 23
Lin 59
Linear scale 59
Log 59
Logarithmic scale 59
-MMaxDCCurrent 71
MaxHumCurrent 71
MaxSpecimenC 71
Measurement Templates 65
Messages
Error messages 22
Message window 22
MinSpecimenC 70
Models 20, 61
17
-H-
-N-
Header 39
Help
Contents 63
Results Help 63
What's this? 63
New 27
Measurement Sequence
Measurement Template
Object 27
Object Template 29
-IIDAX-206 System and Accessories
IDAX-206 System Control
Comments 21
Message Window 21
Oscilloscope 21
Selftest 21
Impedance
Measurement 9
Models 10
Impedance Models 62
© 2009 Megger AB
Import 34
File to Structure 34
IDA Zip File 34
Measurement Templates
Object Templates 37
Instrument Panel
Front 7
Interface 7
Output 7
5
-OObject Templates 66
Oscilloscope
Chanell checkboxes 22
Grid 22
Horizontal control 22
Roll 22
Vertical control 22
Output voltage 70
30
29
73
74
IDAX User's Manual
Overvoltage
70
-V-
-PPermittivity 10
Power factor 10
Precision 59
Prefix 59
Presenting Results
Getting Started
On screen 19
19
-RReport 43
List&Label Report 43
MSD Word Report 44
Results
Configuration Menu 56
Diagram Menu 49
Edit Menu 47
File Menu 27
Help 63
Menus and Commands 26
Test Browser 63
User Interface 25
View Menu 51
Version 24
View
10 kV Equivalents 55
50 Hz data 55
50/60 Hz Data 51
60 Hz data 55
Browse Measurement Templates 51
Browse Object Templates 51
Browse Object Tree 51
Browser 51
Graph 51, 54
Information 51
Show Measurement Templates 51, 56
Table 51, 55
Text View 51, 56
Voltage 3
Range 3
-SSafety 6
Scale 59
Scientific 59
Settings for Graph
Specifications 3
58
-TTable Tab 19
Temperature 3
Operating 3
Storage 3
Test Browser 63
Data Structure 64
Measurement Templates
Object Templates 66
65
-UUnit
60
© 2009 Megger AB